 filings.tools
Item 5. MARKET FOR REGISTRANT’S COMMON EQUITY, RELATED STOCKHOLDER MATTERS, AND ISSUER PURCHASES OF EQUITY SECURITIES
4K characters. Original on sec.gov · Markdown
Item 5. MARKET FOR REGISTRANT’S COMMON EQUITY, RELATED STOCKHOLDER MATTERS, AND ISSUER PURCHASES OF EQUITY SECURITIES
Our common stock began trading on The NASDAQ National Market under the symbol “CHRW” on October 15, 1997, and currently trades on the NASDAQ Global Select Market.
Quarterly market information can be found in Part II, Item 8. Financial Statements and Supplementary Data, Note 12.
On February 22, 2018, the closing sales price per share of our common stock as quoted on the NASDAQ Global Select Market was $90.09 per share. On February 22, 2018, there were approximately 140 holders of record and approximately 79,442 beneficial owners of our common stock.
We declared quarterly dividends during 2016 aggregating to $1.74 per share and quarterly dividends during 2017 aggregating to $1.81 per share. We have declared a quarterly dividend of $0.46 per share payable to shareholders of record as of March 2, 2018, payable on March 30, 2018. Our declaration of dividends is subject to the discretion of the Board of Directors. Any determination as to the payment of dividends will depend upon our results of operations, capital requirements and financial condition, and such other factors as the Board of Directors may deem relevant. Accordingly, there can be no assurance that the Board of Directors will declare or continue to pay dividends on the shares of common stock in the future.
The following table provides information about company purchases of common stock during the quarter ended December 31, 2017:
| Total Number of Shares Purchased (a) | Average Price Paid Per Share | Total Number of Shares Purchased as Part of Publicly Announced Plans or Programs (a) | Maximum Number of Shares That May Yet Be Purchased Under the Plans or Programs (b) | |||||||||
| October 1, 2017-October 31, 2017 | 573,266 | $ | 77.49 | 567,793 | 2,086,508 | |||||||
| November 1, 2017-November 30, 2017 | 41,124 | 80.30 | 37,307 | 2,049,201 | ||||||||
| December 1, 2017-December 31, 2017 | 58,011 | 87.60 | 57,044 | 1,992,157 | ||||||||
| Fourth quarter 2017 | 672,401 | $ | 78.53 | 662,144 | 1,992,157 |
(a) The total number of shares purchased includes: (i) 662,144 shares of common stock purchased under the authorization described below; and (ii) 10,257 shares of common stock surrendered to satisfy statutory tax withholding obligations under our stock incentive plans.
(b) In August 2013, the Board of Directors increased the number of shares authorized to be repurchased by 15,000,000 shares. As of December 31, 2017, there were 1,992,157 shares remaining for future repurchases under this authorization. Purchases can be made in the open market or in privately negotiated transactions, including Rule 10b5-1 plans and accelerated share repurchase programs.
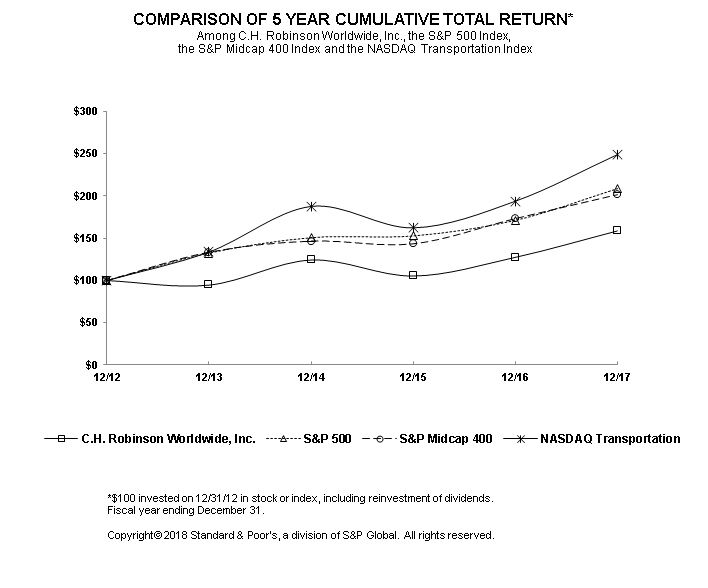
The graph below compares the cumulative 5-year total return of holders of C.H. Robinson Worldwide, Inc.’s common stock with the cumulative total returns of the S&P 500 index, the NASDAQ Transportation index, and the S&P Midcap 400 index. The graph tracks the performance of a $100 investment in our common stock and in each index (with the reinvestment of all dividends) from December 31, 2012, to December 31, 2017.
| December 31, | ||||||||||||||||||
| 2012 | 2013 | 2014 | 2015 | 2016 | 2017 | |||||||||||||
| C.H. Robinson Worldwide, Inc. | $ | 100.00 | 94.59 | 124.24 | 105.33 | 127.44 | 158.69 | |||||||||||
| S&P 500 | $ | 100.00 | 132.39 | 150.51 | 152.59 | 170.84 | 208.14 | |||||||||||
| S&P Midcap 400 | $ | 100.00 | 133.50 | 146.54 | 143.35 | 173.08 | 201.20 | |||||||||||
| NASDAQ Transportation | $ | 100.00 | 133.76 | 187.65 | 162.30 | 193.79 | 248.92 |
The stock price performance included in this graph is not necessarily indicative of future stock price performance.
Previous: Item 4. MINE SAFETY DISCLOSURES · Next: Item 6. SELECTED FINANCIAL DATA