 filings.tools
Ciena 10-K 2023-10-28
Filed 2023-12-15. 23 sections, 584K characters. Original on sec.gov · Markdown · JSON
Cover and table of contents
UNITED STATES
SECURITIES AND EXCHANGE COMMISSION
Washington, D.C. 20549
FORM 10-K
(Mark One)
| ☑ | ANNUAL REPORT PURSUANT TO SECTION 13 OR 15(d)OF THE SECURITIES EXCHANGE ACT OF 1934 | ||||||||||
| For the fiscal year ended | October 28, 2023 |
OR
| ☐ | TRANSITION REPORT PURSUANT TO SECTION 13 OR 15(d)OF THE SECURITIES EXCHANGE ACT OF 1934 | |||||||
| For the transition period from to |
Commission file number 001-36250
Ciena Corporation
(Exact name of registrant as specified in its charter)
Delaware
(State or other jurisdiction of
incorporation or organization)
7035 Ridge Road, Hanover, MD
(Address of principal executive offices)
23-2725311
(I.R.S. Employer
Identification No.)
21076
(Zip Code)
Registrant’s telephone number, including area code: (410**)** 694-5700
Securities registered pursuant to Section 12(b) of the Act:
| Title of each class | Trading Symbol(s) | Name of each exchange on which registered | ||||||
| Common Stock, $0.01 par value | CIEN | New York Stock Exchange |
Securities registered pursuant to Section 12(g) of the Act: None
Indicate by check mark if the registrant is a well-known seasoned issuer, as defined in Rule 405 of the Securities Act. Yes þ No o
Indicate by check mark if the registrant is not required to file reports pursuant to Section 13 or Section 15(d) of the Act. Yes o No þ
Indicate by check mark whether the registrant (1) has filed all reports required to be filed by Section 13 or 15(d) of the Securities Exchange Act of 1934 during the preceding 12 months (or for such shorter period that the registrant was required to file such reports), and (2) has been subject to such filing requirements for the past 90 days. Yes þ No o
Indicate by check mark whether the registrant has submitted electronically every Interactive Data File required to be submitted pursuant to Rule 405 of Regulation S-T (§ 232.405 of this chapter) during the preceding 12 months (or for such shorter period that the registrant was required to submit such files). Yes þ No o
Indicate by check mark whether the registrant is a large accelerated filer, an accelerated filer, a non-accelerated filer, a smaller reporting company, or an emerging growth company. See the definitions of “large accelerated filer,” “accelerated filer,” “smaller reporting company,” and “emerging growth company” in Rule 12b-2 of the Exchange Act.
| Large accelerated filer | ☑ | Accelerated filer | ☐ | Non-accelerated filer | ☐ | Smaller reporting company | ☐ | ||||||||||||||||
| Emerging growth company | ☐ |
If an emerging growth company, indicate by check mark if the registrant has elected not to use the extended transition period for complying with any new or revised financial accounting standards provided pursuant to Section 13(a) of the Exchange Act. o
Indicate by check mark whether the registrant has filed a report on and attestation to its management’s assessment of the effectiveness of its internal control over financial reporting under Section 404(b) of the Sarbanes-Oxley Act (15 U.S.C. 7262(b)) by the registered public accounting firm that prepared or issued its audit report. ☑
If securities are registered pursuant to Section 12(b) of the Act, indicate by check mark whether the financial statements of the registrant included in the filing reflect the correction of an error to previously issued financial statements. o
Indicate by check mark whether any of those error corrections are restatements that required a recovery analysis of incentive-based compensation received by any of the registrant’s executive officers during the relevant recovery period pursuant to §240.10D-1(b). o
Indicate by check mark whether the registrant is a shell company (as defined in Rule 12b-2 of the Act) Yes ☐ No þ
The aggregate market value of the registrant’s Common Stock held by non-affiliates of the registrant was approximately $6.8 billion based on the closing price of the Common Stock on the New York Stock Exchange on April 28, 2023.
The number of shares of registrant’s Common Stock outstanding as of December 8, 2023 was 144,830,337.
DOCUMENTS INCORPORATED BY REFERENCE
Part III of the Form 10-K incorporates by reference certain portions of the registrant’s definitive proxy statement for its 2024 Annual Meeting of Stockholders to be filed with the Commission not later than 120 days after the end of the fiscal year covered by this report.
CIENA CORPORATION
ANNUAL REPORT ON FORM 10-K
FOR FISCAL YEAR ENDED OCTOBER 28, 2023
TABLE OF CONTENTS
PART I
Cautionary Note Regarding Forward-Looking Statements
This annual report contains statements that discuss future events or expectations, projections of results of operations or financial condition, changes in the markets for our products and services, trends in our business, business prospects and strategies and other “forward-looking” information. In some cases, you can identify “forward-looking statements” by words like “may,” “will,” “would,” “can,” “should,” “could,” “expects,” “future,” “plans,” “anticipates,” “believes,” “estimates,” “predicts,” “intends,” “potential,” “projects,” “targets,” or “continue” or the negative of those words and other comparable words. These statements may relate to, among other things, our competitive landscape; market conditions and growth opportunities; factors impacting our industry and markets, including macroeconomic conditions and global supply chain constraints; factors impacting the businesses of network operators, their network architectures and their adoption of next-generation network infrastructures; our strategy, including our research and development, supply chain and go-to-market initiatives and our efforts to increase the reach of our business into new or growing product, customer and geographic markets; our order volumes, backlog and seasonality in our business; expectations for our financial results, revenue, gross margin, operating expense and key operating measures in future periods; the adequacy of our sources of liquidity to satisfy our working capital needs, capital expenditures and other liquidity requirements; cybersecurity events; business initiatives including information technology (“IT”) and environmental, social and governance (“ESG”) initiatives; the impact of changes in tax law and our effective tax rates; and market risks associated with financial instruments and foreign currency exchange rates. These statements are subject to known and unknown risks, uncertainties and other factors, and actual events or results may differ materially from any future results, activity, performance, or achievements expressed or implied by these forward-looking statements, including due to factors such as those set forth below in “Risk Factors Summary.”
For a discussion of additional important factors that could cause actual results to vary materially from those anticipated in the forward-looking statements, see “Management’s Discussion and Analysis of Financial Condition and Results of Operations” and “Risk Factors” in this annual report. We operate in a very competitive and dynamic environment and new risks and uncertainties emerge, are identified or become apparent from time to time and therefore may not be identified in this annual report. We cannot predict all risks and uncertainties that could have an impact on the forward-looking statements contained in this annual report. You should be aware that the forward-looking statements contained in this annual report are based on our current views and assumptions. We undertake no obligation to revise or update any forward-looking statements made in this annual report to reflect events or circumstances after the date hereof or to reflect new information or the occurrence of unanticipated events, except as required by law. The forward-looking statements in this annual report are intended to be subject to protection afforded by the safe harbor for forward-looking statements contained in the Private Securities Litigation Reform Act of 1995. Unless the context requires otherwise, references in this annual report to “Ciena,” the “Company,” “we,” “us” and “our” refer to Ciena Corporation.
Risk Factors Summary
Investing in our securities involves a high degree of risk. The following is a summary of the principal factors that make an investment in our securities speculative or risky, as more fully described below in the section titled “Risk Factors.” This summary should be read in conjunction with the “Risk Factors” section and should not be relied upon as an exhaustive summary of the material risks facing our business. In addition to this summary, you should consider the information set forth in the “Risk Factors” section and the other information contained in this annual report before investing in our securities.
Risks Related to Our Business and Industry
-
Our backlog may not be an accurate indicator of the level and timing of our future revenues.
-
Our revenue, gross margin and operating results can fluctuate significantly and unpredictably from quarter to quarter.
-
Challenges relating to supply chain dynamics, including semiconductor components, could adversely impact our growth, gross margins and financial results.
-
A small number of customers account for a significant portion of our revenue. The loss of one or more of these customers or a significant reduction in their spending could have a material adverse effect on our business and results of operations.
-
We face intense competition that could hurt our sales and results of operations, and we expect the competitive landscape in which we operate or intend to operate to continue to broaden to include additional solutions providers.
-
Investment of research and development resources in communications networking technologies for which there is not an adequate market demand, or failure to invest sufficiently or timely in technologies for which there is high market demand, would adversely affect our revenue and profitability.
-
We have no guaranteed purchases and regularly must re-win business for existing customers.
-
Network equipment sales often involve lengthy sales cycles and protracted contract negotiations that may require us to agree to commercial terms or conditions that negatively affect pricing, risk allocation, payment and the timing of revenue recognition.
-
If we are unable to adapt our business to the consumption models for networking solutions adopted by our customers and to offer attractive solutions across these consumption models, our business, competitive position and results of operations could be adversely affected.
-
Our go-to-market activities and the distribution of our WaveLogicTM coherent modem technology within the market for high-performance transceivers/modems could expose us to increased or new forms of competition, or adversely affect our existing systems business and results of operations.
-
Accurately matching necessary inventory levels to customer demand within the current environment is challenging, and we may incur additional costs or be required to write off significant inventory that would adversely impact our results of operations.
-
If the market for network software does not evolve in the way we anticipate or if customers do not adopt our Blue Planet® Automation Software and Services, we may not be able to monetize these software assets and realize a key part of our business strategy.
-
Our exposure to the credit risks of our customers and resellers may make it difficult to collect receivables and could adversely affect our revenue and operating results.
-
We may be required to write down the value of certain significant assets, which would adversely affect our operating results.
-
Problems affecting the performance, interoperability, reliability or security of our products could damage our business reputation and negatively affect our results of operations.
-
Strategic acquisitions and investments could disrupt our operations and may expose us to increased costs and unexpected liabilities.
-
Emerging issues related to the development and use of artificial intelligence (AI) could give rise to legal or regulatory action, damage our reputation or otherwise materially harm of our business.
Risks Relating to the Macroeconomic Environment and our Global Presence
-
Our business and operating results could be adversely affected by unfavorable changes in macroeconomic and market conditions and reductions in the level of spending by customers in response to these conditions.
-
The international scale of our sales and operations exposes us to additional risk and expense that could adversely affect our results of operations.
-
Efforts to increase our sales and capture market share in targeted international markets may be unsuccessful.
-
We may be adversely affected by fluctuations in currency exchange rates.
Risks Related to Our Operations and Reliance on Third Parties
-
We may experience delays in the development and production of our products that may negatively affect our competitive position and business.
-
We rely on third-party contract manufacturers, and our business and results of operations may be adversely affected by risks associated with their businesses, financial condition, and the geographies in which they operate.
-
Our reliance on third-party component suppliers, including sole and limited source suppliers, exposes our business to additional risk, including risk relating to our suppliers’ businesses and financial position and risks arising as a result of geopolitical events, and could limit our sales, increase our costs and harm our customer relationships.
-
We rely on third-party resellers and distribution partners to sell our solutions, and on third-party service partners for installation, maintenance and support functions, and our failure to develop and manage these relationships effectively could adversely affect our business, results of operations, and relationships with our customers.
-
We may be exposed to unanticipated risks and additional obligations in connection with our resale of complementary products or technology of other companies.
-
Growth of our business is dependent on the proper functioning and scalability of our internal business processes and information systems. Adoption of new systems, modifications or interruptions of services may disrupt our business, processes and internal controls.
-
Restructuring activities could disrupt our business and affect our results of operations.
-
If we are unable to attract and retain qualified personnel, we may be unable to manage our business effectively.
Risks Related to Intellectual Property, Litigation, Regulation and Government Policy
-
Our intellectual property rights may be difficult and costly to enforce.
-
We may incur significant costs in response to claims by others that we infringe their intellectual property rights.
-
Our products incorporate software and other technology under license from third parties, and our business would be adversely affected if this technology were no longer available to us on commercially reasonable terms.
-
Data security breaches and cyber-attacks targeting our enterprise technology environment and assets could compromise our intellectual property, technology or other sensitive information, and cause significant damage to our business, reputation and operational capacity.
-
We are a party to legal proceedings, investigations and other claims or disputes, which are costly to defend and, if determined adversely to us, could require us to pay fines or damages, undertake remedial measures, or prevent us from taking certain actions, any of which could adversely affect our business.
-
Changes in trade policy, including the imposition of tariffs and other import measures, increased export control and investment restrictions, and efforts to withdraw from or materially modify international trade agreements, as well as other regulatory efforts impacting the import and sale of foreign equipment, may adversely affect our business, operations and financial condition.
-
Changes in government regulations affecting the communications and technology industries and the businesses of our customers could harm our prospects and operating results.
-
Government regulations related to the environment, climate change and social initiatives could adversely affect our business and operating results.
-
Investor and other stakeholder scrutiny related to our environmental, social and governance practices, and our disclosed performance and aspirations for these practices, may increase costs and expose us to numerous risks.
-
Changes in tax law or regulation, effective tax rates and other adverse outcomes with taxing authorities could adversely affect our results of operations.
-
Failure to maintain effective internal controls over financial reporting could have a material adverse effect on our business, operating results and stock price.
Risks Related to Our Common Stock, Indebtedness and Investments
-
Our stock price is volatile.
-
Outstanding indebtedness under our senior secured credit facilities and senior unsecured notes may adversely affect our liquidity and results of operations and could limit our business.
-
Significant volatility and uncertainty in the capital markets may limit our access to funding on favorable terms or at all.
Item 1. Business
Overview
We are a network platform, software, and services company, providing solutions that enable a wide range of network operators to deploy and manage next-generation networks that deliver services to businesses and consumers. We provide hardware, software and services that support the delivery of video, data and voice traffic over core, metro, aggregation and access communications networks. Our solutions are used globally by communications service providers, cable and multiservice operators, cloud providers, submarine network operators, governments, and enterprises across multiple industry verticals.
Our portfolio is designed to enable the Adaptive Network™, which is our vision for a network end state that leverages a programmable and scalable network infrastructure, driven by software control and automation capabilities, that is informed by network analytics and intelligence. By transforming network infrastructures into dynamic, programmable environments driven by automation and analytics, network operators can realize greater business agility, adapt dynamically to changing end-user service demands, and rapidly introduce new revenue-generating services. They can also gain valuable, real-time network insights, allowing them to optimize network performance and maximize the return on their network infrastructure investment.
Our solutions include Networking Platforms, including our Optical Networking portfolio and our Routing and Switching portfolio, which can be applied from the network core to end-user access points, and which allow network operators to scale capacity, increase transmission speeds, allocate traffic efficiently and adapt dynamically to changing end-user service demands. Our Optical Networking portfolio, which we previously referred to as our Converged Packet Optical portfolio, includes products that support long haul and regional networks, submarine and data center interconnect networks, and metro and edge networks. Our Routing and Switching portfolio includes products and solutions that enable efficient internet protocol (“IP”) transport in next-generation metro core, aggregation, and access networks, including in enterprise edge and broadband access applications.
To complement our Networking Platforms, we offer Platform Software, which includes our Manage, Control and Plan (“MCP”) applications that deliver advanced multi-layer domain control and operations. Through our Blue Planet® Software, we also enable complete service lifecycle management automation with productized operational support systems (“OSS”), which include inventory, orchestration and assurance solutions that help our customers to achieve closed loop automation across multi-vendor and multi-domain environments.
In addition to our systems and software, we also offer a broad range of services that help our customers build, operate and improve their networks and associated operational environments. These include network transformation, consulting, implementation, systems integration, maintenance, network operations center (“NOC”) management, learning, and optimization services.
Industry Background
Network Traffic Growth and Increased Capacity Requirements
The markets into which we sell are dynamic and characterized by a high rate of change. Optical networks – which carry video, data and voice traffic by encoding digital information on multiple wavelengths of light traveling across fiber optic cables – have experienced strong demand for increased bandwidth due to traffic growth. This network traffic growth is being driven by a diverse set of communications services that often require on-demand service levels by enterprise and consumer end users, as well as cloud-based services and applications:
*•*Cloud-Based Services. Enterprises and consumers continue to replace locally-housed computing and storage by adopting a broad array of innovative cloud-based models – including Platform as a Service (PaaS), Software as a Service (SaaS) and Infrastructure as a Service (IaaS) – and an expanding range of cloud-based services that host key applications, store data, enable the viewing and downloading of content, and utilize on-demand computing resources. In addition, content is increasingly moving to the network edge, creating new capacity and traffic demands closer to the user.
-
Over-the-Top (“OTT”) Services and Video Streaming. OTT content refers to video, multimedia and other applications provided directly from the content source to the viewer or end user across a third-party network. Traffic from streaming and OTT services, including high definition and ultra-high definition video, has expanded with the increased availability of, and end-user demand for, video content accessible through a variety of devices and media.
-
Mobile Traffic and Fifth-Generation Wireless Broadband (“5G”). Traffic from mobile web applications, including video, internet and data services, has expanded with the continued proliferation of smartphones and other wireless devices. Because much of wireless traffic ultimately travels across a wireline network to reach its destination, growth in mobile communications continues to place higher demands upon wireline networks, including the backhaul and fronthaul portions of networks emanating from cell sites. 5G technology is further enabling meaningful increases in bandwidth and performance, and enabling emerging applications and services that 4G/LTE networks cannot support. To fully capitalize on these opportunities, network operators will need to consider the demands 5G technology will place on their wireline infrastructures.
-
Residential Access Applications and Enterprise Applications. In recent years there has been a shift in bandwidth demands, traffic patterns and computing functions to the edge of networks. This trend was meaningfully accelerated by the COVID-19 pandemic, including due to an increase in remote and hybrid working, distance learning, and work from home arrangements. With a higher percentage of data flows concentrating closer to the network edge, more capacity and higher bandwidth to home and enterprise locations is required. These shifts could be permanent, and could influence network architectures and require network operators to adapt.
-
Fiber-Based Access Networks. Network densification initiatives by cable and multiservice operators seek to push more digital fiber closer to the end user in an effort to increase potential bandwidth, computing capability and data speeds to homes and enterprises, while decreasing power, space and operating costs. Wireline service providers are responding to similar service and end customer demands by extending fiber to the home and deeper into access networks.
Emerging technologies, services and applications are further impacting, or expected to impact network infrastructures, particularly at the edge of networks, where increased computing power and automation are required to meet the quality of experience required by end users. These include:
-
Internet of Things (“IoT”). As networked connections between devices and servers grow, machine-to-machine-related traffic (“M2M”) is expected to represent an increasing portion of traffic. These connections allow sharing of data that can be monitored and analyzed, including in smart grid applications, health care and safety monitoring, resource and inventory management, home entertainment, consumer appliances, connected transportation and other M2M data applications.
-
Immersive Technologies and Ultra-High Definition Video (“UHD”). Immersive technologies like virtual reality (“VR”), augmented reality (“AR”), interactive experiences, gaming and 360° video, as well as UHD (4K and 8K) video, are placing or likely to place further capacity demands on networks as adoption of these technologies grows. Consumer electronics and other technology companies are rapidly advancing these applications, which require high bandwidth and l
Showing the first 8K of 95K characters. Open the full section
Item 1A. Risk Factors
Investing in our securities involves a high degree of risk. In addition to the other information contained in this report, you should consider the following risk factors before investing in our securities.
Risks Related to Our Business and Industry
Our backlog may not be an accurate indicator of the level and timing of our future revenues.
As a result of order volumes growth in prior periods, driven by supply chain constraints and longer delivery lead times, our backlog grew from $1.2 billion at the end of fiscal 2020 to $4.2 billion at the end of fiscal 2022. As supply chain conditions improved, we have been able to increase shipment volumes and reduce lead times, and our backlog decreased to $2.6 billion at the end of fiscal 2023. However, our order volumes began to moderate in the fourth quarter of fiscal 2022, and we continued to experience orders that are below revenue during fiscal 2023. We do not expect the very high level of orders we experienced in earlier periods in fiscal 2021 and fiscal 2022 to return or continue in the long-term. While we expect order volumes to normalize over time, we expect our backlog to continue to reduce in fiscal 2024. Backlog may be fulfilled several quarters following receipt of a purchase order, either due to customer schedules or delays caused by supply chain constraints. Generally, our customers may cancel, delay delivery or change their orders with limited advance notice, or they may decide not to accept our products and services, although instances of both cancellation and non-acceptance have been rare historically. Backlog also includes certain service obligations that may relate to a multi-year support period. As a result, backlog should not necessarily be viewed as an accurate indicator of future revenue for any particular period.
Our revenue, gross margin, and operating results can fluctuate significantly and unpredictably from quarter to quarter.
Our revenue, gross margin, and results of operations can fluctuate significantly and unpredictably from quarter to quarter. Our budgeted expense levels are based on our visibility into customer spending plans and our projections of future revenue and gross margin. Visibility into customer spending levels can be uncertain, spending patterns are subject to change, and reductions in our expense levels can take significant time to implement. Historically, a significant portion of our quarterly revenue was generated from customer orders received during that same quarter (which we refer to as “book to revenue”) and was therefore less predictable and subject to fluctuation due to a quarterly shortfall in orders from expectations. During fiscal 2022, however, we generated a significant backlog of customer orders, and through the first half of fiscal 2023, our revenue was more significantly impacted by availability of supply, as well as customer delivery deferrals of existing backlog. Specifically, during fiscal 2023, certain customers, including communications service providers and cable and multiservice operators in North America, and cloud providers, that had earlier placed significant advanced orders, rescheduled deliveries for a portion of such orders, to address their capital budget and capacity to absorb such inventory operationally. We expect our backlog to continue to reduce in fiscal 2024. As that happens, we expect our reliance upon securing quarterly book to revenue orders to grow and those orders to represent a more typical composition of our quarterly revenue over time. However, within these dynamics, our results for a particular period can be difficult to predict. These dynamics, as well as a range of factors, including those set forth below, can materially adversely affect quarterly revenue, gross margin, and operating results:
-
changes in spending levels or network deployment plans by customers, particularly with respect to our service provider and cloud provider customers;
-
order timing and volume, including book to revenue orders;
-
the timing of revenue recognition on sales, particularly relating to large orders;
-
availability of components and manufacturing capacity;
-
shipment and delivery timing, including any deferral of delivery;
-
backlog levels;
-
the level of competition and pricing pressure in our industry;
-
the pace and impact of price erosion that we regularly encounter in our markets;
-
the impact of commercial concessions or unfavorable commercial terms required to maintain incumbency or secure new opportunities with key customers;
-
the mix of revenue by product segment, geography, and customer in any particular quarter;
-
our level of success in achieving targeted cost reductions and improved efficiencies in our supply chain;
-
our incurrence of start-up costs, including lower margin phases of projects required to support initial deployments, gain new customers or enter new markets;
-
our level of success in accessing new markets and obtaining new customers;
-
long- and short-term changing behaviors or customer needs that impact demand for our products and services or the products and services of our customers;
-
technology-based price compression and our introduction of new platforms with improved price for performance;
-
changing market, economic, and political conditions, including the impact of tariffs and other trade restrictions or efforts to withdraw from or materially modify international trade agreements;
-
factors beyond our control such as natural disasters, climate change, acts of war or terrorism, and public health emergencies, such as the COVID-19 pandemic;
-
the financial stability of our customers and suppliers;
-
consolidation activity among our customers, suppliers, and competitors;
-
installation service availability and readiness of customer sites;
-
adverse impact of foreign exchange; and
-
seasonal effects in our business.
As a result of these factors and other conditions affecting our business and operating results, we believe that quarterly comparisons of our operating results are not necessarily a good indication of future performance. Quarterly fluctuations from the above and other factors may cause our revenue, gross margin, and results of operations to underperform in relation to our guidance, long-term financial targets or the expectations of financial analysts or investors, which may cause volatility or decreases in our stock price.
Challenges relating to supply chain dynamics, including semiconductor components, could adversely impact our growth, gross margins and financial results.
In the face of demand across a range of industries, global supply for certain raw materials and components, including, in particular, semiconductor, integrated circuits, and other electronic components used in most of our products, experienced substantial constraint and disruption in recent prior periods. As a result, we experienced significant component shortages, extended lead times, increased costs, and unexpected cancellation or delay of previously committed supply of key components across our supplier base. While reliability of supply has improved, extended lead times and elevated component costs could continue to adversely impact our revenue, our cost of goods sold, and our ability to reduce the cost to produce our products in a manner consistent with prior periods. It is unclear when the supply environment will fully stabilize and what impacts it will have on our business and results of operations in future periods. In addition, current geopolitical trends could impact the availability of components, and certain related export controls on critical minerals and semiconductor technology and chips could constrain supply and adversely impact both delivery and development of such components. This volatility has adversely affected, and could further affect, component availability, lead times and cost, which can adversely impact our revenue and have an impact on customer purc
Showing the first 8K of 113K characters. Open the full section
Item 1B. Unresolved Staff Comments
Not applicable.
Item 2. Properties
Overview. As of October 28, 2023, all of our properties are leased, and we do not own any real property. We lease facilities globally related to the ongoing operations of our business segments and related functions. Our corporate headquarters are located in one building in Hanover, Maryland.
Our largest facilities are our research and development centers located in Ottawa, Canada and Gurgaon, India. We also lease smaller engineering facilities in the United States, Canada, and Europe. In addition, we lease various smaller offices in regions throughout the world to support our sales and services operations. We believe the facilities we are now using are adequate and suitable for our business requirements.
Hanover, Maryland Headquarters Lease. We entered into an agreement dated November 3, 2011, with W2007 RDG Realty, L.L.C. relating to a 15-year lease of office space for our corporate headquarters in Hanover, Maryland, consisting of an agreed-upon rentable area of approximately 88,000 square feet.
Ottawa Leases. On October 23, 2014, Ciena Canada, Inc. entered into an 18-year lease agreement for the office building located at 5050 Innovation Drive, Ottawa, Canada, consisting of a rentable area of approximately 170,000 square feet. In addition, on April 15, 2015, Ciena Canada, Inc. entered into a 15-year lease agreement for two new office buildings adjacent to the building at 5050 Innovation Drive, located at 383 and 385 Terry Fox Drive, Ottawa, Canada, consisting of a rentable area of approximately 255,000 square feet.
Gurgaon Leases. On August 13, 2020, Ciena India Pvt. Ltd. extended our rental agreement for five years for an office building located at Plot No. 13, Echelon Institutional Sector 32, Gurgaon, which is adjacent to another building rented by Ciena India Pvt. Ltd., located at Plot No. 14, Echelon Institutional Sector 32, Gurgaon. The Gurgaon offices consist of a rentable area of approximately 282,000 square feet.
For additional information regarding our lease obligations, see Note 18 to our Consolidated Financial Statements included in Item 8 of Part II of this annual report.
Item 3. Legal Proceedings
The information set forth under the heading “Litigation” in Note 27 to our Consolidated Financial Statements included in Item 8 of Part II of this report, is incorporated herein by reference.
Item 4. Mine Safety Disclosures
Not applicable.
PART II
Item 5. Market for Registrant’s Common Stock, Related Stockholder Matters and Issuer Purchases of Equity Securities
(a) Our common stock is traded on the New York Stock Exchange under the stock symbol “CIEN.”
As of December 8, 2023, there were approximately 685 holders of record of our common stock and 144,830,337 shares of common stock outstanding. We have never paid cash dividends on our capital stock. We currently intend to retain earnings for use in our business, and we do not anticipate paying any cash dividends in the foreseeable future.
Issuer Purchases of Equity Securities
The following table provides a summary of repurchases of our common stock during the fourth quarter of fiscal 2023:
| Period | Total Number of Shares Purchased (1) | Average Price Paid Per Share | Total Number of Shares Purchased as Part of Publicly Announced Plans or Programs (1) | Approximate Dollar Value of Shares that May Yet Be Purchased Under the Plans or Programs (in Thousands) | ||||||||||||||||||||||
| July 30, 2023 to August 26, 2023 | 841,444 | $ | 41.59 | 841,444 | $ | 403,764 | ||||||||||||||||||||
| August 27, 2023 to September 23, 2023 | 1,147,400 | $ | 48.03 | 1,147,400 | $ | 348,650 | ||||||||||||||||||||
| September 24, 2023 to October 28, 2023 | 2,241,844 | $ | 44.00 | 2,241,844 | $ | 250,000 | ||||||||||||||||||||
| Total | 4,230,688 | $ | 44.62 | 4,230,688 |
(1) On December 9, 2021, we announced that our Board of Directors had authorized a program to repurchase up to $1.0 billion of our common stock, which replaced in its entirety our previous stock repurchase program. The program may be modified, suspended, or discontinued at any time. During the fourth quarter of fiscal 2023, we repurchased $188.8 million of our common stock under the stock repurchase program, and we had $250.0 million remaining under the current repurchase authorization as of October 28, 2023. See “Management’s Discussion and Analysis of Financial Condition and Results of Operations– Liquidity and Capital Resources – Stock Repurchase Authorization” in Item 7 of Part II of this report and Note 22 to our Consolidated Financial Statements included in Item 8 of Part II of this report for information regarding the stock repurchase programs authorized by our Board of Directors.
Stock Performance Graph
The following graph shows a comparison of cumulative total returns for an investment in our common stock, the S&P North American Technology-Multimedia Networking Index and the Russell 1000 from November 2, 2018 to October 27, 2023. The Russell 1000 index comprises the stocks representing the 1,000 largest publicly traded American companies as measured by market capitalization. The S&P North American Technology-Multimedia Networking Index comprises stocks in the S&P Total Market Index that are classified under the Global Industry Classification Standard communications equipment sub-industry. This graph is not deemed to be “soliciting material” or “filed” with the SEC or subject to the liabilities of Section 18 of the Securities Exchange Act of 1934, as amended (the “Exchange Act”), and the graph shall not be deemed to be incorporated by reference into any prior or subsequent filing by us under the Securities Act of 1933, as amended, or the Exchange Act.
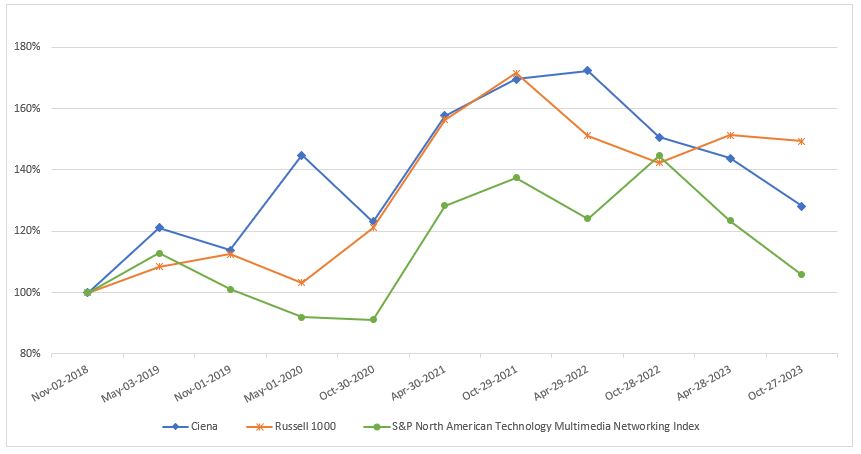
Assumes $100 invested in Ciena Corporation, the Russell 1000 and the S&P North American Technology-Multimedia Networking Index, respectively, on November 2, 2018 with all dividends reinvested at month-end.
(b) Not applicable.
(c) Not applicable.
Item 6. [Reserved]
Item 7. Management’s Discussion and Analysis of Financial Condition and Results of Operations
The following discussion and analysis should be read in conjunction with our consolidated financial statements and notes thereto included elsewhere in this annual report.
Overview
We are a network platform, software, and services company, providing solutions that enable a wide range of network operators to deploy and manage next-generation networks that deliver services to businesses and consumers. We provide hardware, software, and services that support the delivery of video, data, and voice traffic over core, metro, aggregation, and access communications networks. Our solutions are used globally by communications service providers, cable and multiservice operators, cloud providers, submarine network operators, governments, and enterprises across multiple industry verticals. Our portfolio is designed to enable the Adaptive Network, which is our vision for a network end state that leverages a programmable and scalable network infrastructure, driven by software control and automation capabilities, that is informed by analytics and intelligence. Our solutions include Networking Platforms, including our Optical Networking and Routing and Switching portfolios, which can be applied from the network core to end-user access points, and which allow network operators to scale capacity, increase transmission speeds, allocate traffic efficiently and adapt dynamically to changing end-user service demands. To complement our Networking Platforms, we offer Platform Software, which includes our Manage, Control and Plan (“MCP”) applications that deliver advanced multi-layer domain control and operations. Through our Blue Planet Software, we also enable complete service lifecycle management automation with productized operational support systems (OSS), which include inventory, orchestration and assurance solutions that help our customers to achieve closed loop automation across multi-vendor and multi-domain environments.
Order Volumes
From the second quarter of fiscal 2021 through the third quarter of fiscal 2022, we received an unprecedented volume of orders for our products and services. Our quarterly order volumes during this period significantly exceeded our revenue and historical order volumes, with concentration of orders among certain existing cloud provider and North America-based service provider customers. We believe some portion of these orders reflected customer acceleration of future orders due to lengthened lead times or the implementation of security of supply strategies to address the supply constraints described below. We also believe some portion of these orders reflected pre-pandemic design wins for which orders were delayed due to the dynamics of the COVID-19 pandemic. Our order volumes began to moderate in the fourth quarter of fiscal 2022. We continued to experience levels of orders lower than revenue during fiscal 2023, with order volumes slightly increasing in the fourth quarter of fiscal 2023 as compared to the third quarter of fiscal 2023. We believe this reduction in orders relative to revenue has been in part due to customers no longer needing to place significant advanced orders, because supply chain conditions and lead times have improved. However, over the longer term, we continue to believe that certain trends and shifts in business and consumer behaviors, including enterprise and consumer cloud network adoption, 5G, high-definition video, generative AI, and network operator focus on resilience and automation, represent positive, long-term drivers of demand and opportunities for our business.
Backlog and Order Delivery Timing
Historically, a meaningful portion of our quarterly revenue was generated from customer orders received during that same quarter (which we refer to as “book to revenue”) and was therefore less predictable and subject to fluctuation. As a result of elevated order volumes during portions of fiscal 2021 and fiscal 2022, and the supply chain constraints described below, however, we generated a significant backlog of customer orders. Accordingly, our revenue has been more recently impacted by factors including availability of supply and customer delivery deferrals of existing backlog. Our backlog grew from $1.2 billion at the end of fiscal 2020 to $4.2 billion at the end of fiscal 2022. As supply chain conditions have improved and we have been able to increase shipment volumes and reduce lead times, our backlog decreased to $2.6 billion as of the end of fiscal 2023. We expect our backlog to continue to reduce during fiscal 2024 as supply chain conditions continue to improve and customers place fewer advanced orders. As that happens, we expect that our reliance upon securing quarterly book to revenue orders will grow and that those orders will represent a more typical composition of our quarterly revenue and to be a critical element of future revenue growth.
The timing with which, and degree to which, we fulfill our backlog will have a significant impact on our rate of revenue growth and can be affected by factors outside of our control, including supply chain conditions and availability of components described below, and customer readiness and willingness to receive shipment against existing orders. During fiscal 2023, certain customers, including communications service providers and cable and multiservice operators in North America and cloud providers, that had earlier placed significant advanced orders, rescheduled deliveries for a portion of such orders,
including in some cases until after the end of fiscal 2023. We believe that this was the result of a number of factors, including these customers’ significant order levels during a period of supply chain constraints, the recent, rapid improvement in our delivery lead times, and their capital expenditure and inventory levels. Accordingly, our results for a particular period can be difficult to predict. As a result of these and other factors, the timing of our fulfillment of backlog could cause some volatility in our results of operations and our backlog should not necessarily be viewed as an accurate indicator of revenue for any particular period. See the risk factors captioned “Our backlog may not be an accurate indicator of our level and timing of future revenues.” and “Our revenue, gross margin, and operating results can fluctuate significantly and unpredictably from quarter to quarter.” in Item 1A of Part I of this report for further discussion of risks related to our backlog and order delivery timing.
Supply Chain Constraints
In the face of demand across a range of industries, global supply for certain raw materials and components, including, in particular, semiconductor, integrated circuits, and other electronic components used in most of our products, experienced substantial constraint and disruption in recent prior periods. As a result, we experienced significant component shortages, extended lead times, increased costs, and unexpected cancellation or delay of previously committed supply of key components across our supplier base. During the second half of fiscal 2023, lead times, costs, and predictability of supply for semiconductors, integrated circuits, and other electronic components began to stabilize and the majority of our suppliers have been able to deliver by their promised, though extended, lead times. However, we expect that extended lead times for components and elevated component costs will persist at least through the first half of fiscal 2024. Supply constrained conditions have impacted our revenue and will continue to impact our costs of goods sold in the near term and our ability to continue to reduce the cost to produce our products in a manner consistent with prior periods. It is unclear when the supply environment will fully stabilize and what impacts it will have on our business and results of operations in future periods.
To mitigate the impact of these supply conditions on our business and customers, we hav
Showing the first 8K of 88K characters. Open the full section
Item 7A. Quantitative and Qualitative Disclosures About Market Risk
We are exposed to market risk related to changes in interest rates and foreign currency exchange rates. The following discussion about these market risks includes forward-looking statements. Actual results could differ materially from those projected in these forward-looking statements.
Interest Rate Sensitivity. We maintain an investment portfolio of various holdings, types, and maturities. See Notes 7 and 8 to our Consolidated Financial Statements included in Item 8 of Part II of this annual report for information relating to investments and fair value. These investments are sensitive to interest rate movements, and their fair value will decline as interest rates rise and increase as interest rates decline. The estimated impact on these investments of a 100 basis point (1.0%) increase in interest rates across the yield curve from rates in effect as of the balance sheet date would be a $2.3 million decline in value.
Our earnings and cash flows from operations would be exposed to changes in interest rates because of the floating rate of interest on our 2030 New Term Loan if such loan were not hedged using floating-to-fixed rate interest rate swaps. See Note 16 to our Consolidated Financial Statements included in Item 8 of Part II of this annual report. We have entered into interest rate swaps that fix the floating rate for $350.0 million of our floating rate debt at 2.968% from September 2023 through September 2025, and another $350.0 million of our floating rate debt at 3.47% from January 2023 through January 2028. As such, a 100 basis point (1.0%) increase in the SOFR rate as of our most recent SOFR rate setting would increase our annualized interest expense by approximately $4.7 million on the unhedged portion of our 2030 New Term Loan as recognized in our Consolidated Financial Statements. See Notes 16 and 19 to our Consolidated Financial Statements included in Item 8 of Part II of this annual report for information relating to our 2030 New Term Loan.
Foreign Currency Exchange Risk. As a global concern, our business and results of operations are exposed to and can be impacted by movements in foreign currency exchange rates. Because we sell globally, some of our sales transactions and revenue are non-U.S. Dollar denominated, with the Euro, Canadian Dollar and British Pound being our most significant foreign currency revenue exposures. If the U.S. Dollar strengthens against these currencies, our revenue for these transactions reported in U.S. Dollars would decline. For our U.S. Dollar denominated sales, an increase in the value of the U.S. Dollar would increase the real costs of our products to customers in markets outside the United States, which could impact our competitive position. During fiscal 2023, approximately 14.9% of revenue was non-U.S. Dollar denominated. During fiscal 2023 as compared to fiscal 2022, the U.S. Dollar primarily strengthened against a number of foreign currencies. Consequently, our revenue reported in U.S. Dollars was adversely impacted by approximately $4.7 million or 0.1%. As it relates to costs of goods sold, employee-related and facilities costs associated with certain manufacturing-related operations in Canada represent our primary exposure to foreign currency exchange risk.
With regard to operating expense, our primary exposure to foreign currency exchange risk relates to the Canadian Dollar, Indian Rupee and Euro. During fiscal 2023, approximately 49.4% of our operating expense was non-U.S. Dollar denominated. If these foreign currencies strengthen against the U.S. Dollar, costs reported in U.S. Dollars will increase. During fiscal 2023 as compared to fiscal 2022, the U.S. Dollar primarily strengthened against these and other currencies. Consequently, our operating expense reported in U.S. Dollars decreased by approximately $23.3 million, or 1.5%, net of hedging impact.
From time to time, we use foreign currency forward contracts to reduce variability in certain forecasted non-U.S. Dollar denominated cash flows. Generally, these derivatives have maturities of 24 months or less and are designated as cash flow hedges. At the inception of the cash flow hedge, and on an ongoing basis, we assess whether the forward contract has been effective in offsetting changes in cash flows attributable to the hedged risk during the hedging period. The derivative’s net gain or loss is initially reported as a component of accumulated other comprehensive loss and, upon the occurrence of the forecasted transaction, is subsequently reclassified to the line item in the Consolidated Statements of Operations to which the hedged transaction relates.
During fiscal 2023, we recorded $0.4 million in foreign currency exchange losses, as a result of monetary assets and liabilities that were transacted in a currency other than the entity’s functional currency, and the re-measurement adjustments were recorded in interest and other income (loss), net on our Consolidated Statements of Operations. From time to time, we use foreign currency forwards to hedge these balance sheet exposures. These forwards are not designated as hedges for accounting purposes, and any net gain or loss associated with these derivatives is reported in interest and other income (loss), net. During fiscal 2023, we recorded losses on non-hedge designated foreign currency forward contracts of $3.9 million. See Notes 1, 6 and 16 to our Consolidated Financial Statements included in Item 8 of Part II of this annual report.
Item 8. Financial Statements and Supplementary Data
The following is an index to the consolidated financial statements:
Report of Independent Registered Public Accounting Firm
To the Board of Directors and Stockholders of Ciena Corporation
Opinions on the Financial Statements and Internal Control over Financial Reporting
We have audited the accompanying consolidated balance sheets of Ciena Corporation and its subsidiaries (the “Company”) as of October 28, 2023 and October 29, 2022, and the related consolidated statements of operations, of comprehensive income, of changes in stockholders’ equity and of cash flows for each of the three years in the period ended October 28, 2023, including the related notes (collectively referred to as the “consolidated financial statements”). We also have audited the Company's internal control over financial reporting as of October 28, 2023, based on criteria established in Internal Control - Integrated Framework (2013) issued by the Committee of Sponsoring Organizations of the Treadway Commission (COSO).
In our opinion, the consolidated financial statements referred to above present fairly, in all material respects, the financial position of the Company as of October 28, 2023 and October 29, 2022, and the results of its operations and its cash flows for each of the three years in the period ended October 28, 2023 in conformity with accounting principles generally accepted in the United States of America. Also in our opinion, the Company maintained, in all material respects, effective internal control over financial reporting as of October 28, 2023, based on criteria established in Internal Control - Integrated Framework (2013) issued by the COSO.
Basis for Opinions
The Company's management is responsible for these consolidated financial statements, for maintaining effective internal control over financial reporting, and for its assessment of the effectiveness of internal control over financial reporting, included in the Report of Management on Internal Control Over Financial Reporting appearing under Item 9A. Our responsibility is to express opinions on the Company’s consolidated financial statements and on the Company's internal control over financial reporting based on our audits. We are a public accounting firm registered with the Public Company Accounting Oversight Board (United States) (PCAOB) and are required to be independent with respect to the Company in accordance with the U.S. federal securities laws and the applicable rules and regulations of the Securities and Exchange Commission and the PCAOB.
We conducted our audits in accordance with the standards of the PCAOB. Those standards require that we plan and perform the audits to obtain reasonable assurance about whether the consolidated financial statements are free of material misstatement, whether due to error or fraud, and whether effective internal control over financial reporting was maintained in all material respects.
Our audits of the consolidated financi
Showing the first 8K of 216K characters. Open the full section
Item 9. Changes in and Disagreements with Accountants on Accounting and Financial Disclosure
None.
Item 9A. Controls and Procedures
Disclosure Controls and Procedures
As of the end of the period covered by this report, we carried out an evaluation under the supervision and with the participation of management, including our Chief Executive Officer and Chief Financial Officer, of our disclosure controls and procedures (as defined in Rules 13a-15(e) and 15d-15(e) under the Exchange Act). Based on this evaluation, our Chief Executive Officer and Chief Financial Officer concluded that our disclosure controls and procedures were effective as of the end of the period covered by this report.
Changes in Internal Control over Financial Reporting
There was no change in our internal control over financial reporting (as defined in Rules 13a-15(f) and 15d-15(f) under the Securities Exchange Act of 1934, as amended) during the most recently completed fiscal quarter that has materially affected, or is reasonably likely to materially affect, our internal control over financial reporting.
Report of Management on Internal Control Over Financial Reporting
The management of Ciena Corporation is responsible for establishing and maintaining adequate internal control over financial reporting (as defined in Rules 13a-15(f) and 15d-15(f) under the Securities Exchange Act of 1934).
The internal control over financial reporting at Ciena Corporation was designed to provide reasonable assurance regarding the reliability of financial reporting and the preparation of financial statements for external purposes in accordance with accounting principles generally accepted in the United States of America. Internal control over financial reporting includes those policies and procedures that:
-
pertain to the maintenance of records that, in reasonable detail, accurately and fairly reflect the transactions and dispositions of the assets of Ciena Corporation;
-
provide reasonable assurance that transactions are recorded as necessary to permit preparation of financial statements in accordance with accounting principles generally accepted in the United States of America;
-
provide reasonable assurance that receipts and expenditures of Ciena Corporation are being made only in accordance with authorization of management and directors of Ciena Corporation; and
-
provide reasonable assurance regarding prevention or timely detection of unauthorized acquisition, use or disposition of assets that could have a material effect on the consolidated financial statements.
Because of its inherent limitations, internal control over financial reporting may not prevent or detect misstatements.
Management of Ciena Corporation assessed the effectiveness of the Company’s internal control over financial reporting as of October 28, 2023. Management based this assessment on criteria for effective internal control over financial reporting described in “COSO 2013 Internal Control — Integrated Framework” issued by the Committee of Sponsoring Organizations of the Treadway Commission. Based on this assessment, management determined that, as of October 28, 2023, Ciena Corporation maintained effective internal control over financial reporting. Management reviewed the results of its assessment with the Audit Committee of our Board of Directors.
PricewaterhouseCoopers LLP, independent registered public accounting firm, who audited and reported on the consolidated financial statements of Ciena Corporation included in this annual report, has also audited the effectiveness of Ciena Corporation’s internal control over financial reporting as of October 28, 2023, as stated in its report appearing in Item 8 of Part II of this annual report.
| /s/ Gary B. Smith | /s/ James E. Moylan, Jr. | ||||||||||
| Gary B. Smith | James E. Moylan, Jr. | ||||||||||
| President and Chief Executive Officer | Senior Vice President and Chief Financial Officer | ||||||||||
| December 15, 2023 | December 15, 2023 |
Item 9B. Other Information
Rule 10b5-1 Trading Arrangements
The following table describes, for the quarter ended October 28, 2023, each trading arrangement for the sale or purchase of our securities adopted, terminated or for which the amount, pricing or timing provisions were modified by our directors and officers
(as defined in Rule 16a-1(f) of the Exchange Act) that is either (1) a contract, instruction or written plan intended to satisfy the affirmative defense conditions of Rule 10b5-1(c) (a “Rule 10b5-1 trading arrangement”) or (2) a “non-Rule 10b5-1 trading arrangement” (as defined in Item 408(c) of Regulation S-K):
| Name (Title) | Action Taken (Date of Action) | Type of Trading Arrangement | Nature of Trading Arrangement | Duration of Trading Arrangement | Aggregate Number of Securities to be Purchased or Sold | ||||||||||||
| David Rothenstein (Senior Vice President, Chief Strategy Officer and Secretary) | Adoption (September 22, 2023) | Rule 10b5-1 trading arrangement | Sales | Until January 14, 2025, or such earlier date upon which all transactions are completed or expire without execution | Up to 42,000 shares of common stock | ||||||||||||
| Scott McFeely (former Senior Vice President, Global Products and Services) | Adoption (October 12, 2023) | Rule 10b5-1 trading arrangement | Sales | Until December 31, 2024, or such earlier date upon which all transactions are completed or expire without execution | Up to 38,500 shares of common stock |
Item 9C. Disclosure Regarding Foreign Jurisdictions that Prevent Inspection
Not applicable.
PART III
Item 10. Directors, Executive Officers and Corporate Governance
Information relating to our directors and executive officers is set forth in Part I of this annual report under the caption “Item 1. Business—Information About Our Executive Officers and Directors.”
Additional information responsive to this item concerning our Audit Committee and regarding compliance with Section 16(a) of the Exchange Act is incorporated herein by reference from our definitive proxy statement with respect to our 2024 Annual Meeting of Stockholders to be filed with the SEC within 120 days after the end of the fiscal year covered by this Form 10-K.
As part of our system of corporate governance, our board of directors has adopted a code of ethics that is specifically applicable to our chief executive officer and senior financial officers. This Code of Ethics for Senior Financial Officers, as well as our Code of Business Conduct and Ethics, applicable to all directors, officers and employees, are available on the “Corporate Governance” page of our website at www.ciena.com. We intend to satisfy any disclosure requirement under Item 5.05 of Form 8-K regarding an amendment to, or waiver from, a provision of the Code of Ethics for Senior Financial Officers by posting such information on our website at the address above.
Item 11. Executive Compensation
Information responsive to this item is incorporated herein by reference from our definitive proxy statement with respect to our 2024 Annual Meeting of Stockholders to be filed with the SEC within 120 days after the end of the fiscal year covered by this Form 10-K.
Item 12. Security Ownership of Certain Beneficial Owners and Management and Related Stockholder Matters
Information responsive to this item is incorporated herein by reference from our definitive proxy statement with respect to our 2024 Annual Meeting of Stockholders to be filed with the SEC within 120 days after the end of the fiscal year covered by this Form 10-K.
Item 13. Certain Relationships and Related Transactions, and Director Independence
Information responsive to this item is incorporated herein by reference from our definitive proxy statement with respect to our 2024 Annual Meeting of Stockholders to be filed with the SEC within 120 days after the end of the fiscal year covered by this Form 10-K.
Item 14. Principal Accountant Fees and Services
Information responsive to this item is incorporated herein by reference from our definitive proxy statement with respect to our 2024 Annual Meeting of Stockholders to be filed with the SEC within 120 days after the end of the fiscal year covered by this Form 10-K.
PART IV
Item 15. Exhibits and Financial Statement Schedules
(a)1. The information required by this item is included in Item 8 of Part II of this annual report.
2.The information required by this item is included in Item 8 of Part II of this annual report.
3.Exhibits: See Index to Exhibits, which is incorporated by reference in this Item. The Exhibits listed in the accompanying Index to Exhibits are filed herewith or incorporated by reference as part of this annual report.
(b)Exhibits. See Index to Exhibits, which is incorporated by reference in this Item. The Exhibits listed in the accompanying Index to Exhibits are filed herewith or incorporated by reference as part of this annual report.
(c)Not applicable.
Item 16. Form 10-K Summary
None.
SIGNATURES
Pursuant to the requirements of Section 13 or 15(d) of the Securities Exchange Act of 1934, the registrant has duly caused this report to be signed on its behalf by the undersigned, thereunto duly authorized on the 15th day of December 2023.
| Ciena Corporation | |||||||||||
| By: | /s/ Gary B. Smith | ||||||||||
| Gary B. Smith | |||||||||||
| President, Chief Executive Officer and Director | |||||||||||
Pursuant to the requirements of the Securities Exchange Act of 1934, this report has been signed below by the following persons on behalf of the registrant and in the capacities and on the date indicated.
| Signatures | Title | Date | ||||||||||||
| /s/ Patrick H. Nettles, Ph.D. | Executive Chairman of the Board of Directors | December 15, 2023 | ||||||||||||
| Patrick H. Nettles, Ph.D. | ||||||||||||||
| /s/ Gary B. Smith | President, Chief Executive Officer and Director | December 15, 2023 | ||||||||||||
| Gary B. Smith (Principal Executive Officer) | ||||||||||||||
| /s/ James E. Moylan, Jr. | Sr. Vice President, Finance and Chief Financial Officer | December 15, 2023 | ||||||||||||
| James E. Moylan, Jr. (Principal Financial Officer) | ||||||||||||||
| /s/ Andrew C. Petrik | Vice President, Controller | December 15, 2023 | ||||||||||||
| Andrew C. Petrik (Principal Accounting Officer) | ||||||||||||||
| /s/ Hassan M. Ahmed, Ph.D. | Director | December 15, 2023 | ||||||||||||
| Hassan M. Ahmed, Ph.D. | ||||||||||||||
| /s/ Bruce L. Claflin | Director | December 15, 2023 | ||||||||||||
| Bruce L. Claflin | ||||||||||||||
| /s/ Lawton W. Fitt | Director | December 15, 2023 | ||||||||||||
| Lawton W. Fitt | ||||||||||||||
| /s/ Patrick T. Gallagher | Director | December 15, 2023 | ||||||||||||
| Patrick T. Gallagher | ||||||||||||||
| /s/ Devinder Kumar | Director | December 15, 2023 | ||||||||||||
| Devinder Kumar | ||||||||||||||
| /s/ T. Michael Nevens | Director | December 15, 2023 | ||||||||||||
| T. Michael Nevens | ||||||||||||||
| /s/ Joanne B. Olsen | Director | December 15, 2023 | ||||||||||||
| Joanne B. Olsen | ||||||||||||||
| /s/ Mary G. Puma | Director | December 15, 2023 | ||||||||||||
| Mary G. Puma |
INDEX TO EXHIBITS
| Incorporated by Reference | ||||||||||||||||||||||||||||||||
| Form and | Filed | |||||||||||||||||||||||||||||||
| Exhibit | Registration or | Here- | ||||||||||||||||||||||||||||||
| Number | Exhibit Description | Commission No. | Exhibit | Filing Date | with (X) | |||||||||||||||||||||||||||
| 101.PRE | Inline XBRL Taxonomy Extension Presentation Linkbase Document | — | — | — | X | |||||||||||||||||||||||||||
| 104 | Cover Page Interactive Data File (formatted as Inline XBRL and contained in Exhibit 101) | — | — | — | X | |||||||||||||||||||||||||||
| * | Represents management contract or compensatory plan or arrangement | |||||||
| ++ | Representations and warranties included in these agreements, as amended, were made by the parties to one another in connection with a negotiated transaction. These representations and warranties were made as of specific dates, only for purposes of these agreements and for the benefit of the parties thereto. These representations and warranties were subject to important exceptions and limitations agreed upon by the parties, including being qualified by confidential disclosures, made for the purposes of allocating contractual risk between the parties rather than establishing these matters as facts. These agreements are filed with this report only to provide investors with information regarding its terms and conditions, and not to provide any other factual information regarding Ciena or any other party thereto. Accordingly, investors should not rely on the representations and warranties contained in these agreements or any description thereof as characterizations of the actual state of facts or condition of any party, its subsidiaries or affiliates. The information in these agreements should be considered together with Ciena’s public reports filed with the SEC. | |||||||
| # | Certain portions of this document have been omitted based on a request for confidential treatment submitted to the SEC. The non-public information that has been omitted from this document has been separately filed with the SEC. Each redacted portion of this document is indicated by a “[*]” and is subject to the request for confidential treatment submitted to the SEC. The redacted information is confidential information of Ciena. |