 filings.tools
Item 16. FORM 10-K SUMMARY
195K characters. Original on sec.gov · Markdown
Item 16. FORM 10-K SUMMARY
None.
COLGATE-PALMOLIVE COMPANY
SIGNATURES
Pursuant to the requirements of Section 13 or 15(d) of the Securities Exchange Act of 1934, the registrant has duly caused this report to be signed on its behalf by the undersigned, thereunto duly authorized.
| Colgate-Palmolive Company (Registrant) | ||
| Date: February 15, 2018 | By | /s/ Ian Cook |
| Ian Cook Chairman of the Board, President and Chief Executive Officer |
Pursuant to the requirements of the Securities Exchange Act of 1934, this report has been signed below on February 15, 2018, by the following persons on behalf of the registrant and in the capacities indicated.
| (a) Principal Executive Officer | (d) Directors: | |
| /s/ Ian Cook | /s/ Ian Cook | |
| Ian Cook Chairman of the Board, President and Chief Executive Officer | Ian Cook | |
| (b) Principal Financial Officer | Charles A. Bancroft, John P. Bilbrey, John T. Cahill, Helene D. Gayle, Ellen M. Hancock, C. Martin Harris, Lorrie M. Norrington, Michael B. Polk, Stephen I. Sadove | |
| /s/ Dennis J. Hickey | /s/ Jennifer M. Daniels | |
| Dennis J. Hickey Chief Financial Officer | Jennifer M. Daniels As Attorney-in-Fact | |
| (c) Principal Accounting Officer | ||
| /s/ Henning I. Jakobsen | ||
| Henning I. Jakobsen Vice President and Corporate Controller |
Index to Financial Statements
| Page | |
| Consolidated Financial Statements | |
| Report of Independent Registered Public Accounting Firm | 65 |
| Consolidated Statements of Income for the years ended December 31, 2017, 2016 and 2015 | 67 |
| Consolidated Statements of Comprehensive Income for the years ended December 31, 2017, 2016 and 2015 | 68 |
| Consolidated Balance Sheets as of December 31, 2017 and 2016 | 69 |
| Consolidated Statements of Changes in Shareholders’ Equity for the years ended December 31, 2017, 2016 and 2015 | 70 |
| Consolidated Statements of Cash Flows for the years ended December 31, 2017, 2016 and 2015 | 71 |
| Notes to Consolidated Financial Statements | 72 |
| Financial Statement Schedule | |
| Schedule II - Valuation and Qualifying Accounts for the years ended December 31, 2017, 2016 and 2015 | 116 |
| Selected Financial Data | |
| Market and Dividend Information | 117 |
| Historical Financial Summary | 119 |
All other financial statements and schedules not listed have been omitted since the required information is included in the financial statements or the notes thereto or is not applicable or required.
Report of Independent Registered Public Accounting Firm
To the Board of Directors and Shareholders of
Colgate-Palmolive Company
Opinions on the Financial Statements and Internal Control over Financial Reporting
We have audited the consolidated financial statements, including the related notes and financial statement schedule, of Colgate-Palmolive Company and its subsidiaries as listed in the accompanying index (collectively referred to as the “consolidated financial statements”). We also have audited the Company’s internal control over financial reporting as of December 31, 2017, based on criteria established in Internal Control - Integrated Framework (2013) issued by the Committee of Sponsoring Organizations of the Treadway Commission (COSO).
In our opinion, the consolidated financial statements referred to above present fairly, in all material respects, the financial position of the Company as of December 31, 2017 and December 31, 2016, and the results of their operations and their cash flows for each of the three years in the period ended December 31, 2017 in conformity with accounting principles generally accepted in the United States of America. Also in our opinion, the Company maintained, in all material respects, effective internal control over financial reporting as of December 31, 2017, based on criteria established in Internal Control - Integrated Framework (2013) issued by the COSO.
Basis for Opinions
The Company’s management is responsible for these consolidated financial statements, for maintaining effective internal control over financial reporting and for its assessment of the effectiveness of internal control over financial reporting included in Management’s Annual Report on Internal Control over Financial Reporting, appearing under Item 9A. Our responsibility is to express opinions on the Company’s consolidated financial statements and on the Company’s internal control over financial reporting based on our audits. We are a public accounting firm registered with the Public Company Accounting Oversight Board (United States) (“PCAOB”) and are required to be independent with respect to the Company in accordance with the U.S. federal securities laws and the applicable rules and regulations of the Securities and Exchange Commission and the PCAOB.
We conducted our audits in accordance with the standards of the PCAOB. Those standards require that we plan and perform the audits to obtain reasonable assurance about whether the consolidated financial statements are free of material misstatement, whether due to error or fraud, and whether effective internal control over financial reporting was maintained in all material respects.
Our audits of the consolidated financial statements included performing procedures to assess the risks of material misstatement of the consolidated financial statements, whether due to error or fraud, and performing procedures that respond to those risks. Such procedures included examining, on a test basis, evidence regarding the amounts and disclosures in the consolidated financial statements. Our audits also included evaluating the accounting principles used and significant estimates made by management, as well as evaluating the overall presentation of the consolidated financial statements. Our audit of internal control over financial reporting included obtaining an understanding of internal control over financial reporting, assessing the risk that a material weakness exists, and testing and evaluating the design and operating effectiveness of internal control based on the assessed risk. Our audits also included performing such other procedures as we considered necessary in the circumstances. We believe that our audits provide a reasonable basis for our opinions.
Definition and Limitations of Internal Control over Financial Reporting
A company’s internal control over financial reporting is a process designed to provide reasonable assurance regarding the reliability of financial reporting and the preparation of financial statements for external purposes in accordance with generally accepted accounting principles. A company’s internal control over financial reporting includes those policies and procedures that (i) pertain to the maintenance of records that, in reasonable detail, accurately and fairly reflect the transactions and dispositions of the assets of the company; (ii) provide reasonable assurance that transactions are recorded as necessary to permit preparation of financial statements in accordance with generally accepted accounting principles, and that receipts and expenditures of the company are being made only in accordance with authorizations of management and directors of the company; and (iii) provide reasonable assurance regarding prevention or timely detection of unauthorized acquisition, use, or disposition of the company’s assets that could have a material effect on the financial statements.
Because of its inherent limitations, internal control over financial reporting may not prevent or detect misstatements. Also, projections of any evaluation of effectiveness to future periods are subject to the risk that controls may become inadequate because of changes in conditions, or that the degree of compliance with the policies or procedures may deteriorate.
| /s/ PRICEWATERHOUSECOOPERS LLP | |
| New York, New York February 15, 2018 | |
| We have served as the Company’s auditor since 2002. |
COLGATE-PALMOLIVE COMPANY
Consolidated Statements of Income
For the years ended December 31,
(Dollars in Millions Except Per Share Amounts)
| 2017 | 2016 | 2015 | |||||||||
| Net sales | $ | 15,454 | $ | 15,195 | $ | 16,034 | |||||
| Cost of sales | 6,174 | 6,072 | 6,635 | ||||||||
| Gross profit | 9,280 | 9,123 | 9,399 | ||||||||
| Selling, general and administrative expenses | 5,497 | 5,249 | 5,464 | ||||||||
| Other (income) expense, net | 194 | 37 | 62 | ||||||||
| Charge for Venezuela accounting change | — | — | 1,084 | ||||||||
| Operating profit | 3,589 | 3,837 | 2,789 | ||||||||
| Interest (income) expense, net | 102 | 99 | 26 | ||||||||
| Income before income taxes | 3,487 | 3,738 | 2,763 | ||||||||
| Provision for income taxes | 1,313 | 1,152 | 1,215 | ||||||||
| Net income including noncontrolling interests | 2,174 | 2,586 | 1,548 | ||||||||
| Less: Net income attributable to noncontrolling interests | 150 | 145 | 164 | ||||||||
| Net income attributable to Colgate-Palmolive Company | $ | 2,024 | $ | 2,441 | $ | 1,384 | |||||
| Earnings per common share, basic | $ | 2.30 | $ | 2.74 | $ | 1.53 | |||||
| Earnings per common share, diluted | $ | 2.28 | $ | 2.72 | $ | 1.52 |
See Notes to Consolidated Financial Statements.
COLGATE-PALMOLIVE COMPANY
Consolidated Statements of Comprehensive Income
For the years ended December 31,
(Dollars in Millions)
| 2017 | 2016 | 2015 | |||||||||
| Net income including noncontrolling interests | $ | 2,174 | $ | 2,586 | $ | 1,548 | |||||
| Other comprehensive income (loss), net of tax: | |||||||||||
| Cumulative translation adjustments | 302 | (137 | ) | (645 | ) | ||||||
| Retirement plan and other retiree benefit adjustments | 54 | (109 | ) | 196 | |||||||
| Gains (losses) on available-for-sale securities | — | (1 | ) | (7 | ) | ||||||
| Gains (losses) on cash flow hedges | (14 | ) | 5 | 2 | |||||||
| Total Other comprehensive income (loss), net of tax | 342 | (242 | ) | (454 | ) | ||||||
| Total Comprehensive income including noncontrolling interests | 2,516 | 2,344 | 1,094 | ||||||||
| Less: Net income attributable to noncontrolling interests | 150 | 145 | 164 | ||||||||
| Less: Cumulative translation adjustments attributable to noncontrolling interests | 17 | (12 | ) | (11 | ) | ||||||
| Total Comprehensive income attributable to noncontrolling interests | 167 | 133 | 153 | ||||||||
| Total Comprehensive income attributable to Colgate-Palmolive Company | $ | 2,349 | $ | 2,211 | $ | 941 |
See Notes to Consolidated Financial Statements.
COLGATE-PALMOLIVE COMPANY
Consolidated Balance Sheets
As of December 31,
(Dollars in Millions Except Share and Per Share Amounts)
| 2017 | 2016 | ||||||
| Assets | |||||||
| Current Assets | |||||||
| Cash and cash equivalents | $ | 1,535 | $ | 1,315 | |||
| Receivables (net of allowances of $77 and $73, respectively) | 1,480 | 1,411 | |||||
| Inventories | 1,221 | 1,171 | |||||
| Other current assets | 403 | 441 | |||||
| Total current assets | 4,639 | 4,338 | |||||
| Property, plant and equipment, net | 4,072 | 3,840 | |||||
| Goodwill | 2,218 | 2,107 | |||||
| Other intangible assets, net | 1,341 | 1,313 | |||||
| Deferred income taxes | 188 | 301 | |||||
| Other assets | 218 | 224 | |||||
| Total assets | $ | 12,676 | $ | 12,123 | |||
| Liabilities and Shareholders’ Equity | |||||||
| Current Liabilities | |||||||
| Notes and loans payable | $ | 11 | $ | 13 | |||
| Current portion of long-term debt | — | — | |||||
| Accounts payable | 1,212 | 1,124 | |||||
| Accrued income taxes | 354 | 441 | |||||
| Other accruals | 1,831 | 1,727 | |||||
| Total current liabilities | 3,408 | 3,305 | |||||
| Long-term debt | 6,566 | 6,520 | |||||
| Deferred income taxes | 204 | 246 | |||||
| Other liabilities | 2,255 | 2,035 | |||||
| Total liabilities | 12,433 | 12,106 | |||||
| Commitments and contingent liabilities | — | — | |||||
| Shareholders’ Equity | |||||||
| Common stock, $1 par value (2,000,000,000 shares authorized, 1,465,706,360 shares issued) | 1,466 | 1,466 | |||||
| Additional paid-in capital | 1,984 | 1,691 | |||||
| Retained earnings | 20,531 | 19,922 | |||||
| Accumulated other comprehensive income (loss) | (3,855 | ) | (4,180 | ) | |||
| Unearned compensation | (5 | ) | (7 | ) | |||
| Treasury stock, at cost | (20,181 | ) | (19,135 | ) | |||
| Total Colgate-Palmolive Company shareholders’ equity | (60 | ) | (243 | ) | |||
| Noncontrolling interests | 303 | 260 | |||||
| Total equity | 243 | 17 | |||||
| Total liabilities and equity | $ | 12,676 | $ | 12,123 |
See Notes to Consolidated Financial Statements.
COLGATE-PALMOLIVE COMPANY
Consolidated Statements of Changes in Shareholders’ Equity
(Dollars in Millions)
| Colgate-Palmolive Company Shareholders’ Equity | |||||||||||||||||||||||||||
| Common Stock | Additional Paid-In Capital | Unearned Compensation | Treasury Stock | Retained Earnings | Accumulated Other Comprehensive Income (Loss) | Noncontrolling Interests | |||||||||||||||||||||
| Balance, January 1, 2015 | $ | 1,466 | $ | 1,236 | $ | (20 | ) | $ | (16,862 | ) | $ | 18,832 | $ | (3,507 | ) | $ | 240 | ||||||||||
| Net income | 1,384 | 164 | |||||||||||||||||||||||||
| Other comprehensive income (loss), net of tax | (443 | ) | (11 | ) | |||||||||||||||||||||||
| Dividends | (1,355 | ) | (138 | ) | |||||||||||||||||||||||
| Stock-based compensation expense | 125 | ||||||||||||||||||||||||||
| Shares issued for stock options | 90 | 243 | |||||||||||||||||||||||||
| Shares issued for restricted stock awards | (69 | ) | 69 | ||||||||||||||||||||||||
| Treasury stock acquired | (1,551 | ) | |||||||||||||||||||||||||
| Other | 56 | 8 | (1 | ) | |||||||||||||||||||||||
| Balance, December 31, 2015 | $ | 1,466 | $ | 1,438 | $ | (12 | ) | $ | (18,102 | ) | $ | 18,861 | $ | (3,950 | ) | $ | 255 | ||||||||||
| Net income | 2,441 | 145 | |||||||||||||||||||||||||
| Other comprehensive income (loss), net of tax | (230 | ) | (12 | ) | |||||||||||||||||||||||
| Dividends | (1,380 | ) | (128 | ) | |||||||||||||||||||||||
| Stock-based compensation expense | 123 | ||||||||||||||||||||||||||
| Shares issued for stock options | 128 | 242 | |||||||||||||||||||||||||
| Shares issued for restricted stock awards | (60 | ) | 60 | ||||||||||||||||||||||||
| Treasury stock acquired | (1,335 | ) | |||||||||||||||||||||||||
| Other | 62 | 5 | |||||||||||||||||||||||||
| Balance, December 31, 2016 | $ | 1,466 | $ | 1,691 | $ | (7 | ) | $ | (19,135 | ) | $ | 19,922 | $ | (4,180 | ) | $ | 260 | ||||||||||
| Net income | 2,024 | 150 | |||||||||||||||||||||||||
| Other comprehensive income (loss), net of tax | 325 | 17 | |||||||||||||||||||||||||
| Dividends | (1,405 | ) | (124 | ) | |||||||||||||||||||||||
| Stock-based compensation expense | 127 | ||||||||||||||||||||||||||
| Shares issued for stock options | 197 | 313 | |||||||||||||||||||||||||
| Shares issued for restricted stock awards | (34 | ) | 34 | ||||||||||||||||||||||||
| Treasury stock acquired | (1,399 | ) | |||||||||||||||||||||||||
| Other | 3 | 2 | 6 | (10 | ) | ||||||||||||||||||||||
| Balance, December 31, 2017 | $ | 1,466 | $ | 1,984 | $ | (5 | ) | $ | (20,181 | ) | $ | 20,531 | $ | (3,855 | ) | $ | 303 |
See Notes to Consolidated Financial Statements.
COLGATE-PALMOLIVE COMPANY
Consolidated Statements of Cash Flows
For the years ended December 31,
(Dollars in Millions)
| 2017 | 2016 | 2015 | |||||||||
| Operating Activities | |||||||||||
| Net income including noncontrolling interests | $ | 2,174 | $ | 2,586 | $ | 1,548 | |||||
| Adjustments to reconcile net income including noncontrolling interests to net cash provided by operations: | |||||||||||
| Depreciation and amortization | 475 | 443 | 449 | ||||||||
| Restructuring and termination benefits, net of cash | 91 | (9 | ) | 69 | |||||||
| Venezuela remeasurement charges | — | — | 34 | ||||||||
| Stock-based compensation expense | 127 | 123 | 125 | ||||||||
| Gain on sale of land in Mexico | — | (97 | ) | — | |||||||
| Gain on sale of South Pacific laundry detergent business | — | — | (187 | ) | |||||||
| Charge for Venezuela accounting change | — | — | 1,084 | ||||||||
| Charge for U.S. tax reform | 275 | — | — | ||||||||
| Deferred income taxes | 108 | 56 | (51 | ) | |||||||
| Voluntary benefit plan contributions | (81 | ) | (53 | ) | — | ||||||
| Cash effects of changes in: | |||||||||||
| Receivables | (15 | ) | (17 | ) | (75 | ) | |||||
| Inventories | (8 | ) | (4 | ) | (13 | ) | |||||
| Accounts payable and other accruals | (96 | ) | 100 | (67 | ) | ||||||
| Other non-current assets and liabilities | 4 | 13 | 33 | ||||||||
| Net cash provided by operations | 3,054 | 3,141 | 2,949 | ||||||||
| Investing Activities | |||||||||||
| Capital expenditures | (553 | ) | (593 | ) | (691 | ) | |||||
| Sale of property and non-core product lines | 44 | — | 9 | ||||||||
| Purchases of marketable securities and investments | (347 | ) | (336 | ) | (742 | ) | |||||
| Proceeds from sale of marketable securities and investments | 391 | 378 | 599 | ||||||||
| Proceeds from sale of land in Mexico | — | 60 | — | ||||||||
| Proceeds from sale of South Pacific laundry detergent business | — | — | 221 | ||||||||
| Payment for acquisitions, net of cash acquired | — | (5 | ) | (13 | ) | ||||||
| Reduction in cash due to Venezuela accounting change | — | — | (75 | ) | |||||||
| Other | (6 | ) | (3 | ) | 7 | ||||||
| Net cash used in investing activities | (471 | ) | (499 | ) | (685 | ) | |||||
| Financing Activities | |||||||||||
| Principal payments on debt | (4,808 | ) | (7,274 | ) | (9,181 | ) | |||||
| Proceeds from issuance of debt | 4,779 | 7,438 | 9,602 | ||||||||
| Dividends paid | (1,529 | ) | (1,508 | ) | (1,493 | ) | |||||
| Purchases of treasury shares | (1,399 | ) | (1,335 | ) | (1,551 | ) | |||||
| Proceeds from exercise of stock options | 507 | 446 | 347 | ||||||||
| Net cash used in financing activities | (2,450 | ) | (2,233 | ) | (2,276 | ) | |||||
| Effect of exchange rate changes on Cash and cash equivalents | 87 | (64 | ) | (107 | ) | ||||||
| Net (decrease) increase in Cash and cash equivalents | 220 | 345 | (119 | ) | |||||||
| Cash and cash equivalents at beginning of year | 1,315 | 970 | 1,089 | ||||||||
| Cash and cash equivalents at end of year | $ | 1,535 | $ | 1,315 | $ | 970 | |||||
| Supplemental Cash Flow Information | |||||||||||
| Income taxes paid | $ | 1,037 | $ | 932 | $ | 1,259 | |||||
| Interest paid | $ | 150 | $ | 162 | $ | 131 |
See Notes to Consolidated Financial Statements.
COLGATE-PALMOLIVE COMPANY
Notes to Consolidated Financial Statements
(Dollars in Millions Except Share and Per Share Amounts)
- Nature of Operations
The Company manufactures and markets a wide variety of products in the U.S. and around the world in two product segments: Oral, Personal and Home Care; and Pet Nutrition. Oral, Personal and Home Care products include toothpaste, toothbrushes and mouthwash, bar and liquid hand soaps, shower gels, shampoos, conditioners, deodorants and antiperspirants, laundry and dishwashing detergents, fabric conditioners, household cleaners and other similar items. These products are sold primarily to retail and wholesale customers and distributors worldwide. Pet Nutrition products include specialty pet nutrition products manufactured and marketed by Hill’s Pet Nutrition. The principal customers for Pet Nutrition products are authorized pet supply retailers and veterinarians. Many of the products from both product segments are also sold to e-commerce retailers. Principal global and regional trademarks include Colgate, Palmolive, Speed Stick, Lady Speed Stick, Softsoap, Irish Spring, Protex, Sorriso, Kolynos, elmex, Tom’s of Maine, Sanex, Ajax, Axion, Fabuloso, Soupline and Suavitel, as well as Hill’s Science Diet, Hill’s Prescription Diet and Hill’s Ideal Balance.
The Company’s principal classes of products accounted for the following percentages of worldwide Net sales for the past three years:
| 2017 | 2016 | 2015 | |||||||
| Oral Care | 48 | % | 47 | % | 47 | % | |||
| Personal Care | 19 | % | 20 | % | 20 | % | |||
| Home Care | 18 | % | 18 | % | 19 | % | |||
| Pet Nutrition | 15 | % | 15 | % | 14 | % | |||
| Total | 100 | % | 100 | % | 100 | % |
- Summary of Significant Accounting Policies
Principles of Consolidation
The Consolidated Financial Statements include the accounts of Colgate-Palmolive Company and its majority-owned or controlled subsidiaries. Intercompany transactions and balances have been eliminated. The Company’s investments in consumer products companies with interests ranging between 20% and 50%, where the Company has significant influence over the investee, are accounted for using the equity method. Net income (loss) from such investments is recorded in Other (income) expense, net in the Consolidated Statements of Income. As of December 31, 2017 and 2016, equity method investments included in Other assets in the Consolidated Balance Sheets were $42 and $38, respectively. Unrelated third parties hold the remaining ownership interests in these investments. Investments with less than a 20% interest are accounted for using the cost method. Effective December 31, 2015, the Company concluded it no longer met the accounting criteria for consolidation of its Venezuelan subsidiary (“CP Venezuela”) and began accounting for CP Venezuela using the cost method of accounting. As a result, effective December 31, 2015, CP Venezuela’s net assets and operating results are no longer included in the Company’s Consolidated Financial Statements. See Note 14, Venezuela for further information.
COLGATE-PALMOLIVE COMPANY
Notes to Consolidated Financial Statements (continued)
(Dollars in Millions Except Share and Per Share Amounts)
Use of Estimates
The preparation of financial statements in accordance with accounting principles generally accepted in the United States of America requires management to use judgment and make estimates that affect the reported amounts of assets and liabilities and disclosure of contingent gains and losses at the date of the financial statements and the reported amounts of revenues and expenses during the reporting period. The level of uncertainty in estimates and assumptions increases with the length of time until the underlying transactions are completed. As such, the most significant uncertainty in the Company’s assumptions and estimates involved in preparing the financial statements includes pension and other retiree benefit cost assumptions, stock-based compensation, asset impairments, uncertain tax positions, tax valuation allowances, legal and other contingency reserves, the provisional charge in 2017 related to U.S. tax reform (see Note 11, Income Taxes) and, prior to the deconsolidation of the Company’s Venezuelan operations, the selection of the exchange rate used to remeasure the financial statements of CP Venezuela (see Note 14, Venezuela). Additionally, the Company uses available market information and other valuation methodologies in assessing the fair value of financial instruments and retirement plan assets. Judgment is required in interpreting market data to develop the estimates of fair value and, accordingly, changes in assumptions or the estimation methodologies may affect the fair value estimates. Actual results could ultimately differ from those estimates.
Revenue Recognition
Sales are recorded at the time products are shipped to trade customers and when risk of ownership transfers. Net sales reflect units shipped at selling list prices reduced by sales returns and the cost of current and continuing promotional programs. Current promotional programs, such as product listing allowances and co-operative advertising arrangements, are recorded in the period incurred. Continuing promotional programs are predominantly consumer coupons and volume-based sales incentive arrangements with trade customers. The redemption cost of consumer coupons is based on historical redemption experience and is recorded when coupons are distributed. Volume-based incentives offered to trade customers are based on the estimated cost of the program and are recorded as products are sold.
Shipping and Handling Costs
Shipping and handling costs are classified as Selling, general and administrative expenses and were $1,183, $1,140 and $1,235 for the years ended December 31, 2017, 2016 and 2015, respectively.
Marketing Costs
The Company markets its products through advertising and other promotional activities. Advertising costs are included in Selling, general and administrative expenses and are expensed as incurred. Certain consumer and trade promotional programs, such as consumer coupons, are recorded as a reduction of sales.
Cash and Cash Equivalents
The Company considers all highly liquid investments with original maturities of three months or less at the time of purchase to be cash equivalents.
Inventories
The cost of approximately 75% of inventories is determined using the first-in, first-out (“FIFO”) method, which is stated at the lower of cost or net realizable value. The cost of all other inventories, in the U.S. and Mexico, is determined using the last-in, first-out (“LIFO”) method, which is stated at the lower of cost or market.
COLGATE-PALMOLIVE COMPANY
Notes to Consolidated Financial Statements (continued)
(Dollars in Millions Except Share and Per Share Amounts)
Property, Plant and Equipment
Land, buildings and machinery and equipment are stated at cost. Depreciation is provided, primarily using the straight-line method, over estimated useful lives ranging from 3 to 15 years for machinery and equipment and up to 40 years for buildings. Depreciation attributable to manufacturing operations is included in Cost of sales. The remaining component of depreciation is included in Selling, general and administrative expenses.
Goodwill and Other Intangibles
Goodwill and indefinite life intangible assets, such as the Company’s global brands, are subject to impairment tests at least annually. These tests were performed and did not result in an impairment charge. Other intangible assets with finite lives, such as local brands and trademarks, customer relationships and non-compete agreements, are amortized over their estimated useful lives, generally ranging from 5 to 40 years. Amortization expense related to intangible assets is included in Other (income) expense, net, which is included in Operating profit.
Income Taxes
The provision for income taxes is determined using the asset and liability method. Under this method, deferred tax assets and liabilities are recognized based upon the differences between the financial statement and tax bases of assets and liabilities using enacted tax rates that will be in effect at the time such differences are expected to reverse. Deferred tax assets are reduced by a valuation allowance when, in the opinion of management, it is more likely than not that some portion or all of the deferred tax assets will not be realized.
The Company uses a comprehensive model to recognize, measure, present and disclose in its financial statements uncertain tax positions that the Company has taken or expects to take on an income tax return. The Company recognizes interest expense and penalties related to unrecognized tax benefits within Provision for income taxes.
Financial Instruments
Derivative instruments are recorded as assets and liabilities at estimated fair value based on available market information. The Company’s derivative instruments that qualify for hedge accounting are designated as either fair value hedges, cash flow hedges or net investment hedges. For fair value hedges, changes in the fair value of the derivative, as well as the offsetting changes in the fair value of the hedged item, are recognized in earnings each period. For cash flow hedges, changes in the fair value of the derivative are recorded in Other comprehensive income (loss) and are recognized in earnings when the offsetting effect of the hedged item is also recognized in earnings. For hedges of the net investment in foreign subsidiaries, changes in the fair value of the derivative are recorded in Other comprehensive income (loss) to offset the change in the value of the net investment being hedged. Cash flows related to hedges are classified in the same category as the cash flows from the hedged item in the Consolidated Statements of Cash Flows.
The Company may also enter into certain foreign currency and interest rate instruments that economically hedge certain of its risks but do not qualify for hedge accounting. Changes in fair value of these derivative instruments, based on quoted market prices, are recognized in earnings each period. The Company’s derivative instruments and other financial instruments are more fully described in Note 7, Fair Value Measurements and Financial Instruments along with the related fair value measurement considerations.
Stock-Based Compensation
The Company recognizes the cost of employee services received in exchange for awards of equity instruments, such as stock options and restricted stock units, based on the fair value of those awards at the date of grant over the requisite service period. The Company uses the Black-Scholes-Merton (“Black-Scholes”) option pricing model to determine the fair value of stock option awards. Stock-based compensation plans, related expenses and assumptions used in the Black-Scholes option pricing model are more fully described in Note 8, Capital Stock and Stock-Based Compensation Plans.
COLGATE-PALMOLIVE COMPANY
Notes to Consolidated Financial Statements (continued)
(Dollars in Millions Except Share and Per Share Amounts)
Currency Translation
The assets and liabilities of foreign subsidiaries, other than those operating in highly inflationary environments, are translated into U.S. dollars at year-end exchange rates with resulting translation gains and losses accumulated in a separate component of shareholders’ equity. Income and expense items are translated into U.S. dollars at average rates of exchange prevailing during the year.
For subsidiaries operating in highly inflationary environments, local currency-denominated non-monetary assets, including inventories, goodwill and property, plant and equipment, are remeasured at their historical exchange rates, while local currency-denominated monetary assets and liabilities are remeasured at year-end exchange rates. Remeasurement adjustments for these operations are included in Net income attributable to Colgate-Palmolive Company. Prior to the deconsolidation of the Company’s Venezuelan operations in 2015, CP Venezuela was designated as hyper-inflationary and the functional currency for CP Venezuela was the U.S. dollar. See Note 14, Venezuela for further information. Currently, none of the Company’s subsidiaries operate in highly inflationary environments.
Recent Accounting Pronouncements
On August 28, 2017, the Financial Accounting Standards Board (“FASB”) issued Accounting Standards Update (“ASU”) No. 2017-12, “Derivatives and Hedging (Topic 815): Targeted Improvements to Accounting for Hedging Activities,” amending the eligibility criteria for hedged items and transactions to expand an entity’s ability to hedge nonfinancial and financial risk components. The new guidance eliminates the requirement to separately measure and present hedge ineffectiveness and aligns the presentation of hedge gains and losses with the underlying hedge item. The new guidance also simplifies the hedge documentation and hedge effectiveness assessment requirements. The new guidance is effective for the Company beginning on January 1, 2019, with early adoption permitted. The amended presentation and disclosure requirements must be adopted on a prospective basis, while any amendments to cash flow and net investment hedge relationships that exist on the date of adoption must be applied on a “modified retrospective” basis, meaning a cumulative effect adjustment to the opening balance of retained earnings as of the beginning of the year of adoption. While the Company is currently assessing the impact of the new standard on its Consolidated Financial Statements, this new guidance is not expected to have a material impact on the Company’s Consolidated Financial Statements.
On May 10, 2017, the FASB issued ASU No. 2017-09, “Compensation–Stock Compensation (Topic 718): Scope of Modification Accounting,” clarifying when a change to the terms or conditions of a stock-based payment award must be accounted for as a modification. The new guidance requires modification accounting if the fair value, vesting condition or the classification of the award is not the same immediately before and after a change to the terms and conditions of the award. The new guidance was effective for the Company on a prospective basis beginning on January 1, 2018. This new guidance is not expected to have an impact on the Company’s Consolidated Financial Statements as it is not the Company’s practice to change either the terms or conditions of stock-based payment awards once they are granted.
COLGATE-PALMOLIVE COMPANY
Notes to Consolidated Financial Statements (continued)
(Dollars in Millions Except Share and Per Share Amounts)
On March 10, 2017, the FASB issued ASU No. 2017-07, “Compensation–Retirement Benefits (Topic 715): Improving the Presentation of Net Periodic Pension Cost and Net Periodic Postretirement Benefit Cost,” changing the presentation of the net periodic benefit cost on the Statement of Income and limiting the amount of net periodic benefit cost eligible for capitalization to assets. The new guidance permits only the service cost component of net periodic benefit cost to be eligible for capitalization. The new guidance also requires entities to present the service cost component of net periodic benefit cost together with compensation costs arising from services rendered by employees during the period. Other components of net periodic benefit cost, which include interest, expected return on assets, amortization of prior service costs and actuarial gains and losses, are required to be presented outside of Operating profit. The line item or items used to present the other components of net periodic benefit cost must be disclosed in the Notes to the Consolidated Financial Statements, if not separately described on the Statement of Income. The new presentation requirement is required to be adopted on a “full retrospective” basis, meaning the standard is applied to all of the periods presented in the financial statements, while the limitation on capitalization can only be adopted on a prospective basis. The new guidance was effective for the Company beginning on January 1, 2018. Had the standard been effective for the year ended December 31, 2017, full year Operating profit would have increased by approximately $120 with no impact on Net income attributable to Colgate-Palmolive Company. The Company anticipates that, as a result of the reclassification, full year Operating profit will increase in future periods by approximately $100 annually with no impact on Net income attributable to Colgate-Palmolive Company.
On January 26, 2017, the FASB issued ASU No. 2017-04, “Intangibles–Goodwill and Other (Topic 350): Simplifying the Test for Goodwill Impairment,” eliminating the requirement to calculate the implied fair value, essentially eliminating step two from the goodwill impairment test. The new standard requires goodwill impairment to be based upon the results of step one of the impairment test, which is defined as the excess of the carrying value of a reporting unit over its fair value. The impairment charge will be limited to the amount of goodwill allocated to that reporting unit. The standard is effective for the Company on a prospective basis beginning on January 1, 2020, with early adoption permitted. This new guidance is not expected to have a material impact on the Company’s Consolidated Financial Statements.
On January 5, 2017, the FASB issued ASU No. 2017-01, “Business Combinations (Topic 805): Clarifying the Definition of a Business,” which provides additional guidance on evaluating whether transactions should be accounted for as acquisitions of assets or businesses. The guidance requires an entity to evaluate if substantially all of the fair value of the assets acquired is concentrated in a single identifiable asset or a group of similar identifiable assets. If this threshold is met, the new guidance would define this as an asset acquisition; otherwise, the entity then evaluates whether the asset meets the requirement that a business include, at a minimum, an input and substantive process that together significantly contribute to the ability to create outputs. The guidance was effective for the Company on a prospective basis beginning on January 1, 2018. This new guidance is not expected to have a material impact on the Company’s Consolidated Financial Statements.
On October 24, 2016, the FASB issued ASU No. 2016-16, “Income Taxes (Topic 740): Intra-Entity Transfers of Assets Other than Inventory,” which eliminates the requirement to defer recognition of income taxes on intra-entity asset transfers until the asset is sold to an outside party. The new guidance requires the recognition of current and deferred income taxes on intra-entity transfers of assets other than inventory, such as intellectual property and property, plant and equipment, when the transfer occurs. As permitted, the Company early-adopted the new standard on a “modified retrospective” basis, meaning the standard was applied only to the most recent period presented in the financial statements, as of January 1, 2017. This new guidance did not have a material impact on the Company’s Consolidated Financial Statements.
On August 26, 2016, the FASB issued ASU No. 2016-15, “Statement of Cash Flows (Topic 230): Classification of Certain Cash Receipts and Cash Payments,” which clarifies how certain cash receipts and payments are to be presented in the statement of cash flows. The guidance was effective for the Company on January 1, 2018. This new guidance is not expected to have a material impact on the Company’s Consolidated Financial Statements.
COLGATE-PALMOLIVE COMPANY
Notes to Consolidated Financial Statements (continued)
(Dollars in Millions Except Share and Per Share Amounts)
On March 30, 2016, the FASB issued ASU No. 2016-09, “Compensation–Stock Compensation (Topic 718): Improvements to Employee Share-Based Payment Accounting,” which amended accounting for income taxes related to stock-based compensation, the related classification in the statement of cash flows and share award forfeiture accounting. The new guidance was effective for the Company beginning on January 1, 2017. As required subsequent to the adoption of this new guidance, the Company recognized excess tax benefits of $47 (resulting from an increase in the fair value of an award from grant date to the vesting or exercise date, as applicable) in the Provision for income taxes as a discrete item during the year ended December 31, 2017. These amounts may not necessarily be indicative of future amounts that may be recognized as any excess tax benefits from stock-based compensation recognized would be dependent on future stock price, employee exercise behavior and applicable tax rates. Prior to January 1, 2017, excess tax benefits were recognized in equity. As permitted, the Company elected to classify these excess tax benefits from stock-based compensation as an operating activity in the Statement of Cash Flows instead of as a financing activity on a prospective basis and did not retrospectively adjust prior periods. Also, as permitted by the new standard, the Company elected to account for forfeitures as they occur.
On March 15, 2016, the FASB issued ASU No. 2016-07, “Investments–Equity Method and Joint Ventures (Topic 323): Simplifying the Transition to the Equity Method of Accounting,” which eliminated the requirement to retroactively adjust an investment that subsequently qualifies for equity method accounting (as a result of an increase in level of ownership interest or degree of influence) as if the equity method of accounting had been applied during all prior periods that the investment was held. The new standard requires that the investor add the cost of acquiring additional ownership interest in the investee to its current basis and prospectively apply the equity method of accounting. For an available-for-sale investment, any unrealized gains or losses should be recognized in earnings at the date the investment qualifies as an equity method investment. The new guidance was effective for the Company beginning on January 1, 2017, and did not have a material impact on the Company’s Consolidated Financial Statements.
On February 25, 2016, the FASB issued its final standard on lease accounting, ASU No. 2016-02, “Leases (Topic 842),” which supersedes Topic 840, “Leases.” The new accounting standard requires the recognition of right-of-use assets and lease liabilities for all long-term leases, including operating leases, on the balance sheet. The new standard also provides additional guidance on the measurement of the right-of-use assets and lease liabilities and will require enhanced disclosures about the Company’s leasing arrangements. Under current accounting standards, substantially all of the Company’s leases are considered operating leases and, as such, are not recognized on the Consolidated Balance Sheet. This new standard is effective for the Company beginning on January 1, 2019, with early adoption permitted. The standard requires a “modified retrospective” adoption, meaning the standard is applied to leases existing at, or entered into after, the beginning of the earliest comparative period presented in the financial statements. The Company is currently assessing the impact of the new standard on its Consolidated Financial Statements.
On January 5, 2016, the FASB issued ASU No. 2016-01, “Financial Instruments–Overall (Subtopic 825-10): Recognition and Measurement of Financial Assets and Financial Liabilities.” The updated guidance enhances the reporting model for financial instruments, which includes amendments to address aspects of recognition, measurement, presentation and disclosure. The amendment to the standard was effective for the Company beginning on January 1, 2018 and is not expected to have a material impact on the Company’s Consolidated Financial Statements.
On July 22, 2015, the FASB issued ASU No. 2015-11, “Inventory (Topic 330): Simplifying the Measurement of Inventory,” which simplifies the subsequent measurement of inventories by replacing the lower of cost or market test with a lower of cost and net realizable value test. The guidance applies only to inventories for which cost is determined by methods other than LIFO and the retail inventory method. The new guidance was effective for the Company beginning on January 1, 2017. This new guidance did not have a material impact on the Company’s Consolidated Financial Statements.
COLGATE-PALMOLIVE COMPANY
Notes to Consolidated Financial Statements (continued)
(Dollars in Millions Except Share and Per Share Amounts)
On May 28, 2014, the FASB and the International Accounting Standards Board issued their final converged standard on revenue recognition. The standard, issued as ASU No. 2014-09, “Revenue from Contracts with Customers (Topic 606)” by the FASB, provides a comprehensive revenue recognition model for all contracts with customers and supersedes current revenue recognition guidance. The revenue standard contains principles that an entity will apply to determine the measurement of revenue and timing of when it is recognized. The underlying principle is that an entity will recognize revenue to depict the transfer of goods or services to its customers at an amount that the entity expects to be entitled to in exchange for those goods or services. The new standard also includes enhanced disclosures. During 2016, the FASB issued several accounting updates (ASU No. 2016-08, 2016-10 and 2016-12) to clarify implementation guidance and correct unintended application of the guidance. The standard allows for either full retrospective adoption or modified retrospective adoption. The Company adopted the new standard on January 1, 2018, on a “modified retrospective” basis, which did not have a material impact on the Company’s Consolidated Financial Statements. Although the new standard resulted in changes to the Company’s revenue recognition accounting policy commencing on January 1, 2018, the Company does not expect it will have a material impact in future periods on its Consolidated Financial Statements.
Reclassifications
Certain prior year amounts have been reclassified to conform to the current year presentation.
- Acquisitions and Divestitures
Acquisitions
In January 2018, the Company acquired all of the outstanding equity interests of Physicians Care Alliance, LLC and Elta MD Holdings, Inc., professional skin care businesses, for aggregate cash consideration of approximately $730.
Sale of Land in Mexico
In September 2016, the Company’s Mexican subsidiary completed the sale to the United States of America of the Mexico City site on which its commercial operations, technology center and soap production facility were previously located and received $60 as the third and final installment of the sale price. The total sale price (including the third installment and the previously received first and second installments) was $120. The Company recognized a pretax gain of $97 ($63 aftertax or $0.07 per diluted share) in the third quarter of 2016, net of costs primarily related to site preparation.
Sale of Laundry Detergent Business in the South Pacific
In August 2015, the Company completed the sale of its laundry detergent business in the South Pacific to Henkel AG & Co. KGaA for an aggregate purchase price of approximately 310 Australian dollars ($221) and recorded a pretax gain of $187 ($120 aftertax or $0.13 per diluted share) in Other (income) expense, net. The gain is net of charges related to the right-sizing of the Company’s South Pacific business, asset write-offs related to the divested laundry detergent business and other costs related to the sale. The funds from the sale were reinvested to expand the Global Growth and Efficiency Program (see Note 4, Restructuring and Related Implementation Changes).
COLGATE-PALMOLIVE COMPANY
Notes to Consolidated Financial Statements (continued)
(Dollars in Millions Except Share and Per Share Amounts)
- Restructuring and Related Implementation Charges
In the fourth quarter of 2012, the Company commenced a restructuring program (the “Global Growth and Efficiency Program”) for sustained growth. The program was expanded in 2014 and expanded and extended in 2015. Building on the Company’s successful implementation of the program, on October 26, 2017, the Board approved an expansion of the Global Growth and Efficiency Program and an extension of the program through December 31, 2019 to take advantage of additional opportunities to streamline the Company’s operations.
Initiatives under the Global Growth and Efficiency Program continue to fit within the program’s three focus areas of expanding commercial hubs, extending shared business services and streamlining global functions and optimizing the global supply chain and facilities.
Including the most recent expansion, cumulative pretax charges resulting from the Global Growth and Efficiency Program, once all phases are approved and implemented, are estimated to be in the range of $1,730 to $1,885 ($1,280 to $1,380 aftertax). The Company anticipates that pretax charges for 2018 will approximate $100 to $175 ($75 to $125 aftertax). It is expected that substantially all charges resulting from the Global Growth and Efficiency Program will be incurred by December 31, 2019.
The pretax charges resulting from the Global Growth and Efficiency Program are currently estimated to be comprised of the following categories: Employee-Related Costs, including severance, pension and other termination benefits (50%); asset-related costs, primarily Incremental Depreciation and Asset Impairments (10%); and Other charges, which include contract termination costs, consisting primarily of related implementation charges resulting directly from exit activities (20%) and the implementation of new strategies (20%). Over the course of the Global Growth and Efficiency Program, it is currently estimated that approximately 80% of the charges will result in cash expenditures.
The Company expects that the cumulative pretax charges, once all projects are approved and implemented, will relate to initiatives undertaken in North America (15%), Europe (20%), Latin America (5%), Asia Pacific (5%), Africa/Eurasia (5%), Hill’s Pet Nutrition (10%) and Corporate (40%), which includes substantially all of the costs related to the implementation of new strategies, noted above, on a global basis. The Company expects that, when it has been fully implemented, the Global Growth and Efficiency Program will have contributed a net reduction of approximately 3,800 to 4,400 positions from the Company’s global employee workforce.
For the years ended December 31, 2017, 2016 and 2015, restructuring and related implementation charges are reflected in the Consolidated Statements of Income as follows:
| 2017 | 2016 | 2015 | |||||||||
| Cost of sales | $ | 75 | $ | 46 | $ | 20 | |||||
| Selling, general and administrative expenses | 89 | 77 | 64 | ||||||||
| Other (income) expense, net | 169 | 105 | 170 | ||||||||
| Total Global Growth and Efficiency Program charges, pretax | $ | 333 | $ | 228 | $ | 254 | |||||
| Total Global Growth and Efficiency Program charges, aftertax | $ | 246 | $ | 168 | $ | 183 |
Restructuring and related implementation charges in the preceding table are recorded in the Corporate segment as these initiatives are predominantly centrally directed and controlled and are not included in internal measures of segment operating performance.
COLGATE-PALMOLIVE COMPANY
Notes to Consolidated Financial Statements (continued)
(Dollars in Millions Except Share and Per Share Amounts)
Total charges incurred for the Global Growth and Efficiency Program relate to initiatives undertaken by the following reportable operating segments:
| Program-to-date | |||||||||||
| 2017 | 2016 | 2015 | Accumulated Charges | ||||||||
| North America | 23 | % | 35 | % | 21 | % | 18 | % | |||
| Latin America | 2 | % | 5 | % | 3 | % | 3 | % | |||
| Europe | 21 | % | 12 | % | 14 | % | 22 | % | |||
| Asia Pacific | 5 | % | 4 | % | 4 | % | 3 | % | |||
| Africa/Eurasia | 3 | % | 14 | % | 5 | % | 6 | % | |||
| Hill’s Pet Nutrition | 6 | % | 7 | % | 5 | % | 7 | % | |||
| Corporate | 40 | % | 23 | % | 48 | % | 41 | % | |||
| Total | 100 | % | 100 | % | 100 | % | 100 | % |
Since the inception of the Global Growth and Efficiency Program in the fourth quarter of 2012, the Company has incurred cumulative pretax charges of $1,561 ($1,153 aftertax) in connection with the implementation of various projects as follows:
| Cumulative Charges | |||
| as of December 31, 2017 | |||
| Employee-Related Costs | $ | 628 | |
| Incremental Depreciation | 90 | ||
| Asset Impairments | 36 | ||
| Other | 807 | ||
| Total | $ | 1,561 |
The majority of costs incurred since inception relate to the following projects: the implementation of the Company’s overall hubbing strategy; the extension of shared business services and streamlining of global functions; the consolidation of facilities; the closing of the Morristown, New Jersey personal care facility; the simplification and streamlining of the Company’s research and development capabilities and oral care supply chain, both in Europe; redesigning the European commercial organization; restructuring how the Company will provide future retirement benefits to substantially all of the U.S.-based employees participating in the Company’s defined benefit retirement plan by shifting them to the Company’s defined contribution plan; and the implementation of a Corporate efficiencies program.
COLGATE-PALMOLIVE COMPANY
Notes to Consolidated Financial Statements (continued)
(Dollars in Millions Except Share and Per Share Amounts)
The following table summarizes the activity for the restructuring and related implementation charges, in the respective periods, discussed above and the related accruals:
| Employee-Related Costs | Incremental Depreciation | Asset Impairments | Other | Total | ||||||||||||||||
| Balance at January 1, 2015 | $ | 85 | $ | — | $ | — | $ | 107 | $ | 192 | ||||||||||
| Charges | 109 | 20 | 5 | 120 | 254 | |||||||||||||||
| Cash payments | (85 | ) | — | — | (94 | ) | (179 | ) | ||||||||||||
| Charges against assets | (17 | ) | (20 | ) | (5 | ) | — | (42 | ) | |||||||||||
| Foreign exchange | (8 | ) | — | — | (2 | ) | (10 | ) | ||||||||||||
| Other | — | — | — | — | — | |||||||||||||||
| Balance at December 31, 2015 | $ | 84 | $ | — | $ | — | $ | 131 | $ | 215 | ||||||||||
| Charges | 61 | 9 | 20 | 138 | 228 | |||||||||||||||
| Cash payments | (84 | ) | — | — | (153 | ) | (237 | ) | ||||||||||||
| Charges against assets | (4 | ) | (9 | ) | (20 | ) | — | (33 | ) | |||||||||||
| Foreign exchange | (1 | ) | — | — | — | (1 | ) | |||||||||||||
| Other | — | — | — | 9 | 9 | |||||||||||||||
| Balance at December 31, 2016 | $ | 56 | $ | — | $ | — | $ | 125 | $ | 181 | ||||||||||
| Charges | 163 | 10 | 9 | 151 | 333 | |||||||||||||||
| Cash payments | (74 | ) | — | — | (170 | ) | (244 | ) | ||||||||||||
| Charges against assets | (21 | ) | (10 | ) | (9 | ) | — | (40 | ) | |||||||||||
| Foreign exchange | 3 | — | — | 1 | 4 | |||||||||||||||
| Other | — | — | — | — | — | |||||||||||||||
| Balance at December 31, 2017 | $ | 127 | $ | — | $ | — | $ | 107 | $ | 234 |
Employee-Related Costs primarily include severance and other termination benefits and are calculated based on long-standing benefit practices, local statutory requirements and, in certain cases, voluntary termination arrangements. Employee-Related Costs also include pension and other retiree benefit enhancements amounting to $21, $4 and $17 for the years ended December 31, 2017, 2016 and 2015, respectively, which are reflected as Charges against assets within Employee-Related Costs in the preceding table as the corresponding balance sheet amounts are reflected as a reduction of pension assets or an increase in pension and other retiree benefit liabilities (see Note 10, Retirement Plans and Other Retiree Benefits).
Incremental Depreciation is recorded to reflect changes in useful lives and estimated residual values for long-lived assets that will be taken out of service prior to the end of their normal service period. Asset Impairments are recorded to write down assets held for sale or disposal to their fair value based on amounts expected to be realized. Charges against assets within Asset Impairments are net of cash proceeds pertaining to the sale of certain assets.
Other charges consist primarily of charges resulting directly from exit activities and the implementation of new strategies as a result of the Global Growth and Efficiency Program. These charges for the years ended December 31, 2017, 2016 and 2015 include third-party incremental costs related to the development and implementation of new business and strategic initiatives of $145, $116 and $65, respectively, and contract termination costs and charges resulting directly from exit activities of $6, $21 and $8, respectively. These charges were expensed as incurred. Also included in Other charges for the years ended December 31, 2017, 2016 and 2015 are other exit costs of $0, $1 and $47, respectively, related to the consolidation of facilities.
COLGATE-PALMOLIVE COMPANY
Notes to Consolidated Financial Statements (continued)
(Dollars in Millions Except Share and Per Share Amounts)
- Goodwill and Other Intangible Assets
The net carrying value of Goodwill as of December 31, 2017 and 2016 by segment was as follows:
| 2017 | 2016 | |||||||
| Oral, Personal and Home Care | ||||||||
| North America | $ | 343 | $ | 336 | ||||
| Latin America | 256 | 260 | ||||||
| Europe | 1,333 | 1,233 | ||||||
| Asia Pacific | 190 | 187 | ||||||
| Africa/Eurasia | 81 | 76 | ||||||
| Total Oral, Personal and Home Care | 2,203 | 2,092 | ||||||
| Pet Nutrition | 15 | 15 | ||||||
| Total Goodwill | $ | 2,218 | $ | 2,107 |
The change in the amount of Goodwill in each year is primarily due to the impact of foreign currency translation.
Other intangible assets as of December 31, 2017 and 2016 were comprised of the following:
| 2017 | 2016 | |||||||||||||||||||||||
| Gross Carrying Amount | Accumulated Amortization | Net | Gross Carrying Amount | Accumulated Amortization | Net | |||||||||||||||||||
| Trademarks | $ | 547 | $ | (337 | ) | $ | 210 | $ | 539 | $ | (317 | ) | $ | 222 | ||||||||||
| Other finite life intangible assets | 249 | (103 | ) | 146 | 231 | (78 | ) | 153 | ||||||||||||||||
| Indefinite life intangible assets | 985 | — | 985 | 938 | — | 938 | ||||||||||||||||||
| Total Other intangible assets | $ | 1,781 | $ | (440 | ) | $ | 1,341 | $ | 1,708 | $ | (395 | ) | $ | 1,313 |
The changes in the net carrying amounts of Other intangible assets during 2017, 2016 and 2015 were primarily due to amortization expense of $35, $33 and $33, respectively, as well as the impact of foreign currency translation. Annual estimated amortization expense for each of the next five years is expected to be approximately $35.
COLGATE-PALMOLIVE COMPANY
Notes to Consolidated Financial Statements (continued)
(Dollars in Millions Except Share and Per Share Amounts)
- Long-Term Debt and Credit Facilities
Long-term debt consisted of the following at December 31:
| Weighted Average Interest Rate | Maturities | 2017 | 2016 | |||||||||||
| Notes | 2.0% | 2018 | - | 2078 | $ | 6,542 | $ | 6,225 | ||||||
| Commercial paper | 1.5% | 2018 | 24 | 295 | ||||||||||
| 6,566 | 6,520 | |||||||||||||
| Less: Current portion of long-term debt | — | — | ||||||||||||
| Total | $ | 6,566 | $ | 6,520 |
The weighted-average interest rate on short-term borrowings of $11 in 2017 and $13 in 2016 included in Notes and loans payable in the Consolidated Balance Sheets as of December 31, 2017 and 2016 was 2.8% and 1.6%, respectively.
The Company classifies commercial paper and notes maturing within the next twelve months as long-term debt when it has the intent and ability to refinance such obligations on a long-term basis. Excluding such obligations, scheduled maturities of long-term debt and capitalized leases outstanding as of December 31, 2017, were as follows:
| Years Ended December 31, | |||
| 2018 | $ | — | |
| 2019 | 1,097 | ||
| 2020 | 248 | ||
| 2021 | 298 | ||
| 2022 | 889 | ||
| Thereafter | 3,311 |
The Company has entered into interest rate swap agreements and foreign exchange contracts related to certain of these debt instruments. See Note 7, Fair Value Measurements and Financial Instruments for further information about the Company’s financial instruments.
The Company’s debt issuances support its capital structure strategy objectives of funding its business and growth initiatives while minimizing its risk-adjusted cost of capital. During the fourth quarter of 2017, the Company issued $400 of five-year notes at a fixed rate of 2.25%. During the third quarter of 2017, the Company issued $500 of thirty-year notes at a fixed rate of 3.70%. The debt issuances in 2017 were under the Company’s shelf registration statement. Proceeds from the debt issuances in 2017 were used for general corporate purposes which included the retirement of commercial paper borrowings.
At December 31, 2017, the Company had access to unused domestic and foreign lines of credit of $2,949 (including under the facilities discussed below) and could also issue medium-term notes pursuant to an effective shelf registration statement. In November 2011, the Company entered into a five-year revolving credit facility with a capacity of $1,850 with a syndicate of banks. This facility was extended for an additional year in 2012 and again in 2013. In 2014, the Company entered into an amendment of this facility whereby the facility was extended for an additional year to November 2019 and the capacity of the facility was increased to $2,370. In 2016, the facility was extended for an additional year to November 2020. The Company also has the ability to draw $165 from a revolving credit facility that expires in November 2018. Commitment fees related to the credit facilities are not material.
COLGATE-PALMOLIVE COMPANY
Notes to Consolidated Financial Statements (continued)
(Dollars in Millions Except Share and Per Share Amounts)
Certain agreements with respect to the Company’s bank borrowings contain financial and other covenants as well as cross-default provisions. Noncompliance with these requirements could ultimately result in the acceleration of amounts owed. The Company is in full compliance with all such requirements and believes the likelihood of noncompliance is remote.
- Fair Value Measurements and Financial Instruments
The Company uses available market information and other valuation methodologies in assessing the fair value of financial instruments. Judgment is required in interpreting market data to develop the estimates of fair value and, accordingly, changes in assumptions or the estimation methodologies may affect the fair value estimates. The Company is exposed to the risk of credit loss in the event of nonperformance by counterparties to financial instrument contracts; however, nonperformance is considered unlikely and any nonperformance is unlikely to be material, as it is the Company’s policy to contract only with diverse, credit-worthy counterparties based upon both strong credit ratings and other credit considerations.
The Company is exposed to market risk from foreign currency exchange rates, interest rates and commodity price fluctuations. Volatility relating to these exposures is managed on a global basis by utilizing a number of techniques, including working capital management, sourcing strategies, selling price increases, selective borrowings in local currencies and entering into selective derivative instrument transactions, issued with standard features, in accordance with the Company’s treasury and risk management policies, which prohibit the use of derivatives for speculative purposes and leveraged derivatives for any purpose. It is the Company’s policy to enter into derivative instrument contracts with terms that match the underlying exposure being hedged. Hedge ineffectiveness, if any, is not material for any period presented. Provided below are details of the Company’s exposures by type of risk and derivative instruments by type of hedge designation.
Valuation Considerations
Assets and liabilities carried at fair value are classified as follows:
Level 1: Based upon quoted market prices in active markets for identical assets or liabilities.
Level 2: Based upon observable market-based inputs or unobservable inputs that are corroborated by market data.
Level 3: Based upon unobservable inputs reflecting the reporting entity’s own assumptions.
Foreign Exchange Risk
As the Company markets its products in over 200 countries and territories, it is exposed to currency fluctuations related to manufacturing and selling its products in currencies other than the U.S. dollar. The Company manages its foreign currency exposures through a combination of cost containment measures, sourcing strategies, selling price increases and the hedging of certain costs in an effort to minimize the impact on earnings of foreign currency rate movements.
The Company primarily utilizes foreign currency contracts, including forward and swap contracts, option contracts, foreign and local currency deposits and local currency borrowings to hedge portions of its foreign currency purchases, assets and liabilities arising in the normal course of business and the net investment in certain foreign subsidiaries. The duration of foreign currency contracts generally does not exceed 12 months and the contracts are valued using observable market rates (Level 2 valuation).
Interest Rate Risk
The Company manages its targeted mix of fixed and floating rate debt with debt issuances and by entering into interest rate swaps in order to mitigate fluctuations in earnings and cash flows that may result from interest rate volatility. The notional amount, interest payment and maturity date of the swaps generally match the principal, interest payment and maturity date of the related debt, and the swaps are valued using observable benchmark rates (Level 2 valuation).
COLGATE-PALMOLIVE COMPANY
Notes to Consolidated Financial Statements (continued)
(Dollars in Millions Except Share and Per Share Amounts)
Commodity Price Risk
The Company is exposed to price volatility related to raw materials used in production, such as resins, pulp, essential oils, tropical oils, tallow, poultry, corn and soybeans. The Company manages its raw material exposures through a combination of cost containment measures, sourcing strategies, ongoing productivity initiatives and the limited use of commodity hedging contracts. Futures contracts are used on a limited basis, primarily in the Hill’s Pet Nutrition segment, to manage volatility related to raw material inventory purchases of certain traded commodities, and these contracts are measured using quoted commodity exchange prices (Level 1 valuation). The duration of the commodity contracts generally does not exceed 12 months.
Credit Risk
The Company is exposed to the risk of credit loss in the event of nonperformance by counterparties to financial instrument contracts; however, nonperformance is considered unlikely and any nonperformance is unlikely to be material as it is the Company’s policy to contract with diverse, credit-worthy counterparties based upon both strong credit ratings and other credit considerations.
The following table summarizes the fair value of the Company’s derivative instruments and other financial instruments at December 31, 2017 and December 31, 2016:
| Assets | Liabilities | ||||||||||||||||||
| Account | Fair Value | Account | Fair Value | ||||||||||||||||
| Designated derivative instruments | 12/31/17 | 12/31/16 | 12/31/17 | 12/31/16 | |||||||||||||||
| Interest rate swap contracts | Other current assets | $ | — | $ | 1 | Other accruals | $ | — | $ | — | |||||||||
| Interest rate swap contracts | Other assets | — | 1 | Other liabilities | 7 | — | |||||||||||||
| Foreign currency contracts | Other current assets | 25 | 29 | Other accruals | 20 | 4 | |||||||||||||
| Foreign currency contracts | Other assets | — | 5 | Other liabilities | 46 | — | |||||||||||||
| Commodity contracts | Other current assets | — | — | Other accruals | — | — | |||||||||||||
| Total designated | $ | 25 | $ | 36 | $ | 73 | $ | 4 | |||||||||||
| Derivatives not designated | |||||||||||||||||||
| Foreign currency contracts | Other assets | — | — | Other liabilities | — | — | |||||||||||||
| Total not designated | $ | — | $ | — | $ | — | $ | — | |||||||||||
| Total derivative instruments | $ | 25 | $ | 36 | $ | 73 | $ | 4 | |||||||||||
| Other financial instruments | |||||||||||||||||||
| Marketable securities | Other current assets | $ | 14 | $ | 23 | ||||||||||||||
| Total other financial instruments | $ | 14 | $ | 23 |
COLGATE-PALMOLIVE COMPANY
Notes to Consolidated Financial Statements (continued)
(Dollars in Millions Except Share and Per Share Amounts)
The carrying amount of cash, cash equivalents, accounts receivable and short-term debt approximated fair value as of December 31, 2017 and 2016. The estimated fair value of the Company’s long-term debt, including the current portion, as of December 31, 2017 and 2016, was $6,799 and $6,717, respectively, and the related carrying value was $6,566 and $6,520, respectively. The estimated fair value of long-term debt was derived principally from quoted prices on the Company’s outstanding fixed-term notes (Level 2 valuation).
Fair Value Hedges
The Company has designated all interest rate swap contracts and certain foreign currency forward and option contracts as fair value hedges, for which the gain or loss on the derivative and the offsetting gain or loss on the hedged item are recognized in current earnings. The impact of foreign currency contracts is primarily recognized in Selling, general and administrative expenses and the impact of interest rate swap contracts is recognized in Interest (income) expense, net.
Activity related to fair value hedges recorded during each period presented was as follows:
| 2017 | 2016 | ||||||||||||||||||||||
| Foreign Currency Contracts | Interest Rate Swaps | Total | Foreign Currency Contracts | Interest Rate Swaps | Total | ||||||||||||||||||
| Notional Value at December 31, | $ | 1,231 | $ | 1,000 | $ | 2,231 | $ | 204 | $ | 1,250 | $ | 1,454 | |||||||||||
| Gain (loss) on derivatives | (7 | ) | (9 | ) | (16 | ) | 5 | (5 | ) | — | |||||||||||||
| Gain (loss) on hedged items | 7 | 9 | 16 | (5 | ) | 5 | — |
Cash Flow Hedges
All of the Company’s commodity contracts and certain foreign currency forward contracts have been designated as cash flow hedges, for which the effective portion of the gain or loss is reported as a component of Other comprehensive income (“OCI”) and reclassified into earnings in the same period or periods during which the hedged transaction affects earnings.
Activity related to cash flow hedges recorded during each period presented was as follows:
| 2017 | 2016 | ||||||||||||||||||||||
| Foreign Currency Contracts | Commodity Contracts | Total | Foreign Currency Contracts | Commodity Contracts | Total | ||||||||||||||||||
| Notional Value at December 31, | $ | 702 | $ | — | $ | 702 | $ | 643 | $ | 7 | $ | 650 | |||||||||||
| Gain (loss) recognized in OCI | (25 | ) | — | (25 | ) | 12 | (1 | ) | 11 | ||||||||||||||
| Gain (loss) reclassified into Cost of sales | (3 | ) | — | (3 | ) | 4 | — | 4 |
The net gain (loss) recognized in OCI for both foreign currency contracts and commodity contracts is generally expected to be recognized in Cost of sales within the next twelve months.
COLGATE-PALMOLIVE COMPANY
Notes to Consolidated Financial Statements (continued)
(Dollars in Millions Except Share and Per Share Amounts)
Net Investment Hedges
The Company has designated certain foreign currency forward and option contracts and certain foreign currency-denominated debt as net investment hedges, for which the gain or loss on the instrument is reported as a component of Cumulative translation adjustments within OCI, along with the offsetting gain or loss on the hedged items.
Activity related to net investment hedges recorded during each period presented was as follows:
| 2017 | 2016 | ||||||||||||||||||||||
| Foreign Currency Contracts | Foreign Currency Debt | Total | Foreign Currency Contracts | Foreign Currency Debt | Total | ||||||||||||||||||
| Notional Value at December 31, | $ | 478 | $ | 601 | $ | 1,079 | $ | 498 | $ | 1,118 | $ | 1,616 | |||||||||||
| Gain (loss) on instruments | (71 | ) | (112 | ) | (183 | ) | 22 | 35 | 57 | ||||||||||||||
| Gain (loss) on hedged items | 71 | 112 | 183 | (25 | ) | (35 | ) | (60 | ) |
Derivatives Not Designated as Hedging Instruments
Derivatives not designated as hedging instruments include foreign currency contracts for which the gain or loss on the instrument is recognized in Other (income) expense, net for the twelve months ended December 31, 2017. During the second quarter of 2017, the Company de-designated foreign currency forward contracts previously designated as net investment hedges and entered into new derivative instruments with offsetting terms. Gains or losses on these de-designated derivatives were substantially offset by gains and losses on the new derivative instruments.
Derivatives not designated as hedging instruments consisted of a cross-currency swap that served as an economic hedge of a foreign currency deposit, for which the gain or loss on the instrument and the offsetting gain or loss on the hedged item was recognized in Other (income) expense, net for the twelve months ended December 31, 2016.
Activity related to these contracts during each period presented was as follows:
| 2017 | 2016 | ||||||
| Foreign Currency Contracts | Foreign Currency Contracts | ||||||
| Notional Value at December 31, | $ | 3 | $ | 4 | |||
| Gain (loss) on instruments | — | 5 | |||||
| Gain (loss) on hedged items | — | (5 | ) |
Other Financial Instruments
Other financial instruments are classified as Other current assets or Other assets.
Included in Other current assets at December 31, 2017 are marketable securities, which consist of bank deposits of $14 with original maturities greater than 90 days carried at fair value (Level 1 valuation) and the current portion of bonds issued by the Argentinian government in the amount of $4 classified as held-to-maturity and carried at amortized cost.
Through its subsidiary in Argentina, the Company has invested in U.S. dollar-linked devaluation-protected bonds and Argentinian peso-denominated bonds issued by the Argentinian government. As of December 31, 2017 and 2016, the amortized cost of these bonds was $4 and $52, respectively, and their approximate fair value was $4 and $64, respectively (Level 2 valuation).
COLGATE-PALMOLIVE COMPANY
Notes to Consolidated Financial Statements (continued)
(Dollars in Millions Except Share and Per Share Amounts)
- Capital Stock and Stock-Based Compensation Plans
Preference Stock
The Company has the authority to issue 50,262,150 shares of preference stock.
Stock Repurchases
On February 19, 2015, the Board authorized the repurchase of shares of the Company’s common stock having an aggregate purchase price of up to $5,000 under a share repurchase program (the “2015 Program”), which replaced a previously authorized share repurchase program. The Company commenced repurchase of shares of the Company’s common stock under the 2015 Program beginning February 19, 2015. The Board also has authorized share repurchases on an ongoing basis to fulfill certain requirements of the Company’s compensation and benefit programs. The shares are repurchased from time to time in open market or privately negotiated transactions at the Company’s discretion, subject to market conditions, customary blackout periods and other factors. The Company repurchased its common stock at a cost of $1,399 during 2017 under the 2015 Program.
The Company may use either authorized and unissued shares or treasury shares to meet share requirements resulting from the exercise of stock options and the vesting of restricted stock unit awards.
A summary of common stock and treasury stock activity for the three years ended December 31, is as follows:
| Common Stock Outstanding | Treasury Stock | |||||
| Balance, January 1, 2015 | 906,712,145 | 558,994,215 | ||||
| Common stock acquired | (22,802,784 | ) | 22,802,784 | |||
| Shares issued for stock options | 7,394,839 | (7,394,839 | ) | |||
| Shares issued for restricted stock units and other | 1,434,318 | (1,434,318 | ) | |||
| Balance, December 31, 2015 | 892,738,518 | 572,967,842 | ||||
| Common stock acquired | (19,271,304 | ) | 19,271,304 | |||
| Shares issued for stock options | 8,536,639 | (8,536,639 | ) | |||
| Shares issued for restricted stock units and other | 1,105,110 | (1,105,110 | ) | |||
| Balance, December 31, 2016 | 883,108,963 | 582,597,397 | ||||
| Common stock acquired | (19,185,828 | ) | 19,185,828 | |||
| Shares issued for stock options | 9,670,988 | (9,670,988 | ) | |||
| Shares issued for restricted stock units and other | 1,106,995 | (1,106,995 | ) | |||
| Balance, December 31, 2017 | 874,701,118 | 591,005,242 |
COLGATE-PALMOLIVE COMPANY
Notes to Consolidated Financial Statements (continued)
(Dollars in Millions Except Share and Per Share Amounts)
Stock-Based Compensation
The Company recognizes the cost of employee services received in exchange for awards of equity instruments, such as stock options and restricted stock units, based on the fair value of those awards at the date of grant. The fair value of restricted stock units, generally based on market prices, is amortized on a straight-line basis over the requisite service period. The estimated fair value of stock options on the date of grant is amortized on a straight-line basis over the requisite service period for each separately vesting portion of the award. Awards to employees eligible for retirement prior to the award becoming fully vested are recognized as compensation cost from the grant date through the date that the employee first becomes eligible to retire and is no longer required to provide service to earn the award.
The Company has one incentive compensation plan pursuant to which it issues restricted stock units and stock options to employees and shares of common stock and stock options to non-employee directors. The Personnel and Organization Committee of the Board of Directors, which is comprised entirely of independent directors, administers the incentive compensation plan. The total stock-based compensation expense charged against pretax income for this plan was $127, $123 and $125 for the years ended December 31, 2017, 2016 and 2015, respectively. The total income tax benefit recognized on stock-based compensation was approximately $42, $40 and $39 for the years ended December 31, 2017, 2016 and 2015, respectively.
Stock-based compensation expense is recorded within Selling, general and administrative expenses in the Corporate segment as these amounts are not included in internal measures of segment operating performance.
The Company uses the Black-Scholes option pricing model to determine the fair value of stock option awards. The weighted-average estimated fair value of stock options granted in the years ended December 31, 2017, 2016 and 2015 was $8.37, $8.10 and $7.25, respectively. Fair value is estimated using the Black-Scholes option pricing model with the assumptions summarized in the following table:
| 2017 | 2016 | 2015 | |||||||
| Expected term of options | 4.5 years | 4.5 years | 4.5 years | ||||||
| Expected volatility rate | 16.0 | % | 16.7 | % | 17.6 | % | |||
| Risk-free interest rate | 1.8 | % | 1.2 | % | 1.5 | % | |||
| Expected dividend yield | 2.2 | % | 2.1 | % | 2.5 | % |
The weighted-average expected term of options granted each year was determined with reference to historical exercise and post-vesting cancellation experience, the vesting period of the awards and the contractual term of the awards, among other factors. Expected volatility incorporates implied share-price volatility derived from exchange traded options on the Company’s common stock. The risk-free interest rate for the expected term of the option is based on the yield of a zero-coupon U.S. Treasury bond with a maturity period equal to the option’s expected term.
COLGATE-PALMOLIVE COMPANY
Notes to Consolidated Financial Statements (continued)
(Dollars in Millions Except Share and Per Share Amounts)
Restricted Stock Units
The Company grants restricted stock unit awards to officers and other employees, including long-term incentive awards. Under the Company’s long-term incentive plan, awards are granted following a three-year performance period. Awards vest at the end of the restriction period, which is generally three years from the date of grant. As of December 31, 2017, approximately 9,870,000 shares of common stock were available for future restricted stock unit awards.
A summary of restricted stock unit activity during 2017 is presented below:
| Shares (in thousands) | Weighted Average Grant Date Fair Value Per Award | ||||||
| Restricted stock units as of January 1, 2017 | 2,945 | $ | 66 | ||||
| Activity: | |||||||
| Granted | 916 | 74 | |||||
| Vested | (1,057 | ) | 62 | ||||
| Forfeited | (74 | ) | 67 | ||||
| Restricted stock units as of December 31, 2017 | 2,730 | $ | 70 |
As of December 31, 2017, there was $52 of total unrecognized compensation expense related to unvested restricted stock unit awards, which will be recognized over a weighted-average period of 2.1 years. The total fair value of restricted stock units vested during the years ended December 31, 2017, 2016 and 2015 was $66, $61 and $70, respectively.
Stock Options
The Company issues non-qualified stock options to non-employee directors, officers and other employees. Stock options generally have a contractual term of six years and vest over three years. As of December 31, 2017, 20,997,000 shares of common stock were available for future stock option grants.
A summary of stock option activity during 2017 is presented below:
| Shares (in thousands) | Weighted Average Exercise Price | Weighted Average Remaining Contractual Life (in years) | Intrinsic Value of Unexercised In-the-Money Options | ||||||||||
| Options outstanding, January 1, 2017 | 43,692 | $ | 61 | ||||||||||
| Granted | 7,798 | 73 | |||||||||||
| Exercised | (10,118 | ) | 53 | ||||||||||
| Forfeited or expired | (393 | ) | 68 | ||||||||||
| Options outstanding, December 31, 2017 | 40,979 | 65 | 4 | $ | 420 | ||||||||
| Options exercisable, December 31, 2017 | 25,349 | $ | 62 | 3 | $ | 351 |
As of December 31, 2017, there was $45 of total unrecognized compensation expense related to unvested options, which will be recognized over a weighted-average period of 1.5 years. The total intrinsic value of options exercised during the years ended December 31, 2017, 2016 and 2015 was $201, $221 and $200, respectively.
COLGATE-PALMOLIVE COMPANY
Notes to Consolidated Financial Statements (continued)
(Dollars in Millions Except Share and Per Share Amounts)
The benefits of tax deductions in excess of grant date fair value resulting from the exercise of stock options and vesting of restricted stock unit awards for the years ended December 31, 2017, 2016 and 2015 were $47, $59 and $55, respectively. Through December 31, 2016 these amounts were recognized in equity and were reported as a financing cash flow. Effective January 1, 2017, as a result of the required adoption of ASU No. 2016-09, excess tax benefits from stock-based compensation have been recognized in the provision for income taxes as a discrete item in the quarterly period in which they occur and classified as an operating cash flow. Cash proceeds received from options exercised for the years ended December 31, 2017, 2016 and 2015 were $507, $386 and $299, respectively.
- Employee Stock Ownership Plan
In 1989, the Company expanded its Employee Stock Ownership Plan (“ESOP”) through the introduction of a leveraged ESOP that funds certain benefits for employees who have met eligibility requirements. As of December 31, 2017 and 2016, there were 18,400,412 and 21,082,162 shares of common stock, respectively, outstanding and issued to the Company’s ESOP.
During 2000, the ESOP entered into a loan agreement with the Company under which the benefits of the ESOP may be extended through 2035. As of December 31, 2017, the ESOP had outstanding borrowings from the Company of $5, which represents unearned compensation shown as a reduction in Shareholders’ equity.
Dividends on stock held by the ESOP are paid to the ESOP trust and, together with cash contributions from the Company, are (a) used by the ESOP to repay principal and interest, (b) credited to participant accounts or (c) used for contributions to the Company’s defined contribution plans. Stock is allocated to participants based upon the ratio of the current year’s debt service to the sum of total outstanding principal and interest payments over the life of the debt. As of December 31, 2017, 14,809,986 shares of common stock had been released and allocated to participant accounts and 3,590,426 shares of common stock were available for future allocation to participant accounts.
Dividends on the stock used to repay principal and interest or credited to participant accounts are deductible for income tax purposes and, accordingly, are reflected net of their tax benefit in the Consolidated Statements of Changes in Shareholders’ Equity.
Annual expense related to the ESOP was $0 in 2017, 2016 and 2015.
The Company paid dividends on the shares held by the ESOP of $32 in 2017, $35 in 2016 and $38 in 2015. The Company contributed to the ESOP $0 in 2017, 2016 and 2015.
- Retirement Plans and Other Retiree Benefits
Retirement Plans
The Company and certain of its U.S. and overseas subsidiaries maintain defined benefit retirement plans. Benefits under these plans are based primarily on years of service and employees’ earnings.
In the U.S., effective January 1, 2014, the Company provides virtually all future retirement benefits through the Company’s defined contribution plan. As a result, service after December 31, 2013 is not considered for participants in the Company’s principal U.S. defined benefit retirement plan. Participants in the Company’s principal U.S. defined benefit retirement plan whose retirement benefit was determined under the cash balance formula continue to earn interest credits on their vested balances as of December 31, 2013 but no longer receive pay credits. Participants whose retirement benefit was determined under the final average earnings formula or career average earnings formula continue to have their accrued benefit adjusted for pay increases until termination of employment.
COLGATE-PALMOLIVE COMPANY
Notes to Consolidated Financial Statements (continued)
(Dollars in Millions Except Share and Per Share Amounts)
In the Company’s principal U.S. plans and certain funded overseas plans, funds are contributed to trusts in accordance with regulatory limits to provide for current service and for any unfunded projected benefit obligation over a reasonable period. The target asset allocation for the Company’s defined benefit plans is as follows:
| United States | International | |||||
| Asset Category | ||||||
| Equity securities | 27 | % | 39 | % | ||
| Fixed income securities | 53 | % | 41 | % | ||
| Real estate and other investments | 20 | % | 20 | % | ||
| Total | 100 | % | 100 | % |
At December 31, 2017 the allocation of the Company’s plan assets and the level of valuation input, as applicable, for each major asset category were as follows:
| Level of Valuation Input | Pension Plans | |||||||||||||
| United States | International | Other Retiree Benefit Plans | ||||||||||||
| Cash and cash equivalents | Level 1 | $ | 21 | $ | 11 | $ | — | |||||||
| U.S. common stocks | Level 1 | 127 | 4 | — | ||||||||||
| International common stocks | Level 1 | — | 3 | — | ||||||||||
| Pooled funds(1) | Level 1 | 138 | 94 | — | ||||||||||
| Fixed income securities(2) | Level 2 | 843 | 24 | — | ||||||||||
| Guaranteed investment contracts(3) | Level 2 | 1 | 53 | — | ||||||||||
| 1,130 | 189 | — | ||||||||||||
| Investments valued using NAV per share(4) | ||||||||||||||
| Domestic, developed and emerging markets equity funds | 350 | 189 | — | |||||||||||
| Fixed income funds(5) | 122 | 167 | — | |||||||||||
| Hedge funds(6) | 82 | 5 | — | |||||||||||
| Multi-Asset funds(7) | 115 | 3 | — | |||||||||||
| Real estate funds(8) | 38 | 22 | — | |||||||||||
| 707 | 386 | — | ||||||||||||
| Other assets and liabilities, net(9) | (25 | ) | — | — | ||||||||||
| Total Investments | $ | 1,812 | $ | 575 | $ | — | ||||||||
COLGATE-PALMOLIVE COMPANY
Notes to Consolidated Financial Statements (continued)
(Dollars in Millions Except Share and Per Share Amounts)
At December 31, 2016 the allocation of the Company’s plan assets and the level of valuation input, as applicable, for each major asset category were as follows:
| Level of Valuation Input | Pension Plans | |||||||||||||
| United States | International | Other Retiree Benefit Plans | ||||||||||||
| Cash and cash equivalents | Level 1 | $ | 27 | $ | 13 | $ | — | |||||||
| U.S. common stocks | Level 1 | 127 | 3 | — | ||||||||||
| International common stocks | Level 1 | — | 3 | — | ||||||||||
| Pooled funds(1) | Level 1 | 134 | 84 | — | ||||||||||
| Fixed income securities(2) | Level 2 | 767 | 22 | — | ||||||||||
| Guaranteed investment contracts(3) | Level 2 | 1 | 49 | — | ||||||||||
| 1,056 | 174 | — | ||||||||||||
| Investments valued using NAV per share(4) | ||||||||||||||
| Domestic, developed and emerging markets equity funds | 323 | 155 | — | |||||||||||
| Fixed income funds(5) | 118 | 155 | — | |||||||||||
| Hedge funds(6) | 96 | 3 | — | |||||||||||
| Multi-Asset funds(7) | 52 | 3 | — | |||||||||||
| Real estate funds(8) | 43 | 19 | — | |||||||||||
| 632 | 335 | — | ||||||||||||
| Other assets and liabilities, net(9) | (42 | ) | — | — | ||||||||||
| Total Investments | $ | 1,646 | $ | 509 | $ | — |
| (1) | Pooled funds primarily invest in U.S. and foreign equity securities, debt and money market securities. |
| (2) | The fixed income securities are traded over the counter and certain of these securities lack daily pricing or liquidity and as such are classified as Level 2. As of December 31, 2017 and 2016, approximately 50% of the U.S. pension plan fixed income portfolio was invested in U.S. treasury or agency securities, with the remainder invested in other government bonds and corporate bonds. |
| (3) | The guaranteed investment contracts (“GICs”) represent contracts with insurance companies measured at the cash surrender value of each contract. The Level 2 valuation reflects that the cash surrender value is based principally on a referenced pool of investment funds with active redemption. |
| (4) | Investments that are measured at fair value using net asset value (“NAV”) per share as a practical expedient have not been classified in the fair value hierarchy. The NAV is based on the value of the underlying investments owned, minus its liabilities, divided by the number of shares outstanding. There are no unfunded commitments related to these investments. Redemption notice period primarily ranges from 0-3 months and redemption frequency windows range from daily to quarterly. |
| (5) | Fixed income funds primarily invest in U.S. government and investment grade corporate bonds. |
| (6) | Consists of investments in underlying hedge fund strategies that are primarily implemented through the use of long and short equity and fixed income securities and derivative instruments such as futures and options. |
| (7) | Multi-Asset funds primarily invest across a variety of asset classes, including global stocks and bonds, as well as alternative strategies. |
| (8) | Real estate is valued using the NAV per unit of funds that are invested in real estate property. The investment value of the real estate property is determined quarterly using independent market appraisals as determined by the investment manager. |
| (9) | This category primarily includes unsettled trades for investments purchased and sold and dividend receivables. |
COLGATE-PALMOLIVE COMPANY
Notes to Consolidated Financial Statements (continued)
(Dollars in Millions Except Share and Per Share Amounts)
Equity securities in the U.S. plans include investments in the Company’s common stock representing 7% of U.S. plan assets at December 31, 2017 and December 31, 2016. No shares of the Company’s common stock were purchased or sold by the U.S. plans in 2017 or 2016. The plans received dividends on the Company’s common stock of $3 in 2017 and 2016.
Other Retiree Benefits
The Company and certain of its subsidiaries provide health care and life insurance benefits for retired employees to the extent not provided by government-sponsored plans.
The Company uses a December 31 measurement date for its defined benefit and other retiree benefit plans. Summarized information for the Company’s defined benefit and other retiree benefit plans is as follows:
COLGATE-PALMOLIVE COMPANY
Notes to Consolidated Financial Statements (continued)
(Dollars in Millions Except Share and Per Share Amounts)
| Pension Plans | Other Retiree Benefit Plans | |||||||||||||||||||||||
| 2017 | 2016 | 2017 | 2016 | 2017 | 2016 | |||||||||||||||||||
| United States | International | |||||||||||||||||||||||
| Change in Benefit Obligations | ||||||||||||||||||||||||
| Benefit obligations at beginning of year | $ | 2,298 | $ | 2,201 | $ | 800 | $ | 802 | $ | 923 | $ | 862 | ||||||||||||
| Service cost | 1 | 1 | 16 | 16 | 13 | 13 | ||||||||||||||||||
| Interest cost | 94 | 105 | 22 | 25 | 40 | 43 | ||||||||||||||||||
| Participants’ contributions | — | — | 2 | 2 | — | — | ||||||||||||||||||
| Acquisitions/plan amendments | — | — | (6 | ) | 1 | — | — | |||||||||||||||||
| Actuarial loss (gain) | 110 | 129 | (11 | ) | 76 | 21 | 39 | |||||||||||||||||
| Foreign exchange impact | — | — | 72 | (47 | ) | 3 | 1 | |||||||||||||||||
| Termination benefits (1) | 24 | 3 | — | — | (3 | ) | 1 | |||||||||||||||||
| Curtailments and settlements | — | — | (11 | ) | (37 | ) | — | — | ||||||||||||||||
| Benefit payments | (164 | ) | (141 | ) | (36 | ) | (36 | ) | (37 | ) | (36 | ) | ||||||||||||
| Other | — | — | (1 | ) | (2 | ) | — | — | ||||||||||||||||
| Benefit obligations at end of year | $ | 2,363 | $ | 2,298 | $ | 847 | $ | 800 | $ | 960 | $ | 923 | ||||||||||||
| Change in Plan Assets | ||||||||||||||||||||||||
| Fair value of plan assets at beginning of year | $ | 1,646 | $ | 1,624 | $ | 509 | $ | 520 | $ | — | $ | 14 | ||||||||||||
| Actual return on plan assets | 225 | 88 | 42 | 46 | — | 1 | ||||||||||||||||||
| Company contributions | 105 | 75 | 30 | 54 | 37 | 21 | ||||||||||||||||||
| Participants’ contributions | — | — | 2 | 2 | — | — | ||||||||||||||||||
| Foreign exchange impact | — | — | 40 | (43 | ) | — | — | |||||||||||||||||
| Settlements and acquisitions | — | — | (11 | ) | (33 | ) | — | — | ||||||||||||||||
| Benefit payments | (164 | ) | (141 | ) | (36 | ) | (36 | ) | (37 | ) | (36 | ) | ||||||||||||
| Other | — | — | (1 | ) | (1 | ) | — | — | ||||||||||||||||
| Fair value of plan assets at end of year | $ | 1,812 | $ | 1,646 | $ | 575 | $ | 509 | $ | — | $ | — | ||||||||||||
| Funded Status | ||||||||||||||||||||||||
| Benefit obligations at end of year | $ | 2,363 | $ | 2,298 | $ | 847 | $ | 800 | $ | 960 | $ | 923 | ||||||||||||
| Fair value of plan assets at end of year | 1,812 | 1,646 | 575 | 509 | — | — | ||||||||||||||||||
| Net amount recognized | $ | (551 | ) | $ | (652 | ) | $ | (272 | ) | $ | (291 | ) | $ | (960 | ) | $ | (923 | ) | ||||||
| Amounts Recognized in Balance Sheet | ||||||||||||||||||||||||
| Noncurrent assets | $ | — | $ | — | $ | 22 | $ | 8 | $ | — | $ | — | ||||||||||||
| Current liabilities | (24 | ) | (24 | ) | (13 | ) | (12 | ) | (44 | ) | (44 | ) | ||||||||||||
| Noncurrent liabilities | (527 | ) | (628 | ) | (281 | ) | (287 | ) | (916 | ) | (879 | ) | ||||||||||||
| Net amount recognized | $ | (551 | ) | $ | (652 | ) | $ | (272 | ) | $ | (291 | ) | $ | (960 | ) | $ | (923 | ) | ||||||
| Amounts Recognized in Accumulated Other Comprehensive Income (Loss) | ||||||||||||||||||||||||
| Actuarial loss | $ | 911 | $ | 962 | $ | 209 | $ | 254 | $ | 338 | $ | 330 | ||||||||||||
| Transition/prior service cost | 1 | 2 | 1 | 5 | (1 | ) | (2 | ) | ||||||||||||||||
| $ | 912 | $ | 964 | $ | 210 | $ | 259 | $ | 337 | $ | 328 | |||||||||||||
| Accumulated benefit obligation | $ | 2,293 | $ | 2,230 | $ | 787 | $ | 739 | $ | — | $ | — |
COLGATE-PALMOLIVE COMPANY
Notes to Consolidated Financial Statements (continued)
(Dollars in Millions Except Share and Per Share Amounts)
| Pension Plans | Other Retiree Benefit Plans | |||||||||||||||||
| 2017 | 2016 | 2017 | 2016 | 2017 | 2016 | |||||||||||||
| United States | International | |||||||||||||||||
| Weighted-Average Assumptions Used to Determine Benefit Obligations | ||||||||||||||||||
| Discount rate | 3.73 | % | 4.27 | % | 2.53 | % | 2.59 | % | 3.80 | % | 4.41 | % | ||||||
| Long-term rate of return on plan assets | 6.60 | % | 6.80 | % | 4.04 | % | 4.14 | % | 6.60 | % | 6.80 | % | ||||||
| Long-term rate of compensation increase | 3.50 | % | 3.50 | % | 2.79 | % | 2.58 | % | 3.50 | % | — | % | ||||||
| ESOP growth rate | — | % | — | % | — | % | — | % | 10.00 | % | 10.00 | % | ||||||
| Medical cost trend rate of increase | — | % | — | % | — | % | — | % | 6.00 | % | 6.33 | % |
| (1) | Represents pension and other retiree benefit enhancements incurred in 2017 and 2016 pursuant to the Global Growth and Efficiency Program. |
The overall investment objective of the plans is to balance risk and return so that obligations to employees are met. The Company evaluates its long-term rate of return on plan assets on an annual basis. In determining the long-term rate of return, the Company considers the nature of the plans’ investments and the historical rates of return. The assumed rate of return as of December 31, 2017 for the U.S. plans was 6.60%. Average annual rates of return for the U.S. plans for the most recent 1-year, 5-year, 10-year, 15-year and 25-year periods were 14%, 8%, 6%, 8%, and 8%, respectively. Similar assessments were performed in determining rates of return on international pension plan assets to arrive at the Company’s 2017 weighted-average rate of return of 4.04%.
The medical cost trend rate of increase assumed in measuring the expected cost of benefits is projected to decrease from 6.00% in 2018 to 4.75% by 2023, remaining at 4.75% for the years thereafter. Changes in the assumed rate can have a significant effect on amounts reported. A 1% change in the assumed medical cost trend rate would have the following approximate effect:
| One percentage point | ||||||||
| Increase | Decrease | |||||||
| Accumulated postretirement benefit obligation | $ | 123 | $ | (100 | ) | |||
| Total of service and interest cost components | 9 | (7 | ) |
Expected mortality is a key assumption in the measurement of pension and other postretirement benefit obligations. For the Company’s U.S. plans, this assumption was updated as of December 31, 2016 in order to reflect the Society of Actuaries’ updated mortality improvement scale published in October 2016. This resulted in a decrease of 1% and 2% to the benefit obligations for the Company’s U.S. pension plans and other postretirement benefits, respectively. This assumption was previously updated for the Company’s U.S. plans as of December 31, 2015 in order to reflect the Society of Actuaries’ mortality tables and mortality improvement scale published in October 2015 which resulted in a decrease of 1% and 2% to the benefit obligations for the Company’s U.S. pension plans and other postretirement benefits, respectively.
COLGATE-PALMOLIVE COMPANY
Notes to Consolidated Financial Statements (continued)
(Dollars in Millions Except Share and Per Share Amounts)
Plans with projected benefit obligations in excess of plan assets and plans with accumulated benefit obligations in excess of plan assets as of December 31 consisted of the following:
| Years Ended December 31, | ||||||||
| 2017 | 2016 | |||||||
| Benefit Obligation Exceeds Fair Value of Plan Assets | ||||||||
| Projected benefit obligation | $ | 2,834 | $ | 2,973 | ||||
| Fair value of plan assets | 1,992 | 2,024 | ||||||
| Accumulated benefit obligation | 2,641 | 2,840 | ||||||
| Fair value of plan assets | 1,905 | 2,003 |
Summarized information regarding the net periodic benefit costs for the Company’s defined benefit and other retiree benefit plans is as follows:
| Pension Plans | Other Retiree Benefit Plans | |||||||||||||||||||||||||||||||||||
| 2017 | 2016 | 2015 | 2017 | 2016 | 2015 | 2017 | 2016 | 2015 | ||||||||||||||||||||||||||||
| United States | International | |||||||||||||||||||||||||||||||||||
| Components of Net Periodic Benefit Cost | ||||||||||||||||||||||||||||||||||||
| Service cost | $ | 1 | $ | 1 | $ | 2 | $ | 16 | $ | 16 | $ | 20 | $ | 13 | $ | 13 | $ | 14 | ||||||||||||||||||
| Interest cost | 94 | 105 | 100 | 22 | 25 | 28 | 40 | 43 | 44 | |||||||||||||||||||||||||||
| Annual ESOP allocation | — | — | — | — | — | — | — | — | — | |||||||||||||||||||||||||||
| Expected return on plan assets | (111 | ) | (109 | ) | (117 | ) | (22 | ) | (23 | ) | (28 | ) | — | (1 | ) | (2 | ) | |||||||||||||||||||
| Amortization of transition and prior service costs (credits) | — | — | — | — | — | 2 | — | — | — | |||||||||||||||||||||||||||
| Amortization of actuarial loss | 48 | 41 | 44 | 10 | 8 | 11 | 13 | 14 | 25 | |||||||||||||||||||||||||||
| Net periodic benefit cost | $ | 32 | $ | 38 | $ | 29 | $ | 26 | $ | 26 | $ | 33 | $ | 66 | $ | 69 | $ | 81 | ||||||||||||||||||
| Other postretirement charges | 24 | 3 | 16 | 4 | 11 | (1 | ) | (3 | ) | 1 | 1 | |||||||||||||||||||||||||
| Total pension cost | $ | 56 | $ | 41 | $ | 45 | $ | 30 | $ | 37 | $ | 32 | $ | 63 | $ | 70 | $ | 82 | ||||||||||||||||||
| Weighted-Average Assumptions Used to Determine Net Periodic Benefit Cost | ||||||||||||||||||||||||||||||||||||
| Discount rate | 4.27 | % | 4.93 | % | 4.24 | % | 2.59 | % | 3.17 | % | 3.06 | % | 4.41 | % | 4.97 | % | 4.36 | % | ||||||||||||||||||
| Long-term rate of return on plan assets | 6.80 | % | 6.80 | % | 6.80 | % | 4.14 | % | 4.62 | % | 5.05 | % | 6.80 | % | 6.80 | % | 6.80 | % | ||||||||||||||||||
| Long-term rate of compensation increase | 3.50 | % | 3.50 | % | 3.50 | % | 2.58 | % | 2.78 | % | 2.83 | % | — | % | — | % | — | % | ||||||||||||||||||
| ESOP growth rate | — | % | — | % | — | % | — | % | — | % | — | % | 10.00 | % | 10.00 | % | 10.00 | % | ||||||||||||||||||
| Medical cost trend rate of increase | — | % | — | % | — | % | — | % | — | % | — | % | 6.33 | % | 6.67 | % | 7.00 | % |
Other postretirement charges in 2017, 2016 and 2015 include pension and other benefit enhancements amounting to $21, $4 and $17 respectively, incurred pursuant to the Global Growth and Efficiency Program. Other postretirement charges in 2017 and 2016 also includes charges of $4 and $11, respectively, in part due to retirements under the Global Growth and Efficiency Program.
COLGATE-PALMOLIVE COMPANY
Notes to Consolidated Financial Statements (continued)
(Dollars in Millions Except Share and Per Share Amounts)
The Company made voluntary contributions of $81, $53 and $0 in 2017, 2016 and 2015, respectively, to its U.S. retirement plans.
The estimated actuarial loss and the estimated transition/prior service cost for defined benefit and other retiree benefit plans that will be amortized from Accumulated other comprehensive income (loss) into net periodic benefit cost over the next fiscal year is as follows:
| Pension Plans | Other Retiree Benefit Plans | |||||||
| Net actuarial loss | $ | 54 | $ | 17 | ||||
| Net transition and prior service cost | — | — |
Expected Contributions and Benefit Payments
Management’s best estimate of voluntary contributions the Company will make to its U.S. postretirement plans for the year ending December 31, 2018 is approximately $75. Actual funding may differ from current estimates depending on the variability of the market value of the assets as compared to the obligation and other market or regulatory conditions.
Total benefit payments to be paid to participants for the year ending December 31, 2018 from the Company’s assets are estimated to be approximately $82. Total benefit payments expected to be paid to participants from plan assets, or directly from the Company’s assets to participants in unfunded plans, are as follows:
| Pension Plans | ||||||||||||||||
| Years Ended December 31, | United States | International | Other Retiree Benefit Plans | Total | ||||||||||||
| 2018 | $ | 137 | $ | 37 | $ | 45 | $ | 219 | ||||||||
| 2019 | 141 | 35 | 46 | 222 | ||||||||||||
| 2020 | 144 | 37 | 46 | 227 | ||||||||||||
| 2021 | 143 | 38 | 47 | 228 | ||||||||||||
| 2022 | 151 | 39 | 48 | 238 | ||||||||||||
| 2023-2027 | 737 | 222 | 250 | 1,209 |
COLGATE-PALMOLIVE COMPANY
Notes to Consolidated Financial Statements (continued)
(Dollars in Millions Except Share and Per Share Amounts)
- Income Taxes
The components of Income before income taxes are as follows for the years ended December 31:
| 2017 | 2016 | 2015 | ||||||||||
| United States | $ | 1,072 | $ | 1,191 | $ | 1,118 | ||||||
| International | 2,415 | 2,547 | 1,645 | |||||||||
| Total Income before income taxes | $ | 3,487 | $ | 3,738 | $ | 2,763 |
The Provision for income taxes consists of the following for the years ended December 31:
| 2017 | 2016 | 2015 | ||||||||||
| United States | $ | 338 | $ | 395 | $ | 376 | ||||||
| International | 975 | 757 | 839 | |||||||||
| Total Provision for income taxes | $ | 1,313 | $ | 1,152 | $ | 1,215 |
Temporary differences between accounting for financial statement purposes and accounting for tax purposes result in the current provision for taxes being higher (lower) than the total provision for income taxes as follows:
| 2017 | 2016 | 2015 | ||||||||||
| Goodwill and intangible assets | $ | 135 | $ | 18 | $ | 3 | ||||||
| Property, plant and equipment | 84 | (3 | ) | (25 | ) | |||||||
| Pension and other retiree benefits | (192 | ) | — | 36 | ||||||||
| Stock-based compensation | (28 | ) | 15 | 11 | ||||||||
| Tax loss and tax credit carryforwards | (4 | ) | 5 | (4 | ) | |||||||
| Other, net | (103 | ) | (106 | ) | 98 | |||||||
| Total deferred tax benefit (provision) | $ | (108 | ) | $ | (71 | ) | $ | 119 |
COLGATE-PALMOLIVE COMPANY
Notes to Consolidated Financial Statements (continued)
(Dollars in Millions Except Share and Per Share Amounts)
The difference between the statutory U.S. federal income tax rate and the Company’s global effective tax rate as reflected in the Consolidated Statements of Income is as follows:
| Percentage of Income before income taxes | 2017 | 2016 | 2015 | ||||||
| Tax at United States statutory rate | 35.0 | % | 35.0 | % | 35.0 | % | |||
| State income taxes, net of federal benefit | 0.5 | 0.5 | 1.0 | ||||||
| Earnings taxed at other than United States statutory rate | (3.4 | ) | (2.7 | ) | (3.6 | ) | |||
| Charge for U.S. tax reform(1) | 7.9 | — | — | ||||||
| Excess tax benefits from stock-based compensation(2) | (1.4 | ) | — | — | |||||
| (Benefit) charge for foreign tax matters(3) | — | (0.8 | ) | 0.5 | |||||
| (Benefit) from Venezuela remeasurement(4) | — | (5.6 | ) | — | |||||
| Tax charge on incremental repatriation of foreign earnings(4) | — | 5.6 | — | ||||||
| Venezuela deconsolidation(5) | — | — | 12.8 | ||||||
| Other, net | (0.9 | ) | (1.2 | ) | (1.7 | ) | |||
| Effective tax rate | 37.7 | % | 30.8 | % | 44.0 | % |
| (1) | On December 22, 2017, the Tax Cuts and Jobs Act (the “TCJA” or “U.S. tax reform”) was enacted which, among other things, lowered the U.S. corporate income tax rate to 21% from 35% and established a modified territorial system requiring a mandatory deemed repatriation tax on undistributed earnings of foreign subsidiaries. Beginning in 2018, the TCJA also requires a minimum tax on certain future earnings generated by foreign subsidiaries while providing for future tax-free repatriation of such earnings through a 100% dividends-received deduction. In accordance with ASC 740, Income Taxes, and Staff Accounting Bulletin 118, the Company recognized a provisional charge in the fourth quarter of 2017 of $275 related to the TCJA based on its initial analysis using available information and estimates. The provisional charge is comprised of $451 related to the one-time deemed repatriation of accumulated earnings of foreign subsidiaries and related withholding taxes and $20 related primarily to the remeasurement of net deferred tax assets as a result of the reduction in the corporate income tax rate, which are offset by $196 of income taxes which had been previously provided for planned repatriations of undistributed earnings of foreign subsidiaries. As a result, applicable U.S. and foreign taxes have been provided on substantially all of the Company’s accumulated earnings of foreign subsidiaries previously considered indefinitely reinvested. Given the significant complexity of the TCJA, anticipated guidance from the U.S. Treasury about implementing the TCJA and the potential for additional guidance from the Securities and Exchange Commission (“SEC”) or the FASB related to the TCJA or additional information becoming available, the Company’s provisional charge may be adjusted during 2018 and is expected to be finalized no later than the fourth quarter of 2018. Other provisions of the TCJA that impact future tax years are still being assessed. |
| (2) | As a result of adopting ASU No. 2016-09 “Compensation–Stock Compensation (Topic 718): Improvements to Employee Share-Based Payment Accounting,” effective January 1, 2017, the Company recognized excess tax benefits from stock-based compensation of $47 (resulting from an increase in the fair value of an award from the grant date to the vesting or exercise date, as applicable) in the Provision for income taxes as a discrete item during the year ended December 31, 2017. These amounts may not necessarily be indicative of future amounts that may be recognized as any excess tax benefits from stock-based compensation recognized would be dependent on future stock price, employee exercise behavior and applicable tax rates. Prior to January 1, 2017, excess tax benefits from stock-based compensation were recognized in equity. See Note 2, Summary of Significant Accounting Policies - Recent Accounting Pronouncements for additional information. |
| (3) | The benefit from a tax matter in 2016 relates to several Supreme Court and Administrative Court rulings in a foreign jurisdiction allowing certain tax deductions which had the effect of reversing prior decisions. The charge for a tax matter in 2015 relates to several Supreme Court rulings in a foreign jurisdiction disallowing certain tax deductions which had the effect of reversing prior decisions. |
| (4) | The effective tax rate in 2016 included a $210 U.S. income tax benefit recognized in the first quarter of 2016 principally related to changes in Venezuela’s foreign exchange regime implemented in March 2016. Although, effective December 31, 2015, the operating results of CP Venezuela are no longer included in the Company’s Consolidated Financial Statements, under current tax rules, the Company is required to continue including CP Venezuela’s results in its consolidated U.S. federal income tax return. In order to fully utilize the above mentioned $210 tax benefit in 2016, the Company repatriated an incremental $1,500 of earnings of foreign subsidiaries it previously considered indefinitely reinvested outside of the U.S., and accordingly, recorded a tax charge of $210 during the first quarter of 2016. |
| (5) | See Note 14, Venezuela. |
COLGATE-PALMOLIVE COMPANY
Notes to Consolidated Financial Statements (continued)
(Dollars in Millions Except Share and Per Share Amounts)
The components of deferred tax assets (liabilities) are as follows at December 31:
| 2017 | 2016 | |||||||
| Deferred tax liabilities: | ||||||||
| Goodwill and intangible assets | $ | (311 | ) | $ | (451 | ) | ||
| Property, plant and equipment | (306 | ) | (380 | ) | ||||
| Other | (182 | ) | (202 | ) | ||||
| (799 | ) | (1,033 | ) | |||||
| Deferred tax assets: | ||||||||
| Pension and other retiree benefits | 375 | 599 | ||||||
| Tax loss and tax credit carryforwards | 39 | 34 | ||||||
| Accrued liabilities | 197 | 246 | ||||||
| Stock-based compensation | 90 | 127 | ||||||
| Other | 82 | 82 | ||||||
| 783 | 1,088 | |||||||
| Net deferred income taxes | $ | (16 | ) | $ | 55 |
| 2017 | 2016 | |||||||
| Deferred taxes included within: | ||||||||
| Assets: | ||||||||
| Deferred income taxes | $ | 188 | $ | 301 | ||||
| Liabilities: | ||||||||
| Deferred income taxes | (204 | ) | (246 | ) | ||||
| Net deferred income taxes | $ | (16 | ) | $ | 55 |
In addition, net tax benefit of $37 in 2017, net tax benefit of $85 in 2016, and net tax expense of $78 in 2015 were recorded directly through equity. The net tax benefit in 2017 predominantly includes current and future tax impacts related to benefit plans. The amounts in 2016 and 2015 include current and future tax impacts related to employee equity compensation and benefit plans.
The Company uses a comprehensive model to recognize, measure, present and disclose in its financial statements uncertain tax positions that the Company has taken or expects to take on an income tax return.
COLGATE-PALMOLIVE COMPANY
Notes to Consolidated Financial Statements (continued)
(Dollars in Millions Except Share and Per Share Amounts)
Unrecognized tax benefits activity for the years ended December 31, 2017, 2016 and 2015 is summarized below:
| 2017 | 2016 | 2015 | ||||||||||
| Unrecognized tax benefits: | ||||||||||||
| Balance, January 1 | $ | 201 | $ | 186 | $ | 218 | ||||||
| Increases as a result of tax positions taken during the current year | 13 | 9 | 20 | |||||||||
| Decreases of tax positions taken during prior years | (9 | ) | (45 | ) | (25 | ) | ||||||
| Increases of tax positions taken during prior years | 15 | 71 | 61 | |||||||||
| Decreases as a result of settlements with taxing authorities and the expiration of statutes of limitations | (15 | ) | (18 | ) | (79 | ) | ||||||
| Effect of foreign currency rate movements | 9 | (2 | ) | (9 | ) | |||||||
| Balance, December 31 | $ | 214 | $ | 201 | $ | 186 |
If all of the unrecognized tax benefits for 2017 above were recognized, approximately $205 would impact the effective tax rate and would result in a cash outflow of approximately $185. Although it is possible that the amount of unrecognized benefits with respect to our uncertain tax positions will increase or decrease in the next 12 months, the Company does not expect material changes.
The Company recognized approximately $11, $2 and $2 of interest expense related to the above unrecognized tax benefits within income tax expense in 2017, 2016 and 2015, respectively. The Company had accrued interest of approximately $28, $17 and $16 as of December 31, 2017, 2016 and 2015, respectively.
The Company and its subsidiaries file U.S. federal income tax returns as well as income tax returns in many state and foreign jurisdictions. All U.S. federal income tax returns through December 31, 2011 have been audited by the IRS and there are limited matters which the Company plans to appeal for years 2010 through 2011, the settlement of which is not expected to have a material adverse effect on the Company’s results of operations, cash flows or financial condition. With a few exceptions, the Company is no longer subject to U.S. state and local income tax examinations for income tax returns through December 31, 2011. In addition, the Company has subsidiaries in various foreign jurisdictions that have statutes of limitations for tax audits generally ranging from three to six years.
COLGATE-PALMOLIVE COMPANY
Notes to Consolidated Financial Statements (continued)
(Dollars in Millions Except Share and Per Share Amounts)
- Earnings Per Share
For the years ended December 31, 2017, 2016 and 2015, earnings per share were as follows:
| 2017 | 2016 | 2015 | ||||||||||||||||||||||||||||||
| Net income attributable to Colgate-Palmolive Company | Shares (millions) | Per Share | Net income attributable to Colgate-Palmolive Company | Shares (millions) | Per Share | Net income attributable to Colgate-Palmolive Company | Shares (millions) | Per Share | ||||||||||||||||||||||||
| Basic EPS | $ | 2,024 | 881.8 | $ | 2.30 | $ | 2,441 | 891.8 | $ | 2.74 | $ | 1,384 | 902.2 | $ | 1.53 | |||||||||||||||||
| Stock options and restricted stock units | 6.0 | 6.6 | 7.5 | |||||||||||||||||||||||||||||
| Diluted EPS | $ | 2,024 | 887.8 | $ | 2.28 | $ | 2,441 | 898.4 | $ | 2.72 | $ | 1,384 | 909.7 | $ | 1.52 |
Basic earnings per common share is computed by dividing net income available for common stockholders by the weighted-average number of shares of common stock outstanding for the period.
Diluted earnings per common share is computed using the treasury stock method on the basis of the weighted-average number of shares of common stock plus the dilutive effect of potential common shares outstanding during the period. Dilutive potential common shares include outstanding stock options and restricted stock units.
As of December 31, 2017, 2016 and 2015, the average number of stock options that were anti-dilutive and not included in diluted earnings per share calculations were 11,056,725, 3,187,485 and 3,228,359, respectively. As of December 31, 2017, 2016 and 2015, the average number of restricted stock units that were anti-dilutive and not included in diluted earnings per share calculations were 91, 2,693 and 120, respectively.
- Commitments and Contingencies
Minimum rental commitments under noncancellable operating leases, primarily for office and warehouse facilities, are $188 in 2018, $163 in 2019, $143 in 2020, $106 in 2021, $93 in 2022 and $44 thereafter. Rental expense amounted to $211 in 2017, $204 in 2016 and $214 in 2015. Capital leases included in fixed assets, contingent rentals and sublease income are not significant. The Company has various contractual commitments to purchase raw, packaging and other materials totaling approximately $467 at December 31, 2017.
As a global company serving consumers in more than 200 countries and territories, the Company is routinely subject to a wide variety of legal proceedings. These include disputes relating to intellectual property, contracts, product liability, marketing, advertising, foreign exchange controls, antitrust and trade regulation, as well as labor and employment, pension, privacy, environmental and tax matters, and consumer class actions. Management proactively reviews and monitors the Company’s exposure to, and the impact of, environmental matters. The Company is party to various environmental matters and, as such, may be responsible for all or a portion of the cleanup, restoration and post-closure monitoring of several sites.
The Company establishes accruals for loss contingencies when it has determined that a loss is probable and that the amount of loss, or range of loss, can be reasonably estimated. Any such accruals are adjusted thereafter as appropriate to reflect changes in circumstances.
COLGATE-PALMOLIVE COMPANY
Notes to Consolidated Financial Statements (continued)
(Dollars in Millions Except Share and Per Share Amounts)
The Company also determines estimates of reasonably possible losses or ranges of reasonably possible losses in excess of related accrued liabilities, if any, when it has determined that a loss is reasonably possible and it is able to determine such estimates. For those matters disclosed below for which the amount of any potential losses can be reasonably estimated, the Company currently estimates that the aggregate range of reasonably possible losses in excess of any accrued liabilities is $0 to approximately $250 (based on current exchange rates). The estimates included in this amount are based on the Company’s analysis of currently available information and, as new information is obtained, these estimates may change. Due to the inherent subjectivity of the assessments and the unpredictability of outcomes of legal proceedings, any amounts accrued or included in this aggregate amount may not represent the ultimate loss to the Company. Thus, the Company’s exposure and ultimate losses may be higher or lower, and possibly significantly so, than the amounts accrued or the range disclosed above.
Based on current knowledge, management does not believe that the ultimate resolution of loss contingencies arising from the matters discussed herein will have a material effect on the Company’s consolidated financial position or its ongoing results of operations or cash flows. However, in light of the inherent uncertainties noted above, an adverse outcome in one or more matters could be material to the Company’s results of operations or cash flows for any particular quarter or year.
Brazilian Matters
There are certain tax and civil proceedings outstanding, as described below, related to the Company’s 1995 acquisition of the Kolynos oral care business from Wyeth (the “Seller”).
The Brazilian internal revenue authority has disallowed interest deductions and foreign exchange losses taken by the Company’s Brazilian subsidiary for certain years in connection with the financing of the Kolynos acquisition. The tax assessments with interest, penalties and any court-mandated fees, at the current exchange rate, are approximately $165. This amount includes additional assessments received from the Brazilian internal revenue authority in April 2016 relating to net operating loss carryforwards used by the Company’s Brazilian subsidiary to offset taxable income that had also been deducted from the authority’s original assessments. The Company has been disputing the disallowances by appealing the assessments since October 2001. Appeals are currently pending at the administrative level. In the event the Company is ultimately unsuccessful in its administrative appeals, further appeals are available within the Brazilian federal courts.
In September 2015, the Company lost one of its appeals at the administrative level and filed a lawsuit in Brazilian federal court. In February 2017, the Company lost an additional administrative appeal and filed a similar action in Brazilian federal court. Although there can be no assurances, management believes, based on the opinion of its Brazilian legal counsel, that the disallowances are without merit and that the Company should ultimately prevail. The Company is challenging these disallowances vigorously.
In July 2002, the Brazilian Federal Public Attorney filed a civil action against the federal government of Brazil, Laboratorios Wyeth-Whitehall Ltda. (the Brazilian subsidiary of the Seller) and the Company, as represented by its Brazilian subsidiary, in the 6th. Lower Federal Court in the City of São Paulo, seeking to annul an April 2000 decision by the Brazilian Board of Tax Appeals that found in favor of the Seller’s Brazilian subsidiary on the issue of whether it had incurred taxable capital gains as a result of the divestiture of Kolynos. The action seeks to make the Company’s Brazilian subsidiary jointly and severally liable for any tax due from the Seller’s Brazilian subsidiary. The case has been pending since 2002, and the Lower Federal Court has not issued a decision. Although there can be no assurances, management believes, based on the opinion of its Brazilian legal counsel, that the Company should ultimately prevail in this action. The Company is challenging this action vigorously.
COLGATE-PALMOLIVE COMPANY
Notes to Consolidated Financial Statements (continued)
(Dollars in Millions Except Share and Per Share Amounts)
In December 2005, the Brazilian internal revenue authority issued to the Company’s Brazilian subsidiary a tax assessment with interest, penalties and any court-mandated fees of approximately $74, at the current exchange rate, based on a claim that certain purchases of U.S. Treasury bills by the subsidiary and their subsequent disposition during the period 2000 to 2001 were subject to a tax on foreign exchange transactions. The Company had been disputing the assessment within the internal revenue authority’s administrative appeals process. However, in November 2015, the Superior Chamber of Administrative Tax Appeals denied the Company’s final administrative appeal and the Company has filed a lawsuit in the Brazilian federal court. In the event the Company is unsuccessful in this filing, further appeals are available within the Brazilian federal courts. Although there can be no assurances, management believes, based on the opinion of its Brazilian legal counsel, that the tax assessment is without merit and that the Company should ultimately prevail. The Company is challenging this assessment vigorously.
Competition Matters
Certain of the Company’s subsidiaries have historically been subject to investigations, and, in some cases, fines by governmental authorities in a number of countries related to alleged competition law violations. Substantially all of these matters also involved other consumer goods companies and/or retail customers. The Company’s policy is to comply with antitrust and competition laws and, if a violation of any such laws is found, to take appropriate remedial action and to cooperate fully with any related governmental inquiry. The status of pending competition law matters as of December 31, 2017 is set forth below.
| ▪ | In December 2014, the French competition law authority found that 13 consumer goods companies, including the Company’s French subsidiary, exchanged competitively sensitive information related to the French home care and personal care sectors, for which the Company’s French subsidiary was fined $57. In addition, as a result of the Company’s acquisition of the Sanex personal care business in 2011 from Unilever N.V. and Unilever PLC (together with Unilever N.V., “Unilever”), pursuant to a Business and Share Sale and Purchase Agreement (the “Sale and Purchase Agreement”), the French competition law authority found that the Company’s French subsidiary, along with Hillshire Brands Company (formerly Sara Lee Corporation (“Sara Lee”)), were jointly and severally liable for fines of $25 assessed against Sara Lee’s French subsidiary. The Company is entitled to indemnification for this fine from Unilever as provided in the Sale and Purchase Agreement. The fines were confirmed by the Court of Appeal in October 2016. The Company is appealing the decision of the Court of Appeal on behalf of the Company and Sara Lee in the French Supreme Court. |
| ▪ | In July 2014, the Greek competition law authority issued a statement of objections alleging a restriction of parallel imports into Greece. The Company responded to this statement of objections. In July 2017, the Company received the decision from the Greek competition law authority in which the Company was fined $11. The Company is appealing the decision to the Greek courts. |
Talcum Powder Matters
The Company has been named as a defendant in civil actions alleging that certain talcum powder products that were sold prior to 1996 were contaminated with asbestos. Most of these actions involve a number of co-defendants from a variety of different industries, including suppliers of asbestos and manufacturers of products that, unlike the Company’s products, were designed to contain asbestos. As of December 31, 2017, there were 193 individual cases pending against the Company in state and federal courts throughout the United States as compared to 115 cases as of December 31, 2016. During the year ended December 31, 2017, 132 new cases were filed and 54 cases were resolved by voluntary dismissal, appeal in the Company’s favor or settlement. The value of settlements in the years presented was not material, either individually or in the aggregate, to each such period’s results of operations.
The Company believes that a significant portion of its costs incurred in defending and resolving these claims will be covered by insurance policies issued by several primary and excess insurance carriers, subject to deductibles, exclusions, retentions and policy limits.
COLGATE-PALMOLIVE COMPANY
Notes to Consolidated Financial Statements (continued)
(Dollars in Millions Except Share and Per Share Amounts)
While the Company and its legal counsel believe that these cases are without merit and intend to challenge them vigorously, there can be no assurances regarding the ultimate resolution of these matters. Since the amount of any potential losses from these cases currently cannot be reasonably estimated, the range of reasonably possible losses in excess of accrued liabilities disclosed above does not include any amount relating to these cases.
N8
The Company was a defendant in a lawsuit that was brought in Utah federal court by N8 Medical, Inc. (“N8 Medical”), Brigham Young University (“BYU”) and N8 Pharmaceuticals, Inc. (“N8 Pharma”). The complaint, originally filed in November 2013, alleged breach of contract and other torts arising out of the Company’s evaluation of a technology owned by BYU and licensed, at various times, to Ceragenix Pharmaceuticals, Inc., now in bankruptcy, N8 Medical and N8 Pharma.
In 2016, the Company resolved the claims brought by BYU and N8 Medical. These claims were each resolved in an amount that is not material to the Company’s results of operations. In the first quarter of 2017, the court dismissed the claims of N8 Pharma and, in the third quarter of 2017, N8 Pharma appealed the decision.
ERISA Matter
In June 2016, a putative class action claiming that residual annuity payments made to certain participants in the Colgate-Palmolive Company Employees’ Retirement Income Plan (the “Plan”) did not comply with the Employee Retirement Income Security Act was filed against the Plan, the Company and certain individuals in the United States District Court for the Southern District of New York. This action has been certified as a class action. The relief sought includes recalculation of benefits, pre- and post-judgment interest and attorneys’ fees. The Company is contesting this action vigorously. Since the amount of any potential loss from this case currently cannot be reasonably estimated, the range of reasonably possible losses in excess of accrued liabilities disclosed above does not include any amount relating to the case.
COLGATE-PALMOLIVE COMPANY
Notes to Consolidated Financial Statements (continued)
(Dollars in Millions Except Share and Per Share Amounts)
- Venezuela
Effective December 31, 2015, the Company concluded it no longer met the accounting criteria for consolidation of CP Venezuela and began accounting for CP Venezuela using the cost method of accounting. As such, effective December 31, 2015, the Company’s Consolidated Balance Sheet no longer includes the assets and liabilities of CP Venezuela. As a result of this change in accounting, the Company recorded an aftertax charge of $1,058 ($1,084 pretax) or $1.16 per diluted share in 2015. The charge primarily consists of an impairment of the Company’s investment in CP Venezuela of $952, which includes intercompany receivables from CP Venezuela, and $111 related to the reclassification of cumulative translation losses. Prior periods have not been restated and CP Venezuela’s Net sales, Operating profit and Net income are included in the Company’s Consolidated Statements of Income through December 31, 2015.
Since January 1, 2016, under the cost method of accounting, the Company no longer includes the local operating results of CP Venezuela in its Consolidated Financial Statements and includes income relating to CP Venezuela only to the extent it receives cash for sales of inventory to CP Venezuela or for dividends or royalties remitted by CP Venezuela, all of which have been immaterial. Although CP Venezuela’s local operating results are no longer included in the Company’s Consolidated Financial Statements for accounting purposes, under current tax rules, the Company is required to continue including CP Venezuela in its consolidated U.S. federal income tax return. In the first quarter of 2016, provision for income taxes included a $210 U.S. income tax benefit principally related to changes in Venezuela’s foreign exchange regime implemented in March 2016. See Note 11, Income Taxes for additional details.
Prior to the change in accounting, CP Venezuela’s functional currency was the U.S. dollar since Venezuela had been designated hyper-inflationary and, as such, Venezuelan currency fluctuations were reported in income. The Company remeasured the financial statements of CP Venezuela at the end of each month at the rate at which it expected to remit future dividends which, based on the advice of legal counsel, was the SICAD rate (formerly known as the SICAD I rate). During the year ended December 31, 2015, the Company incurred pretax losses of $34 ($22 aftertax or $0.02 per diluted common share) related to the remeasurement of CP Venezuela’s local currency-denominated net monetary assets at the quarter-end SICAD rate for the second and third quarters of 2015. The SICAD rate did not revalue during the fourth quarter of 2015 and was 13.50 bolivares per dollar as of December 31, 2015.
Included in the remeasurement losses during 2015 were charges related to the devaluation-protected bonds issued by the Venezuelan government and held by CP Venezuela. Because the official exchange rate remained at 6.30 bolivares per dollar, the devaluation-protected bonds did not revalue at the SICAD rate but remained at the official exchange rate, resulting in an impairment in the fair value of the bonds.
- Segment Information
The Company operates in two product segments: Oral, Personal and Home Care; and Pet Nutrition.
The operations of the Oral, Personal and Home Care product segment are managed geographically in five reportable operating segments: North America, Latin America, Europe, Asia Pacific and Africa/Eurasia.
The Company evaluates segment performance based on several factors, including Operating profit. The Company uses Operating profit as a measure of operating segment performance because it excludes the impact of Corporate-driven decisions related to interest expense and income taxes.
The accounting policies of the operating segments are generally the same as those described in Note 2, Summary of Significant Accounting Policies. Intercompany sales have been eliminated. Corporate operations include costs related to stock options and restricted stock units, research and development costs, Corporate overhead costs, restructuring and related implementation costs and gains and losses on sales of non-core product lines and assets. The Company reports these items within Corporate operations as they relate to Corporate-based responsibilities and decisions and are not included in the internal measures of segment operating performance used by the Company to measure the underlying performance of the operating segments.
COLGATE-PALMOLIVE COMPANY
Notes to Consolidated Financial Statements (continued)
(Dollars in Millions Except Share and Per Share Amounts)
Approximately 75% of the Company’s Net sales are generated from markets outside the U.S., with approximately 50% of the Company’s Net sales coming from emerging markets (which consist of Latin America, Asia (excluding Japan), Africa/Eurasia and Central Europe). Oral, Personal and Home Care sales to Wal-Mart Stores, Inc. and its affiliates represent approximately 11% of the Company’s Net sales in 2017. No other customer represents more than 10% of Net sales.
In 2017, Corporate Operating profit (loss) includes charges of $333 resulting from the Global Growth and Efficiency Program. In 2016, Corporate Operating profit (loss) includes charges of $228 resulting from the Global Growth and Efficiency Program and $17 for a litigation matter and a gain of $97 on the sale of land in Mexico. In 2015, Corporate Operating profit (loss) included charges of $1,084 related to the deconsolidation of the Company’s Venezuelan operations, $254 related to the Global Growth and Efficiency Program, $34 related to the remeasurement of CP Venezuela’s local currency-denominated net monetary assets as a result of effective devaluations and $14 for a litigation matter and a gain of $187 on the sale of the Company’s laundry detergent business in the South Pacific.
| 2017 | 2016 | 2015 | ||||||||||
| Net sales | ||||||||||||
| Oral, Personal and Home Care | ||||||||||||
| North America(1) | $ | 3,117 | $ | 3,183 | $ | 3,149 | ||||||
| Latin America | 3,887 | 3,650 | 4,327 | |||||||||
| Europe | 2,394 | 2,342 | 2,411 | |||||||||
| Asia Pacific | 2,781 | 2,796 | 2,937 | |||||||||
| Africa/Eurasia | 983 | 960 | 998 | |||||||||
| Total Oral, Personal and Home Care | 13,162 | 12,931 | 13,822 | |||||||||
| Pet Nutrition(2) | 2,292 | 2,264 | 2,212 | |||||||||
| Total Net sales | $ | 15,454 | $ | 15,195 | $ | 16,034 |
| (1) | Net sales in the U.S. for Oral, Personal and Home Care were $2,865, $2,932 and $2,896 in 2017, 2016 and 2015, respectively. |
| (2) | Net sales in the U.S. for Pet Nutrition were $1,246, $1,243 and $1,223 in 2017, 2016 and 2015, respectively. |
COLGATE-PALMOLIVE COMPANY
Notes to Consolidated Financial Statements (continued)
(Dollars in Millions Except Share and Per Share Amounts)
| 2017 | 2016 | 2015 | ||||||||||
| Operating profit | ||||||||||||
| Oral, Personal and Home Care | ||||||||||||
| North America | $ | 986 | $ | 1,030 | $ | 974 | ||||||
| Latin America | 1,162 | 1,132 | 1,209 | |||||||||
| Europe | 599 | 579 | 615 | |||||||||
| Asia Pacific | 841 | 887 | 888 | |||||||||
| Africa/Eurasia | 179 | 186 | 178 | |||||||||
| Total Oral, Personal and Home Care | 3,767 | 3,814 | 3,864 | |||||||||
| Pet Nutrition | 653 | 653 | 612 | |||||||||
| Corporate | (831 | ) | (630 | ) | (1,687 | ) | ||||||
| Total Operating profit | $ | 3,589 | $ | 3,837 | $ | 2,789 |
| 2017 | 2016 | 2015 | ||||||||||
| Capital expenditures | ||||||||||||
| Oral, Personal and Home Care | ||||||||||||
| North America | $ | 74 | $ | 151 | $ | 207 | ||||||
| Latin America | 127 | 94 | 110 | |||||||||
| Europe | 63 | 51 | 40 | |||||||||
| Asia Pacific | 125 | 120 | 121 | |||||||||
| Africa/Eurasia | 13 | 17 | 12 | |||||||||
| Total Oral, Personal and Home Care | 402 | 433 | 490 | |||||||||
| Pet Nutrition | 33 | 38 | 34 | |||||||||
| Corporate | 118 | 122 | 167 | |||||||||
| Total Capital expenditures | $ | 553 | $ | 593 | $ | 691 |
| 2017 | 2016 | 2015 | ||||||||||
| Depreciation and amortization | ||||||||||||
| Oral, Personal and Home Care | ||||||||||||
| North America | $ | 58 | $ | 54 | $ | 47 | ||||||
| Latin America | 82 | 76 | 88 | |||||||||
| Europe | 74 | 64 | 67 | |||||||||
| Asia Pacific | 101 | 96 | 99 | |||||||||
| Africa/Eurasia | 8 | 7 | 8 | |||||||||
| Total Oral, Personal and Home Care | 323 | 297 | 309 | |||||||||
| Pet Nutrition | 53 | 53 | 52 | |||||||||
| Corporate | 99 | 93 | 88 | |||||||||
| Total Depreciation and amortization | $ | 475 | $ | 443 | $ | 449 |
COLGATE-PALMOLIVE COMPANY
Notes to Consolidated Financial Statements (continued)
(Dollars in Millions Except Share and Per Share Amounts)
| 2017 | 2016 | 2015 | ||||||||||
| Identifiable assets | ||||||||||||
| Oral, Personal and Home Care | ||||||||||||
| North America | $ | 2,608 | $ | 2,685 | $ | 2,622 | ||||||
| Latin America | 2,423 | 2,314 | 2,314 | |||||||||
| Europe | 3,781 | 3,554 | 3,308 | |||||||||
| Asia Pacific | 2,244 | 2,006 | 2,031 | |||||||||
| Africa/Eurasia | 544 | 499 | 476 | |||||||||
| Total Oral, Personal and Home Care | 11,600 | 11,058 | 10,751 | |||||||||
| Pet Nutrition | 1,026 | 1,009 | 1,006 | |||||||||
| Corporate(1) | 50 | 56 | 178 | |||||||||
| Total Identifiable assets(2) | $ | 12,676 | $ | 12,123 | $ | 11,935 |
| (1) | In 2017, Corporate identifiable assets primarily consist of derivative instruments (5%) and investments in equity securities (86%). In 2016, Corporate identifiable assets primarily consist of derivative instruments (24%) and investments in equity securities (68%). In 2015, Corporate identifiable assets primarily consist of derivative instruments (76%) and investments in equity securities (23%). |
| (2) | Long-lived assets in the U.S., primarily property, plant and equipment and goodwill and other intangibles represented approximately one-third of total long-lived assets of $7,908, $7,642 and $7,420 in 2017, 2016 and 2015, respectively. |
- Supplemental Income Statement Information
| Other (income) expense, net | 2017 | 2016 | 2015 | |||||||||
| Global Growth and Efficiency Program | $ | 169 | $ | 105 | $ | 170 | ||||||
| Amortization of intangible assets | 35 | 33 | 33 | |||||||||
| Gain on sale of land in Mexico | — | (97 | ) | — | ||||||||
| Charges for litigation matters | — | 17 | 14 | |||||||||
| Venezuela remeasurement charges | — | — | 34 | |||||||||
| Gain on sale of South Pacific laundry detergent business | — | — | (187 | ) | ||||||||
| Equity income | (11 | ) | (10 | ) | (8 | ) | ||||||
| Other, net | 1 | (11 | ) | 6 | ||||||||
| Total Other (income) expense, net | $ | 194 | $ | 37 | $ | 62 |
| Interest (income) expense, net | 2017 | 2016 | 2015 | |||||||||
| Interest incurred | $ | 156 | $ | 155 | $ | 139 | ||||||
| Interest capitalized | (3 | ) | (6 | ) | (6 | ) | ||||||
| Interest income | (51 | ) | (50 | ) | (107 | ) | ||||||
| Total Interest (income) expense, net | $ | 102 | $ | 99 | $ | 26 |
| 2017 | 2016 | 2015 | ||||||||||
| Research and development | $ | 285 | $ | 289 | $ | 274 | ||||||
| Advertising | $ | 1,573 | $ | 1,428 | $ | 1,491 |
COLGATE-PALMOLIVE COMPANY
Notes to Consolidated Financial Statements (continued)
(Dollars in Millions Except Share and Per Share Amounts)
- Supplemental Balance Sheet Information
Inventories by major class are as follows at December 31:
| Inventories | 2017 | 2016 | ||||||
| Raw materials and supplies | $ | 267 | $ | 266 | ||||
| Work-in-process | 42 | 42 | ||||||
| Finished goods | 912 | 863 | ||||||
| Total Inventories | $ | 1,221 | $ | 1,171 |
Inventories valued under LIFO amounted to $289 and $278 at December 31, 2017 and 2016, respectively. The excess of current cost over LIFO cost at the end of each year was $63 and $30, respectively. The liquidations of LIFO inventory quantities had no material effect on income in 2017, 2016 and 2015.
| Property, plant and equipment, net | 2017 | 2016 | ||||||
| Land | $ | 159 | $ | 147 | ||||
| Buildings | 1,655 | 1,544 | ||||||
| Manufacturing machinery and equipment | 5,165 | 4,971 | ||||||
| Other equipment | 1,481 | 1,280 | ||||||
| 8,460 | 7,942 | |||||||
| Accumulated depreciation | (4,388 | ) | (4,102 | ) | ||||
| Total Property, plant and equipment, net | $ | 4,072 | $ | 3,840 |
| Other accruals | 2017 | 2016 | ||||||
| Accrued advertising and coupon redemption | $ | 510 | $ | 491 | ||||
| Accrued payroll and employee benefits | 325 | 309 | ||||||
| Accrued taxes other than income taxes | 123 | 112 | ||||||
| Restructuring accrual | 181 | 112 | ||||||
| Pension and other retiree benefits | 81 | 80 | ||||||
| Accrued interest | 34 | 29 | ||||||
| Derivatives | 20 | 4 | ||||||
| Other | 557 | 590 | ||||||
| Total Other accruals | $ | 1,831 | $ | 1,727 |
| Other liabilities | 2017 | 2016 | ||||||
| Pension and other retiree benefits | $ | 1,724 | $ | 1,794 | ||||
| Restructuring accrual | 53 | 69 | ||||||
| Other | 478 | 172 | ||||||
| Total Other liabilities | $ | 2,255 | $ | 2,035 |
COLGATE-PALMOLIVE COMPANY
Notes to Consolidated Financial Statements (continued)
(Dollars in Millions Except Share and Per Share Amounts)
- Supplemental Other Comprehensive Income (Loss) Information
Other comprehensive income (loss) components attributable to Colgate-Palmolive Company before tax and net of tax during the years ended December 31 were as follows:
| 2017 | 2016 | 2015 | |||||||||||||||||||
| Pre-tax | Net of Tax | Pre-tax | Net of Tax | Pre-tax | Net of Tax | ||||||||||||||||
| Cumulative translation adjustments | $ | 218 | $ | 285 | $ | (97 | ) | $ | (125 | ) | $ | (721 | ) | $ | (745 | ) | |||||
| Reclassification due to Venezuela deconsolidation(1) | — | — | — | — | 111 | 111 | |||||||||||||||
| Cumulative translation adjustments | 218 | 285 | (97 | ) | (125 | ) | (610 | ) | (634 | ) | |||||||||||
| Pension and other benefits: | |||||||||||||||||||||
| Net actuarial gain (loss), prior service costs and settlements during the period | 21 | 9 | (231 | ) | (152 | ) | 182 | 115 | |||||||||||||
| Amortization of net actuarial loss, transition and prior service costs(2) | 71 | 45 | 63 | 43 | 82 | 52 | |||||||||||||||
| Reclassification due to Venezuela deconsolidation(1) | — | — | — | — | 44 | 29 | |||||||||||||||
| Retirement Plan and other retiree benefit adjustments | 92 | 54 | (168 | ) | (109 | ) | 308 | 196 | |||||||||||||
| Available-for-sale securities: | |||||||||||||||||||||
| Unrealized gains (losses) on available- for-sale securities(3) | — | — | — | — | (18 | ) | (12 | ) | |||||||||||||
| Reclassification of (gains) losses into net earnings on available- for-sale securities(4) | — | — | (1 | ) | (1 | ) | 14 | 11 | |||||||||||||
| Reclassification due to Venezuela deconsolidation(1) | — | — | — | — | (10 | ) | (6 | ) | |||||||||||||
| Gains (losses) on available-for-sale securities | — | — | (1 | ) | (1 | ) | (14 | ) | (7 | ) | |||||||||||
| Cash flow hedges: | |||||||||||||||||||||
| Unrealized gains (losses) on cash flow hedges | (25 | ) | (16 | ) | 11 | 8 | 18 | 12 | |||||||||||||
| Reclassification of (gains) losses into net earnings on cash flow hedges(5) | 3 | 2 | (4 | ) | (3 | ) | (16 | ) | (10 | ) | |||||||||||
| Gains (losses) on cash flow hedges | (22 | ) | (14 | ) | 7 | 5 | 2 | 2 | |||||||||||||
| Total Other comprehensive income (loss) | $ | 288 | $ | 325 | $ | (259 | ) | $ | (230 | ) | $ | (314 | ) | $ | (443 | ) |
| (1) | Represents reclassifications from Accumulated other comprehensive income (loss) due to the deconsolidation of the Company’s Venezuelan operations. Cumulative translation, net actuarial gain (loss) and unrealized gains (losses) on available-for-sale securities were reclassified into the Charge for Venezuela accounting change on the Consolidated Statement of Income. |
| (2) | These components of Other comprehensive income (loss) are included in the computation of total pension cost. See Note 10, Retirement Plans and Other Retiree Benefits for additional details. |
| (3) | For the year ended December 31, 2015, these amounts included pretax net losses of $50 related to the remeasurement of the bolivar-denominated fixed interest rate bonds and the devaluation-protected bonds in Venezuela. |
COLGATE-PALMOLIVE COMPANY
Notes to Consolidated Financial Statements (continued)
(Dollars in Millions Except Share and Per Share Amounts)
| (4) | Represents reclassification of losses on the Venezuela bonds into Other (income) expense, net due to an impairment in the fair value of the bonds as a result of the effective devaluations in the second and third quarters of 2015. |
| (5) | These (gains) losses are reclassified into Cost of sales. See Note 7, Fair Value Measurements and Financial Instruments for additional details. |
There were no tax impacts on Other comprehensive income (loss) attributable to Noncontrolling interests.
Accumulated Other Comprehensive Income (Loss)
Accumulated other comprehensive income (loss) is comprised of cumulative foreign currency translation gains and losses, unrecognized pension and other retiree benefit costs, unrealized gains and losses from derivative instruments designated as cash flow hedges and unrealized gains and losses on available-for-sale securities. At December 31, 2017 and 2016, Accumulated other comprehensive income (loss) consisted primarily of aftertax unrecognized pension and other retiree benefit costs of $923 and $977, respectively, and cumulative foreign currency translation adjustments of $2,927 and $3,212, respectively. Foreign currency translation adjustments in 2017 primarily reflect gains from the Euro. In 2016, foreign currency translation adjustments primarily reflect losses from the Mexican peso and the Euro, partially offset by gains from the Brazilian real.
COLGATE-PALMOLIVE COMPANY
Notes to Consolidated Financial Statements (continued)
(Dollars in Millions Except Share and Per Share Amounts)
- Quarterly Financial Data (Unaudited)
| Total | First Quarter | Second Quarter | Third Quarter | Fourth Quarter | ||||||||||||||||
| 2017 | ||||||||||||||||||||
| Net sales | $ | 15,454 | $ | 3,762 | $ | 3,826 | $ | 3,974 | $ | 3,892 | ||||||||||
| Gross profit | 9,280 | (1) | 2,269 | (3) | 2,300 | (5) | 2,383 | (7) | 2,328 | (9) | ||||||||||
| Net income including noncontrolling interests | 2,174 | (2) | 611 | (4) | 560 | (6) | 650 | (8) | 353 | (10) | ||||||||||
| Net income attributable to Colgate-Palmolive Company | 2,024 | (2) | 570 | (4) | 524 | (6) | 607 | (8) | 323 | (10) | ||||||||||
| Earnings per common share: | ||||||||||||||||||||
| Basic | 2.30 | (2) | 0.64 | (4) | 0.59 | (6) | 0.69 | (8) | 0.37 | (10) | ||||||||||
| Diluted | 2.28 | (2) | 0.64 | (4) | 0.59 | (6) | 0.68 | (8) | 0.37 | (10) | ||||||||||
| 2016 | ||||||||||||||||||||
| Net sales | $ | 15,195 | $ | 3,762 | $ | 3,845 | $ | 3,867 | $ | 3,721 | ||||||||||
| Gross profit | 9,123 | (11) | 2,248 | (13) | 2,304 | (16) | 2,324 | (18) | 2,247 | (20) | ||||||||||
| Net income including noncontrolling interests | 2,586 | (12) | 574 | (14) | 638 | (17) | 746 | (19) | 628 | (21) | ||||||||||
| Net income attributable to Colgate-Palmolive Company | 2,441 | (12) | 533 | (14) (15) | 600 | (17) | 702 | (19) | 606 | (21) | ||||||||||
| Earnings per common share: | ||||||||||||||||||||
| Basic | 2.74 | (12) | 0.60 | (14) | 0.67 | (17) | 0.79 | (19) | 0.68 | (21) | ||||||||||
| Diluted | 2.72 | (12) | 0.59 | (14) | 0.67 | (17) | 0.78 | (19) | 0.68 | (21) |
| Note: | Basic and diluted earnings per share are computed independently for each quarter and the year-to-date period presented. Accordingly, the sum of the quarterly earnings per common share may not necessarily equal the earnings per share for the year-to-date period. |
| (1) | Gross profit for the full year of 2017 includes $75 of charges related to the Global Growth and Efficiency Program. |
| (2) | Net income including noncontrolling interests, Net income attributable to Colgate-Palmolive Company and Earnings per common share for the full year of 2017 include $246 of aftertax charges related to the Global Growth and Efficiency Program and a $275 charge related to U.S. tax reform. |
| (3) | Gross profit for the first quarter of 2017 includes $14 of charges related to the Global Growth and Efficiency Program. |
| (4) | Net income including noncontrolling interests, Net income attributable to Colgate-Palmolive Company and Earnings per common share for the first quarter of 2017 include $31 of aftertax charges related to the Global Growth and Efficiency Program. |
| (5) | Gross profit for the second quarter of 2017 includes $21 of charges related to the Global Growth and Efficiency Program. |
| (6) | Net income including noncontrolling interests, Net income attributable to Colgate-Palmolive Company and Earnings per common share for the second quarter of 2017 include $115 of aftertax charges related to the Global Growth and Efficiency Program. |
| (7) | Gross profit for the third quarter of 2017 includes $16 of charges related to the Global Growth and Efficiency Program. |
COLGATE-PALMOLIVE COMPANY
Notes to Consolidated Financial Statements (continued)
(Dollars in Millions Except Share and Per Share Amounts)
| (8) | Net income including noncontrolling interests, Net income attributable to Colgate-Palmolive Company and Earnings per common share for the third quarter of 2017 include $39 of aftertax charges related to the Global Growth and Efficiency Program. |
| (9) | Gross profit for the fourth quarter of 2017 includes $24 of charges related to the Global Growth and Efficiency Program. |
| (10) | Net income including noncontrolling interests, Net income attributable to Colgate-Palmolive Company and Earnings per common share for the fourth quarter of 2017 include $61 of aftertax charges related to the Global Growth and Efficiency Program and a $275 charge related to U.S. tax reform. |
| (11) | Gross profit for the full year of 2016 includes $46 of charges related to the Global Growth and Efficiency Program. |
| (12) | Net income including noncontrolling interests for the full year of 2016 includes $169 of aftertax charges related to the Global Growth and Efficiency Program. Net income attributable to Colgate-Palmolive Company and Earnings per common share for the full year of 2016 include $168 of aftertax charges related to the Global Growth and Efficiency Program, a $63 aftertax gain on the sale of land in Mexico, $11 of aftertax charges for a litigation matter and $35 of benefits from tax matters. |
| (13) | Gross profit for the first quarter of 2016 includes $8 of charges related to the Global Growth and Efficiency Program. |
| (14) | Net income including noncontrolling interests, Net income attributable to Colgate-Palmolive Company and Earnings per common share for the first quarter of 2016 include $38 of aftertax charges related to the Global Growth and Efficiency Program. |
| (15) | In the first quarter of 2016, provision for income taxes included a $210 U.S. income tax benefit principally related to changes in Venezuela’s foreign exchange regime implemented in March 2016. In order to fully utilize the above mentioned $210 tax benefit in 2016, the Company repatriated an incremental $1,500 of earnings of foreign subsidiaries it previously considered indefinitely reinvested outside of the U.S., and accordingly, recorded a tax charge of $210 during the first quarter of 2016. See Note 11, Income Taxes. |
| (16) | Gross profit for the second quarter of 2016 includes $12 of charges related to the Global Growth and Efficiency Program. |
| (17) | Net income including noncontrolling interests for the second quarter of 2016 includes $45 of aftertax charges related to the Global Growth and Efficiency Program. Net income attributable to Colgate-Palmolive Company and Earnings per common share for the second quarter of 2016 include $44 of aftertax charges related to the Global Growth and Efficiency Program and a $13 benefit from a tax matter. |
| (18) | Gross profit for the third quarter of 2016 includes $11 of charges related to the Global Growth and Efficiency Program. |
| (19) | Net income including noncontrolling interests, Net income attributable to Colgate-Palmolive Company and Earnings per common share for the third quarter of 2016 include $32 of aftertax charges related to the Global Growth and Efficiency Program, a $63 aftertax gain on the sale of land in Mexico, a $4 aftertax charge for a litigation matter and $22 of benefits from tax matters. |
| (20) | Gross profit for the fourth quarter of 2016 includes $15 of charges related to the Global Growth and Efficiency Program. |
| (21) | Net income including noncontrolling interests, Net income attributable to Colgate-Palmolive Company and Earnings per common share for the fourth quarter of 2016 include $54 of aftertax charges related to the Global Growth and Efficiency Program and a $7 aftertax charge for a litigation matter. |
COLGATE-PALMOLIVE COMPANY
SCHEDULE II - VALUATION AND QUALIFYING ACCOUNTS
(Dollars in Millions)
| Additions | ||||||||||||||||||||
| Balance at Beginning of Period | Charged to Costs and Expenses | Other | Deductions | Balance at End of Period | ||||||||||||||||
| Year Ended December 31, 2017 | ||||||||||||||||||||
| Allowance for doubtful accounts and estimated returns | $ | 73 | $ | 8 | $ | — | $ | 4 | $ | 77 | ||||||||||
| Valuation allowance for deferred tax assets | $ | — | $ | 9 | $ | — | $ | — | $ | 9 | ||||||||||
| Year Ended December 31, 2016 | ||||||||||||||||||||
| Allowance for doubtful accounts and estimated returns | $ | 59 | $ | 18 | $ | — | $ | 4 | $ | 73 | ||||||||||
| Valuation allowance for deferred tax assets | $ | — | $ | — | $ | — | $ | — | $ | — | ||||||||||
| Year Ended December 31, 2015 | ||||||||||||||||||||
| Allowance for doubtful accounts and estimated returns | $ | 54 | $ | 7 | $ | — | $ | 2 | $ | 59 | ||||||||||
| Valuation allowance for deferred tax assets | $ | — | $ | — | $ | — | $ | — | $ | — |
COLGATE-PALMOLIVE COMPANY
Market and Dividend Information
The Company’s common stock is listed on the New York Stock Exchange and its trading symbol is CL. Dividends on the common stock have been paid every year since 1895, and the Company’s regular common stock dividend payments have increased for 55 consecutive years.
| Market Price of Common Stock | ||||||||||||||||
| 2017 | 2016 | |||||||||||||||
| Quarter Ended | High | Low | High | Low | ||||||||||||
| March 31 | $ | 74.44 | $ | 64.53 | $ | 70.72 | $ | 62.45 | ||||||||
| June 30 | 77.23 | 70.76 | 73.20 | 68.96 | ||||||||||||
| September 30 | 73.94 | 70.78 | 75.27 | 70.86 | ||||||||||||
| December 31 | 75.99 | 69.20 | 73.62 | 64.63 | ||||||||||||
| Year-end Closing Price | $75.45 | $65.44 |
Dividends Paid Per Common Share
| Quarter Ended | 2017 | 2016 | ||||||
| March 31 | $ | 0.39 | $ | 0.38 | ||||
| June 30 | 0.40 | 0.39 | ||||||
| September 30 | 0.40 | 0.39 | ||||||
| December 31 | 0.40 | 0.39 | ||||||
| Total | $ | 1.59 | $ | 1.55 |
COLGATE-PALMOLIVE COMPANY
Market and Dividend Information
Stock Price Performance Graphs
The following graphs compare cumulative total shareholder returns on Colgate-Palmolive Company common stock against the S&P Composite-500 Stock Index and two peer company indices for the twenty-year, ten-year and five-year periods each ended December 31, 2017. The peer company indices are comprised of consumer products companies that have both domestic and international businesses. For 2017, the peer company index consisted of Campbell Soup Company, The Clorox Company, The Coca-Cola Company, ConAgra Brands, Inc., The Estee Lauder Companies, Inc., General Mills, Inc., Johnson & Johnson, Kellogg Company, Kimberly-Clark Corporation, The Kraft Heinz Company, Mondelez International, Inc., PepsiCo, Inc., The Procter & Gamble Company, Reckitt Benckiser Group plc and Unilever N.V. This index is identified as the “New Peer Group” on the graphs. Last year, the peer company index consisted of Avon Products, Inc., Campbell Soup Company, The Clorox Company, Coca-Cola Company, ConAgra Foods, Inc., Estee Lauder Companies, Inc., General Mills, Inc., Johnson & Johnson, Kellogg Company, Kimberly-Clark Corporation, The Kraft Heinz Company, Mondelez International, Inc., PepsiCo, Inc., The Procter & Gamble Company, Reckitt Benckiser Group plc and Unilever N.V. The prior year index is identified as the “Old Peer Group” on the graphs.
These performance graphs do not constitute soliciting material, are not deemed filed with the SEC and are not incorporated by reference in any of the Company’s filings under the Securities Act of 1933 or the Securities Exchange Act of 1934, as amended, whether made before or after the date of this Annual Report on Form 10-K and irrespective of any general incorporation language in any such filing, except to the extent the Company specifically incorporates these performance graphs by reference therein.

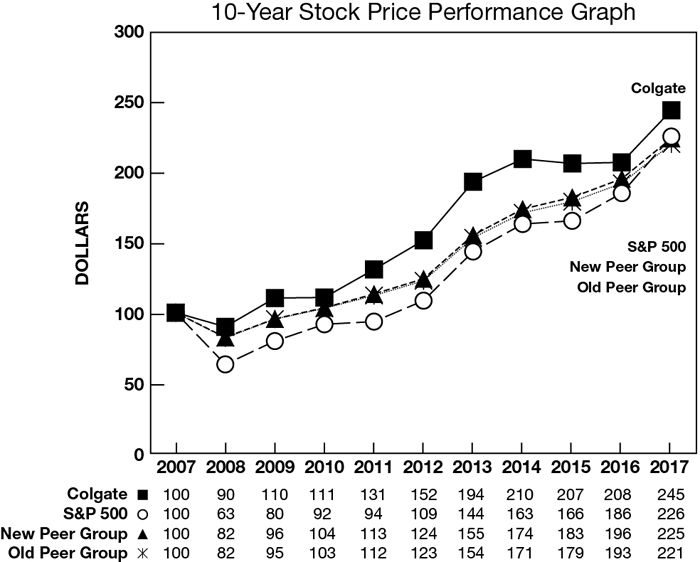

COLGATE-PALMOLIVE COMPANY
Historical Financial Summary
For the years ended December 31,
(Dollars in Millions Except Per Share Amounts)
(Unaudited)
| 2017 | 2016 | 2015 | 2014 | 2013 | 2012 | 2011 | 2010 | 2009 | 2008 | ||||||||||||||||||||||||||||||||
| Continuing Operations | |||||||||||||||||||||||||||||||||||||||||
| Net sales | $ | 15,454 | $ | 15,195 | $ | 16,034 | $ | 17,277 | $ | 17,420 | $ | 17,085 | $ | 16,734 | $ | 15,564 | $ | 15,327 | $ | 15,330 | |||||||||||||||||||||
| Results of operations: | |||||||||||||||||||||||||||||||||||||||||
| Net income attributable to Colgate-Palmolive Company | 2,024 | (1) | 2,441 | (2) | 1,384 | (3) | 2,180 | (4) | 2,241 | (5) | 2,472 | (6) | 2,431 | (7) | 2,203 | (8) | 2,291 | 1,957 | (9) | ||||||||||||||||||||||
| Earnings per common share, basic | 2.30 | (1) | 2.74 | (2) | 1.53 | (3) | 2.38 | (4) | 2.41 | (5) | 2.60 | (6) | 2.49 | (7) | 2.22 | (8) | 2.26 | 1.91 | (9) | ||||||||||||||||||||||
| Earnings per common share, diluted | 2.28 | (1) | 2.72 | (2) | 1.52 | (3) | 2.36 | (4) | 2.38 | (5) | 2.57 | (6) | 2.47 | (7) | 2.16 | (8) | 2.18 | 1.83 | (9) | ||||||||||||||||||||||
| Depreciation and amortization expense | 475 | 443 | 449 | 442 | 439 | 425 | 421 | 376 | 351 | 348 | |||||||||||||||||||||||||||||||
| Financial Position | |||||||||||||||||||||||||||||||||||||||||
| Current ratio | 1.4 | 1.3 | 1.2 | 1.2 | 1.1 | 1.2 | 1.2 | 1.0 | 1.1 | 1.3 | |||||||||||||||||||||||||||||||
| Property, plant and equipment, net | 4,072 | 3,840 | 3,796 | 4,080 | 4,083 | 3,842 | 3,668 | 3,693 | 3,516 | 3,119 | |||||||||||||||||||||||||||||||
| Capital expenditures | 553 | 593 | 691 | 757 | 670 | 565 | 537 | 550 | 575 | 684 | |||||||||||||||||||||||||||||||
| Total assets | 12,676 | 12,123 | 11,935 | 13,440 | 13,968 | 13,379 | 12,711 | 11,163 | 11,125 | 9,970 | |||||||||||||||||||||||||||||||
| Long-term debt | 6,566 | 6,520 | 6,246 | 5,625 | 4,732 | 4,911 | 4,417 | 2,806 | 2,812 | 3,576 | |||||||||||||||||||||||||||||||
| Colgate-Palmolive Company shareholders’ equity | (60 | ) | (243 | ) | (299 | ) | 1,145 | 2,305 | 2,189 | 2,375 | 2,675 | 3,116 | 1,923 | ||||||||||||||||||||||||||||
| Share and Other | |||||||||||||||||||||||||||||||||||||||||
| Book value per common share | 0.28 | 0.03 | (0.04 | ) | 1.55 | 2.79 | 2.60 | 2.71 | 2.95 | 3.26 | 2.04 | ||||||||||||||||||||||||||||||
| Cash dividends declared and paid per common share | 1.59 | 1.55 | 1.50 | 1.42 | 1.33 | 1.22 | 1.14 | 1.02 | 0.86 | 0.78 | |||||||||||||||||||||||||||||||
| Closing price | 75.45 | 65.44 | 66.62 | 69.19 | 65.21 | 52.27 | 46.20 | 40.19 | 41.08 | 34.27 | |||||||||||||||||||||||||||||||
| Number of common shares outstanding (in millions) | 874.7 | 883.1 | 892.7 | 906.7 | 919.9 | 935.8 | 960.0 | 989.8 | 988.4 | 1,002.8 | |||||||||||||||||||||||||||||||
| Number of common shareholders of record | 22,700 | 23,600 | 24,400 | 25,400 | 26,900 | 27,600 | 28,900 | 29,900 | 30,600 | 31,400 | |||||||||||||||||||||||||||||||
| Number of employees | 35,900 | 36,700 | 37,900 | 37,700 | 37,400 | 37,700 | 38,600 | 39,200 | 38,100 | 36,600 |
| Note: | All per share amounts and numbers of shares outstanding were adjusted for the two-for-one stock split of the Company’s common stock in 2013. |
| (1) | Net income attributable to Colgate-Palmolive Company and earnings per common share for the full year of 2017 include $246 of aftertax charges related to the Global Growth and Efficiency Program and a $275 charge related to U.S. tax reform. |
COLGATE-PALMOLIVE COMPANY
Historical Financial Summary
For the years ended December 31,
(Dollars in Millions Except Per Share Amounts)
(Unaudited)
| (2) | Net income attributable to Colgate-Palmolive Company and earnings per common share for the full year of 2016 include $168 of aftertax charges related to the Global Growth and Efficiency Program, a $63 aftertax gain on the sale of land in Mexico, $11 of aftertax charges for a litigation matter and $35 of benefits from tax matters. |
| (3) | Net income attributable to Colgate-Palmolive Company and earnings per common share for the full year of 2015 include a $1,058 aftertax charge related to the change in accounting for the Company’s Venezuelan operations, $183 of aftertax charges related to the Global Growth and Efficiency Program, $22 of aftertax charges related to the remeasurement of CP Venezuela’s local currency-denominated net monetary assets as a result of effective devaluations, $120 aftertax gain on the sale of the South Pacific laundry detergent business, a $14 aftertax charge for a litigation matter and a $15 charge for a tax matter. |
| (4) | Net income attributable to Colgate-Palmolive Company and earnings per common share in 2014 include $208 of aftertax charges related to the Global Growth and Efficiency Program, $214 of aftertax charges related to the remeasurement of CP Venezuela’s local currency-denominated net monetary assets as a result of effective devaluations, $41 of charges for litigation matters, $3 of aftertax costs related to the sale of land in Mexico and a $66 charge for a tax matter. |
| (5) | Net income attributable to Colgate-Palmolive Company and earnings per common share in 2013 include $278 of aftertax charges related to the Global Growth and Efficiency Program, a $111 aftertax charge related to the remeasurement of CP Venezuela’s local currency-denominated net monetary assets as a result of a devaluation, a $23 charge for a litigation matter and $12 of aftertax costs related to the sale of land in Mexico. |
| (6) | Net income attributable to Colgate-Palmolive Company and earnings per common share in 2012 include $70 of aftertax charges related to the Global Growth and Efficiency Program, $18 of aftertax costs related to the sale of land in Mexico and $14 of aftertax costs associated with various business realignment and other cost-saving initiatives. |
| (7) | Net income attributable to Colgate-Palmolive Company and earnings per common share in 2011 include an aftertax gain of $135 on the sale of the non-core laundry detergent business in Colombia, offset by $147 of aftertax costs associated with various business realignment and other cost-saving initiatives, $9 of aftertax costs related to the sale of land in Mexico and a $21 charge for a litigation matter. |
| (8) | Net income attributable to Colgate-Palmolive Company and earnings per common share in 2010 include a $271 one-time charge related to the transition to hyperinflationary accounting in Venezuela, $61 of aftertax charges for termination benefits related to overhead reduction initiatives, a $30 aftertax gain on sales of non-core product lines and a $31 benefit related to the reorganization of an overseas subsidiary. |
| (9) | Net income attributable to Colgate-Palmolive Company and earnings per common share in 2008 include $113 of aftertax charges related to the 2004 Restructuring Program. |
Previous: Item 15. EXHIBITS AND FINANCIAL STATEMENT SCHEDULES