 filings.tools
CME Group 10-K 2018-12-31
Filed 2019-02-28. 22 sections, 424K characters. Original on sec.gov · Markdown · JSON
Cover and table of contents
10-K 1 cme-2018123110k.htm FORM 10-K
UNITED STATES
SECURITIES AND EXCHANGE COMMISSION
WASHINGTON, D.C. 20549
FORM 10-K
(Mark One)
| ý | ANNUAL REPORT PURSUANT TO SECTION 13 OR 15(d) OF THE SECURITIES EXCHANGE ACT OF 1934 |
For the Fiscal Year Ended December 31, 2018
OR
| ¨ | TRANSITION REPORT PURSUANT TO SECTION 13 OR 15(d) OF THE SECURITIES EXCHANGE ACT OF 1934 |
Commission File Number 001-31553
CME GROUP INC.
(Exact name of registrant as specified in its charter)
| Delaware | 36-4459170 | |
| (State or Other Jurisdiction of Incorporation or Organization) | (IRS Employer Identification No.) | |
| 20 South Wacker Drive, Chicago, Illinois | 60606 | |
| (Address of Principal Executive Offices) | (Zip Code) |
Registrant’s telephone number, including area code: (312) 930-1000
Securities registered pursuant to Section 12(b) of the Act:
| Title Of Each Class | Name Of Each Exchange On Which Registered | |
| Class A Common Stock $0.01 par value | NASDAQ GLOBAL SELECT MARKET |
Securities registered pursuant to Section 12(g) of the Act: Class B common stock, Class B-1, $0.01 par value; Class B common stock, Class B-2, $0.01 par value; Class B common stock, Class B-3, $0.01 par value; and Class B common stock, Class B-4, $0.01 par value.
Indicate by check mark if the registrant is a well-known seasoned issuer, as defined in Rule 405 of the Securities Act. Yes ý No ¨
Indicate by check mark if the registrant is not required to file reports pursuant to Section 13 or Section 15(d) of the Act. Yes ¨ No ý
Indicate by check mark whether the registrant: (1) has filed all reports required to be filed by Section 13 or 15(d) of the Securities Exchange Act of 1934 during the preceding 12 months (or for such shorter period that the registrant was required to file such reports), and (2) has been subject to such filing requirements for the past 90 days. Yes ý No ¨
Indicate by check mark whether the registrant has submitted electronically every Interactive Data File required to be submitted pursuant to Rule 405 of Regulation S-T (§232.405 of this chapter) during the preceding 12 months (or for such shorter period that the registrant was required to submit such files). Yes ý No ¨
Indicate by check mark if disclosure of delinquent filers pursuant to Item 405 of Regulation S-K (§229.405 of this chapter) is not contained herein, and will not be contained, to the best of registrant’s knowledge, in definitive proxy or information statements incorporated by reference in Part III of this Form 10-K or any amendment to this Form 10-K. ý
Indicate by check mark whether the registrant is a large accelerated filer, an accelerated filer, a non-accelerated filer, a smaller reporting company, or emerging growth company. See definitions of "large accelerated filer," "accelerated filer," "smaller reporting company" and "emerging growth company" in Rule 12b-2 of the Exchange Act.
| Large accelerated filer x | Accelerated filer o | |
| Non-accelerated filer o | Smaller reporting company o Emerging growth company o |
If an emerging growth company, indicate by check mark if the registrant has elected not to use the extended transition period for complying with any new or revised financial accounting standards provided pursuant to Section 13(a) of the Exchange Act. ¨
Indicate by check mark whether the registrant is a shell company (as defined in Rule 12b-2 of the Exchange Act). Yes ¨ No ý
The aggregate market value of the voting stock held by non-affiliates of the registrant as of June 30, 2018, was approximately $55.4 billion (based on the closing price per share of CME Group Inc. Class A common stock on the NASDAQ Global Select Market (NASDAQ) on such date). The number of shares outstanding of each of the registrant’s classes of common stock as of February 6, 2019 was as follows: 357,792,873 shares of Class A common stock, $0.01 par value; 625 shares of Class B common stock, Class B-1, $0.01 par value; 813 shares of Class B common stock, Class B-2, $0.01 par value; 1,287 shares of Class B common stock, Class B-3, $0.01 par value; and 413 shares of Class B common stock, Class B-4, $0.01 par value.
DOCUMENTS INCORPORATED BY REFERENCE:
| Documents | Form 10-K Reference | |
| Portions of the CME Group Inc.’s Proxy Statement for the 2019 Annual Meeting of Shareholders | Part III |
CME GROUP INC.
ANNUAL REPORT ON FORM 10-K
INDEX
PART I
Certain Terms
All references to "options" or "options contracts" in the text of this document refer to options on futures contracts.
Further information about CME Group and its products can be found at http://www.cmegroup.com. Information made available on our website does not constitute a part of this Annual Report on Form 10-K.
Information about Contract Volume and Average Rate per Contract
All amounts regarding contract volume and average rate per contract exclude our interest rate swaps and credit default swaps as well as volume data for NEX unless otherwise noted. In March 2018, we exited the credit default swaps business.
Trademark Information
CME Group, the Globe logo, CME, Chicago Mercantile Exchange, Globex, and E-mini are trademarks of Chicago Mercantile Exchange Inc. CBOT and Chicago Board of Trade are trademarks of Board of Trade of the City of Chicago, Inc. NYMEX, New York Mercantile Exchange and ClearPort are trademarks of New York Mercantile Exchange, Inc. COMEX is a trademark of Commodity Exchange, Inc. NEX, BrokerTec, EBS, TriOptima, and Traiana are trademarks of various entities that were under NEX Group plc (NEX), all of which are now owned by CME Group. Dow Jones, Dow Jones Industrial Average, S&P 500 and S&P are service and/or trademarks of Dow Jones Trademark Holdings LLC, Standard & Poor's Financial Services LLC and S&P/Dow Jones Indices LLC, as the case may be, and have been licensed for use by Chicago Mercantile Exchange Inc. All other trademarks are the property of their respective owners.
FORWARD-LOOKING STATEMENTS
From time to time, in this Annual Report on Form 10-K as well as in other written reports and verbal statements, we discuss our expectations regarding future performance. These forward-looking statements are identified by their use of terms and phrases such as "believe," "anticipate," "could," "estimate," "intend," "may," "plan," "expect" and similar expressions, including references to assumptions. These forward-looking statements are based on currently available competitive, financial and economic data, current expectations, estimates, forecasts and projections about the industries in which we operate and management's beliefs and assumptions. These statements are not guarantees of future performance and involve risks, uncertainties and assumptions that are difficult to predict. Therefore, actual outcomes and results may differ materially from what is expressed or implied in any forward-looking statements. We want to caution you not to place undue reliance on any forward-looking statements. We undertake no obligation to publicly update any forward-looking statements, whether as a result of new information, future events or otherwise. Among the factors that might affect our performance are:
| • | increasing competition by foreign and domestic entities, including increased competition from new entrants into our markets and consolidation of existing entities; |
| • | our ability to keep pace with rapid technological developments, including our ability to complete the development, implementation and maintenance of the enhanced functionality required by our customers while maintaining reliability and ensuring that such technology is not vulnerable to security risks; |
| • | our ability to continue introducing competitive new products and services on a timely, cost-effective basis, including through our electronic trading capabilities, and our ability to maintain the competitiveness of our existing products and services, including our ability to provide effective services to the swaps market; |
| • | our ability to adjust our fixed costs and expenses if our revenues decline; |
| • | our ability to maintain existing customers, develop strategic relationships and attract new customers; |
| • | our ability to expand and globally offer our products and services; |
| • | changes in regulations, including the impact of any changes in laws or government policy with respect to our products or services or our industry, such as any changes to regulations and policies that require increased financial and operational resources from us or our customers; |
| • | the costs associated with protecting our intellectual property rights and our ability to operate our business without violating the intellectual property rights of others; |
| • | decreases in revenue from our market data as a result of decreased demand or changes to regulations in various jurisdictions; |
| • | changes in our rate per contract due to shifts in the mix of the products traded, the trading venue and the mix of customers (whether the customer receives member or non-member fees or participates in one of our various incentive programs) and the impact of our tiered pricing structure; |
| • | the ability of our credit and liquidity risk management practices to adequately protect us from the credit risks of clearing members and other counterparties, and to satisfy the margin and liquidity requirements associated with the BrokerTec matched principal business; |
| • | the ability of our compliance and risk management methods to effectively monitor and manage our risks, including our ability to prevent errors and misconduct and protect our infrastructure against security breaches and misappropriation of our intellectual property assets; |
| • | volatility in commodity, equity and fixed income prices, and price volatility of financial benchmarks and instruments such as interest rates, credit spreads, equity indices, fixed income instruments and foreign exchange rates; |
| • | economic, political and market conditions, including the volatility of the capital and credit markets and the impact of economic conditions on the trading activity of our current and potential customers; |
| • | our ability to accommodate increases in contract volume and order transaction traffic and to implement enhancements without failure or degradation of the performance of our trading and clearing systems; |
| • | our ability to execute our growth strategy and maintain our growth effectively; |
| • | our ability to manage the risks, control the costs and achieve the synergies associated with our strategy for acquisitions, investments and alliances, including those associated with the acquisition of NEX; |
| • | our ability to continue to generate funds and/or manage our indebtedness to allow us to continue to invest in our business; |
| • | industry and customer consolidation; |
| • | decreases in trading and clearing activity; |
| • | the imposition of a transaction tax or user fee on futures and options on futures transactions and/or repeal of the 60/40 tax treatment of such transactions; |
| • | our ability to maintain our reputation; and |
| • | the unfavorable resolution of material legal proceedings. |
For a detailed discussion of these and other factors that might affect our performance, see Item 1A. of this Report beginning on page 13.
Item 1. BUSINESS
CME Group enables clients to trade futures, options, cash and over-the-counter (OTC) markets, optimize portfolios, and analyze data — empowering market participants worldwide to efficiently manage risk and capture opportunities.
GENERAL DEVELOPMENT OF BUSINESS
CME was founded in 1898 as a not-for-profit corporation. CME demutualized in 2000, and in 2002 its parent company completed its initial public offering of its Class A common stock (NASDAQ: CME). Our acquisitions include our merger with CBOT Holdings, Inc. in 2007, our acquisition of NYMEX and COMEX in 2008 and our acquisition of NEX Group plc (NEX) in November 2018. Our combination with NEX creates a leading, client-centric, global markets company, generating significant efficiencies across futures, cash and OTC products for market participants seeking to lower their cost of trading and better manage risk. It also will improve our offerings to customers through the complementary combination of CME Group’s exchange-traded derivative products and NEX’s cash and OTC products. It also expands our international footprint and global client base.
Our principal executive offices are located at 20 South Wacker Drive, Chicago, Illinois 60606, and our telephone number is 312-930-1000.
NARRATIVE DESCRIPTION OF BUSINESS
CME Group exchanges offer the widest range of global benchmark products across all major asset classes based on interest rates, equity indexes, foreign exchange (FX), energy, agricultural commodities and metals. The company offers futures and options on futures trading across asset classes through the CME Globex platform, fixed income trading via BrokerTec and FX trading on the EBS platform. In addition, it operates one of the world’s leading central counterparty clearing providers, CME Clearing. With a range of pre- and post-trade products and services underpinning the entire lifecycle of a trade, CME Group also offers optimization, reconciliation and processing services through TriOptima and Traiana.
Derivatives Exchange Business: Through our derivatives exchanges and clearing house, we offer the widest range of global benchmark products across all major asset classes. We believe our customers choose to trade on our centralized market due to its liquidity, price transparency and technological capabilities. Market liquidity — or the ability of a market to absorb the execution of large purchases or sales quickly and efficiently, whereby the market recovers quickly following the execution of large orders — is key to attracting customers and contributing to a market's success. Our CME Group products provide a means for hedging, speculation and asset allocation relating to the risks associated with, among other things, interest rate sensitive instruments, equity ownership, changes in the value of foreign currency and changes in the prices of agricultural, energy and metal commodities.
| • | CME's product slate includes agricultural, equities, FX and interest rate products, including contracts for Eurodollars and contracts based on the S&P, NASDAQ-100 and FTSE Russell Indexes. |
| • | CBOT's product slate consists of agricultural, equities, energy and interest rate products, including contracts for U.S. Treasury futures, corn and other grains and contracts based on the Dow Jones Industrial Index. |
| • | NYMEX's product slate consists of energy and metals products, including contracts for crude oil, natural gas, heating oil and gasoline. |
| • | COMEX's product slate consists of metals products, including contracts for gold, silver and copper. |
We believe the breadth and diversity of our product lines and the variety of their underlying contracts are beneficial to our overall performance. Our asset classes contain products designed to address differing risk management needs, and customers are able to achieve operational and capital efficiencies by accessing our diverse products through our platforms and our clearing house.
Our CME Group products are traded primarily through CME Globex and other electronic trading platforms, by open outcry auction market in Chicago, and through privately negotiated transactions. We strive to provide the most flexible and scalable platforms to support the operational and capacity needs of the business along with the delivery of innovative technology solutions to the marketplace. Our CME Globex electronic platform is the trading engine for our central limit order book markets and is available on a global basis nearly 24 hours a day throughout the trading week. The CME Globex platform is accessible through a wide variety of vendor-provided and custom-built trading systems that benefit from our open application programming interface approach. For privately negotiated markets, we offer brokers and customers the CME Direct platform for arranging, executing, recording and risk-managing trades. CME Direct includes CME One for mobile access, CME Messenger for instant-message capabilities and CME Straight-Through Processing. CME Straight-Through Processing enables direct connectivity for trade information directly with customer order management and risk management systems and is designed to reduce errors and improve efficiency.
Together, our platforms offer:
| • | certainty of execution; |
| • | vast capabilities to facilitate complex and demanding trading; |
| • | direct market access; |
| • | fairness, price transparency and anonymity; |
| • | convenience and efficiency; |
| • | connectivity through highly secure, resilient and low-latency network options; and |
| • | global distribution, including connectivity through high-speed international telecommunications hubs in key financial centers or order routing to our global partner exchanges. |
We maintain comprehensive business continuity and disaster recovery plans and facilities to provide nearly continuous availability of our markets in the event of a business disruption or disaster. We also maintain incident and crisis management plans that address responses to disruptive events.
The customer base of our derivatives exchanges includes professional traders, financial institutions, institutional and individual investors, major corporations, manufacturers, producers, governments and central banks. Customers may be members of one or more of our exchanges. Rights to directly access our derivatives markets will depend upon the nature of the customer, such as whether the entity or individual is a member of one of our exchanges or has executed an agreement with us for direct access.
U.S. trading rights and privileges are exchange-specific. Open outcry trading is conducted exclusively by our members. Membership on one of our derivatives exchanges also enables a customer to trade specific products at reduced rates and lower fees. Under the terms of the organizational documents of our exchanges, our members have certain rights that relate primarily to trading right protections, certain trading fee protections and certain membership benefit protections. In 2018, 84% of our contract volume was from trades by our members.
CME Clearing Business: Through our clearing house, CME Clearing, which is a division of CME, we provide clearing services for all of our exchange-traded contracts, for certain cleared-only products and for certain contracts traded on other exchanges. Our integrated clearing function is designed to ensure the safety and the soundness of our exchange markets by serving as the counterparty to every trade, becoming the buyer to each seller and the seller to each buyer, and limiting counterparty credit risk. The clearing house is responsible for settling trading accounts, clearing trades, collecting and maintaining performance bond funds, regulating delivery and reporting trading data. CME Clearing marks open positions to market at least twice a day, requires payment from clearing firms whose positions have lost value and makes payments to clearing firms whose positions have gained value. For select cleared-only markets, positions are marked-to-market daily, with the capacity to mark-to-market more frequently as market conditions warrant. The CME ClearPort front-end system provides access to our flexible clearing services for block transactions and swaps. Certain BrokerTec and EBS contracts are cleared at third-party clearing houses.
The majority of clearing and transaction fees received from clearing firms represents charges for trades executed and cleared on behalf of their customers. One firm represented 10% of our clearing and transaction fees revenue for 2018. In the event a clearing firm were to withdraw, our experience indicates that the customer portion of the firm's trading activity would likely transfer to one or more other clearing firms of the exchange.
Cash Markets Business: Our cash markets business is comprised of the BrokerTec and EBS sub-brands, which were acquired as part of NEX in November 2018.
| • | BrokerTec is a global electronic platform for the trading of fixed income products, with a leading position in cash U.S. Treasuries, as well as activity in European government bonds and E.U. and U.S. repo fixed income instruments. It facilitates trading principally for banks and non-bank professional trading firms. |
| • | EBS is a global electronic platform for the trading of FX products. It is a reliable and trusted source of executable firm liquidity across major and emerging market currencies. EBS offers anonymous and disclosed trading venues, which give clients multiple execution and distribution options and the benefit of an established and far-reaching distribution network of liquidity providers and consumers. It also offers execution of non-deliverable forwards through a CFTC-registered Swap Execution Facility. |
Optimization Business: Our optimization services, which include the Traiana and TriOptima sub-brands acquired as part of NEX, deliver transaction lifecycle management services to help our clients simplify their workflow, optimize their capital and resources, mitigate their risk, increase efficiency and reduce their operational costs and streamline complex processes.
| • | Trade and portfolio management comprises portfolio and margin reconciliation, monitoring pre-trade risk and automating post-trade processing of financial transactions. |
| • | Financial resource optimization comprises portfolio compression, basis risk mitigation, portfolio balancing and derivative pricing and risk analytics. |
| • | Analytics delivers data, analytics and workflow tools that enable hedge funds and asset managers to manage their relationships with prime brokers more effectively. These tools provide a complete view of an individual hedge fund's relationships across multiple counterparties, delivering insights on counterparty credit risk, collateral management, portfolio financing and treasury. |
| • | Regulatory reporting comprises trade and position reporting (including licensed MiFID agent reporting to national regulators and the public), end-to-end multi-regime regulatory reporting, data normalization, enrichment, reconciliation, validation and cross-jurisdictional matching. |
Market Data Business: We offer a variety of market data services for the futures, equities, OTC, cash and the cleared swaps markets. Our market data platforms provide real-time and historical market data related to CME Group exchanges and our cash markets business. We also deliver independent market intelligence and pricing information for cash and OTC data to financial market participants using intelligence from our businesses and third parties.
Our Strategic Initiatives
The following is a description of our strategic initiatives:
Maximize Futures and Options on Futures Growth Globally — We continue to focus on driving growth and new customer acquisition, growing, innovating and scaling our core offerings, and increasing participation from non-U.S. customers. We do this by cross-selling our products, expanding the strength of our existing benchmark products, launching new products and services and deepening open interest in our core futures and options on futures offerings. During this decade, our key product launches have included the Ultra U.S. Treasury Bond futures and options and most recently the Ultra 10-Year Treasury futures, short-dated options across asset classes, new base metal products, expanded crude oil grades, Basis Trade at Index Close (BTIC) transactions, S&P Dividend futures, E-mini Russell 1000 and 2000 futures, and a cash-settled bitcoin futures contract. We continued to build traction in key product launches in 2018, including our Secured Overnight Financing Rate (SOFR) futures contracts, Sterling Overnight Index Average (SONIA) futures contracts, CME FX Link, CME Eris Interest Rate Swap Futures and Physical WTI Houston Crude Oil contracts. During 2018, we experienced overall record average daily volume of 19.2 million contracts, along with multiple volume records across our core product portfolio, including interest rates, FX, agricultural commodities and metals. We also had record volume in overall options, with electronic options representing 66% of total options volume in 2018. We continued to deepen liquidity and add diverse participation as evidenced by the growth in large open interest holders with records achieved across several product lines in 2018.
We also continued to expand and diversify our customer base worldwide and offer customers around the world the most broadly diversified portfolio of benchmark products. We believe we have significant opportunity to expand the participation of our non-U.S. customer base in our markets. We are focused on core growth in global markets because we believe that Australia, Asia, Latin America, and other emerging markets will experience significant growth and development of their financial markets. In addition, we continue to expand our presence in major global financial centers (including Europe), grow our business outside the United States and penetrate emerging markets, such as China, South Korea, Brazil and Mexico. In 2018, approximately 25% of our electronic futures and options on futures volume was from transactions reported as outside the United States and approximately 50% of our market data revenue was derived from outside the United States. We also achieved 42% growth in trading volume during Asian trading hours and 29% growth during European trading hours in 2018 compared to the 2017.
We continue to target cross-asset sales across client segments, driving international sales and generating new client participation across all regions. We have a long history of providing customer value and responsiveness and believe our products and services well position us to help our customers adapt and comply with new regulations, while enabling them to efficiently manage their risks. We have a broad distribution network comprised of a combination of internal and external channels and front-end capabilities.
Diversify our Business and Revenues — Our acquisition of NEX strengthens our role in the global market infrastructure, adding complementary cash and OTC businesses and scale to our listed interest rate and FX products, while enabling new efficiencies for the derivatives marketplace. The transaction positions CME Group to take direct advantage of growth in treasury issuance, liquid treasury holdings and the trading of treasury instruments, as well as growing repo activity across geographies. The transaction significantly expands CME Group’s position in the large, and highly fragmented, $5 trillion plus per trading day global FX marketplace, offering both order book trading and relationship trading solutions for customers. The acquisition adds strength in underlying customer marketplaces, especially around regional bank customers and other market
participants outside of North America. The acquisition also expands our post-trade services and market data solutions beyond futures and options on futures into cash and OTC offerings.
Our joint venture with S&P Global, Inc., S&P/DJI Indices LLC, combines the world class capabilities of S&P Indices and Dow Jones Indices, and is a significant player in the passive investing including the exchange-traded fund (ETF) industry value chain. As part of the joint venture, we acquired a long-term, ownership-linked, exclusive license to list futures and options on futures based on the S&P 500 Index and certain other S&P indices.
Deliver Unparalleled Capital and Cost Efficiency Solutions — With changing regulatory capital requirements for many of our customers and the need for greater efficiencies, we have added tools to enable customers to build and manage trading and clearing positions in our markets in an efficient manner, including through our acquisition of NEX. With the ongoing implementation of regulatory reform in the United States and in Europe, along with global implementation of Basel III capital requirements on financial institutions, we expect capital efficiencies and centralized clearing to continue to be important for our global client base.
We provide a comprehensive multi-asset class clearing solution to the market for maximum operational ease and the capital efficiency that comes with connecting to our clearing house. Our clearing services offer the ability to optimize collateral and capital efficiencies across portfolios within the clearing house while meeting the heightened regulatory requirements on derivatives. The majority of our clearing volumes and activities are related to our listed futures and options on futures, which also represents the majority of our open interest and collateral held against these positions. We also offer clearing services for interest rate, FX and commodity swaps. In March 2018, we extended block trading to agricultural commodity products through CME ClearPort. Also, in 2018, we extended our OTC clearing solutions to include clearing for the Chilean and Columbian Peso interest rate swaps.
CME Group continues to introduce tools and services to assist customers with portfolio margining. As of December 31, 2018, 45 unique marketplace participants utilized CME Group’s portfolio margining services. In the past few years, we have introduced compression via coupon blending as well as CME CORE, an interactive margin calculator that enables clients to optimize their capital by providing insights on margin requirements prior to trading. We also offer multilateral compression for our cleared swap customers through TriOptima, and we provide trade reporting services in the United States, Europe, Canada and Australia. In 2018, we also introduced a multilateral compression service for our listed equity options.
Patents, Trademarks and Licenses
We own the rights to a large number of trademarks, service marks, domain names and trade names in the United States, Europe and other parts of the world. We have registered many of our most important trademarks in the United States and other countries. We hold the rights to a number of patents and have made a number of patent applications. Our patents cover match engine, trader user interface, trading floor support, market data, general technology and clearing house functionalities. We also own the copyright to a variety of materials. Those copyrights, some of which are registered, include printed and on-line publications, websites, advertisements, educational material, graphic presentations and other literature, both textual and electronic. We attempt to protect our intellectual property rights by relying on trademarks, patents, copyrights, database rights, trade secrets, restrictions on disclosure and other methods.
We offer equity index futures and options on key benchmarks, including S&P, NASDAQ, Dow Jones and the FTSE Russell indexes. These products are listed by us subject to license agreements with the applicable owners of the indexes, some of which are exclusive. In connection with our joint venture with S&P Global, Inc., we entered into a new license agreement (S&P License Agreement), which superseded our prior licensing arrangements and was assigned to the joint venture. CME’s license for the S&P 500 Index will be exclusive for futures and options on futures until one year prior to the termination of the S&P License Agreement, and non-exclusive for the last year. The license for the other S&P stock indexes is generally exclusive for futures and options on futures. The term of the S&P License Agreement will continue until the date that is one year after the date that CME Group ceases to own at least five percent (accounting for dilution) of the outstanding joint venture interests. Upon the occurrence of certain events, including certain terminations of the joint venture, the term may be extended up to an additional ten years. CBOT has an exclusive license agreement (Dow Jones License Agreement) with CME Group Index Services LLC (CME Indexes) for certain Dow Jones indexes, which has also been assigned to the joint venture. The initial term of the agreement is through June 30, 2026. Following the initial term, the Dow Jones License Agreement shall automatically renew for renewal terms of five years thereafter so long as there is open interest in any of CBOT’s or its affiliates’ products based on one or more of the Dow Jones licensed indexes. In the event there is no open interest in any such products, then CME Indexes has the ability to terminate the agreement. We also have an exclusive license agreement for certain NASDAQ indexes, which was extended for an additional ten years in 2018 through 2029. In 2015, we entered into an exclusive license agreement with FTSE Russell and launched the E-mini Russell 2000 futures in 2017. We pay the applicable third party per trade fees based on contract volume under the terms of these licensing agreements. A copy of the S&P license arrangement has been filed as a material contract.
We also have a long-term, non-exclusive licensing arrangement with ICE Benchmark Administration for the use of LIBOR to settle several of our interest rate products, including our Eurodollar contract.
We cannot assure you that we will be able to maintain the exclusivity of our licensing agreements with S&P, Dow Jones, NASDAQ and FTSE Russell or be able to maintain our other existing licensing arrangements beyond the term of the current agreements. In addition, we cannot assure you that others will not succeed in creating stock index futures based on information similar to that which we have obtained by license, or that market participants will not increasingly use other instruments, including securities and options based on the S&P, Dow Jones, NASDAQ or Russell indexes, to manage or speculate on U.S. stock risks. Parties also may succeed in offering indexed products that are similar to our licensed products without being required to obtain a license, or in countries that are beyond our jurisdictional reach and/or our licensors.
Competition
The industry in which we operate is highly competitive and we expect competition to continue to intensify and become more global, especially in light of changes in the financial services industry driven by regulatory reforms such as the Dodd-Frank Wall Street Reform and Consumer Protection Act (Dodd-Frank), European Market Infrastructure Regulation (EMIR), Markets in Financial Instruments Directive II (MiFID II), Capital Requirements Directive IV (CRD IV), Market Abuse Regulation, Benchmarks Regulation, Basel III, and various other laws and regulations.
Please also refer to the discussion below and in the “Risk Factors” section beginning on page 13 for a description of competitive risks and uncertainties.
Competition in our Derivatives Exchange Business
We believe competition in the derivatives business is based on a number of factors, including, among others:
| • | brand and reputation; |
| • | efficient and secure settlement, clearing and support services; |
| • | depth and liquidity of markets; |
| • | diversity of product offerings and frequency and quality of new product development and innovative services; |
| • | ability to position and expand upon existing products to address changing market needs; |
| • | efficient and seamless customer experience; |
| • | transparency, reliability, anonymity and security in transaction processing; |
| • | regulatory environment; |
| • | connectivity, accessibility, flexibility in execution methods, and distribution; |
| • | technological capability and innovation; and |
| • | overall transaction costs. |
We believe that we compete favorably with respect to these factors. Our deep, liquid markets; diverse and complementary product offerings; frequency and quality of new product development, and efficient, secure settlement, clearing and support services, distinguish us from others in the industry. We believe that in order to maintain our competitive position, we must continue to expand globally; develop new and innovative products; enhance our technology infrastructure, including its reliability and functionality; maintain liquidity and low transaction costs; continue to strengthen our risk management capabilities and solutions, and implement customer protections designed to ensure the integrity of our market and the confidence of our customers.
We compete in a large financial services trading, clearing and settlement marketplace globally. Our competitors include, among other entities, exchanges such as Intercontinental Exchange, Inc. (ICE), the Hong Kong Exchanges and Clearing Limited, and Deutsche Börse AG. It also includes alternative means of developing exposures through alternative instruments, such as cash, OTC, ETFs, options, warrants, contracts for differences, structured products, and other offerings. New emerging competitors have targeted different segments of our industry, and new technologies may offer alternative products in the future. Competition in our industry continues to be dynamic and recent developments and alliances may result in a growing number of well-capitalized trading service providers that compete with all or a portion of our business.
Competition in our CME Clearing Business
In the past few years, there has been increased competition in the provision of clearing services and we expect competition to continue to increase in connection with compliance with Dodd-Frank, Basel III, MiFID II and other various laws and regulations.
Our competitors in the clearing services space include, among others, companies such as ICE, LCH.Group, the Options Clearing Corporation, Depository Trust & Clearing Corporation and Deutsche Börse AG. In light of the implementation of regulatory requirements and other reforms of the financial services industry, we believe that other exchanges and infrastructure providers also may undertake to provide clearing and other related post-trade services.
We believe competition in clearing services is based on, among other things, the value of providing customers with capital and margin efficiencies; quality and reliability of the services; creditworthiness of the clearing house; timely delivery of the services; reputation; diversity of the service offerings; confidentiality of positions and information security protective measures, and the fees charged for the services provided.
Competition in our Cash Markets Business
The cash markets businesses operate with significant competition across a wide array of venues. In the FX space, the marketplace is highly fragmented, and there is competition from other electronic communication networks, single dealer platforms, bank owned multi-participant platforms, streaming and request for quote services, trading venues tied to data platforms, voice brokers, other broker enabled platforms, and other venues. There is a growing array of platforms, and they are often owned by many well capitalized financial institutions and intermediaries. In the fixed income space, there are also multiple providers of treasury, European and U.S. repo, and European bond trading, and a multitude of competitors and new entrants offering single dealer liquidity, bank owned multi-participant platforms, streaming and request for quote services, and other broker and exchange-enabled platforms.
Competition in our Optimization Services Business
The optimization services business has significant competition across each of the segments in which CME Group operates. There are multiple providers of compression services, reconciliation services, trade processing, analytics, and regulatory reporting services. In addition, there is considerable innovation going on in this business, with new entrants and new technologies being developed to serve customers.
Competition in our Market Data Business
Technology companies, market data and information vendors and front-end software vendors also represent actual and potential competitors because they have their own substantial market data distribution capabilities that could serve as alternative means for receiving open market data feeds instead of connecting directly to our exchange. Distributors and consumers of our market data may also use our market data as an input into a product that competes against one of our traded or cleared products. Although we may receive license fees for such products, such fees may not offset the impact of any loss in revenue from our comparable product.
Regulatory Matters
Our businesses are either regulated themselves or serving a customer-base that includes regulated institutions or individuals. Developments in the regulatory environment have the potential to significantly affect our businesses. As such, we are subject to extensive regulation primarily in the United States and Europe.
In June 2016, the U.K. held a referendum in which U.K. voters voted in favor of withdrawal from the European Union (Brexit), which continues to create a number of uncertainties for the financial services sector. We intend to establish certain businesses in a European Union jurisdiction, which will allow them to continue to provide services to European Union clients following Brexit. Separately, the European Commission, European Council, and European Parliament are considering legislation, EMIR 2.2, that could make changes to the E.U. equivalence and recognition regime for non-European Union clearing houses, including CME Clearing, as further discussed below.
Please also refer to the discussion below and in the “Risk Factors” section beginning on page 13 for a description of regulatory and legislative risks and uncertainties.
Regulation of our Derivatives Business, CME Clearing and NEX SEF
Our operation of U.S. futures exchanges, CME Clearing and the NEX swap execution facility (SEF) is subject to extensive regulation by the Commodity Futures Trading Commission (CFTC) that requires our regulated subsidiaries to satisfy the requirements of certain core principles relating to the operation and oversight of our markets and our clearing house. The CFTC carries out the regulation of the futures and swaps markets and clearing houses in accordance with the provisions of the Commodity Exchange Act as amended by, among others, the Commodity Futures Modernization Act and Dodd-Frank.
Regulations implementing Dodd-Frank include rules relating to the implementation of mandatory clearing of certain OTC derivatives, swap reporting, operation of a clearing house, anti-manipulation, large trader reporting, product definitions, the definition of an agricultural commodity and certain provisions of the rules applicable to designated contract markets, swap execution facilities and swap data repositories. We continue to believe these regulations provide opportunities for our business, which we continue to explore.
CME has been designated as a systemically important financial market utility and a systemically important derivatives clearing organization. These designations carry with them additional regulatory oversight of certain of our risk-management standards, clearing and settlement activities by the CFTC and the Federal Reserve Board.
In connection with the global offering of our products and clearing services, this business is also subject to the rules and regulations of the local jurisdictions in which we conduct business, including the European Securities and Markets Authority (ESMA) and the United Kingdom Financial Conduct Authority (FCA).
Regulation of our Cash Markets Business
The operation of our BrokerTec platform subjects us to regulation by the Financial Industry Regulatory Authority (FINRA) and the U.S. Securities and Exchange Commission (SEC) as a broker-dealer and alternative trading system operator. It is also subject to regulation by authorities in the European Union as a multilateral trading facility and regulated market and by the applicable regulators in Singapore and Canada. Our EBS business holds various permissions, approvals and exemptions globally, including those that subject certain of its activities to CFTC and FCA oversight.
Regulation of our Optimization Services Business
Certain of our optimization services, which enable clients to mitigate their risk, reduce operational costs, optimize their capital, and fulfill trade reporting obligations, are subject to the Swedish Financial Supervisory Authority, the FCA, CFTC and the National Futures Association, ESMA and the Australian Securities and Investments Commission.
Regulation of our Market Data Business
Our RepoFunds Rate suite of daily benchmarks for the euro, Italy, Germany, France, Spain, The Netherlands and Belgium are subject to the E.U. Benchmarks Regulations, and as such we are considered an approved Benchmark Administrator under the regulation.
Key Areas of Focus
We actively monitor and participate in the domestic and international rulemaking processes for our industry, including providing government testimony, commenting on proposed rulemakings and educating our regulators on potential impacts to the marketplace.
Our key areas of focus in the regulatory environment are:
| • | The potential impact of changes to the E.U. equivalence and recognition regime on non-European Union clearing houses and exchanges with customers based in Europe arising from the potential adoption of EMIR 2.2 legislation being considered by the European Commission, European Council, and European Parliament. This legislation, and the implementation of subsidiary regulations once the legislation is adopted, could require us to make changes to how our clearing house operates, subject us to greater regulatory oversight by ESMA and increase costs. A failure of our clearing house to retain its recognition may result in our clearing members and certain customers in Europe being subject to higher capital costs thus creating a disincentive to use our markets. The E.U. equivalence and recognition regime also has the potential to impact the cost and ease or difficulty for certain of NEX’s OTC execution platforms to provide access to customers on a global basis. |
| • | The adoption and implementation of position limit rules, which could have a significant impact on our commodities business if federal rules for position limit management differ significantly from current exchange-administered rules. |
| • | Rules respecting capital charges under Basel III with respect to clearing members of central counterparties may have negative implications for the cleared derivatives markets. Additional risks could arise through inconsistent adoption of the Basel III capital charges globally, potentially leading to disparate impacts on our customers. |
| • | The potential for further regulation stemming from industry performance disruptions and residual concerns around electronic trading activity and, in particular, "high frequency trading." |
| • | The potential elimination of the 60/40 tax treatment of certain of our futures and options contracts, which would impose a significant increase in tax rates applicable to certain market participants and could result in a decrease in their trading activity. |
| • | The implementation of a transaction tax or user fee in the United States or European Union, or in the State of Illinois, which could discourage institutions and individuals from using our markets or products or encourage them to trade in another less costly jurisdiction. From time to time, the proposed Presidential budget, including the currently proposed budget, has included a proposal to impose a user fee to fund the CFTC. Legislation to impose a financial transaction tax has again been proposed in the Illinois General Assembly, as it has in previous sessions of the General Assembly. |
| • | The implementation of legislation in the European Union impacting how benchmark index prices are formed, including new requirements for price submitters, price aggregators and markets that list contracts that reference index prices. |
| • | Concerns that European legislators will prohibit or restrict exclusive licenses for benchmark indexes, which might impact the profitability of several of our most popular contracts. |
| • | The implementation of rules resulting in negative treatment of the liquidity profile of U.S. Treasury securities, including as qualifying liquidity resources, or any potential limitation on the use of U.S. Treasury securities as collateral could result in increased costs to us and our clearing firms. |
| • | The potential for further regulation and/or industry changes flowing from the continuing review by the official sector and industry participants of the U.S. Treasury “flash rally” of October 15, 2014 and its implications for clearing and settlement in the U.S. Treasury market. |
Employees
As of December 31, 2018, we had approximately 4,590 employees. We consider relations with our employees to be good.
Executive Officers
The following are CME Group's executive officers. Ages are as of February 10, 2019.
Terrence A. Duffy, 60. Mr. Duffy has served as our Chairman and Chief Executive Officer since November 2016. Mr. Duffy previously served as our Executive Chairman and President since 2012 and as Executive Chairman from 2006. Mr. Duffy has been a member of our board of directors since 1995. He also served as President of TDA Trading, Inc. from 1981 to 2002 and has been a member of our CME exchange since 1981.
Kathleen M. Cronin, 55. Ms. Cronin has served as our Senior Managing Director, General Counsel and Corporate Secretary since 2003. Prior to joining us, Ms. Cronin was a corporate attorney at Skadden, Arps, Slate, Meagher & Flom LLP from 1989 through 1995 and from 1997 through 2002. Ms. Cronin also serves as a director of Kemper Corporation.
Sunil Cutinho, 47. Mr. Cutinho has served as President of CME Clearing since September 2014. He joined CME Group in 2002 and since then has held various positions of increasing responsibility within the organization and, most recently served as Managing Director, Deputy Head of CME Clearing from April 2014 through September 2014.
Bryan T. Durkin, 58. Mr. Durkin has served as President since November 2016. Mr. Durkin previously served as Senior Managing Director, Chief Commercial Officer since 2014 and as our Chief Operating Officer since 2007, and also held the title of Managing Director, Products and Services from 2010 to July 2012. Mr. Durkin joined us in connection with the CBOT merger and he previously held a variety of leadership roles with CBOT from 1982 to 2007, most recently as Executive Vice President and Chief Operating Officer.
Julie Holzrichter, 50. Ms. Holzrichter has served as our Senior Managing Director, Chief Operating Officer since September 2014. She previously served as our Senior Managing Director, Global Operations from 2007. Ms. Holzrichter rejoined us in 2006 as our Managing Director, CME Globex Services and Technology Integration. Ms. Holzrichter previously held positions of increasing responsibility in our organization from 1986 to 2003 in trading operations.
Kevin Kometer, 54. Mr. Kometer has served as Senior Managing Director and Chief Information Officer since 2008. He previously served as Managing Director and Deputy Chief Information Officer from 2007 to 2008. Since joining the company most recently in 1998, he has held senior leadership positions in the Technology Division, including Managing Director, Trading Execution Systems and Director, Advanced Technology. Mr. Kometer was also with the company from 1994 to 1996.
Hilda Harris Piell, 51. Ms. Piell has served as Senior Managing Director and Chief Human Resources Officer since 2007. Previously she served as Managing Director and Senior Associate General Counsel, as Director and Associate General Counsel and as Associate Director and Assistant General Counsel since joining us in 2000.
John W. Pietrowicz, 54. Mr. Pietrowicz has served as our Chief Financial Officer since December 2014. Previously, Mr. Pietrowicz served as our Senior Managing Director, Business Development and Corporate Finance since 2010. Mr. Pietrowicz joined us in 2003 and since then has held various positions of increasing responsibility, including Managing Director and Deputy Chief Financial Officer from 2009 to 2010 and Managing Director, Corporate Finance and Treasury from 2006 to 2009. Mr. Pietrowicz also serves as a director of S&P/Dow Jones Indices LLC.
Derek Sammann, 50. Mr. Sammann has served as our Senior Managing Director, Commodities and Options Products since September 2014. He previously served as our Senior Managing Director, Financial Products and Services since 2009 and Global Head of Foreign Exchange Products since joining us in 2006. Prior to joining us, Mr. Sammann served as Managing Director, Global Head of FX Options and Structured Products at Calyon Corporate and Investment Bank in London from 1997 to 2006.
Jack Tobin, 55. Mr. Tobin has served as our Chief Accounting Officer since February 2015. Mr. Tobin most recently served as our Managing Director, Corporate Finance since 2007. Prior to our merger with CBOT Holdings, Mr. Tobin served as the Director, Corporate Finance for CBOT Holdings, Inc. and CBOT from 2002 to 2007. Prior to joining CBOT, Mr. Tobin served as a principal consultant with PricewaterhouseCoopers from 1997 to 2002. Mr. Tobin is a registered certified public accountant.
Sean Tully, 55. Mr. Tully has served as Senior Managing Director, Financial and OTC Products of CME Group since September 2014. He previously served as Senior Managing Director, Interest Rates and OTC Products since February 2014. Previously, he served as Managing Director, Interest Rate and OTC Products since October 2013 and as our Managing Director, Interest Products since joining us in 2011. Before joining the company, Mr. Tully most recently served as Managing Director, Global Head of Fixed Income Trading at WestLB in London.
Julie Winkler, 44. Ms. Winkler has served as our Senior Managing Director, Chief Commercial Officer since December 2016. She previously served as Senior Managing Director, Research and Product Development and Index Services of CME Group since 2014 and as Managing Director, Research and Product Development since 2007. Prior to our merger with CBOT Holdings, Ms. Winkler held positions of increasing responsibility for CBOT Holdings since 1996. Ms. Winkler also serves as a director of S&P/Dow Jones Indices LLC.
AVAILABLE INFORMATION
Our website is www.cmegroup.com. Information made available on our website does not constitute part of this document. We make available on our website our Annual Reports on Form 10-K, Quarterly Reports on Form 10-Q, Current Reports on Form 8-K and amendments to those reports as soon as reasonably practicable after we electronically file or furnish such materials to the U.S. Securities and Exchange Commission (SEC). Our corporate governance materials, including our Corporate Governance Principles, Director Conflict of Interest Policy, Board of Directors Code of Ethics, Categorical Independence Standards, Employee Code of Conduct and the charters for all the standing committees of our board, also may be found on our website. Copies of these materials also are available to shareholders free of charge upon written request to Shareholder Relations, Attention Ms. Beth Hausoul, CME Group Inc., 20 South Wacker Drive, Chicago, Illinois 60606.
Item 1A. RISK FACTORS
In addition to the other information contained in this Annual Report on Form 10-K, you should carefully consider the factors discussed below, which are the risks we believe are material at this time. These risks could materially and adversely affect our business, financial condition and results of operations. These risks and uncertainties are not the only ones facing us. Additional risks and uncertainties not presently known to us or that we currently believe to be immaterial may also adversely affect our business.
RISKS RELATING TO OUR INDUSTRY
Our business is subject to the impact of domestic and international market, economic and political conditions that are beyond our control and that could significantly impact our business and make our financial results more volatile.
Our revenue is substantially derived from fees for transactions executed and cleared in our markets. The trading volumes in our markets are directly affected by domestic and international factors that are beyond our control, including:
| • | economic, political and geopolitical market conditions; |
| • | legislative and regulatory changes, including any direct or indirect restrictions on or increased costs associated with trading in our markets; |
| • | broad trends in the industry and financial markets; |
| • | changes in price levels, trading volumes and volatility in the derivatives, cash and OTC markets and in underlying equity, foreign exchange, interest rate and commodity markets; |
| • | shifts in global or regional demand or supply in commodities underlying our products; |
| • | competition; |
| • | changes in government monetary policies, especially central bank decisions related to quantitative easing; |
| • | availability of capital to our market participants and their appetite for risk-taking; |
| • | levels of assets under management; |
| • | volatile weather patterns, droughts, natural disasters and other catastrophes; |
| • | pandemics affecting our customer base or our ability to operate our markets; and |
| • | consolidation or expansion in our customer base and within our industry. |
Any one or more of these factors may contribute to reduced activity in our markets. Historically, periods of heightened uncertainty have tended to increase our trading volume due to increased hedging activity and the increased need to manage the risks associated with, or speculate on, volatility in the U.S. equity markets, fluctuations in interest rates and price changes in the foreign exchange, commodity and other markets. However, as evidenced by our past performance, in the period after a material market disturbance, there may persist extreme uncertainties, which may lead to decreased volume due to factors such as reduced risk exposure, lower interest rates, central bank asset purchase programs and lack of available capital. The shifts in market trading patterns we experienced as a result of the financial crisis of 2008 may or may not recur in the future, and our business will be affected by future economic uncertainties, which may result in decreased trading volume and a more difficult business environment for us. A reduction in overall trading volume or in certain products could render our markets less attractive to market participants as a source of liquidity, which could result in further loss of trading volume and associated transaction-based revenue. Material decreases in trading volume would have a material adverse effect on our financial condition and operating results.
We operate in a heavily regulated environment that imposes significant costs and competitive burdens on our business.
We are primarily subject to the jurisdiction of the regulatory agencies in the United States and Europe. As a result of our global operations, we are also subject to the rules and regulations of the local jurisdictions in which we conduct business and offer our products and services.
Due to the global financial crisis that began in 2008, the United States and numerous other governments have undertaken reviews of the legal framework governing financial markets and have either passed new laws and regulations, or are in the process of debating or enacting new laws and regulations that will impact our business. We have incurred and expect to continue to incur significant additional costs to comply with the extensive regulations that apply to our business. Additionally, regulation imposed on financial institutions or market participants generally, such as enhanced capital requirements, may adversely impact their trading activity in our markets. Also, as noted above, EMIR 2.2, the legislation being considered by the European Commission, European Council, and European Parliament, and the implementation of the regulations under this legislation, have the potential to increase our regulatory costs and/or create a disincentive for certain clients to use our products. The EU equivalence and recognition regime also has the potential to impact the cost and ease or difficulty for certain of NEX’s OTC execution platforms to provide access to customers on a global basis.
To the extent the regulatory environment is less beneficial for us or our customers, our business, financial condition and operating results could be negatively affected.
If we fail to comply with applicable laws, rules or regulations, we may be subject to censure, fines, cease-and-desist orders, suspension of our business, removal of personnel or other sanctions, including revocation of our designations as a contract market, derivatives clearing organization, swap execution facility or broker-dealer.
Legislation may be proposed, both domestically and internationally, that could add a transaction tax on our products or change the way that our market participants are taxed on the products they trade on our markets. If such proposals were to become law, they could have a negative impact on our industry and on us by making transactions more costly to market participants, which may reduce trading and could make our markets less competitive.
Please see "Item 1 – Business – Regulatory Matters" beginning on page 10 for additional information on our areas of regulatory focus.
We face intense competition from other companies. If we are not able to successfully compete, our business, financial condition and operating results will be materially harmed.
The industry in which we operate is highly competitive and we expect competition to continue to intensify, especially in light of the implementation of Dodd-Frank and other reforms of the financial services industry. We believe portions of Dodd-Frank and the corresponding regulations with respect to mandatory clearing and organized trading provide opportunities for our business. However, other reforms could negatively impact our business and our ability to compete effectively. We encounter competition in all aspects of our business, including from entities having substantially greater capital and resources, offering a wide range of products and services and in some cases operating under a different and possibly less stringent regulatory regime. We face competition from other futures, securities and securities option exchanges; OTC markets; clearing organizations; consortia formed by our members and large industry participants; swap execution facilities; alternative trade execution facilities; technology firms, including market data distributors and electronic trading system developers, and others. Many of our competitors and potential competitors have greater financial, marketing, technological and personnel resources than we do.
Our competitors may:
| • | respond more quickly to competitive pr |
Showing the first 8K of 62K characters. Open the full section
Item 1B. UNRESOLVED STAFF COMMENTS
Not applicable.
Item 2. PROPERTIES
Our corporate headquarters are located in Chicago, Illinois, at 20 South Wacker Drive. Our European headquarters are in London, where we plan to combine the NEX and CME Group offices at the London Fruit & Wool Exchange in 2019. The following is a description of our key locations and facilities.
| Location | Primary Use | Owned/Leased | Lease Expiration | Approximate Size (in square feet)(1) | |
| 20 South Wacker Drive Chicago, Illinois | Global headquarters and office space | Leased | 2032(2) | 512,000 | |
| 141 West Jackson Chicago, Illinois | Office space | Leased | 2027(3) | 150,000 | |
| 333 S. LaSalle Chicago, Illinois | Chicago trading floor and office space | Owned | N/A | 300,000 | |
| 550 West Washington Chicago, Illinois | Office space | Leased | 2023 | 250,000 | |
| One North End New York, New York | Office space | Leased | 2028(4) | 222,000 | |
| 4 Times Square New York, New York | Office space | Leased | 2032(5) | 83,000 | |
| 2 Broadgate London | Office space | Leased | 2019 | 174,000 | |
| London Fruit and Wool Exchange London | Office space | Leased | 2038(6) | 125,000 | |
| Data Center 3 Chicagoland area | Business continuity and co-location | Leased | 2031(7) | 83,000 | |
| Bagmane Tech Park Bangalore, India | Office space | Leased | 2020(8) | 72,000 |
| (1) | Size represents the amount of space leased or owned by us unless otherwise noted. |
| (2) | The extended lease expires in 2032 with various termination, extension, expansion and contraction options. |
| (3) | The initial lease expires in 2027 and contains options to extend the term and expand the premises. |
| (4) | The initial lease expires in 2028 and contains options to extend the term and expand the premises. |
| (5) | The initial lease expires in 2032 and contains options to extend the term as well as options to expand. |
| (6) | The initial lease expires in 2038 and contains the option to renew the lease. |
| (7) | In March 2016, the company sold its datacenter in the Chicago area for $130.0 million. At the time of the sale, the company leased back a portion of the property. |
| (8) | The initial lease expires in 2020 and contains an option to extend the term as well as an option to terminate early. |
Item 3. LEGAL PROCEEDINGS
See "Legal and Regulatory Matters" in note 14. Contingencies to the Consolidated Financial Statements beginning on page 77 for CME Group’s legal proceedings disclosure, which is incorporated herein by reference.
Item 4. MINE SAFETY DISCLOSURES
Not applicable.
PART II
Item 5. MARKET FOR REGISTRANT’S COMMON EQUITY, RELATED STOCKHOLDER MATTERS AND ISSUER PURCHASES OF EQUITY SECURITIES
Class A Common Stock
Our Class A common stock is currently listed on NASDAQ under the ticker symbol "CME." As of February 6, 2019, there were approximately 7,100 holders of record of our Class A common stock.
Class B Common Stock
Our Class B common stock is not listed on a national securities exchange or traded in an organized over-the-counter market. Each class of our Class B common stock is associated with a membership in a specific division of our CME exchange. CME's rules provide exchange members with trading rights and the ability to use or lease these trading rights. Each share of our Class B common stock can be transferred only in connection with the transfer of the associated trading rights.
Class B shares and the associated trading rights are bought and sold or leased through our membership department. Although our Class B shareholders have special voting rights, because our Class B shares have the same equitable interest in our earnings and the same dividend payments as our Class A shares, we expect that the market price of our Class B common stock, if reported separately from the associated trading rights, would be primarily determined by the value of our Class A common stock. As of February 6, 2019, there were approximately 1,560 holders of record of our Class B common stock.
PERFORMANCE GRAPH
The following graph and table compares the cumulative five-year total return provided to shareholders on our Class A common stock relative to the cumulative total returns of the S&P 500 index and our customized peer group. The peer group includes CBOE Holdings, Inc., IntercontinentalExchange Group, Inc. and Nasdaq, Inc. An investment of $100 (with reinvestment of all dividends) is assumed to have been made in our Class A common stock, in the peer group and the S&P 500 index on December 31, 2013, and its relative performance is tracked through December 31, 2018.
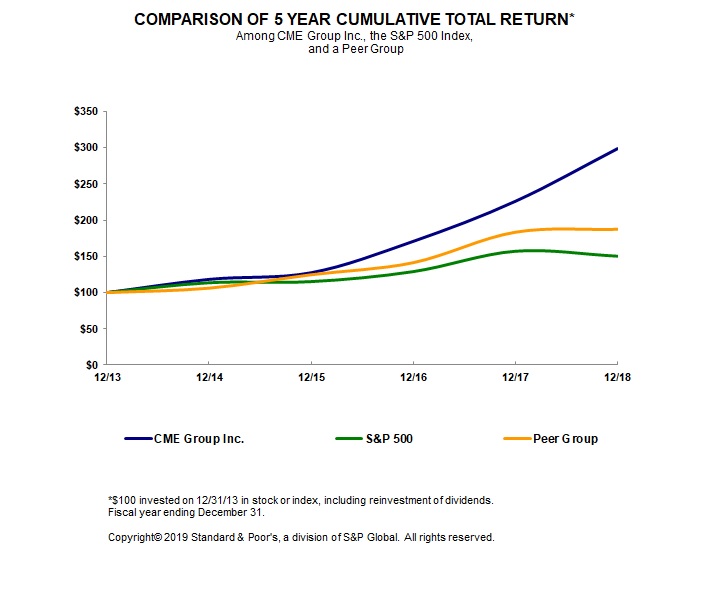
The stock price performance included in this graph is not necessarily indicative of future stock price performance.
| 2014 | 2015 | 2016 | 2017 | 2018 | |||||||||||||||
| CME Group Inc. | $ | 118.32 | $ | 127.40 | $ | 170.63 | $ | 225.79 | $ | 298.31 | |||||||||
| S&P 500 | 113.69 | 115.26 | 129.05 | 157.22 | 150.33 | ||||||||||||||
| Peer Group | 106.16 | 124.56 | 141.16 | 183.02 | 187.01 |
Unregistered Sales of Equity Securities
On November 2, 2018, CME Group and CME London Limited, a wholly-owned subsidiary of the company, completed their previously announced acquisition of NEX Group plc (NEX). The acquisition of NEX was effected by means of a scheme of arrangement under Part 26 of the U.K. Companies Act 2006. On November 5, 2018, as part of the consideration for the acquisition, the Company issued to NEX shareholders 16,926,582 shares of Company Class A Common Stock following the completion of the acquisition on November 2, 2018. The issuance of these shares was not registered under the Securities Act of 1933, as amended (Securities Act) or any state securities laws and was made in reliance on an exemption from the registration requirements of the Securities Act pursuant to Section 3(a)(10) of the Securities Act.
Issuer Purchases of Equity Securities
| Period | Total Number of Shares (or Units) Purchased(1) | Average Price Paid Per Share (or Unit) | Total Number of Shares (or Units) Purchased as Part of Publicly Announced Plans or Programs | Maximum Number (or Approximate Dollar Value) of Shares (or Units) that May Yet Be Purchased Under the Plans or Programs (in millions) | ||||||||||
| October 1 to October 31 | 5 | $ | 181.22 | — | $ | — | ||||||||
| November 1 to November 30 | 16 | 183.75 | — | — | ||||||||||
| December 1 to December 31 | 240 | 187.64 | — | — | ||||||||||
| Total | 261 | — |
| (1) | Shares purchased consist of an aggregate of 261 shares of Class A common stock surrendered to satisfy employee tax obligations upon the vesting of restricted stock. |
Item 6. SELECTED FINANCIAL DATA
On November 2, 2018, CME Group completed its acquisition of NEX Group plc (NEX). The following data includes the financial results of NEX beginning November 3, 2018.
In the first quarter of 2018, the company adopted the Financial Accounting Standards Board's (FASB) standards update on changes to the presentation of certain components of defined benefit pension costs. Under previous accounting guidance, the components of pension costs were aggregated for reporting in the financial statements within compensation and benefits expense on the consolidated statements of income. The amendments in the update require that the service cost component is reported in the same line as other compensation costs, whereas the other components of net benefit cost are required to be presented on the consolidated statements of income separately from the service cost component. The company has included the other components within non-operating income (expense). This update was adopted as of January 1, 2018 with retrospective application to the earliest period presented, as if the new accounting policy was in effect during those periods. The change in accounting policy has been reflected in the following table.
| Year Ended or At December 31 | ||||||||||||||||||||
| (in millions, except per share data) | 2018 | 2017 | 2016 | 2015 | 2014 | |||||||||||||||
| Income Statement Data: | ||||||||||||||||||||
| Total revenues | $ | 4,309.4 | $ | 3,644.7 | $ | 3,595.2 | $ | 3,326.8 | $ | 3,112.5 | ||||||||||
| Operating income | 2,607.6 | 2,310.6 | 2,200.5 | 1,984.9 | 1,764.6 | |||||||||||||||
| Non-operating income (expense) | 170.2 | 215.7 | 87.1 | (28.1 | ) | 6.8 | ||||||||||||||
| Income before income taxes | 2,777.8 | 2,526.3 | 2,287.6 | 1,956.8 | 1,771.4 | |||||||||||||||
| Net income attributable to CME Group | 1,962.2 | 4,063.4 | 1,534.1 | 1,247.0 | 1,127.1 | |||||||||||||||
| Earnings per common share attributable to CME Group: | ||||||||||||||||||||
| Basic | $ | 5.73 | $ | 12.00 | $ | 4.55 | $ | 3.71 | $ | 3.37 | ||||||||||
| Diluted | 5.71 | 11.94 | 4.53 | 3.69 | 3.35 | |||||||||||||||
| Cash dividends per share | 4.55 | 6.14 | 5.65 | 4.90 | 3.88 | |||||||||||||||
| Balance Sheet Data: | ||||||||||||||||||||
| Total assets | $ | 77,475.7 | $ | 75,791.2 | $ | 69,369.4 | $ | 67,359.4 | $ | 72,228.6 | ||||||||||
| Short-term debt | 574.2 | — | — | — | — | |||||||||||||||
| Long-term debt | 3,826.8 | 2,233.1 | 2,231.2 | 2,229.3 | 2,095.0 | |||||||||||||||
| CME Group shareholders’ equity | 25,918.5 | 22,411.8 | 20,340.7 | 20,551.8 | 20,923.5 |
The following table presents key statistical information on the volume of contracts traded, expressed in round turn trades. All amounts exclude our interest rate swaps and credit default swaps contracts as well as volume data for BrokerTec and EBS.
| Year Ended or At December 31 | |||||||||||||||
| (in thousands) | 2018 | 2017 | 2016 | 2015 | 2014 | ||||||||||
| Average Daily Volume: | |||||||||||||||
| Product Lines: | |||||||||||||||
| Interest rates | 9,951 | 8,189 | 7,517 | 6,720 | 7,009 | ||||||||||
| Equity indexes | 3,589 | 2,682 | 3,061 | 2,792 | 2,764 | ||||||||||
| Foreign exchange | 1,004 | 922 | 858 | 872 | 803 | ||||||||||
| Agricultural commodities | 1,480 | 1,353 | 1,321 | 1,265 | 1,120 | ||||||||||
| Energy | 2,561 | 2,578 | 2,432 | 1,970 | 1,630 | ||||||||||
| Metals | 639 | 568 | 460 | 344 | 337 | ||||||||||
| Total Average Daily Volume | 19,224 | 16,292 | 15,649 | 13,963 | 13,663 | ||||||||||
| Method of Trade: | |||||||||||||||
| CME Globex | 17,371 | 14,513 | 13,766 | 12,185 | 11,805 | ||||||||||
| Open outcry | 1,168 | 1,107 | 1,149 | 1,139 | 1,176 | ||||||||||
| Privately negotiated | 685 | 672 | 734 | 639 | 682 | ||||||||||
| Total Average Daily Volume | 19,224 | 16,292 | 15,649 | 13,963 | 13,663 | ||||||||||
| Other Data: | |||||||||||||||
| Total Contract Volume (round turn trades) | 4,844,406 | 4,089,175 | 3,943,670 | 3,532,521 | 3,443,051 | ||||||||||
| Open Interest at Year End (contracts) | 115,669 | 108,043 | 102,930 | 91,369 | 93,644 |
Item 7. MANAGEMENT’S DISCUSSION AND ANALYSIS OF FINANCIAL CONDITION AND RESULTS OF OPERATIONS
INTRODUCTION
Management’s Discussion and Analysis of Financial Condition and Results of Operations is organized as follows:
| • | Executive Summary: Includes an overview of our business; current economic, competitive and regulatory trends relevant to our business; our current business strategy; and our primary sources of operating and non-operating revenues and expenses. |
| • | Critical Accounting Policies: Provides an explanation of accounting policies which may have a significant impact on our financial results and the estimates, assumptions and risks associated with those policies. |
| • | Recent Accounting Pronouncements: Includes an evaluation of recent accounting pronouncements and the potential impact of their future adoption on our financial results. |
| • | Results of Operations: Includes an analysis of our 2018, 2017 and 2016 financial results and a discussion of any known events or trends which are likely to impact future results. |
| • | Liquidity and Capital Resources: Includes a discussion of our future cash requirements, capital resources, significant planned expenditures and financing arrangements. |
On November 2, 2018, we completed our acquisition of NEX Group plc (NEX). The following Management's Discussion and Analysis of Financial Condition and Results of Operations includes the financial results of NEX beginning on November 3, 2018.
References in this discussion and analysis to “we” and “our” are to CME Group Inc. (CME Group) and its consolidated subsidiaries, collectively. References to “exchange” are to Chicago Mercantile Exchange Inc. (CME), the Board of Trade of the City of Chicago, Inc. (CBOT), New York Mercantile Exchange, Inc. (NYMEX), Commodity Exchange, Inc. (COMEX), and NEX, collectively, unless otherwise noted.
EXECUTIVE SUMMARY
Business Overview
CME Group, a Delaware stock corporation, is the holding company for CME, CBOT, NYMEX, COMEX, NEX and their respective subsidiaries. The holding company structure is designed to provide strategic and operational flexibility. CME Group's Class A common stock is listed on the NASDAQ Global Select Market (NASDAQ) under the ticker symbol "CME."
Our exchange consists of designated contract markets for the trading of futures and options on futures contracts. We also clear futures, options on futures and swaps contracts through our clearing house. Futures contracts, options on futures contracts and swaps contracts provide investors with vehicles for protecting against, and potentially profiting from, price changes in financial instruments and physical commodities.
We are a global exchange with customer access available virtually all over the world. Our customers consist of professional traders, financial derivatives institutions, individual and institutional investors, major corporations, manufacturers, producers and governments. Customers include both members of the exchange and non-members.
We offer our customers the opportunity to trade futures contracts and options on futures contracts on a range of products including those based on interest rates, equity indexes, foreign exchange, agricultural commodities, energy and metals. Through our acquisition of NEX, we now offer fixed income trading through BrokerTec and foreign currency trading through EBS, which are both included in the cash markets business. Our products provide a means for hedging, speculating and allocating assets. We identify new products by monitoring economic trends and their impact on the risk management and speculative needs of our existing and prospective customers.
Most of our products are available for trading through our electronic trading platforms. These execution facilities offer our customers immediate trade execution and price transparency. In addition, trades can be executed through privately negotiated transactions that are cleared and settled through our clearing house.
Through the acquisition with NEX, we now provide optimization services that deliver transaction lifecycle management and information services to help our customers optimize their capital, mitigate their risk and reduce operational costs. Optimization services includes Traiana and TriOptima.
Our clearing house clears, settles and guarantees futures and options contracts traded through our exchanges, in addition to cleared swaps products. Our clearing house's performance guarantee is an important function of our business. Because of this guarantee, our customers do not need to evaluate the credit of each potential counterparty or limit themselves to a selected set of counterparties. This flexibility increases the potential liquidity available for each trade. Additionally, the substitution of our
clearing house as the counterparty to every transaction allows our customers to establish a position with one party and offset the position with another party. This contract offsetting process provides our customers with flexibility in establishing and adjusting positions and provides for collateral and margining efficiencies. Certain BrokerTec and EBS contracts are cleared at third-party clearing houses.
Business Trends
Economic Environment. Our customers continue to use our markets as an effective and transparent means to manage risk and meet their investment needs despite economic uncertainty and volatility. Trading activity in our centralized markets has fluctuated due to the ongoing uncertainty in the financial markets caused by the United States and European credit crises, fluctuations in the availability of credit, variations in the amount of assets under management as well as the Federal Reserve Bank’s interest rate policy and quantitative easing. We continue to maintain high quality and diverse products as well as various clearing and market data services which support our customers in any economic environment.
Competitive Environment. Our industry is competitive and we continue to encounter competition in all aspects of our business. We expect competition to continue to intensify, especially in light of ongoing regulatory reform in the financial services industry. Competition is influenced by our brand and reputation; the efficiency and security of our services; depth and liquidity of our markets; diversity of product offerings including rate and quality of new product development and innovative services; our ability to position and expand upon existing products; efficient and seamless customer experience; transparency, reliability and anonymity of transaction processing; the regulatory environment; connectivity, accessibility, flexibility in execution methods; efficient and innovative technology and connectivity, as well as transaction costs. We believe we are very well positioned with respect to these factors. Our asset classes contain products designed to address differing risk management needs, and customers are able to achieve operational and capital efficiencies by accessing our diverse products through our platforms and our clearing house. We face competition from other futures, securities and securities option exchanges; clearing organizations; swap execution facilities; alternative trade execution facilities; technology firms, including market data distributors and electronic trading system developers; and others. As markets continue to evolve, we will continue to adapt our trading technology and clearing services to meet the needs of our customers.
Regulatory Environment. Exchange-traded derivatives have historically been subject to extensive regulation. Developments in the regulatory environment have the potential to significantly impact our business. Compliance with regulations may require us and our customers to dedicate significant financial and operational resources which could adversely affect our profitability. The regulatory environment to which we are subject is discussed in "Item 1.
Showing the first 8K of 83K characters. Open the full section
Item 7A. QUANTITATIVE AND QUALITATIVE DISCLOSURES ABOUT MARKET RISK
We are subject to various market risks, including those caused by changes in interest rates, credit, foreign currency exchange rates and equity prices.
Interest Rate Risk
Debt outstanding at December 31, 2018 consisted of fixed-rate borrowings of $4.4 billion (in U.S. dollar equivalent). Changes in interest rates impact the fair values of fixed-rate debt, but do not impact earnings or cash flows. We did not have any variable-rate borrowings at December 31, 2018. At December 31, 2018, we maintained $389.9 million of commercial paper. Commercial paper is considered a fixed rate borrowing; however, because maturities for commercial paper are generally less than 90 days, commercial paper is considered subject to interest rate fluctuations.
Credit Risk
CME Clearing House
Our clearing house acts as the counterparty to all trades consummated on our exchanges as well as through third party exchanges and swaps markets for which we provide clearing services. As a result, we are exposed to significant credit risk of third parties, including clearing firms. We are also exposed, indirectly, to the credit risk of customers of our clearing firms. These parties may default on their obligations due to bankruptcy, lack of liquidity, operational failure or other reasons.
In order to ensure performance, we establish and monitor financial requirements for our clearing firms. We set minimum performance bond requirements for exchange-traded and interest rate swaps products. For clearing firms, we establish performance bond requirements to cover at least 99% of expected price changes for a given product within a given historical period with further quantitative and qualitative considerations based on market risk. We establish haircuts applied to collateral deposited to meet performance bond requirements to cover at least 99% of expected price changes and foreign currency changes for a given asset within a given historical period with further quantitative and qualitative considerations. Haircuts vary depending on the type of collateral and maturity. We mark-to-market open positions of clearing firms at least once a day (twice a day for futures and options contracts) and require payment from clearing firms whose positions have lost value and make payments to clearing firms whose positions have gained value. We have the capability to mark-to-market more frequently as market conditions warrant. These practices allow our clearing house to quickly identify any clearing firms that may not be able to satisfy the financial obligations resulting from changes in the prices of their open positions before those financial obligations become exceptionally large and jeopardize the ability of our clearing house to ensure performance of their open positions.
Although we have policies and procedures to help ensure that our clearing firms can satisfy their obligations, these policies and procedures may not succeed in detecting problems or preventing defaults. We also have in place various measures intended to enable us to cover any default and maintain liquidity.
Despite our safeguards, we cannot assure you that these measures will be sufficient to protect us from a default or that we will not be materially and adversely affected in the event of a significant default.
We maintain two separate financial safeguard packages:
| • | a financial safeguard package for all futures and options contracts other than cleared interest rate swap contracts (base package); and |
| • | a financial safeguard package for cleared interest rate swap contracts. |
In the unlikely event of a payment default by a clearing firm, we would first apply assets of the defaulting clearing firm to satisfy its payment obligation. These assets include the defaulting firm's guaranty fund contributions, performance bonds and any other available assets, such as assets required for clearing membership and any associated trading rights. In addition, we would make a demand for payment pursuant to any applicable guarantee provided to us by the parent company of the clearing firm. Thereafter, if the payment default remains unsatisfied, we would use our corporate contributions designated for the respective financial safeguard package. We would then use guaranty fund contributions of other clearing firms within the
respective financial safeguard package and funds collected through an assessment against solvent clearing firms within the respective financial safeguard package to satisfy the deficit.
We maintain a $7.0 billion 364-day multi-currency line of credit with a consortium of domestic and international banks to be used in certain situations by CME Clearing. We have the option to request an increase in the line from $7.0 billion to $10.0 billion. We may use the proceeds to provide temporary liquidity in the unlikely event of a clearing firm default, in the event of a liquidity constraint or default by a depositary (custodian of the collateral) or in the event of a temporary disruption with the payments systems that would delay payment of settlement variation between us and our clearing firms. The credit agreement requires us to pledge certain assets to the line of credit custodian prior to drawing on the line of credit. Pledged assets may include clearing firm guaranty fund deposits held by us in the form of cash or U.S. Treasury securities. Performance bond collateral of a defaulting clearing firm may also be used to secure a draw on the line. In addition to the 364-day multi-currency line of credit, we also have the option to use our $2.4 billion multi-currency revolving senior credit facility to provide liquidity for our clearing house in the unlikely event of default.
At December 31, 2018, aggregate performance bond deposits for clearing firms for both financial safeguard packages was $143.2 billion including $38.2 billion of cash performance bond deposits and $2.7 billion of letters of credit. A defaulting firm's performance bond deposits can be used in the event of default of that clearing firm.
The following shows the available assets at December 31, 2018 in the event of a payment default by a clearing firm for the base financial safeguard package after first utilizing the defaulting firm's available assets:
| (in millions) | CME Clearing Available Assets | |||
| Designated corporate contributions for futures and options(1) | $ | 100.0 | ||
| Guaranty fund contributions(2) | 4,096.0 | |||
| Assessment powers(3) | 11,264.0 |
| (1) | CME Clearing designates $100.0 million of corporate contributions to satisfy a clearing firm default in the event that the defaulting clearing firm's guaranty contributions and performance bonds do not satisfy the deficit. |
| (2) | Guaranty fund contributions of clearing firms include guaranty fund contributions required of clearing firms, but do not include any excess deposits held by us at the direction of clearing firms. |
| (3) | In the event of a clearing firm default, if a loss continues to exist after the utilization of the assets of the defaulted firm, our corporate contribution and the non-defaulting clearing firms' guaranty fund contributions, we would assess all non-defaulting clearing members as provided in the rules governing the guaranty fund. We could assess non-defaulting clearing members 275% of their existing guaranty fund requirements up to a maximum of 550% of their existing guaranty fund requirements as provided in the rules. Assessment powers are calculated to reflect the potential obligation that each clearing member could be called for in the event clearing member defaults exhaust the guaranty fund, however the total amount available would be reduced by the defaulted clearing members assessment obligations since they would no longer be able to satisfy their obligations. |
The following shows the available assets for the interest rate swap financial safeguard package at December 31, 2018 in the event of a payment default by a clearing firm that clears interest rate swap contracts, after first utilizing the defaulting firm's available assets:
| (in millions) | CME Clearing Available Assets | |||
| Designated corporate contributions for interest rate swap contracts(1) | $ | 150.0 | ||
| Guaranty fund contributions(2) | 3,319.5 | |||
| Assessment powers(3) | 1,121.9 |
| (1) | CME Clearing designates $150.0 million of corporate contributions to satisfy a clearing firm default in the event that the defaulting clearing firm's guaranty contributions and performance bonds do not satisfy the deficit. |
| (2) | Guaranty fund contributions of clearing firms for interest rate swap contracts include guaranty fund contributions required of those clearing firms. |
| (3) | In the event of a clearing firm default, if a loss continues to exist after the utilization of the assets of the defaulted firm, our corporate contribution and the non-defaulting firms' guaranty fund contributions, we would assess non-defaulting clearing members as provided in the rules governing the interest rate swap guaranty fund. |
BrokerTec Matched Principal Business
BrokerTec maintains a matched principal business, where it serves as a fully matched counterparty to offsetting positions entered into by clients on its electronic trading platform to facilitate anonymity and access to clearing and settlement. BrokerTec uses Fixed Income Clearing Corporation (FICC), a third-party central clearing house as well as a third-party clearing
bank for the settlement of transactions and is required to post short-term margin requirements twice a day that can vary based on the size of unsettled transactions and any adverse market changes. At December 31, 2018, the balance of the collateral at FICC was $100.0 million, which was included in other current assets on the consolidated balance sheet.
Without sufficient funds to meet its obligations, BrokerTec could be exposed to risk of breach of contract with the counterparties and the inability to continue as a member of the third-party central clearing house. Transactions with clearing house members are typically confirmed and novated shortly after execution, at which point the clearing house assumes the risk of settlement. For transactions with counterparties that are not members of the clearing house, settlement typically occurs on the day following execution and, prior to settlement, BrokerTec is exposed to the risk of loss in the event a counterparty fails to meet its obligations. If that were to occur, BrokerTec would have the right to cover or liquidate the open position but could incur a loss as a result of market movements.
Foreign Currency Exchange Rate Risk
Foreign Currency Transaction Risk
We have foreign currency transaction risk related to changes in exchange rates on monetary assets, liabilities, revenues and expenses held at subsidiaries where those balances and activity are denominated in a currency other than the subsidiary's functional currency. Gains and losses on foreign currency transactions result primarily from cash, debt and other monetary assets, liabilities, revenues and expenses denominated in British pounds, euros and Japanese yen. During 2018, we maintained a restricted cash balance of $1.6 billion held for the acquisition of NEX, which was denominated in British pounds. This cash balance contributed to a significant portion of the net foreign currency transaction loss incurred in 2018.
In conjunction with the acquisition, we assumed the outstanding debt of NEX on the acquisition date, which includes a €350.0 million Eurobond maturing in March 2019, a ¥19.1 billion term loan due in March 2019 and a €15.0 million fixed rate note maturing in May 2023. Since the debt is denominated in euros and Japanese yen, we have foreign currency transaction risk related to changes in these currencies until the debt is repaid. We maintain a hedge contract on the exchange rate risk between the Japanese yen and the British pound on the maturing principal and interest payments of the Japanese yen-based term loan, but we have foreign currency transaction risk between the U.S. dollar and the British pound until the Japanese yen-based term loan is repaid. We also maintain a cross-currency swap on part of the outstanding par value on our €350.0 million Eurobond maturing in March 2019, which swaps our euro-based principal and interest payments for British pound-based payments.
Aggregate transaction gains (losses) for 2018, 2017 and 2016 were $(73.6) million, $9.4 million and $(24.5) million, respectively. We expect the foreign currency gain/loss to continue to fluctuate as long as we continue to hold monetary assets and liabilities at those subsidiaries.
Foreign Currency Translation Risk
We have foreign currency translation risk related to the translation of our foreign subsidiaries' assets, liabilities, revenues and expenses from their respective functional currencies to the U.S. dollar at each reporting date. Fluctuations in exchange rates may impact the amount of assets, liabilities, revenues and expenses we report on our consolidated balance sheets and consolidated statements of income. The financial statements of those foreign subsidiaries with functional currencies other than the U.S. dollar are translated into U.S. dollars using a current exchange rate. Gains and losses resulting from this translation are recognized as a foreign currency translation adjustment within accumulated other comprehensive income, which is a component of shareholders' equity and comprehensive income. Aggregate translation gains (losses), net of tax, for 2018, 2017 and 2016 were $(2.5) million, $7.5 million and $(6.9) million, respectively.
Foreign Currency Exchange Risk Related to Customer Collateral
A portion of performance bond deposits is denominated in various foreign currencies. We mark-to-market all deposits daily and require payment from clearing firms whose collateral has lost value due to changes in foreign currency rates and price. Therefore, our exposure to foreign currency risk related to performance bond deposits is considered minimal and is not expected to be material to our financial condition or operating results.
Item 8. FINANCIAL STATEMENTS AND SUPPLEMENTARY DATA
CME GROUP INC. AND SUBSIDIARIES
CONSOLIDATED BALANCE SHEETS
(dollars in millions, except per share data; shares in thousands)
| December 31, | |||||||
| 2018 | 2017 | ||||||
| Assets | |||||||
| Current Assets: | |||||||
| Cash and cash equivalents | $ | 1,374.5 | $ | 1,903.6 | |||
| Marketable securities | 72.9 | 90.1 | |||||
| Accounts receivable, net of allowance of $2.7 and $2.2 | 553.3 | 359.7 | |||||
| Other current assets (includes $1.5 and $0 in restricted cash) | 430.5 | 367.8 | |||||
| Performance bonds and guaranty fund contributions | 39,455.5 | 44,185.3 | |||||
| Total current assets | 41,886.7 | 46,906.5 | |||||
| Property, net | 448.7 | 399.7 | |||||
| Intangible assets—trading products | 17,175.3 | 17,175.3 | |||||
| Intangible assets—other, net | 5,500.1 | 2,346.3 | |||||
| Goodwill | 10,805.3 | 7,569.0 | |||||
| Other assets (includes $1.2 and $2.4 in restricted cash) | 1,659.6 | 1,394.4 | |||||
| Total Assets | $ | 77,475.7 | $ | 75,791.2 | |||
| Liabilities and Equity | |||||||
| Current Liabilities: | |||||||
| Accounts payable | $ | 116.0 | $ | 31.3 | |||
| Short-term debt | 574.2 | — | |||||
| Other current liabilities | 1,126.9 | 1,456.3 | |||||
| Performance bonds and guaranty fund contributions | 39,455.5 | 44,185.3 | |||||
| Total current liabilities | 41,272.6 | 45,672.9 | |||||
| Long-term debt | 3,826.8 | 2,233.1 | |||||
| Deferred income tax liabilities, net | 5,665.9 | 4,857.7 | |||||
| Other liabilities | 745.1 | 615.7 | |||||
| Total Liabilities | 51,510.4 | 53,379.4 | |||||
| Shareholders’ Equity: | |||||||
| Preferred stock, $0.01 par value, 10,000 shares authorized as of December 31, 2018 and 2017; none issued | — | — | |||||
| Class A common stock, $0.01 par value, 1,000,000 shares authorized as of December 31, 2018 and 2017, 356,824 and 339,235 shares issued and outstanding as of December 31, 2018 and 2017, respectively | 3.6 | 3.4 | |||||
| Class B common stock, $0.01 par value, 3 shares authorized, issued and outstanding as of December 31, 2018 and 2017 | — | — | |||||
| Additional paid-in capital | 21,054.3 | 17,896.9 | |||||
| Retained earnings | 4,855.3 | 4,497.2 | |||||
| Accumulated other comprehensive income (loss) | 5.3 | 14.3 | |||||
| Total CME Group shareholders’ equity | 25,918.5 | 22,411.8 | |||||
| Non-controlling interests | 46.8 | — | |||||
| Total Equity | 25,965.3 | 22,411.8 | |||||
| Total Liabilities and Equity | $ | 77,475.7 | $ | 75,791.2 |
See accompanying notes to consolidated financial statements.
CME GROUP INC. AND SUBSIDIARIES
CONSOLIDATED STATEMENTS OF INCOME
(dollars in millions, except per share data; shares in thousands)
| Year Ended December 31, | |||||||||||
| 2018 | 2017 | 2016 | |||||||||
| Revenues | |||||||||||
| Clearing and transaction fees | $ | 3,667.0 | $ | 3,098.6 | $ | 3,036.4 | |||||
| Market data and information services | 449.6 | 391.8 | 406.5 | ||||||||
| Other | 192.8 | 154.3 | 152.3 | ||||||||
| Total Revenues | 4,309.4 | 3,644.7 | 3,595.2 | ||||||||
| Expenses | |||||||||||
| Compensation and benefits | 672.2 | 563.9 | 543.2 | ||||||||
| Technology | 117.2 | 101.6 | 97.6 | ||||||||
| Professional fees and outside services | 166.1 | 117.6 | 144.4 | ||||||||
| Amortization of purchased intangibles | 130.0 | 95.5 | 96.1 | ||||||||
| Depreciation and amortization | 118.7 | 113.0 | 129.2 | ||||||||
| Licensing and other fee agreements | 170.6 | 146.3 | 135.8 | ||||||||
| Other | 327.0 | 196.2 | 248.4 | ||||||||
| Total Expenses | 1,701.8 | 1,334.1 | 1,394.7 | ||||||||
| Operating Income | 2,607.6 | 2,310.6 | 2,200.5 | ||||||||
| Non-Operating Income (Expense) | |||||||||||
| Investment income | 745.1 | 531.7 | 141.8 | ||||||||
| Interest and other borrowing costs | (157.7 | ) | (117.0 | ) | (123.5 | ) | |||||
| Equity in net earnings (losses) of unconsolidated subsidiaries | 152.8 | 129.2 | 110.2 | ||||||||
| Other non-operating income (expense) | (570.0 | ) | (328.2 | ) | (41.4 | ) | |||||
| Total Non-Operating Income (Expense) | 170.2 | 215.7 | 87.1 | ||||||||
| Income before Income Taxes | 2,777.8 | 2,526.3 | 2,287.6 | ||||||||
| Income tax provision (benefit) | 814.1 | (1,537.1 | ) | 753.5 | |||||||
| Net Income | 1,963.7 | 4,063.4 | 1,534.1 | ||||||||
| Less: net (income) loss attributable to non-controlling interests | (1.5 | ) | — | — | |||||||
| Net Income Attributable to CME Group | $ | 1,962.2 | $ | 4,063.4 | $ | 1,534.1 | |||||
| Earnings per Common Share Attributable to CME Group: | |||||||||||
| Basic | $ | 5.73 | $ | 12.00 | $ | 4.55 | |||||
| Diluted | 5.71 | 11.94 | 4.53 | ||||||||
| Weighted Average Number of Common Shares: | |||||||||||
| Basic | 342,344 | 338,707 | 337,496 | ||||||||
| Diluted | 343,737 | 340,226 | 338,966 |
See accompanying notes to consolidated financial statements.
CME GROUP INC. AND SUBSIDIARIES
CONSOLIDATED STATEMENTS OF COMPREHENSIVE INCOME
(in millions)
| Year Ended December 31, | |||||||||||||
| 2018 | 2017 | 2016 | |||||||||||
| Net income | $ | 1,963.7 | $ | 4,063.4 | $ | 1,534.1 | |||||||
| Other comprehensive income, net of tax: | |||||||||||||
| Investment securities: | |||||||||||||
| Net unrealized holding gains (losses) arising during the period | (0.8 | ) | 30.2 | 170.0 | |||||||||
| Reclassification of gains (losses) on sale included in investment income | — | (89.5 | ) | (48.7 | ) | ||||||||
| Income tax benefit (expense) | 0.2 | 79.4 | (45.8 | ) | |||||||||
| Investment securities, net | (0.6 | ) | 20.1 | 75.5 | |||||||||
| Defined benefit plans: | |||||||||||||
| Net change in defined benefit plans arising during the period | (15.3 | ) | 0.3 | (5.1 | ) | ||||||||
| Amortization of net actuarial (gains) losses and prior service costs included in compensation and benefits expense | 2.6 | 2.9 | 3.2 | ||||||||||
| Income tax benefit (expense) | 3.2 | (1.5 | ) | 0.7 | |||||||||
| Defined benefit plans, net | (9.5 | ) | 1.7 | (1.2 | ) | ||||||||
| Derivative investments: | |||||||||||||
| Net unrealized holding gains (losses) arising during the period | 0.9 | — | — | ||||||||||
| Amortization of effective portion of net (gains) losses on cash flow hedges included in interest expense | (1.2 | ) | (1.2 | ) | (1.2 | ) | |||||||
| Income tax benefit (expense) | 0.1 | 0 |
Showing the first 8K of 151K characters. Open the full section
Item 9. CHANGES IN AND DISAGREEMENTS WITH ACCOUNTANTS ON ACCOUNTING AND FINANCIAL DISCLOSURE
Not applicable.
Item 9A. CONTROLS AND PROCEDURES
Evaluation of Disclosure Controls and Procedures
Our management, with the participation of our Chief Executive Officer and Chief Financial Officer, has evaluated the effectiveness of our disclosure controls and procedures (as such term is defined in Rules 13a-15(e) and 15d-15(e) under the Securities Exchange Act of 1934, as amended (Exchange Act)) as of the end of the period covered by this Annual Report on Form 10-K. Based on such evaluation, our Chief Executive Officer and Chief Financial Officer have concluded that, as of the end of such period, our disclosure controls and procedures are effective.
Changes in Internal Control over Financial Reporting
As required by Rule 13a-15(d) under the Exchange Act, the company's management, including the company's Chief Executive Officer and Chief Financial Officer, have evaluated the company's internal control over financial reporting (as such term is defined in Rules 13a-15(f) and 15d-15(f) under the Exchange Act) to determine whether any changes occurred during the fourth quarter of 2018 that have materially affected, or are reasonably likely to materially affect, the company's internal control over financial reporting. During the fourth quarter of 2018, we acquired NEX and are in the process of integrating the acquired business into our overall internal control over financial reporting process. As permitted under applicable regulations, we have excluded NEX from the assessment of internal control over financial reporting as of December 31, 2018. There were no other changes in the company’s internal control over financial reporting which occurred during 2018, that have materially affected, or are reasonably likely to materially affect, the company’s internal control over financial reporting.
Management’s Annual Report on Internal Control over Financial Reporting
Management is responsible for establishing and maintaining adequate internal control over financial reporting. Our internal control system has been designed to provide reasonable assurance to management and the board of directors regarding the preparation and fair presentation of published financial statements.
Management assessed the effectiveness of the Company’s internal control over financial reporting as of December 31, 2018. Management based its assessment on criteria for effective internal control over financial reporting described in Internal Control-Integrated Framework issued by the Committee of Sponsoring Organizations of the Treadway Commission (2013 framework). Management’s assessment included evaluating the design of our internal control over financial reporting and testing the operational effectiveness of our internal control over financial reporting. The results of its assessment were reviewed with the audit committee of the board of directors.
Based on this assessment, management believes that, as of December 31, 2018, our internal control over financial reporting is effective. The effectiveness of our internal control over financial reporting as of December 31, 2018 has been audited by Ernst & Young LLP, an independent registered public accounting firm, as stated in the report on page 86.
Report of Independent Registered Public Accounting Firm
To the Shareholders and the Board of Directors of CME Group Inc. and Subsidiaries
Opinion on the Financial Statements
We have audited the accompanying consolidated balance sheets of CME Group Inc. and subsidiaries (the Company) as of December 31, 2018 and 2017, the related consolidated statements of income, comprehensive income, equity, and cash flows for each of the three years in the period ended December 31, 2018, and the related notes and financial statement schedule listed in the Index at Item 15(a) (collectively referred to as the “consolidated financial statements”). In our opinion, the consolidated financial statements present fairly, in all material respects, the financial position of the Company at December 31, 2018 and 2017, and the results of its operations and its cash flows for each of the three years in the period ended December 31, 2018, in conformity with U.S. generally accepted accounting principles.
We also have audited, in accordance with the standards of the Public Company Accounting Oversight Board (United States) (PCAOB), the Company’s internal control over financial reporting as of December 31, 2018, based on criteria established in Internal Control-Integrated Framework issued by the Committee of Sponsoring Organizations of the Treadway Commission (2013 framework) and our report dated February 28, 2019 expressed an unqualified opinion thereon.
Basis for Opinion
These financial statements are the responsibility of the Company’s management. Our responsibility is to express an opinion on the Company’s financial statements based on our audits. We are a public accounting firm registered with the PCAOB and are required to be independent with respect to the Company in accordance with the U.S. federal securities laws and the applicable rules and regulations of the Securities and Exchange Commission and the PCAOB.
We conducted our audits in accordance with the standards of the PCAOB. Those standards require that we plan and perform the audit to obtain reasonable assurance about whether the financial statements are free of material misstatement, whether due to error or fraud. Our audit included performing procedures to assess the risks of material misstatement of the financial statements, whether due to error or fraud, and performing procedures that respond to those risks. Such procedures included examining, on a test basis, evidence regarding the amounts and disclosures in the financial statements. Our audits also included evaluating the accounting principles used and significant estimates made by management, as well as evaluating the overall presentation of the financial statements. We believe that our audits provides a reasonable basis for our opinion.
/s/ Ernst & Young LLP
We have served as the Company’s auditor since 2002.
Chicago, Illinois
February 28, 2019
Report of Independent Registered Public Accounting Firm
To the Shareholders and the Board of Directors of CME Group Inc. and Subsidiaries
Opinion on Internal Control over Financial Reporting
We have audited CME Group Inc. and subsidiaries’ internal control over financial reporting as of December 31, 2018, based on criteria established in Internal Control-Integrated Framework issued by the Committee of Sponsoring Organizations of the Treadway Commission (2013 framework) (the COSO criteria). In our opinion, CME Group Inc. and subsidiaries (the Company) maintained, in all material respects, effective internal control over financial reporting as December 31, 2018, based on the COSO criteria.
As indicated in the accompanying Management’s Annual Report on Internal Control over Financial Reporting, management’s assessment of and conclusion on the effectiveness of internal control over financial reporting did not include the internal controls of NEX Group Plc, which is included in the 2018 consolidated financial statements of the Company and constituted 10% and 18% of total and net assets, respectively, as of December 31, 2018 and 3% and -2% of revenues and net income, respectively, for the year then ended. Our audit of internal control over financial reporting of the Company also did not include an evaluation of the internal control over financial reporting of NEX Group Plc.
We also have audited, in accordance with the standards of the Public Company Accounting Oversight Board (United States) (PCAOB), the consolidated balance sheets of CME Group Inc. and subsidiaries as of December 31, 2018 and 2017, the related consolidated statements of income, comprehensive income, equity and cash flows for each of the three years in the period ended December 31, 2018, and the related notes and financial statement schedule listed in the Index at Item 15(a) and our report dated February 28, 2019 expressed an unqualified opinion thereon.
Basis for Opinion
The Company’s management is responsible for maintaining effective internal control over financial reporting and for its assessment of the effectiveness of internal control over financial reporting included in the accompanying Management’s Annual Report on Internal Control over Financial Reporting. Our responsibility is to express an opinion on the Company’s internal control over financial reporting based on our audit. We are a public accounting firm registered with the PCAOB and are required to be independent with respect to the Company in accordance with the U.S. federal securities laws and the applicable rules and regulations of the Securities and Exchange Commission and the PCAOB.
We conducted our audit in accordance with the standards of the PCAOB. Those standards require that we plan and perform the audit to obtain reasonable assurance about whether effective internal control over financial reporting was maintained in all material respects.
Our audit included obtaining an understanding of internal control over financial reporting, assessing the risk that a material weakness exists, testing and evaluating the design and operating effectiveness of internal control based on the assessed risk, and performing such other procedures as we considered necessary in the circumstances. We believe that our audit provides a reasonable basis for our opinion.
Definition and Limitations of Internal Control Over Financial Reporting
A company’s internal control over financial reporting is a process designed to provide reasonable assurance regarding the reliability of financial reporting and the preparation of financial statements for external purposes in accordance with generally accepted accounting principles. A company’s internal control over financial reporting includes those policies and procedures that (1) pertain to the maintenance of records that, in reasonable detail, accurately and fairly reflect the transactions and dispositions of the assets of the company; (2) provide reasonable assurance that transactions are recorded as necessary to permit preparation of financial statements in accordance with generally accepted accounting principles, and that receipts and expenditures of the company are being made only in accordance with authorizations of management and directors of the company; and (3) provide reasonable assurance regarding prevention or timely detection of unauthorized acquisition, use, or disposition of the company’s assets that could have a material effect on the financial statements.
Because of its inherent limitations, internal control over financial reporting may not prevent or detect misstatements. Also, projections of any evaluation of effectiveness to future periods are subject to the risk that controls may become inadequate because of changes in conditions, or that the degree of compliance with the policies or procedures may deteriorate.
/s/ Ernst & Young LLP
Chicago, Illinois
February 28, 2019
Item 9B. OTHER INFORMATION
Not applicable.
PART III
Item 10. DIRECTORS, EXECUTIVE OFFICERS AND CORPORATE GOVERNANCE
We have adopted written codes of conduct applicable to all of our employees, including our Chairman and Chief Executive Officer, President, Chief Financial Officer, Chief Accounting Officer and other senior financial officers. In accordance with SEC rules and regulations, copies of these codes of conduct are available on our website at www.cmegroup.com under the "Investor Relations — Corporate Governance" link. In accordance with SEC rules and regulations and the listing requirements of Nasdaq, we intend to disclose promptly on the website and location specified above any substantive amendments to these codes of conduct and any waivers granted to our executive officers or Board members. In addition, we have adopted Corporate Governance Principles which govern the practices of our board of directors. You may also obtain a copy of our codes of conduct and our Corporate Governance Principles by following the instructions in the section of this Annual Report on Form 10-K entitled "Item 1. Business — Available Information."
Certain of the information called for by this item is hereby incorporated herein by reference to the relevant portions of CME Group’s definitive proxy statement for the Annual Meeting of Shareholders to be held on May 8, 2019, to be filed by CME Group with the SEC pursuant to Regulation 14A within 120 days after December 31, 2018 (Proxy Statement). Additional information called for by this item is contained in Item 1 of this Annual Report on Form 10-K under the caption "Employees — Executive Officers."
Item 11. EXECUTIVE COMPENSATION
Certain of the information called for by this item is hereby incorporated herein by reference to the relevant portions of the Proxy Statement.
Item 12. SECURITY OWNERSHIP OF CERTAIN BENEFICIAL OWNERS AND MANAGEMENT AND RELATED SHAREHOLDER MATTERS
Certain of the information called for by this item relating to the security ownership of certain beneficial owners and management is hereby incorporated herein by reference to the relevant portions of the Proxy Statement.
EQUITY COMPENSATION PLAN INFORMATION
We currently maintain the following equity compensation plans: CME Group Inc. Amended and Restated Omnibus Stock Plan, CME Group Inc. Director Stock Plan and CME Group Inc. Amended and Restated Employee Stock Purchase Plan. We do not maintain any equity compensation plans not approved by shareholders. A description of each of these plans and the number of shares authorized and available for future awards is included in note 16 of the notes to consolidated financial statements. The numbers in the following table are as of December 31, 2018.
| Plan Category | Number of Securities to be Issued Upon Exercise of Outstanding Options (a) | Weighted-Average Exercise Price of Outstanding Options | Number of Securities Remaining Available for Future Issuance Under Equity Compensation Plans (excluding securities reflected in column (a)) | ||||
| Equity compensation plans approved by security holders | 397,227 | $ | 54.81 | 16,487,029 | |||
| Equity compensation plans not approved by security holders | — | — | — | ||||
| Total | 397,227 | 16,487,029 |
The foregoing table does not include awards related to NEX’s 2016 Global Sharesave Plan. Under this plan, NEX employees were offered the opportunity to purchase shares of NEX by electing to participate in a specific grant of options to purchase shares of NEX at the end of the grant period. The last grant period will end six months from the date of the close. Elections received during this period will be calculated using the merger exchange rate and the current price of CME Group shares. As of December 31, 2018, there were approximately 1.3 million NEX options outstanding under this plan.
Item 13. CERTAIN RELATIONSHIPS, RELATED TRANSACTIONS AND DIRECTOR INDEPENDENCE
Certain of the information called for by this item is hereby incorporated herein by reference to the relevant portions of the Proxy Statement.
Item 14. PRINCIPAL ACCOUNTANT FEES AND SERVICES
Certain of the information called for by this item is hereby incorporated herein by reference to the relevant portions of the Proxy Statement.
PART IV
Item 15. EXHIBITS AND FINANCIAL STATEMENT SCHEDULES
(a) Financial Statements, Financial Statement Schedules and Exhibits
(1) Financial Statements
The following Consolidated Financial Statements and related Notes included within Item 8, together with the Reports of Independent Registered Public Accounting Firm with respect thereto and included within Item 9A, are hereby incorporated by reference:
Reports of Independent Registered Public Accounting Firm
Consolidated Balance Sheets at December 31, 2018 and 2017
Consolidated Statements of Income for the Years Ended December 31, 2018, 2017 and 2016
Consolidated Statements of Comprehensive Income for the Years Ended December 31, 2018, 2017 and 2016
Consolidated Statements of Equity for the Years Ended December 31, 2018, 2017 and 2016
Consolidated Statements of Cash Flows for the Years Ended December 31, 2018, 2017 and 2016
Notes to Consolidated Financial Statements
(2) Financial Statement Schedules
The following Financial Statement Schedule is filed as part of this Annual Report on Form 10-K:
CME Group Inc. and Subsidiaries
Schedule II—Valuation and Qualifying Accounts
For the Years Ended December 31, 2018, 2017 and 2016
(dollars in millions)
| Balance at beginning of year | Charged (credited) to costs and expenses | Other(1) | Balance at end of year | ||||||||||||
| Year Ended December 31, 2018 | |||||||||||||||
| Allowance for doubtful accounts | $ | 2.2 | $ | 0.6 | $ | (0.1 | ) | $ | 2.7 | ||||||
| Allowance for deferred tax assets | 11.2 | (0.5 | ) | — | 10.7 | ||||||||||
| Year Ended December 31, 2017 | |||||||||||||||
| Allowance for doubtful accounts | $ | 3.5 | $ | 0.6 | $ | (1.9 | ) | $ | 2.2 | ||||||
| Allowance for deferred tax assets | 14.9 | (3.7 | ) | — | 11.2 | ||||||||||
| Year Ended December 31, 2016 | |||||||||||||||
| Allowance for doubtful accounts | $ | 1.9 | $ | 2.4 | $ | (0.8 | ) | $ | 3.5 | ||||||
| Allowance for deferred tax assets | 122.3 | (107.4 | ) | — | 14.9 |
| (1) | Includes write-offs of doubtful accounts, foreign currency and additions to allowance for deferred tax assets through accumulated other comprehensive income (loss). |
All other schedules have been omitted because the information required to be set forth in those schedules is not applicable or is shown on the consolidated financial statements or notes thereto.
| (3) | Exhibits |
See (b) Exhibits below
(b) Exhibits
| * | Filed herewith. |
| (1) | Management contract or compensatory plan or arrangement. |
| (2) | Confidential treatment pursuant to Rule 406 of the Securities Act has been previously granted by the SEC for portions of this exhibit. |
Item 16. FORM 10-K SUMMARY
None.
SIGNATURES
Pursuant to the requirements of Section 13 or 15(d) of the Securities Exchange Act of 1934, the registrant has duly caused this report to be signed on its behalf by the undersigned, thereunto duly authorized, in the City of Chicago and State of Illinois on the 28th day of February, 2019.
| CME Group Inc. | |||
| By: | /S/ JOHN W. PIETROWICZ | ||
| John W. Pietrowicz Senior Managing Director and Chief Financial Officer |
| Signature | Title | |
| /S/ TERRENCE A. DUFFY | Chairman of the Board, Director and Chief Executive Officer | |
| Terrence A. Duffy | ||
| /S/ JOHN W. PIETROWICZ | Senior Managing Director and Chief Financial Officer | |
| John W. Pietrowicz | ||
| /S/ JACK TOBIN | Managing Director and Chief Accounting Officer | |
| Jack Tobin | ||
| /S/ JEFFREY M. BERNACCHI | Director | |
| Jeffrey M. Bernacchi | ||
| /S/ TIMOTHY S. BITSBERGER | Director | |
| Timothy S. Bitsberger | ||
| /S/ CHARLES P. CAREY | Director | |
| Charles P. Carey | ||
| /S/ DENNIS H. CHOOKASZIAN | Director | |
| Dennis H. Chookaszian | ||
| /S/ ELIZABETH A. COOK | Director | |
| Elizabeth A. Cook | ||
| /S/ ANA DUTRA | Director | |
| Ana Dutra | ||
| /S/ MARTIN J. GEPSMAN | Director | |
| Martin J. Gepsman | ||
| /S/ LARRY G. GERDES | Lead Director | |
| Larry G. Gerdes | ||
| /S/ DANIEL R. GLICKMAN | Director | |
| Daniel R. Glickman | ||
| /S/ GEDON HERTSHTEN | Director | |
| Gedon Hertshten | ||
| /S/ WILLIAM H. HOBERT | Director | |
| Wiliam H. Hobert | ||
| /S/ DEBORAH J. LUCAS | Director | |
| Deborah J. Lucas | ||
| /S/ RONALD A. PANKAU | Director | |
| Ronald A. Pankau | ||
| /S/ ALEX J. POLLOCK | Director | |
| Alex J. Pollock | ||
| /S/ TERRY L. SAVAGE | Director | |
| Terry L. Savage | ||
| /S/ WILLIAM R. SHEPARD | Director | |
| William R. Shepard | ||
| /S/ HOWARD J. SIEGEL | Director | |
| Howard J. Siegel | ||
| /S/ MICHAEL A. SPENCER | Director and Special Advisor | |
| Michael A. Spencer | ||
| /S/ DENNIS A. SUSKIND | Director | |
| Dennis A. Suskind | ||
| /S/ DAVID J. WESCOTT | Director | |
| David J. Wescott | ||