 filings.tools
Chipotle Mexican Grill 10-K 2017-12-31
Filed 2018-02-08. 21 sections, 286K characters. Original on sec.gov · Markdown · JSON
Cover and table of contents
10-K 1 cmg-20171231x10k.htm 10-K
UNITED STATES
SECURITIES AND EXCHANGE COMMISSION
WASHINGTON, D.C. 20549
FORM 10-K
☒ANNUAL REPORT PURSUANT TO SECTION 13 OR 15(d) OF THE SECURITIES EXCHANGE ACT OF 1934
For the fiscal year ended December 31, 2017
or
☐TRANSITION REPORT PURSUANT TO SECTION 13 OR 15(d) OF THE SECURITIES EXCHANGE ACT OF 1934
For the transition period from to
Commission File Number: 1-32731
CHIPOTLE MEXICAN GRILL, INC.
(Exact name of registrant as specified in its charter)
| Delaware | 84-1219301 |
| (State or other jurisdiction of incorporation or organization) | (IRS Employer Identification No.) |
| 1401 Wynkoop Street, Suite 500 Denver, CO | 80202 |
| (Address of Principal Executive Offices) | (Zip Code) |
Registrant’s telephone number, including area code: (303) 595-4000
Securities registered pursuant to Section 12(b) of the Act:
| Title of each class | Name of each exchange on which registered |
| Common stock, par value $0.01 per share | New York Stock Exchange |
Securities registered pursuant to Section 12(g) of the Act: None
Indicate by check mark if the registrant is a well-known seasoned issuer, as defined in Rule 405 of the Securities Act. Yes ☒ No ☐
Indicate by check mark if the registrant is not required to file reports pursuant to Section 13 or Section 15(d) of the Act. Yes ☐ No ☒
Indicate by check mark whether the registrant: (1) has filed all reports required to be filed by Section 13 or 15(d) of the Securities Exchange Act of 1934 during the preceding 12 months (or for such shorter period that the registrant was required to file such reports), and (2) has been subject to such filing requirements for the past 90 days. Yes ☒ No ☐
Indicate by check mark whether the registrant has submitted electronically and posted on its corporate Web site, if any, every Interactive Data File required to be submitted and posted pursuant to Rule 405 of Regulation S-T (§232.405 of this chapter) during the preceding 12 months (or for such shorter period that the registrant was required to submit and post such files). ☒ Yes ☐ No
Indicate by check mark if disclosure of delinquent filers pursuant to Item 405 of Regulation S-K (§229.405 of this chapter) is not contained herein, and will not be contained, to the best of registrant’s knowledge, in definitive proxy or information statements incorporated by reference in Part III of this Form 10-K or any amendment to this Form 10-K. ☒
Indicate by check mark whether the registrant is a large accelerated filer, an accelerated filer, a non-accelerated filer, a smaller reporting company, or an emerging growth company. See the definitions of “large accelerated filer,” “accelerated filer,” “smaller reporting company,” and “emerging growth company” in Rule 12b-2 of the Exchange Act (check one):
| ☒ Large accelerated filer | ☐ Accelerated filer | ☐ Non-accelerated filer (do not check if a smaller reporting company) | ☐ Smaller reporting company | ☐ Emerging growth company |
If an emerging growth company, indicate by check mark if the registrant has elected not to use the extended transition period for complying with accounting standards provided pursuant to Section 13(a) of the Exchange Act. ☐
Indicate by check mark whether the registrant is a shell company (as defined in Rule 12b-2 of the Act). Yes ☐ No ☒
As of June 30, 2017, the aggregate market value of the registrant’s outstanding common equity held by non-affiliates was $7.075 billion, based on the closing price of the registrant’s common stock on such date, the last trading day of the registrant’s most recently completed second fiscal quarter. For purposes of this calculation, shares of common stock held by each executive officer and director and by holders of 5% or more of the outstanding common stock have been excluded since those persons may under certain circumstances be deemed to be affiliates. This determination of affiliate status is not necessarily a conclusive determination for other purposes.
As of February 6, 2018, there were 27,930,272 shares of the registrant’s common stock, par value of $0.01 per share outstanding.
DOCUMENTS INCORPORATED BY REFERENCE
Part III incorporates certain information by reference from the registrant’s definitive proxy statement for the 2018 annual meeting of shareholders, which will be filed no later than 120 days after the close of the registrant’s fiscal year ended December 31, 2017.
TABLE OF CONTENTS
PART I
Cautionary Note Regarding Forward-Looking Statements
This report includes statements of our expectations, intentions, plans and beliefs that constitute “forward-looking statements” within the meaning of Section 27A of the Securities Act of 1933 and Section 21E of the Securities Exchange Act of 1934, and that are intended to come within the safe harbor protection provided by those sections. These statements, which involve risks and uncertainties, relate to the discussion of our business strategies and our expectations concerning future operations, margins, profitability, trends, liquidity and capital resources and to analyses and other information that are based on forecasts of future results and estimates of amounts not yet determinable. Forward-looking statements include, among others, forecasts of the number of restaurants we expect to open in 2018; statements regarding the effectiveness of our food safety systems and procedures; statements about the potential impact of catering and delivery offerings and technology initiatives; projections of comparable restaurant sales increases and sales trends we expect for 2018; forecasts of trends in general and administrative expenses, restaurant development costs, and other expenses for 2018; estimates of expected effective tax rates for the year; statements about possible repurchases of our common stock; projections of planned capital expenditures; and other statements of our expectations and plans. We have used words such as “may,” “will,” “should,” “expect,” “intend,” “plan,” “anticipate,” “believe,” “think,” “estimate,” “seek,” “expect,” “predict,” “could,” “project,” “potential” and other similar terms and phrases, including references to assumptions, in this report to identify forward-looking statements. These forward-looking statements are made based on expectations and beliefs concerning future events affecting us and are subject to risks and uncertainties relating to our operations and business environments, all of which are difficult to predict and many of which are beyond our control, that could cause our actual results to differ materially from those matters expressed or implied by these forward-looking statements. Such risks and uncertainties include those listed in Item 1A. “Risk Factors,” and elsewhere in this report.
When considering forward-looking statements in this report or that we make in other reports or statements, you should keep in mind the cautionary statements in this report and future reports we file with the SEC. New risks and uncertainties arise from time to time, and we cannot predict when they may arise or how they may affect us. We assume no obligation to update any forward-looking statements after the date of this report as a result of new information, future events or other developments, except as required by applicable laws and regulations.
Item 1. BUSINESS
General
Chipotle Mexican Grill, Inc., a Delaware corporation, together with its subsidiaries (“Chipotle”, “we”, “us”, or “our”) operates Chipotle Mexican Grill restaurants, which serve a focused menu of burritos, tacos, burrito bowls (a burrito without the tortilla) and salads, made using fresh ingredients. As of December 31, 2017, we operated 2,363 Chipotle restaurants throughout the United States, as well as 37 international Chipotle restaurants, and we also had eight non-Chipotle restaurants. We focus on finding fresh, high-quality raw ingredients to make great tasting food prepared using classic cooking methods; on building strong restaurant teams that are centered on providing an excellent guest experience; on building restaurants that are operationally efficient and aesthetically pleasing; and on doing all of this with the highest regard for the safety of our customers and with a continuing awareness of and respect for the environment. We have grown substantially over the past five years, and expect to open between 130 and 150 new restaurants in 2018, representing a slight reduction in our rate of new openings as we focus our resources on improving our operations and delivering an outstanding experience to every one of our guests.
Throughout our history, we have pursued a mission to change the way people think about and eat fast food. The fast food landscape has changed dramatically over Chipotle’s 24-year history suggesting that we may have achieved this mission, with a number of concepts built using service and sourcing formats that closely resemble ours – with more selective sourcing, food prepared on-site, and a service model that allows customers to choose exactly what they eat. Looking at what we have accomplished, we have reenvisioned our purpose, and are working to Cultivate nourished communities where wholesome food is enjoyed every day. We are also aiming to simplify our business focus, to emphasize only those things that result in an excellent guest experience in our restaurants.
We transitioned the management of our restaurants from eleven to nine regions during the fourth quarter of 2017 and we aggregate our operations into one reportable segment. Financial information about our operations, including our revenues and net income for the years ended December 31, 2017, 2016, and 2015, and our total assets as of December 31, 2017 and 2016, is included in our consolidated financial statements and accompanying notes in Item 8. “Financial Statements and Supplementary Data.” Substantially all of our revenues are generated and assets are located in the U.S. For a discussion of risks related to our international
operations, see “Risks Related to Our Plans to Improve Our Sales and Profitability and Restore Our Economic Model – Our expansion into international markets has been limited, and may present increased risks due to lower customer awareness of our brand… ” in Item 1A. “Risk Factors.”
Our Focus on Safe and Delicious Food Made with Better Ingredients
Focused Menu. Chipotle restaurants feature only a few entrée items: burritos, burrito bowls, tacos and salads. But because customers can choose from four different meats, tofu, two types of beans, and a variety of extras such as salsas, guacamole, queso, shredded cheese, and lettuce, there is enough variety to extend our menu to provide thousands of choices. In preparing our food, we employ classic cooking methods and use stoves and grills, pots and pans, cutting knives and other kitchen utensils, walk-in refrigerators stocked with a variety of fresh ingredients, herbs and spices, and dry goods such as rice. Our restaurants do not have microwaves or freezers. Ingredients we use include chicken, steak, carnitas (seasoned and braised pork), barbacoa (spicy braised and shredded beef), Sofritas (organic braised tofu) and vegetarian pinto and black beans. We add our rice, which is tossed with lime juice, freshly chopped cilantro, and a pinch of salt, as well as freshly shredded cheese, sour cream, lettuce, peppers and onions, to our entrees depending on each customer’s request. We use various herbs, spices and seasonings to prepare our meats and vegetables. We also serve tortilla chips seasoned with fresh lime juice and salt, with sides of guacamole, salsas, or queso. In addition to sodas, fruit and tea drinks, and organic milk, most of our restaurants also offer a selection of beer and margaritas. Our food is prepared from scratch, some in our restaurants and some with the same fresh ingredients in larger batches in commissaries.
Wholesome Food. Serving high quality food while still charging reasonable prices is critical to our purpose so that guests can enjoy wholesome food every day. We insist on preparing, cooking, and serving nutritious food made from natural ingredients and animals that are raised or grown with care and with respect for the environment. We spend time on farms and in the field to understand where our food comes from and how it is raised. Because our menu is so focused, we can concentrate on the sources of each ingredient, and this has become a cornerstone of our continuous effort to improve the food we serve. We're all about simple, fresh food without the use of artificial colors or flavors typically found in fast food—just genuine raw ingredients and their individual, delectable flavors.
In all of our Chipotle restaurants, we endeavor to serve only meats that were raised in accordance with criteria we have established in an effort to improve sustainability and promote animal welfare, and without the use of non-therapeutic antibiotics or added hormones. We brand these meats as “Responsibly Raised ®.” One of our primary goals is for all of our restaurants to serve meats raised to meet our standards, but we have and will continue to face challenges in doing so. For example, some of our restaurants periodically serve conventionally raised chicken or beef from time to time due to supply constraints for our Responsibly Raised brand meats. In the future, more of our restaurants may periodically serve conventionally raised meats or stop serving one or more menu items due to additional supply constraints. When we become aware that one or more of our restaurants will serve conventionally raised meat, we clearly and specifically disclose this temporary change on signage in each affected restaurant so that customers can avoid those meats if they choose to do so.
We also seek to use more responsibly grown produce, by which we mean produce grown by suppliers whose practices conform to our priorities with respect to environmental considerations and employee welfare. Most of the beans we serve are organically grown or grown using conservation tillage methods that improve soil conditions, reduce erosion, and help preserve the environment in which the beans are grown. A portion of some of the other produce items we serve is organically grown as well. Our commitment to better ingredients also extends to the dairy products we serve. In 2017, all of the sour cream and shredded cheese served in our U.S. Chipotle restaurants was made with milk that comes from cows not given rBGH (recombinant bovine growth hormone) and sourced from pasture-based dairies that provide an even higher standard of animal welfare by providing outdoor access for their cows.
In addition, none of the ingredients in our food (not including beverages) in U.S. Chipotle restaurants contain genetically modified organisms, or GMOs. While the meat and poultry we serve is not genetically modified, the animals are likely fed a diet of grains containing GMOs. Due to the prevalence of GMOs in a number of important feed crops, the vast majority of the grains used as animal feed in the U.S. are genetically modified. Additionally, some of the beverages we serve are sweetened with corn-based sweeteners, which are typically made with genetically modified corn.
Close Relationships with Suppliers. Maintaining the high levels of
Showing the first 8K of 118K characters. Open the full section
Item 1B. UNRESOLVED STAFF COMMENTS
None.
Item 2. PROPERTIES
As of December 31, 2017, there were 2,408 restaurants operated by Chipotle and our consolidated subsidiaries, 2,400 of which were Chipotle restaurants. The table below sets forth the locations (by state or country) of all restaurants in operation.
| Alabama | 14 |
| Arizona | 79 |
| Arkansas | 6 |
| California | 408 |
| Colorado | 76 |
| Connecticut | 24 |
| Delaware | 6 |
| District of Columbia | 20 |
| Florida | 149 |
| Georgia | 47 |
| Idaho | 8 |
| Illinois | 134 |
| Indiana | 36 |
| Iowa | 12 |
| Kansas | 26 |
| Kentucky | 18 |
| Louisiana | 10 |
| Maine | 5 |
| Maryland | 84 |
| Massachusetts | 53 |
| Michigan | 35 |
| Minnesota | 62 |
| Missouri | 38 |
| Mississippi | 1 |
| Montana | 3 |
| Nebraska | 9 |
| Nevada | 27 |
| New Hampshire | 7 |
| New Jersey | 57 |
| New Mexico | 7 |
| New York | 138 |
| North Carolina | 54 |
| North Dakota | 1 |
| Ohio | 174 |
| Oklahoma | 12 |
| Oregon | 30 |
| Pennsylvania | 82 |
| Rhode Island | 7 |
| South Carolina | 22 |
| Tennessee | 20 |
| Texas | 195 |
| Utah | 12 |
| Vermont | 1 |
| Virginia | 97 |
| Washington | 39 |
| West Virginia | 5 |
| Wisconsin | 19 |
| Wyoming | 2 |
| Canada | 24 |
| France | 6 |
| Germany | 1 |
| United Kingdom | 6 |
| Total | 2,408 |
We categorize our restaurants as end-caps (at the end of a line of retail outlets), in-lines (in a line of retail outlets), free-standing, or other. Of our restaurants in operation as of December 31, 2017, we had 1,523 end-cap locations, 391 free-standing units, 356 in-line locations, and 138 other locations. The average restaurant size is about 2,500 square feet and seats about 56 people. Many of our restaurants also feature outdoor patio space.
Our main office is located at 1401 Wynkoop Street, Suite 500, Denver, Colorado, 80202 and our telephone number is (303) 595-4000. We lease our main office and substantially all of the properties on which we operate restaurants. For additional information regarding the lease terms and provisions, see Note 8. “Leases” in our consolidated financial statements included in Item 8. “Financial Statements and Supplementary Data.”
We own 17 properties and operate restaurants on all of them.
Item 3. LEGAL PROCEEDINGS
For information regarding legal proceedings, see Note 10. “Commitments and Contingencies” in our consolidated financial statements included in Item 8. “Financial Statements and Supplementary Data.”
Item 4. MINE SAFETY DISCLOSURES
Not applicable.
PART II
Item 5. MARKET FOR REGISTRANT’S COMMON EQUITY, RELATED STOCKHOLDER MATTERS AND ISSUER PURCHASES OF EQUITY SECURITIES
The following table describes the per share range of high and low sales prices for shares of our common stock for the quarterly periods indicated, as reported by the New York Stock Exchange (“NYSE”). Our common stock trades on the NYSE under the symbol “CMG.”
| High | Low | ||||
| 2016 | |||||
| First Quarter | $ | 542.50 | $ | 399.14 | |
| Second Quarter | $ | 473.17 | $ | 384.77 | |
| Third Quarter | $ | 444.13 | $ | 386.10 | |
| Fourth Quarter | $ | 440.00 | $ | 352.96 | |
| High | Low | ||||
| 2017 | |||||
| First Quarter | $ | 453.08 | $ | 372.87 | |
| Second Quarter | $ | 499.00 | $ | 410.98 | |
| Third Quarter | $ | 419.73 | $ | 295.11 | |
| Fourth Quarter | $ | 333.33 | $ | 263.00 |
As of February 1, 2018, there were approximately 948 holders of our common stock, as determined by counting our record holders and the number of participants reflected in a security position listing provided to us by the Depository Trust Company. Because such “DTC participants” are brokers and other institutions holding shares of our common stock on behalf of their customers, we do not know the actual number of unique shareholders represented by these record holders.
Purchases of Equity Securities by the Issuer
The table below reflects shares of common stock we repurchased during the fourth quarter of 2017.
| Total Number of Shares Purchased | Average Price Paid Per Share | Total Number of Shares Purchased as Part of Publicly Announced Plans or Programs(1) | Approximate Dollar Value of Shares that May Yet Be Purchased Under the Plans or Programs(2) | ||||||||
| October | 81,953 | $ | 303.31 | 81,953 | $ | 170,567,974 | |||||
| Purchased 10/1 through 10/31 | |||||||||||
| November | 91,427 | $ | 279.97 | 91,427 | $ | 144,971,147 | |||||
| Purchased 11/1 through 11/30 | |||||||||||
| December | 86,775 | $ | 307.66 | 86,775 | $ | 118,274,235 | |||||
| Purchased 12/1 through 12/31 | |||||||||||
| Total | 260,155 | $ | 296.56 | 260,155 | $ | 118,274,235 |
(1)Shares were repurchased pursuant to a $100 million repurchase program announced on May 23, 2017.
(2)This column includes $100 million in additional authorized repurchases announced on October 24, 2017. Our authorized repurchase programs have no expiration date, but may be modified, suspended, or discontinued at any time.
Dividend Policy
We are not required to pay any dividends and have not declared or paid any cash dividends on our common stock. We intend to continue to retain earnings for use in the operation and expansion of our business and to repurchase shares of common stock (subject to market conditions), and therefore do not anticipate paying any cash dividends on our common stock in the foreseeable future.
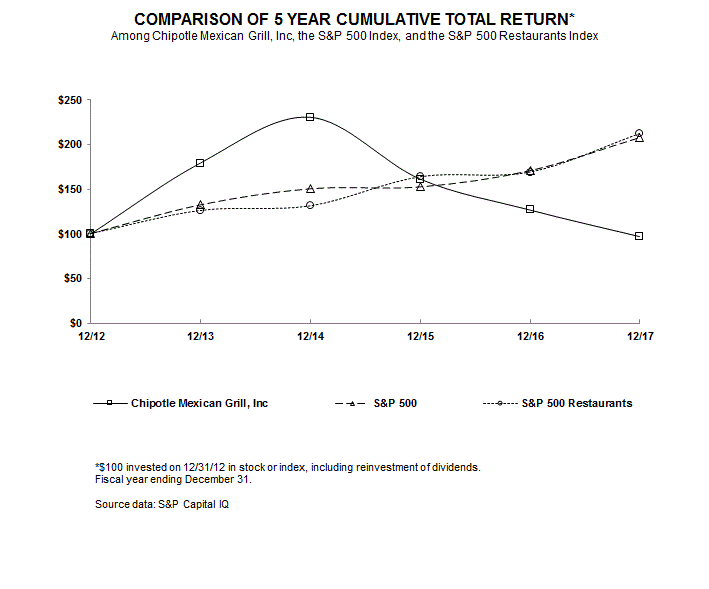
COMPARISON OF CUMULATIVE TOTAL RETURN
The following graph compares the cumulative annual stockholders return on our common stock from December 31, 2012 through December 31, 2017 to that of the total return index for the S&P 500 and the S&P 500 Restaurants Index assuming an investment of $100 on December 31, 2012. In calculating total annual stockholder return, reinvestment of dividends, if any, is assumed. The indices are included for comparative purposes only. They do not necessarily reflect management’s opinion that such indices are an appropriate measure of the relative performance of our common stock. This graph is not “soliciting material,” is not deemed filed with the Securities and Exchange Commission and is not to be incorporated by reference in any of our filings under the Securities Act of 1933, as amended, or the Securities Exchange Act of 1934, as amended, whether made before or after the date hereof and irrespective of any general incorporation language in any such filing.
Item 6. SELECTED FINANCIAL DATA
Our selected consolidated financial data shown below should be read together with Item 7. “Management’s Discussion and Analysis of Financial Condition and Results of Operations” and our consolidated financial statements and respective notes included in Item 8. “Financial Statements and Supplementary Data.” The data shown below are not necessarily indicative of results to be expected for any future period (dollar and share amounts in thousands, except per share data).
| Year ended December 31, | ||||||||||||||
| 2017 | 2016 | 2015 | 2014 | 2013 | ||||||||||
| Statement of Income: | ||||||||||||||
| Revenue | $ | 4,476,412 | $ | 3,904,384 | $ | 4,501,223 | $ | 4,108,269 | $ | 3,214,591 | ||||
| Food, beverage and packaging costs | 1,535,428 | 1,365,580 | 1,503,835 | 1,420,994 | 1,073,514 | |||||||||
| Labor costs | 1,205,992 | 1,105,001 | 1,045,726 | 904,407 | 739,800 | |||||||||
| Occupancy costs | 327,132 | 293,636 | 262,412 | 230,868 | 199,107 | |||||||||
| Other operating costs | 651,644 | 641,953 | 514,963 | 434,244 | 347,401 | |||||||||
| General and administrative expenses | 296,388 | 276,240 | 250,214 | 273,897 | 203,733 | |||||||||
| Depreciation and amortization | 163,348 | 146,368 | 130,368 | 110,474 | 96,054 | |||||||||
| Pre-opening costs | 12,341 | 17,162 | 16,922 | 15,609 | 15,511 | |||||||||
| Loss on disposal of assets | 13,345 | 23,877 | 13,194 | 6,976 | 6,751 | |||||||||
| Total operating expenses | 4,205,618 | 3,869,817 | 3,737,634 | 3,397,469 | 2,681,871 | |||||||||
| Income from operations | 270,794 | 34,567 | 763,589 | 710,800 | 532,720 | |||||||||
| Interest and other income, net | 4,949 | 4,172 | 6,278 | 3,503 | 1,751 | |||||||||
| Income before income taxes | 275,743 | 38,739 | 769,867 | 714,303 | 534,471 | |||||||||
| Provision for income taxes | (99,490) | (15,801) | (294,265) | (268,929) | (207,033) | |||||||||
| Net income | $ | 176,253 | $ | 22,938 | $ | 475,602 | $ | 445,374 | $ | 327,438 | ||||
| Earnings per share | ||||||||||||||
| Basic | $ | 6.19 | $ | 0.78 | $ | 15.30 | $ | 14.35 | $ | 10.58 | ||||
| Diluted | $ | 6.17 | $ | 0.77 | $ | 15.10 | $ | 14.13 | $ | 10.47 | ||||
| Weighted average common shares outstanding | ||||||||||||||
| Basic | 28,491 | 29,265 | 31,092 | 31,038 | 30,957 | |||||||||
| Diluted | 28,561 | 29,770 | 31,494 | 31,512 | 31,281 | |||||||||
| December 31, | ||||||||||||||
| 2017 | 2016 | 2015 | 2014 | 2013 | ||||||||||
| Balance Sheet Data: | ||||||||||||||
| Total current assets | $ | 629,535 | $ | 522,374 | $ | 814,647 | $ | 859,511 | $ | 653,095 | ||||
| Total assets | $ | 2,045,692 | $ | 2,026,103 | $ | 2,725,066 | $ | 2,527,317 | $ | 1,996,068 | ||||
| Total current liabilities | $ | 323,893 | $ | 281,793 | $ | 279,942 | $ | 245,710 | $ | 199,228 | ||||
| Total liabilities | $ | 681,247 | $ | 623,610 | $ | 597,092 | $ | 514,948 | $ | 457,780 | ||||
| Total shareholders’ equity | $ | 1,364,445 | $ | 1,402,493 | $ | 2,127,974 | $ | 2,012,369 | $ | 1,538,288 |
Item 7. MANAGEMENT’S DISCUSSION AND ANALYSIS OF FINANCIAL CONDITION AND RESULTS OF OPERATIONS
You should read the following discussion together with Item 6. “Selected Financial Data” and our consolidated financial statements and related notes included in Item 8. “Financial Statements and Supplementary Data.” The discussion contains forward-looking statements involving risks, uncertainties and assumptions that could cause our results to differ materially from expectations. Factors that might cause such differences include those described in Item 1A. “Risk Factors” and elsewhere in this report.
Overview
Steve Ells, our founder, Chairman and CEO, started Chipotle with the idea that food served fast did not have to be a typical fast food experience. Today, we continue to offer a focused menu of burritos, tacos, burrito bowls, and salads made from fresh, high-quality raw ingredients, prepared using classic cooking methods and served in an interactive style allowing people to get what they want. We seek out extraordinary ingredients that are not only fresh, but that are raised responsibly, with respect for the animals, land, and people who produce them. We prepare our food using real, wholesome ingredients and without the use of artificial colors or flavors typically found in fast food. Chipotle opened with a single restaurant in Denver in 1993 and as of December 31, 2017, we operated 2,408 restaurants.
Sales. Our sales and profitability improved during 2017 as compared to 2016. Comparable restaurant sales increased 6.4% as a result of an increase in the average check, including a 1.2% benefit from menu price increases implemented in about 500 restaurants during the second quarter of 2017 and 900 restaurants during the fourth quarter of 2017. Comparable restaurant sales represent the change in period-over-period sales for restaurants beginning in their 13th full calendar month of operation. Average restaurant sales were $1.940 million as of December 31, 2017, increasing from $1.868 million as of December 31, 2016. We define average restaurant sales as the average trailing 12-month sales for restaurants in operation for at least 12 full calendar months. We expect comparable restaurant sales increases in the low single digits for the full year 2018, including the benefit from extending menu price increases to almost 950 additional restaurants in January 2018. Sales growth from new restaurant openings, however, will be lower in 2018 than in the past due to our planned decrease in new restaurant openings during the year, as discussed below under “Restaurant Development.”
During 2017, we invested in improving our digital platforms, including significant improvements to our mobile application and online ordering platform, and equipping select restaurants with an upgraded second make line dedicated to fulfilling out-of-restaurant orders. Sales from out-of-restaurant orders represented 8.3% of our revenue during the year ended December 31, 2017, up from 6.4% of revenue during the year ended December 31, 2016. Additionally, in September 2017 we introduced an all-natural queso, which was ordered in approximately 10% of our transactions in January 2018.
Restaurant Operating Costs. During the full year 2017, our restaurant operating costs (food, beverage and packaging; labor; occupancy; and other operating costs) as a percent of revenue decreased 4.1% compared to the full year 2016. The decrease was attributable to sales leverage, including the benefit of the menu price increases, lower marketing and promotional spend as a percent of revenue, and labor efficiencies, partially offset by higher wages paid to crew and managers.
Restaurant Development. As of December 31, 2017, we had 2,408 restaurants in operation, including 2,363 Chipotle restaurants throughout the United States, with an additional 37 international Chipotle restaurants and eight non-Chipotle restaurants that were consolidated into our financial results. We opened 183 restaurants in 2017, including two relocations, and closed 23 additional restaurants (including 15 ShopHouse Southeast Asian Kitchen restaurants). We intend to open between 130 and 150 restaurants for the full year 2018, as we focus our resources on improving our operations and delivering an outstanding experience to every one of our guests. Most of our 2018 restaurant openings are planned in markets that already have a Chipotle presence established.
Tax Law Changes. In December 2017, the Tax Cuts and Jobs Act was signed into law, and among other changes, the Act lowered the U.S. corporate income tax rate from 35% to 21% beginning in 2018. As a result, we recognized a $6.0 million benefit in our provision for income taxes related to the remeasurement of our deferred tax position at the lower rate.
We expect our 2018 annual effective tax rate to be in the range of 30% to 31%, which includes an underlying effective tax rate of 27% to 28%, and around 3% to 4% related to stock awards. As discussed in Note 1. “Description of Business and Summary of Significant Accounting Policies” included in Item 8. “Financial Statements and Supplementary Data,” the adoption of ASU No. 2016-09, “Compensation-Stock Compensation (Topic 718)” will subject our tax rate to quarterly volatility from the effect of stock award exercise and vesting activities. Additionally, we have deferred tax assets related to outstanding non-vested stock awards that contain market conditions. If market conditions are not achieved, then we may not realize the benefit of these deferred tax assets, which would result in a higher effective tax rate in future periods. We believe the stock awards granted in 2015 and 2016 that contain market conditions will increase our tax rate in the first and fourth quarters of 2018, respectively.
During 2018, we expect to use a portion of the savings from the lower federal corporate income tax rate to provide enhanced benefits to our employees, including by making all restaurant managers and crew eligible for a one-time cash bonus, awarding one-time stock bonuses to a broad group of staff employees, and enhancing a number of other benefits such as parental leave and short-term disability. Additionally, we will use a portion of the savings by investing in our existing restaurants. We expect these initiatives to increase labor, other operating, and general and administrative expenses, and to result in higher capital expenditures than we have typically incurred.
Management and Governance. During the second quarter of 2017, we announced that we hired Scott Boatwright as Chief Restaurant Officer, and Scott has assumed oversight of operations for all North American Chipotle restaurants. In the fourth quarter of 2017, we announced that Steve Ells, our Chairman and CEO, will become Executive Chairman following the completion of a search to identify a new CEO. For risks associated with our planned installation of a new CEO, see “Risks Related to our Unique Business Strategy – Our success may depend on the continued service and availability of key personnel, and upcoming changes in our management team may not provide the benefits we expect” in Item 1A. “Risk Factors.”
Data Security Incident. In April 2017, we detected malware on the network that supports payment processing for our restaurants, and subsequently determined that the malware searched for track data, which may include cardholder name, card number, expiration date, and internal verification codes. We removed the malware from our systems and continue to evaluate ways to enhance our security measures. See “General Business Risks—We may be harmed by security risks we face in connection with our electronic processing and transmission of confidential customer and employee information” in Item 1A. “Risk Factors,” as well as Note 10. “Commitments and Contingencies” in Item 8. “Financial Statements and Supplementary Data,” for further discussion of the payment card security incident and related legal proceedings.
During the year ended December 31, 2017, we recorded a liability of $30.0 million ($18.2 million after tax), or $0.64 per basic and diluted earnings per share, as an estimate of potential losses associated with anticipated claims and assessments by payment card networks. We may ultimately be subject to liabilities greater or less than the amount accrued.
Restaurant Openings, Relocations and Closures
The following table details restaurant unit data for the years indicated.
| Year ended December 31, | |||||
| 2017 | 2016 | 2015 | |||
| Beginning of period | 2,250 | 2,010 | 1,783 | ||
| Openings | 183 | 243 | 229 | ||
| Relocations/closures | (10) | (3) | (2) | ||
| ShopHouse closures | (15) | - | |||
| Total restaurants at end of period | 2,408 | 2,250 | 2,010 |
Results of Operations
Our results of operations as a percentage of revenue and period-over-period variances are discussed in the following section. As we open more restaurants and hire more employees, our aggregate restaurant operating costs and depreciation and amortization generally increase.
Revenue
| Year ended December 31, | % increase | % increase/ (decrease) | ||||||||||
| 2017 | 2016 | 2015 | 2017 over 2016 | 2016 over 2015 | ||||||||
| (dollars in millions) | ||||||||||||
| Revenue | $ | 4,476.4 | $ | 3,904.4 | $ | 4,501.2 | 14.7% | (13.3%) | ||||
| Average restaurant sales | $ | 1.940 | $ | 1.868 | $ | 2.424 | 3.9% | (22.9%) | ||||
| Comparable restaurant sales increases (decreases) | 6.4% | (20.4%) | 0.2% | |||||||||
| Number of restaurants as of the end of the year | 2,408 | 2,250 | 2,010 | 7.0% | 11.9% | |||||||
| Number of restaurants opened in the year | 183 | 243 | 229 |
The significant factors contributing to the increase in revenue in 2017 were new restaurant openings and comparable restaurant sales increases. Revenue from restaurants not yet in the comparable restaurant base contributed $338.8 million to the revenue increase, of which $149.1 million was attributable to restaurants opened in 2017, and comparable restaurant sales increased $233.2 million. The increase in comparable restaurant sales was attributable to an increase in average check, including a 1.2% benefit from menu price increases.
In 2016, the decrease in revenue was attributable to a decline in comparable restaurant sales, which we attribute primarily to the impact of food safety incidents beginning in late 2015, partially offset by new restaurant openings. Comparable restaurant sales decreased $914.7 million while revenue from restaurants not yet in the comparable restaurant base contributed $323.9 million, of which $156.2 million was attributable to restaurants opened in 2016.
Food, Beverage and Packaging Costs
| Year ended December 31, | % increase | % decrease | ||||||||||
| 2017 | 2016 | 2015 | 2017 over 2016 | 2016 over 2015 | ||||||||
| (dollars in millions) | ||||||||||||
| Food, beverage and packaging | $ | 1,535.4 | $ | 1,365.6 | $ | 1,503.8 | 12.4% | (9.2%) | ||||
| As a percentage of revenue | 34.3% | 35.0% | 33.4% |
Food, beverage and packaging costs decreased as a percentage of revenue in 2017 primarily due to the benefit of the menu price increases taken in select restaurants during the second and fourth quarters of 2017. Food, beverage and packaging costs also benefitted from bringing the preparation of lettuce and bell peppers back into our restaurants after using pre-cut produce during portions of 2016, and cost savings initiatives resulting in lower prices and usage of paper and packaging products. These decreases were partially offset by higher avocado prices. We expect food, beverage and packaging costs as a percentage of revenue in 2018 to be lower than 2017 due to the benefit of menu price increases, and our expectations for stable commodity prices.
Food, beverage and packaging costs increased as a percentage of revenue in 2016 primarily due to increased waste and costs related to new food safety procedures as well as higher avocado prices, partially offset by relief in beef prices. In dollar terms, food, beverage and packaging costs decreased in 2016 due to lower sales.
Labor Costs
| Year ended December 31, | % increase | % increase | ||||||||||
| 2017 | 2016 | 2015 | 2017 over 2016 | 2016 over 2015 | ||||||||
| (dollars in millions) | ||||||||||||
| Labor costs | $ | 1,206.0 | $ | 1,105.0 | $ | 1,045.7 | 9.1% | 5.7% | ||||
| As a percentage of revenue | 26.9% | 28.3% | 23.2% |
Labor costs as a percentage of revenue decreased during the year ended December 31, 2017 due primarily to increased crew efficiency, including the benefit of lower promotional activity during the year, improved manager deployment, and sales leverage, including the impact of menu price increases. The decrease was partially offset by wage inflation. We expect labor costs as a percentage of revenue to be higher in 2018 than 2017 due to labor inflation and the enhanced benefits described above under “Overview – Tax Law Changes.”
Labor costs as a percentage of revenue increased in 2016 due primarily to sales deleveraging and wage inflation, partially offset by labor efficiencies resulting from fewer managers and crew in each of our restaurants. Labor costs increased in dollar terms for the year ended December 31, 2016 due to staffing needs for new restaurants.
Occupancy Costs
| Year ended December 31, | % increase | % increase | ||||||||||
| 2017 | 2016 | 2015 | 2017 over 2016 | 2016 over 2015 | ||||||||
| (dollars in millions) | ||||||||||||
| Occupancy costs | $ | 327.1 | $ | 293.6 | $ | 262.4 | 11.4% | 11.9% | ||||
| As a percentage of revenue | 7.3% | 7.5% | 5.8% |
Occupancy costs as a percentage of revenue decreased in 2017 primarily due to sales leverage on a largely fixed-cost base.
Occupancy costs as a percentage of revenue increased in 2016 primarily due to lower average restaurant sales on a largely fixed-cost base. Occupancy costs increased in dollar terms for the year ended December 31, 2016, primarily due to costs associated with new restaurants.
Other Operating Costs
| Year ended December 31, | % increase | % increase | ||||||||||
| 2017 | 2016 | 2015 | 2017 over 2016 | 2016 over 2015 | ||||||||
| (dollars in millions) | ||||||||||||
| Other operating costs | $ | 651.6 | $ | 642.0 | $ | 515.0 | 1.5% | 24.7% | ||||
| As a percentage of revenue | 14.6% | 16.4% | 11.4% |
Other operating costs include, among other items, marketing and promotional costs, bank and credit card fees, and restaurant utilities and maintenance costs. Other operating costs decreased as a percentage of revenue in 2017 due primarily to decreased marketing and promotional spend, sales leverage including the benefit of menu price increases, and decreased kitchen supplies expense. Marketing and promotional spend decreased to 3.5% of revenue in 2017, as compared to 5.1% of revenue in 2016. We expect other operating costs as a percentage of revenue in 2018 to remain consistent with 2017 as planned lower marketing and promotional spend is offset by expected higher maintenance costs from investments in our existing restaurants.
Other operating costs increased as a percentage of revenue in 2016 due primarily to higher marketing and promotional expense as well as sales deleveraging. We increased our marketing and promotional spend in an effort to regain customers, which contributed $98.2 million to the increase.
General and Administrative Expenses
| Year ended December 31, | % increase | % increase | ||||||||||
| 2017 | 2016 | 2015 | 2017 over 2016 | 2016 over 2015 | ||||||||
| (dollars in millions) | ||||||||||||
| General and administrative expense | $ | 296.4 | $ | 276.2 | $ | 250.2 | 7.3% | 10.4% | ||||
| As a percentage of revenue | 6.6% | 7.1% | 5.6% |
General and administrative expenses increased in dollar terms in 2017, due to recording a liability of $30.0 million as an estimate of potential losses associated with anticipated claims and assessments by payment card networks for the data security incident that occurred in 2017. Increased bonus costs and higher non-cash stock-based compensation expense also contributed to the increase. The increase was partially offset by lower legal costs, and decreased meeting costs because of the biennial All Managers Conference held in September 2016. The increase in stock-based compensation expense during 2017 was primarily a result of a cumulative reduction of expense in 2016 for performance share awards that were no longer expected to vest. We expect that general and administrative expenses will increase in dollar terms in 2018 due to increased wages and benefits, the biennial All Managers’ Conference planned for the third quarter of 2018, and an increase in stock-based compensation expense.
The increase in general and administrative expenses in dollar terms for 2016 primarily resulted from increased legal expense, higher payroll costs as we grew, and expenses associated with our biennial All Managers’ Conference held during 2016, partially offset by lower bonus expense and travel costs.
Depreciation and Amortization
| Year ended December 31, | % increase | % increase | ||||||||||
| 2017 | 2016 | 2015 | 2017 over 2016 | 2016 over 2015 | ||||||||
| (dollars in millions) | ||||||||||||
| Depreciation and amortization | $ | 163.3 | $ | 146.4 | $ | 130.4 | 11.6% | 12.3% | ||||
| As a percentage of revenue | 3.6% | 3.7% | 2.9% |
Depreciation and amortization decreased as a percentage of revenue in 2017 due to sales leverage on a partially fixed-cost base.
Depreciation and amortization increased as a percentage of revenue in 2016 due to sales deleveraging. The increase in dollar terms was due primarily to depreciation and amortization costs associated with new restaurants.
Loss on Disposal and Impairment of Assets
| Year ended December 31, | % decrease | % increase | ||||||||||
| 2017 | 2016 | 2015 | 2017 over 2016 | 2016 over 2015 | ||||||||
| (dollars in millions) | ||||||||||||
| Loss on disposal and impairment of assets | $ | 13.3 | $ | 23.9 | $ | 13.2 | (44.1%) | 81.0% | ||||
| As a percentage of revenue | 0.3% | 0.6% | 0.3% |
Loss on disposal and impairment of assets during the year ended December 31, 2017 consisted primarily of charges related to the closure of underperforming Chipotle restaurants and the replacement of certain kitchen equipment.
Loss on disposal and impairment of assets increased in 2016 primarily due to a non-cash impairment charge of $14.5 million to write-down substantially all of the value of the long-lived assets of our 15 ShopHouse restaurants.
Income Tax Provision
| Year ended December 31, | % increase | % decrease | ||||||||||
| 2017 | 2016 | 2015 | 2017 over 2016 | 2016 over 2015 | ||||||||
| (dollars in millions) | ||||||||||||
| Provision for income taxes | $ | 99.5 | $ | 15.8 | $ | 294.3 | 529.6% | (94.6%) | ||||
| Effective tax rate | 36.1% | 40.8% | 38.2% |
The 2017 annual effective tax rate was lower than the 2016 rate due to the enactment of the Tax Cuts and Jobs Act, resulting in our recording a benefit for the remeasurement of our deferred tax liability, as well as from a lower state tax rate. The decrease in our effective tax rate was partially offset by federal credits on overall higher pre-tax operating income.
The 2016 effective tax rate was higher than 2015 due to a higher state tax rate, not qualifying for the federal research and development tax credit in 2016 whereas we did qualify for the credit in 2015, and other federal credits on overall lower pre-tax operating income.
Quarterly Financial Data/Seasonality
The following table presents data from the consolidated statement of income for each of the eight quarters in the period ended December 31, 2017. The operating results for any quarter are not necessarily indicative of the results for any subsequent quarter.
| 2017 Quarters Ended | ||||||||||||
| March 31 | June 30 | September 30 | December 31 | |||||||||
| Revenue | $ | 1,068.8 | $ | 1,169.4 | $ | 1,128.1 | $ | 1,110.1 | ||||
| Operating income | $ | 73.2 | $ | 106.7 | $ | 30.9 | $ | 60.0 | ||||
| Net income | $ | 46.1 | $ | 66.7 | $ | 19.6 | $ | 43.8 | ||||
| Number of restaurants opened in the quarter, net of relocations/closures | 41 | 48 | 35 | 34 | ||||||||
| Comparable restaurant sales increase | 17.8% | 8.1% | 1.0% | 0.9% | ||||||||
| 2016 Quarters Ended | ||||||||||||
| March 31 | June 30 | September 30 | December 31 | |||||||||
| Revenue | $ | 834.5 | $ | 998.4 | $ | 1,037.0 | $ | 1,034.6 | ||||
| Operating income (loss) | $ | (46.6) | $ | 40.9 | $ | 9.7 | $ | 30.6 | ||||
| Net income (loss) | $ | (26.4) | $ | 25.6 | $ | 7.8 | $ | 16.0 | ||||
| Number of restaurants opened in the quarter, net of relocations/closures | 56 | 58 | 54 | 72 | ||||||||
| Comparable restaurant sales increase (decrease) | (29.7%) | (23.6%) | (21.9%) | (4.8%) |
Seasonal factors cause our profitability to fluctuate from quarter to quarter. Historically our average daily restaurant sales are lower, and net income has generally been lower, in the first and fourth quarters due in part to the holiday season and because fewer people eat out during periods of inclement weather (the winter months) than during periods of mild or warm weather (the spring, summer and fall months). Other factors also have a seasonal effect on our results. For example, restaurants located near colleges and universities generally do more business during the academic year. Seasonal factors, however, might be moderated or outweighed by other factors that may influence our quarterly results, such as unexpected publicity impacting our business in a positive or negative way, as well as fluctuations in food or packaging costs or the timing of menu price increases. The number of trading days in a quarter can also affect our results, although on an overall annual basis, changes in trading days do not have a significant impact.
Our quarterly results are also affected by other factors such as the number of new restaurants opened in a quarter, the amount and timing of non-cash stock-based compensation expense, and anticipated and unanticipated events. New restaurants typically have lower margins following opening as a result of the expenses associated with opening new restaurants and their operating inefficiencies in the months immediately following opening. Accordingly, results for a particular quarter are not necessarily indicative of results to be expected for any other quarter or for any year.
Liquidity and Capital Resources
Our primary liquidity and capital requirements are for new restaurant construction, initiatives to improve the guest experience in our restaurants, working capital, and general corporate needs. As of December 31, 2017, we had a cash and short-term investment balance of $509.0 million that we expect to utilize, along with cash flow from operations, to provide capital to support the growth of our business, to invest in, maintain and refurbish our existing restaurants, to repurchase additional shares of our common stock subject to market conditions, and for general corporate purposes. As of December 31, 2017, there was $118.3 million remaining available under repurchase authorizations previously approved by our Board of Directors. Under the remaining repurchase authorizations, shares may be purchased from time to time in open market transactions, subject to market conditions. We believe that cash from operations, together with our cash and investment balances, will be enough to meet ongoing capital expenditures, working capital requirements and other cash needs for the foreseeable future.
We haven’t required significant working capital because customers generally pay using cash or credit and debit cards and because our operations do not require significant receivables, nor do they require significant inventories due, in part, to our use of various fresh ingredients. In addition, we generally have the right to pay for the purchase of food, beverage and supplies some time after the receipt of those items, generally within ten days, thereby reducing the need for incremental working capital to support our growth.
Our total capital expenditures for 2017 were $216.8 million. In 2017, we spent on average about $835,000 in development and construction costs per new restaurant, or about $735,000 net of landlord reimbursements of $100,000. In 2018, we expect to incur about $300 million in total capital expenditures. We expect the majority of our capital expenditures to consist of investments in existing restaurants, including remodeling and similar improvements, and upgrading our second make lines and other restaurant equipment. We also expect about $120 million in capital expenditures related to our construction of new restaurants, before any reductions for landlord reimbursements. For new restaurants to be opened in 2018, we anticipate average development costs will increase due to initiatives planned in most of our new restaurants such as the addition of the upgraded second make line. Finally, we expect a portion of our capital expenditures for the year to be incurred for additional corporate initiatives.
Contractual Obligations
Our contractual obligations as of December 31, 2017 were as follows:
| Payments Due by Fiscal Year | |||||||||||||||
| Total | 2018 | 2019-2020 | 2021-2022 | Thereafter | |||||||||||
| (in thousands) | |||||||||||||||
| Operating leases(1) | $ | 3,906,253 | $ | 281,461 | $ | 569,198 | $ | 558,431 | $ | 2,497,163 | |||||
| Purchase obligations(2) | $ | 929,242 | $ | 409,568 | $ | 323,906 | $ | 177,408 | $ | 18,360 | |||||
| Deemed landlord financing(1) | $ | 3,472 | $ | 423 | $ | 855 | $ | 908 | $ | 1,286 | |||||
| Total | $ | 4,838,967 | $ | 691,452 | $ | 893,959 | $ | 736,747 | $ | 2,516,809 |
| (1) | See Note 8. “Leases” of our consolidated financial statements included in Item 8. “Financial Statements and Supplementary Data.” |
|---|
| (2) | Purchase obligations include agreements to purchase goods or services that are enforceable and legally binding on us and that specify all significant terms. We have excluded agreements that are cancelable without penalty. The majority of our purchase 36 |
|---|
| obligations relate to amounts owed for chicken, produce, and other ingredients and supplies, construction contractor agreements, orders submitted for equipment for restaurants under construction and planned remodels, and marketing initiatives and corporate sponsorships. |
|---|
The above table does not include income tax liabilities for uncertain tax positions for which we are not able to make a reasonably reliable estimate of the amount and period of related future payments. Additionally, we have excluded our estimated loss contingencies related to the data security incident described elsewhere, due to uncertainty regarding the timing and amount of payment. See Note 10. “Commitments and Contingencies” of our consolidated financial statements included in Item 8. “Financial Statements and Supplementary Data.”
Off-Balance Sheet Arrangements
As of December 31, 2017 and 2016, we had no off-balance sheet arrangements or obligations.
Inflation
The primary areas of our operations affected by inflation are food, labor, healthcare costs, fuel, utility costs, and materials used in the construction of our restaurants. Although a significant majority of our crew members make more than the federal and applicable state and local minimum wage, increases in the applicable federal or state minimum wage may have an impact on our labor costs by causing wage inflation above the minimum wage level. Additionally, many of our leases require us to pay property taxes, maintenance, and utilities, all of which are generally subject to inflationary increases. In the past we have largely been able to offset inflationary increases with menu price increases. There have been, and there may be in the future, delays in implementing such menu price increases. If we do raise menu prices in the future, general competitive pressures may limit our ability to completely recover cost increases attributable to inflation.
Critical Accounting Estimates
We describe our significant accounting policies in Note 1. “Description of Business and Summary of Significant Accounting Policies” of our consolidated financial statements included in Item 8. “Financial Statements and Supplementary Data.” Critical accounting estimates are those that we believe are both significant and that require us to make difficult, subjective or complex judgments, often because we need to estimate the effect of inherently uncertain matters. We base our estimates and judgments on historical experiences and various other factors that we believe to be appropriate under the circumstances. Actual results may differ from these estimates, and we might obtain different estimates if we used different assumptions or factors. We believe that of our critical accounting estimates, the following involve a higher degree of judgement and subjectivity.
Leases
We lease nearly all of our restaurant locations. Our leases typically contain escalating rentals over the lease term as well as optional renewal periods. We have estimated that our lease term, including reasonably assured renewal periods, is the lesser of the lease term or 20 years. We account for our leases by recognizing rent expense on a straight-line basis over the reasonably assured lease term. The majority of our leasehold improvements are also depreciated over the reasonably assured lease term. If the estimate of our reasonably assured lease term was changed, our depreciation and rent expense could differ materially.
Stock-based Compensation
We recognize compensation expense for equity awards over the vesting period based on the award’s fair value. We use the Black-Scholes valuation model to determine the fair value of our stock-only stock appreciation rights, or SOSARs, and we use the Monte Carlo simulation model to determine the fair value of stock awards that contain market conditions. Both of these models require assumptions to be made regarding our stock price volatility, the expected life of the award and expected dividend rates. The volatility assumption was based on our historical data and implied volatility, and the expected life assumptions were based on our historical data. Similarly, the compensation expense of performance share awards, and SOSARs with performance-based vesting conditions, is based in part on the estimated probability of our achieving levels of performance associated with particular levels of payout for performance shares and with vesting for performance SOSARs. We determine the probability of achievement of future levels of performance by comparing the relevant performance level with our internal estimates of future performance. Those estimates are based on a number of assumptions, and different assumptions may have resulted in different conclusions regarding the probability of our achieving future levels of performance relevant to the payout levels for the awards. Had we arrived at different assumptions of stock price volatility or expected lives of our SOSARs, or different assumptions regarding the probability of our achieving future levels of performance with respect to performance share awards and performance SOSARs, our stock-based compensation expense and results of operations could have been different. Certain awards that contain service, performance and market conditions have vesting criteria based on Chipotle’s relative performance versus a restaurant industry peer group in annual average revenue growth,
net income growth, and total shareholder return. Our estimates of Chipotle’s future performance and the future performance of the restaurant industry peer group are assumptions that involve a high degree of subjectivity. If we had arrived at different assumptions for revenue growth or net income for Chipotle or the peer group, our stock-based compensation expense and results of operations could have been different.
Insurance Liability
We are self-insured for a significant portion of our risks and associated liabilities with respect to workers’ compensation, general liability, employee health, property and auto damage, but have third party insurance coverage to limit exposure to these claims. We record a liability that represents our estimated cost of claims incurred and unpaid as of the balance sheet date. Our estimated liability is not discounted and is based on a number of assumptions and factors, including historical trends, actuarial assumptions and economic conditions, and is closely monitored and adjusted when warranted by changing circumstances. Our history of claims experience is relatively short and our significant growth during most of our operating history could affect the accuracy of estimates based on historical experience. If a greater amount of claims occurs compared to what we have estimated, or if medical costs increase beyond what we expected, our accrued liabilities might not be sufficient and we may be required to record additional expense. Actual claims experience could also be more favorable than estimated, which would result in expense reductions. Unanticipated changes may produce materially different amounts of expense than that reported under these programs. The total estimated insurance liabilities as of December 31, 2017 were $52.0 million.
Reserves/Contingencies for Litigation and Other Matters
We are involved in various claims and legal actions that arise in the ordinary course of business. These actions are subject to many uncertainties, and we cannot predict the outcomes with any degree of certainty. Consequently, we were unable to estimate the ultimate aggregate amount of monetary liability or financial impact with respect to these matters as of December 31, 2017. Although we have recorded liabilities related to a number of legal actions, our estimates used to determine the amount of these liabilities may not be accurate, and there are other legal actions for which we have not recorded a liability. As a result, in the event legal actions for which we have not accrued a liability or for which our accrued liabilities are not accurate are resolved, such resolution may affect our operating results and cash flows.
Item 7A. QUANTITATIVE AND QUALITATIVE DISCLOSURE ABOUT MARKET RISK
Commodity Price Risks
We are exposed to commodity price risks. Many of the ingredients we use to prepare our food, as well as our packaging materials and utilities to run our restaurants, are ingredients or commodities that are affected by the price of other commodities, exchange rates, foreign demand, weather, seasonality, production, availability and other factors outside our control. We work closely with our suppliers and use a mix of forward pricing protocols under which we agree with our supplier on fixed prices for deliveries at some time in the future, fixed pricing protocols under which we agree on a fixed price with our supplier for the duration of that protocol, formula pricing protocols under which the prices we pay are based on a specified formula related to the prices of the goods, such as spot prices, and range forward protocols under which we agree on a price range for the duration of that protocol. However, a majority of the dollar value of our purchases is effectively at spot prices. Generally, our pricing protocols with suppliers can remain in effect for periods ranging from one to 24 months, depending on the outlook for prices of the particular ingredient. In several cases, we have minimum purchase obligations. We’ve tried to increase, where practical, the number of suppliers for our ingredients, which we believe can help mitigate pricing volatility, and we follow industry news, trade issues, exchange rates, foreign demand, weather, crises and other world events that may affect our ingredient prices. Increases in ingredient prices could adversely affect our results if we choose for competitive or other reasons not to increase menu prices at the same rate at which ingredient costs increase, or if menu price increases result in customer resistance.
Changing Interest Rates
We are also exposed to interest rate risk through fluctuations of interest rates on our investments. Changes in interest rates affect the interest income we earn, and therefore impact our cash flows and results of operations. As of December 31, 2017, we had $362.1 million in investments and interest-bearing cash accounts, including insurance-related restricted trust accounts classified in other assets, and $129.3 million in accounts with an earnings credit we classify as interest income, which combined earned a weighted average interest rate of 0.97%.
Foreign Currency Exchange Risk
A portion of our operations consist of activities outside of the U.S. and we have currency risk on the transactions in other currencies and translation adjustments resulting from the conversion of our international financial results into the U.S. dollar. However, a substantial majority of our operations and investment activities are transacted in the U.S., and therefore our foreign currency risk is not material at this date.
Item 8. FINANCIAL STATEMENTS AND SUPPLEMENTARY DATA
INDEX TO CONSOLIDATED FINANCIAL STATEMENTS
Report of Independent Registered Public Accounting Firm
To the Shareholders and Board of Directors of Chipotle Mexican Grill, Inc.
Opinion on the Financial Statements
We have audited the accompanying consolidated balance sheet of Chipotle Mexican Grill, Inc. (the Company), as of December 31, 2017 and 2016, and the related consolidated statements of income, comprehensive income, shareholders’ equity and cash flows for each of the three years in the period ended December 31, 2017, and the related notes (collectively referred to as the “financial statements”). In our opinion, the financial statements present fairly, in all material respects, the consolidated financial position of the Company at December 31, 2017 and 2016, and the consolidated results of its operations and its cash flows for each of the three years in the period ended December 31, 2017, in conformity with U.S. generally accepted accounting principles.
We have also audited, in accordance with the standards of the Public Company Accounting Oversight Board (United Stated) (PCAOB), the Company’s internal control over financial reporting as of December 31, 2017, based on criteria established in Internal Control-Integrated Framework issued by the Committee of Sponsoring Organizations of the Treadway Commission (2013 framework) and our report dated February 8, 2018 expressed an unqualified opinion thereon.
Basis for Opinion
These financial statements are the responsibility of the Company’s management. Our responsibility is to express an opinion on the Company’s financial statements based on our audits. We are a public accounting firm registered with the PCAOB and are required to be independent with respect to the Company in accordance with the U.S. federal securities laws and the applicable rules and regulations of the Securities and Exchange Commission and the PCAOB.
We conducted our audits in accordance with the standards of the PCAOB. Those standards require that we plan and perform the audit to obtain reasonable assurance about whether the financial statements are free of material misstatement, whether due to error or fraud. Our audits included performing procedures to assess the risks of material misstatement of the financial statements, whether due to error or fraud, and performing procedures that respond to those risks. Such procedures included examining, on a test basis, evidence regarding the amounts and disclosures in the financial statements. Our audits also included evaluating the accounting principles used and significant estimates made by management, as well as evaluating the overall presentation of the financial statements. We believe that our audits provide a reasonable basis for our opinion.
/s/ Ernst & Young LLP
We have served as the Company’s auditor since 1997.
Denver, Colorado
February 8, 2018
CHIPOTLE MEXICAN GRILL, INC.
CONSOLIDATED BALANCE SHEET
(in thousands, except per share data)
| December 31, | |||||
| 2017 | 2016 | ||||
| Assets | |||||
| Current assets: | |||||
| Cash and cash equivalents | $ | 184,569 | $ | 87,880 | |
| Accounts receivable, net of allowance for doubtful accounts of $0 and $259 as of December 31, 2017 and 2016, respectively | 40,453 | 40,451 | |||
| Inventory | 19,860 | 15,019 | |||
| Prepaid expenses and other current assets | 50,918 | 44,080 | |||
| Income tax receivable | 9,353 | 5,108 | |||
| Investments | 324,382 | 329,836 | |||
| Total current assets | 629,535 | 522,374 | |||
| Leasehold improvements, property and equipment, net | 1,338,366 | 1,303,558 | |||
| Long term investments | - | 125,055 | |||
| Other assets | 55,852 | 53,177 | |||
| Goodwill | 21,939 | 21,939 | |||
| Total assets | $ | 2,045,692 | $ | 2,026,103 | |
| Liabilities and shareholders' equity | |||||
| Current liabilities: | |||||
| Accounts payable | $ | 82,028 | $ | 78,363 | |
| Accrued payroll and benefits | 82,541 | 76,301 | |||
| Accrued liabilities | 159,324 | 127,129 | |||
| Total current liabilities | 323,893 | 281,793 | |||
| Deferred rent | 316,498 | 288,927 | |||
| Deferred income tax liability | 814 | 18,944 | |||
| Other liabilities | 40,042 | 33,946 | |||
| Total liabilities | 681,247 | 623,610 | |||
| Shareholders' equity: | |||||
| Preferred stock, $0.01 par value, 600,000 shares authorized, no shares issued as of December 31, 2017 and 2016, respectively | - | - | |||
| Common stock $0.01 par value, 230,000 shares authorized, and 35,852 and 35,833 shares issued as of December 31, 2017 and 2016, respectively | 359 | 358 | |||
| Additional paid-in capital | 1,305,090 | 1,238,875 | |||
| Treasury stock, at cost, 7,826 and 7,019 common shares at December 31, 2017 and 2016, respectively | (2,334,409) | (2,049,389) | |||
| Accumulated other comprehensive income (loss) | (3,659) | (8,162) | |||
| Retained earnings | 2,397,064 | 2,220,811 | |||
| Total shareholders' equity | 1,364,445 | 1,402,493 | |||
| Total liabilities and shareholders' equity | $ | 2,045,692 | $ | 2,026,103 |
See accompanying notes to consolidated financial statements.
CHIPOTLE MEXICAN GRILL, INC.
CONSOLIDATED STATEMENT OF INCOME
(in thousands, except per share data)
| Year ended December 31, | ||||||||
| 2017 | 2016 | 2015 | ||||||
| Revenue | $ | 4,476,412 | $ | 3,904,384 | $ | 4,501,223 | ||
| Restaurant operating costs (exclusive of depreciation and amortization shown separately below): | ||||||||
| Food, beverage and packaging | 1,535,428 | 1,365,580 | 1,503,835 | |||||
| Labor | 1,205,992 | 1,105,001 | 1,045,726 | |||||
| Occupancy | 327,132 | 293,636 | 262,412 | |||||
| Other operating costs | 651,644 | 641,953 | 514,963 | |||||
| General and administrative expenses | 296,388 | 276,240 | 250,214 | |||||
| Depreciation and amortization | 163,348 | 146,368 | 130,368 | |||||
| Pre-opening costs | 12,341 | 17,162 | 16,922 | |||||
| Loss on disposal and impairment of assets | 13,345 | 23,877 | 13,194 | |||||
| Total operating expenses | 4,205,618 | 3,869,817 | 3,737,634 | |||||
| Income from operations | 270,794 | 34,567 | 763,589 | |||||
| Interest and other income, net | 4,949 | 4,172 | 6,278 | |||||
| Income before income taxes | 275,743 | 38,739 | 769,867 | |||||
| Provision for income taxes | (99,490) | (15,801) | (294,265) | |||||
| Net income | $ | 176,253 | $ | 22,938 | $ | 475,602 | ||
| Earnings per share: | ||||||||
| Basic | $ | 6.19 | $ | 0.78 | $ | 15.30 | ||
| Diluted | $ | 6.17 | $ | 0.77 | $ | 15.10 | ||
| Weighted average common shares outstanding: | ||||||||
| Basic | 28,491 | 29,265 | 31,092 | |||||
| Diluted | 28,561 | 29,770 | 31,494 |
CONSOLIDATED STATEMENT OF COMPREHENSIVE INCOME
(in thousands)
| | | |
Showing the first 8K of 85K characters. Open the full section
Item 9. CHANGES IN AND DISAGREEMENTS WITH ACCOUNTANTS ON ACCOUNTING AND FINANCIAL DISCLOSURE
None.
Item 9A. CONTROLS AND PROCEDURES
We maintain disclosure controls and procedures (as defined in Rule 13a-15(e) promulgated under the Securities Exchange Act of 1934, as amended (the “Exchange Act”)) that are designed to ensure that information required to be disclosed in Exchange Act reports is recorded, processed, summarized and reported within the time periods specified in the Securities and Exchange Commission’s rules and forms, and that such information is accumulated and communicated to our management, including our Chief Executive Officer and Chief Financial Officer, as appropriate, to allow timely decisions regarding required disclosure.
Evaluation of Disclosure Controls and Procedures
As of December 31, 2017, we carried out an evaluation, under the supervision and with the participation of our management, including our Chief Executive Officer and Chief Financial Officer, of the effectiveness of the design and operation of our disclosure controls and procedures. Based on the foregoing, our Chief Executive Officer and Chief Financial Officer concluded that our disclosure controls and procedures were effective as of the end of the period covered by this annual report.
Changes in Internal Control over Financial Reporting
There were no changes during the fiscal quarter ended December 31, 2017 in our internal control over financial reporting (as defined in Rule 13a-15(f) under the Exchange Act) that have materially affected or are reasonably likely to materially affect our internal control over financial reporting.
Management’s Annual Report on Internal Control over Financial Reporting
The management of Chipotle Mexican Grill, Inc. is responsible for establishing and maintaining adequate internal control over financial reporting. Our internal control over financial reporting is a process designed to provide reasonable assurance regarding the reliability of financial reporting and the preparation of financial statements for external purposes in accordance with accounting principles generally accepted in the United States of America. Our internal control over financial reporting includes those policies and procedures that (i) pertain to the maintenance of records that, in reasonable detail, accurately and fairly reflect the transactions and dispositions of our assets; (ii) provide reasonable assurance that transactions are recorded as necessary to permit preparation of financial statements in accordance with accounting principles generally accepted in the United States of America, and that our receipts and expenditures are being made only in accordance with authorizations of our management and directors; and (iii) provide reasonable assurance regarding prevention or timely detection of unauthorized acquisition, use, or disposition of assets that could have a material effect on our financial statements.
Because of its inherent limitations, internal control over financial reporting may not prevent or detect misstatements. Also, projections of any evaluation of effectiveness to future periods are subject to the risk that controls may become inadequate because of changes in conditions, or that the degree of compliance with the policies or procedures may deteriorate.
Management assessed the effectiveness of our internal control over financial reporting as of December 31, 2017, based on the framework set forth by the Committee of Sponsoring Organizations of the Treadway Commission in Internal Control—Integrated Framework (the “2013 framework”). Based on that assessment, management concluded that, as of December 31, 2017, our internal control over financial reporting was effective based on the criteria established in the 2013 framework.
Our independent registered public accounting firm, Ernst & Young LLP, has issued an attestation report on the effectiveness of our internal control over financial reporting as of December 31, 2017. This report follows.
Report of Independent Registered Public Accounting Firm
To the Shareholders and Board of Directors of Chipotle Mexican Grill, Inc.
Opinion on Internal Control over Financial Reporting
We have audited Chipotle Mexican Grill, Inc.’s internal control over financial reporting as of December 31, 2017, based on criteria established in Internal Control-Integrated Framework issued by the Committee of Sponsoring Organizations of the Treadway Commission (2013 framework) (the COSO criteria). In our opinion, Chipotle Mexican Grill, Inc. (the Company) maintained, in all material respects, effective internal control over financial reporting as of December 31, 2017, based on the COSO criteria.
We also have audited, in accordance with the standards of the Public Company Accounting Oversight Board (United States) (PCAOB), the consolidated balance sheets as of December 31, 2017 and 2016, and the related consolidated statements of income, comprehensive income, shareholders’ equity and cash flows for each of the three years in the period ended December 31, 2017, and the related notes, of the Company and our report dated February 8, 2018 expressed an unqualified opinion thereon.
Basis for Opinion
The Company’s management is responsible for maintaining effective internal control over financial reporting and for its assessment of the effectiveness of internal control over financial reporting included in the accompanying Management’s Annual Report on Internal Control over Financial Reporting. Our responsibility is to express an opinion on the Company’s internal control over financial reporting based on our audit. We are a public accounting firm registered with the PCAOB and are required to be independent with respect to the Company in accordance with the U.S. federal securities laws and the applicable rules and regulations of the Securities and Exchange Commission and the PCAOB.
We conducted our audit in accordance with the standards of the PCAOB. Those standards require that we plan and perform the audit to obtain reasonable assurance about whether effective internal control over financial reporting was maintained in all material respects.
Our audit included obtaining an understanding of internal control over financial reporting, assessing the risk that a material weakness exists, testing and evaluating the design and operating effectiveness of internal control based on the assessed risk, and performing such other procedures as we considered necessary in the circumstances. We believe that our audit provides a reasonable basis for our opinion.
Definition and Limitations of Internal Control Over Financial Reporting
A company’s internal control over financial reporting is a process designed to provide reasonable assurance regarding the reliability of financial reporting and the preparation of financial statements for external purposes in accordance with generally accepted accounting principles. A company’s internal control over financial reporting includes those policies and procedures that (1) pertain to the maintenance of records that, in reasonable detail, accurately and fairly reflect the transactions and dispositions of the assets of the company; (2) provide reasonable assurance that transactions are recorded as necessary to permit preparation of financial statements in accordance with generally accepted accounting principles, and that receipts and expenditures of the company are being made only in accordance with authorizations of management and directors of the company; and (3) provide reasonable assurance regarding prevention or timely detection of unauthorized acquisition, use, or disposition of the company’s assets that could have a material effect on the financial statements.
Because of its inherent limitations, internal control over financial reporting may not prevent or detect misstatements. Also, projections of any evaluation of effectiveness to future periods are subject to the risk that controls may become inadequate because of changes in conditions, or that the degree of compliance with the policies or procedures may deteriorate.
/s/ Ernst & Young LLP
Denver, Colorado
February 8, 2018
Item 9B. OTHER INFORMATION
None.
PART III
Item 10. DIRECTORS, EXECUTIVE OFFICERS AND CORPORATE GOVERNANCE
Incorporated by reference from the definitive proxy statement for our 2018 annual meeting of shareholders, which will be filed no later than 120 days after December 31, 2017.
Item 11. EXECUTIVE COMPENSATION
Incorporated by reference from the definitive proxy statement for our 2018 annual meeting of shareholders, which will be filed no later than 120 days after December 31, 2017.
Item 12. SECURITY OWNERSHIP OF CERTAIN BENEFICIAL OWNERS AND MANAGEMENT AND RELATED STOCKHOLDER MATTERS
Securities Authorized for Issuance Under Equity Compensation Plans
The following table presents information regarding options and rights outstanding under our equity compensation plans as of December 31, 2017. All options/SOSARs reflected are options to purchase common stock.
| (a) Number of Securities to be Issued Upon Exercise of Outstanding Options and Rights(1) | (b) Weighted-Average Exercise Price of Outstanding Options and Rights(1) | (c) Number of Securities Remaining Available for Future Issuance Under Equity Compensation Plans (excluding securities reflected in column (a))(2) | ||||
| Equity Compensation Plans Approved by Security Holders | 2,211,600 | $ | 480.09 | 2,032,484 | ||
| Equity Compensation Plans Not Approved by Security Holders | None | N/A | None | |||
| Total | 2,211,600 | $ | 480.09 | 2,032,484 |
(1)Includes shares issuable in connection with awards with performance and market conditions, which will be issued based on achievement of performance criteria associated with the awards, with the number of shares issuable dependent on our level of performance. The weighted-average exercise price in column (b) includes the weighted-average exercise price of SOSARs only.
(2)Includes 1,786,198 shares remaining available under the Amended and Restated Chipotle Mexican Grill, Inc. 2011 Stock Incentive Plan, and 246,286 shares remaining available under the Chipotle Mexican Grill, Inc. Employee Stock Purchase Plan. In addition to being available for future issuance upon exercise of SOSARs or stock options that may be granted after December 31, 2017, all of the shares available for grant under the Amended and Restated Chipotle Mexican Grill, Inc. 2011 Stock Incentive Plan may instead be issued in the form of restricted stock, restricted stock units, performance shares or other equity-based awards. Each share underlying a full value award such as restricted stock, restricted stock units or performance shares counts as two shares used against the total number of securities authorized under the plan.
Additional information for this item is incorporated by reference from the definitive proxy statement for our 2018 annual meeting of shareholders, which will be filed no later than 120 days after December 31, 2017.
Item 13. CERTAIN RELATIONSHIPS AND RELATED TRANSACTIONS, AND DIRECTOR INDEPENDENCE
Incorporated by reference from the definitive proxy statement for our 2018 annual meeting of shareholders, which will be filed no later than 120 days after December 31, 2017.
Item 14. PRINCIPAL ACCOUNTING FEES AND SERVICES
Incorporated by reference from the definitive proxy statement for our 2018 annual meeting of shareholders, which will be filed no later than 120 days after December 31, 2017.
PART IV
Item 15. EXHIBITS, FINANCIAL STATEMENT SCHEDULES
- All Financial statements
Consolidated financial statements filed as part of this report are listed under Item 8. “Financial Statements and Supplementary Data.”
- Financial statement schedules
No schedules are required because either the required information is not present or is not present in amounts sufficient to require submission of the schedule, or because the information required is included in the consolidated financial statements or the notes thereto.
- Exhibits
Item 16. FORM 10-K SUMMARY
None.
SIGNATURES
Pursuant to the requirements of Section 13 or 15(d) of the Securities Exchange Act of 1934, the registrant has duly caused this report to be signed on its behalf by the undersigned, thereunto duly authorized.
| CHIPOTLE MEXICAN GRILL, INC. | |
| By: | /s/ JOHN R. HARTUNG |
| Name: | John R. Hartung |
| Title: | Chief Financial Officer |
Date: February 8, 2018
POWER OF ATTORNEY
KNOW ALL PERSONS BY THESE PRESENTS, that each person whose signature appears below constitutes and appoints Steve Ells and John Hartung, and each of them, his or her true and lawful attorneys-in-fact, each with full power of substitution, for him or her in any and all capacities, to sign any amendments to this report on Form 10-K and to file the same, with exhibits thereto and other documents in connection therewith, with the Securities and Exchange Commission, hereby ratifying and confirming all that each of said attorneys-in-fact or their substitute or substitutes may do or cause to be done by virtue hereof.
Pursuant to the requirements of the Securities Exchange Act of 1934, this report has been signed below by the following persons on behalf of the registrant and in the capacities and on the dates indicated.
| Signature | Date | Title | |||
| /s/ STEVE ELLS | February 8, 2018 | Chief Executive Officer and Chairman of the Board of Directors (principal executive officer) | |||
| Steve Ells | |||||
| /s/ JOHN R. HARTUNG | February 8, 2018 | Chief Financial Officer (principal financial and accounting officer) | |||
| John R. Hartung | |||||
| /s/ ALBERT S. BALDOCCHI | February 8, 2018 | Director | |||
| Albert S. Baldocchi | |||||
| /s/ PAUL CAPPUCCIO | February 8, 2018 | Director | |||
| Paul Cappuccio | |||||
| /s/ NEIL W. FLANZRAICH | February 8, 2018 | Director | |||
| Neil W. Flanzraich | |||||
| /s/ ROBIN S. HICKENLOOPER | February 8, 2018 | Director | |||
| Robin S. Hickenlooper | |||||
| /s/ KIMBAL MUSK | February 8, 2018 | Director | |||
| Kimbal Musk | |||||
| /s/ ALI NAMVAR | February 8, 2018 | Director | |||
| Ali Namvar | |||||
| /s/ MATTHEW PAULL | February 8, 2018 | Director | |||
| Matthew Paull |