 filings.tools
Item 5. MARKET FOR REGISTRANT’S COMMON EQUITY, RELATED SHAREHOLDER MATTERS AND ISSUER PURCHASES OF EQUITY SECURITIES
44K characters. Original on sec.gov · Markdown
Item 5. MARKET FOR REGISTRANT’S COMMON EQUITY, RELATED SHAREHOLDER MATTERS AND ISSUER PURCHASES OF EQUITY SECURITIES
Our common stock trades on the New York Stock Exchange under the symbol “CMG.”
As of February 8, 2021, there were approximately 935 shareholders of record. This does not include persons whose stock is in nominee or “street name” accounts through brokers.
Purchases of Equity Securities by the Issuer
On March 20, 2020, we temporarily suspended our stock repurchase program. The total remaining dollar value of shares that may yet be purchased under our stock repurchase program is $115.0 million as of December 31, 2020.
Dividend Policy
We are not required to pay any dividends and have not declared or paid any cash dividends on our common stock. We intend to continue to retain earnings for use in the operation and expansion of our business and to repurchase shares of common stock (subject to market conditions), and therefore do not anticipate paying any cash dividends on our common stock in the foreseeable future.
COMPARISON OF CUMULATIVE TOTAL RETURN
The following graph compares the cumulative annual stockholders return on our common stock from December 31, 2015, through December 31, 2020, to that of the total return index for the S&P 500 and the S&P 500 Restaurants Index assuming an investment of $100 on December 31, 2015. In calculating total annual stockholder return, reinvestment of dividends, if any, is assumed. The indices are included for comparative purposes only. They do not necessarily reflect management’s opinion that such indices are an appropriate measure of the relative performance of our common stock. The values shown are neither indicative nor determinative of future performance. This graph is not “soliciting material,” is not deemed filed with the Securities and Exchange Commission and is not to be incorporated by reference in any of our filings under the Securities Act or the Exchange Act, whether made before or after the date hereof and irrespective of any general incorporation language in any such filing.
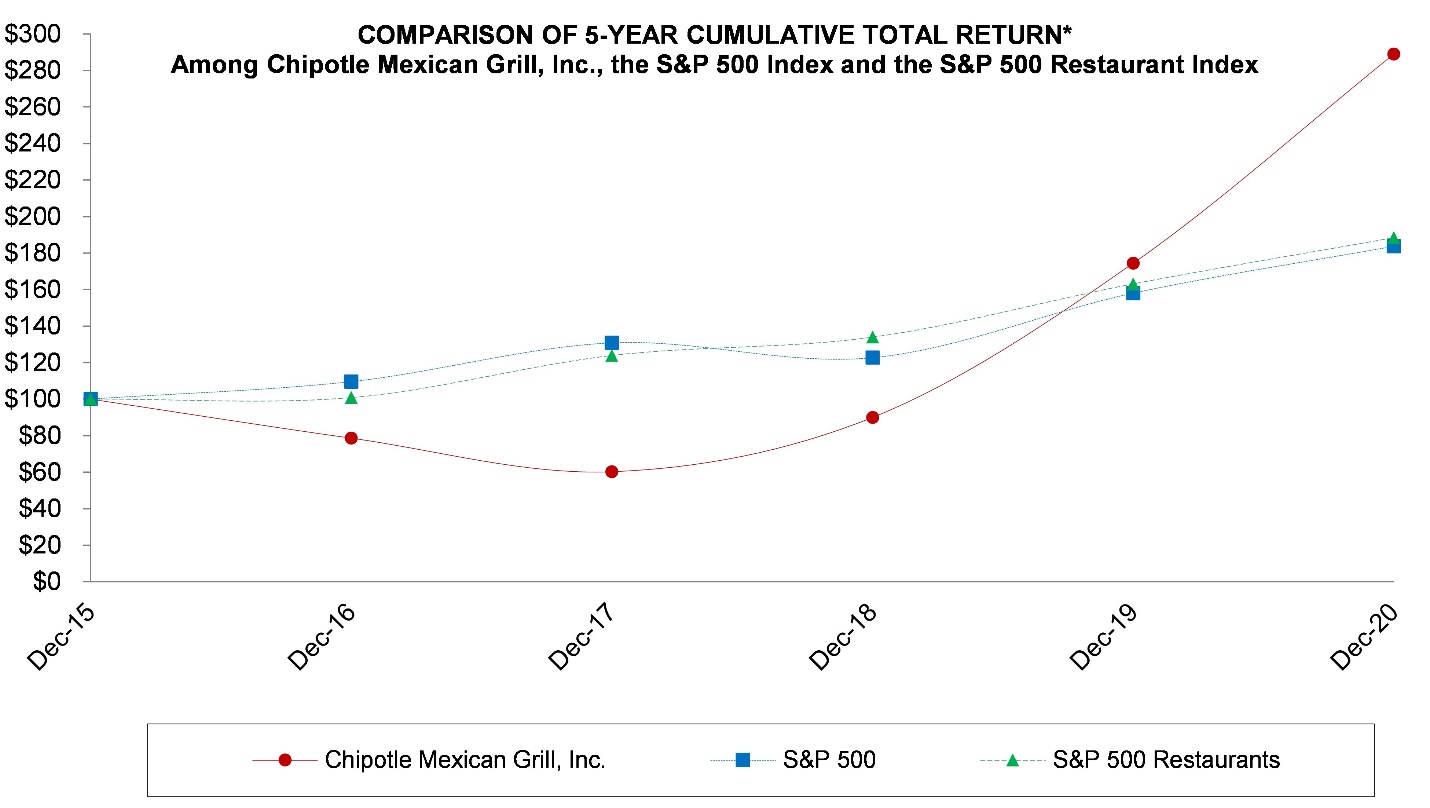
| Company/Index | Dec. 31, 2015 | Dec. 30, 2016 | Dec. 30, 2017 | Dec. 30, 2018 | Dec. 30, 2019 | Dec. 29, 2020 | |||||||||||
| Chipotle Mexican Grill, Inc. | $ | 100 | $ | 79 | $ | 60 | $ | 90 | $ | 174 | $ | 289 | |||||
| S&P 500 | 100 | 110 | 131 | 123 | 158 | 184 | |||||||||||
| S&P 500 Restaurants | 100 | 101 | 124 | 134 | 163 | 188 |
*$100 invested on December 31, 2015 in stock or index, including reinvestment of dividends.
Fiscal year ending December 31.
Source data: S&P Capital IQ
ITEM 6**. SELECTED FINANCIAL DATA**
Our selected consolidated financial data shown below should be read together with Item 7. “Management’s Discussion and Analysis of Financial Condition and Results of Operations” and our consolidated financial statements and respective notes included in Item 8. “Financial Statements and Supplementary Data.” The data shown below is not necessarily indicative of results to be expected for any future period (dollar and share amounts in thousands, except per share data).
| Year ended December 31, | ||||||||||||||
| 2020 | 2019 | 2018 | 2017 | 2016 | ||||||||||
| Statement of Income: | ||||||||||||||
| Food and beverage revenue | $ | 5,920,545 | $ | 5,561,036 | $ | 4,860,626 | $ | 4,476,412 | $ | 3,904,384 | ||||
| Delivery service revenue | 64,089 | 25,333 | 4,359 | - | - | |||||||||
| Total revenue | 5,984,634 | 5,586,369 | 4,864,985 | 4,476,412 | 3,904,384 | |||||||||
| Food, beverage and packaging costs | 1,932,766 | 1,847,916 | 1,600,760 | 1,535,428 | 1,365,580 | |||||||||
| Labor costs | 1,593,013 | 1,472,060 | 1,326,079 | 1,205,992 | 1,105,001 | |||||||||
| Occupancy costs | 387,762 | 363,072 | 347,123 | 327,132 | 293,636 | |||||||||
| Other operating costs | 1,030,012 | 760,831 | 680,031 | 651,644 | 641,953 | |||||||||
| General and administrative expenses | 466,291 | 451,552 | 375,460 | 296,388 | 276,240 | |||||||||
| Depreciation and amortization | 238,534 | 212,778 | 201,979 | 163,348 | 146,368 | |||||||||
| Pre-opening costs | 15,515 | 11,108 | 8,546 | 12,341 | 17,162 | |||||||||
| Impairment, closure costs and asset disposals | 30,577 | 23,094 | 66,639 | 13,345 | 23,877 | |||||||||
| Total operating expenses | 5,694,470 | 5,142,411 | 4,606,617 | 4,205,618 | 3,869,817 | |||||||||
| Income from operations | 290,164 | 443,958 | 258,368 | 270,794 | 34,567 | |||||||||
| Interest and other income, net | 3,617 | 14,327 | 10,068 | 4,949 | 4,172 | |||||||||
| Income before income taxes | 293,781 | 458,285 | 268,436 | 275,743 | 38,739 | |||||||||
| Benefit/(provision) for income taxes | 61,985 | (108,127) | (91,883) | (99,490) | (15,801) | |||||||||
| Net income | $ | 355,766 | $ | 350,158 | $ | 176,553 | $ | 176,253 | $ | 22,938 | ||||
| Earnings per share: | ||||||||||||||
| Basic | $ | 12.74 | $ | 12.62 | $ | 6.35 | $ | 6.19 | $ | 0.78 | ||||
| Diluted | $ | 12.52 | $ | 12.38 | $ | 6.31 | $ | 6.17 | $ | 0.77 | ||||
| Weighted average common shares: outstanding | ||||||||||||||
| Basic | 27,917 | 27,740 | 27,823 | 28,491 | 29,265 | |||||||||
| Diluted | 28,416 | 28,295 | 27,962 | 28,561 | 29,770 | |||||||||
| December 31, | ||||||||||||||
| 2020 | 2019 | 2018 | 2017 | 2016 | ||||||||||
| Balance Sheet Data: | ||||||||||||||
| Total current assets | $ | 1,420,237 | $ | 1,072,204 | $ | 814,794 | $ | 629,535 | $ | 522,374 | ||||
| Total assets | $ | 5,982,896 | $ | 5,104,604 | $ | 2,265,518 | $ | 2,045,692 | $ | 2,026,103 | ||||
| Total current liabilities | $ | 822,199 | $ | 666,593 | $ | 449,990 | $ | 323,893 | $ | 281,793 | ||||
| Total liabilities | $ | 3,962,761 | $ | 3,421,578 | $ | 824,179 | $ | 681,247 | $ | 623,610 | ||||
| Total shareholders’ equity | $ | 2,020,135 | $ | 1,683,026 | $ | 1,441,339 | $ | 1,364,445 | $ | 1,402,493 |
ITEM 7**. MANAGEMENT’S DISCUSSION AND ANALYSIS OF FINANCIAL CONDITION AND RESULTS OF OPERATIONS**
You should read the following discussion together with Item 6. “Selected Financial Data” and our consolidated financial statements and related notes included in Item 8. “Financial Statements and Supplementary Data.” This section of the Form 10-K generally discusses 2020 and 2019 items and year-to-year comparisons of 2020 to 2019. Discussions of 2018 items and year-to-year comparisons of 2019 and 2018 that are not included in this Form 10-K can be found in “Management’s Discussion and Analysis of Financial Condition and Results of Operations” in Part II, Item 7 on our Annual Report on Form 10-K for the year ended December 31, 2019. The discussion contains forward-looking statements involving risks, uncertainties and assumptions that could cause our results to differ materially from expectations. See “Cautionary Note Regarding Forward-Looking Statements.” Factors that might cause such differences include those described in Item 1A. “Risk Factors” and elsewhere in this report.
Overview
As of December 31, 2020, we operated 2,724 Chipotle restaurants throughout the United States, 40 international Chipotle restaurants, and four non-Chipotle restaurants. We are committed to making good food more accessible to everyone while continuing to be a brand with a demonstrated purpose.
Overview of the Impact of COVID-19
The COVID-19 pandemic has adversely affected, and will continue to adversely affect, our operations and financial results for the foreseeable future. In response to COVID-19, we temporarily closed some restaurants and dining rooms in our restaurants. We continue to follow guidance from health officials in determining the appropriate restrictions to put in place for each restaurant. As of December 31, 2020, the majority of our restaurants have been reopened for dine-in with restrictions, such as social distancing and mask requirements for all customers, to ensure the health and safety of our guests and employees. Certain restaurants only offer take-out, digital order ahead and delivery services in accordance with local guidance and regulations. For a further discussion of the impacts that COVID-19 has had on our financial results refer to the “Results of Operations.”
We remain in regular contact with our major suppliers and while to date we have not experienced significant disruptions in our supply chain, we could see future disruptions should the impacts of COVID-19 extend for a considerable amount of time. Within our restaurants, we have taken a number of steps to enhance our robust food safety protocols including the creation of the steward role which is focused on sanitization in high-touch and high-traffic areas, providing masks for all employees, and having a tamper evident packaging seal for all digital orders. To support our employees, we have eliminated non-essential travel, implemented work from home for our support centers, and significantly expanded employee benefits. We remain focused on reducing non-essential controllable costs and judiciously spending on return generating projects to preserve liquidity. We suspended our stock buyback program during the first quarter of 2020. If our business continues to improve and the economy continues to stabilize, we may begin buying again in the first or second quarter of 2021.
2020 Financial Highlights
Total revenue increased 7.1% to $6.0 billion in 2020 compared to $5.6 billion in 2019
Comparable restaurant sales increased 1.8%
Diluted earnings per share (“diluted EPS”) for 2020 increased to $12.52, which included an income tax benefit of $3.79, offset by a $2.00 after-tax impact from expenses related to legal, corporate restructuring, restaurant closure costs, and certain other costs, a 1.1% increase from $12.38 in 2019.
Sales Trends. Average restaurant sales were $2.223 million for the year ended December 31, 2020, an increase from $2.205 million for the year ended December 31, 2019. We define average restaurant sales as the average trailing 12-month food and beverage sales for restaurants in operation for at least 12 full calendar months.
Total revenue was $6.0 billion in 2020, an increase of 7.1% from $5.6 billion in 2019. The increase was attributable to new restaurant openings and increased comparable restaurant sales. Comparable restaurant sales increased 1.8% for the full year 2020. Comparable restaurant sales represent the change in period-over-period sales or transactions for restaurants in operation for at least 13 full calendar months.
We continue to invest in improving our digital platforms and have significantly upgraded our capabilities by digitizing almost all of our digital-make lines, expanding our partnerships with multiple third-party delivery services and building more Chipotlanes, which is our drive through format for digital order pickups. Digital sales, which includes delivery and customer pick-up, increased 174.1% year over year and accounted for 46.2% of 2020 sales, compared to 10.9% of 2019 sales. The shift to digital sales accelerated in March 2020 as a result of the COVID-19 pandemic.
Restaurant Operating Costs. During the year ended December 31, 2020, our restaurant operating costs (food, beverage and packaging; labor; occupancy; and other operating costs) were 82.6% of total revenue, an increase from 79.5% in 2019. The increase was driven primarily by COVID-19 related impacts including increased delivery expenses, assistance and exclusion pay, elevated beef prices, increased incidence of steak, and fewer sales of high margin beverages. The increase was partially offset by benefits from menu price increases, lower avocado pricing and improved labor efficiency realized from digital enhancements to the restaurants.
Restaurant Development. For the full year 2020, we opened 161 new restaurants, which included 100 restaurants with a Chipotlane. We expect to open approximately 200 new restaurants in 2021.
Restaurant Activity
The following table details restaurant unit data for the years indicated.
| Year ended December 31, | |||||
| 2020 | 2019 | 2018 | |||
| Beginning of period | 2,622 | 2,491 | 2,408 | ||
| Chipotle openings | 160 | 139 | 137 | ||
| Pizzeria Locale openings | 1 | 1 | - | ||
| Chipotle permanent closures | (9) | (7) | (43) | ||
| Chipotle relocations | (6) | (2) | (5) | ||
| Pizzeria Locale closures | - | - | (5) | ||
| TastyMade closures | - | - | (1) | ||
| Total restaurants at end of period | 2,768 | 2,622 | 2,491 |
Results of Operations
Our results of operations as a percentage of total revenue and period-over-period change are discussed in the following section.
Revenue
| Year ended December 31, | Percentage change | |||||||||||
| 2020 | 2019 | 2018 | 2020/2019 | 2019/2018 | ||||||||
| (dollars in millions) | ||||||||||||
| Food and beverage revenue | $ | 5,920.5 | $ | 5,561.0 | $ | 4,860.6 | 6.5% | 14.4% | ||||
| Delivery service revenue | 64.1 | 25.3 | 4.4 | 153.0% | 475.8% | |||||||
| Total revenue | $ | 5,984.6 | $ | 5,586.4 | $ | 4,865.0 | 7.1% | 14.8% | ||||
| Average restaurant sales (1) | $ | 2.2 | $ | 2.2 | $ | 2.0 | (1.0%) | 10.8% | ||||
| Comparable restaurant sales increase (decrease) | 1.8% | 11.1% | 4.0% | |||||||||
| (1) Average restaurant sales refer to the average trailing 12-month food and beverage sales for restaurants in operation for at least 12 full calendar months. |
The significant factors contributing to the total revenue increase in 2020 were new restaurant openings and comparable restaurant sales increases. Comparable restaurant sales increased $77.7 million and revenue from restaurants not yet in the comparable restaurant base contributed $319.9 million to the total revenue increase, of which $126.4 million was attributable to restaurants opened in 2020.
Food, Beverage and Packaging Costs
| Year ended December 31, | Percentage change | |||||||||||
| 2020 | 2019 | 2018 | 2020/2019 | 2019/2018 | ||||||||
| (dollars in millions) | ||||||||||||
| Food, beverage and packaging | $ | 1,932.8 | $ | 1,847.9 | $ | 1,600.8 | 4.6% | 15.4% | ||||
| As a percentage of total revenue | 32.3% | 33.1% | 32.9% | (0.8%) | 0.2% |
Food, beverage and packaging costs decreased as a percentage of total revenue in 2020 primarily due to menu price increases taken in the second half of 2020, favorable avocado pricing and better waste control. These benefits were partially offset by fewer sales of high margin beverages, COVID-19 related mix shifts, elevated beef pricing due to plant shutdowns in the summer of 2020, and higher dairy pricing.
Labor Costs
| Year ended December 31, | Percentage change | |||||||||||
| 2020 | 2019 | 2018 | 2020/2019 | 2019/2018 | ||||||||
| (dollars in millions) | ||||||||||||
| Labor costs | $ | 1,593.0 | $ | 1,472.1 | $ | 1,326.1 | 8.2% | 11.0% | ||||
| As a percentage of total revenue | 26.6% | 26.4% | 27.3% | 0.2% | (0.9%) |
Labor costs increased as a percentage of total revenue in 2020 primarily due to COVID-19 related labor costs, which included assistance pay for restaurant employees and expansion of our emergency leave benefits to accommodate those directly affected by COVID-19. Our assistance pay program ended on June 7, 2020, while the expansion of emergency leave benefits remains in place as of December 31, 2020. These COVID-19 related increases were partially offset by the benefits of menu price increases taken in the second half of 2020 and improved labor efficiency realized from digital enhancements to the restaurants.
Occupancy Costs
| Year ended December 31, | Percentage change | |||||||||||
| 2020 | 2019 | 2018 | 2020/2019 | 2019/2018 | ||||||||
| (dollars in millions) | ||||||||||||
| Occupancy costs | $ | 387.8 | $ | 363.1 | $ | 347.1 | 6.8% | 4.6% | ||||
| As a percentage of total revenue | 6.5% | 6.5% | 7.1% | 0.0% | (0.6%) |
Occupancy costs as a percentage of total revenue remained consistent in 2020 as compared to 2019. COVID-19 had an immaterial impact on occupancy costs for the year ended December 31, 2020.
Other Operating Costs
| Year ended December 31, | Percentage change | |||||||||||
| 2020 | 2019 | 2018 | 2020/2019 | 2019/2018 | ||||||||
| (dollars in millions) | ||||||||||||
| Other operating costs | $ | 1,030.0 | $ | 760.8 | $ | 680.0 | 35.4% | 11.9% | ||||
| As a percentage of total revenue | 17.2% | 13.6% | 14.0% | 3.6% | (0.4%) |
Other operating costs include, among other items, marketing and promotional costs, delivery expenses, bank and credit card processing fees, and restaurant utilities and maintenance costs. Other operating costs increased as a percentage of total revenue in 2020 primarily due to increased delivery expenses caused by the significant increase in delivery sales in 2020.
As a result of COVID-19, we are adapting our restaurant operations to the changing environment and are reducing non-essential controllable costs. Sales shifted towards delivery after we temporarily closed our dining rooms to help control the spread of COVID-19. We reprioritized marketing efforts by offering free delivery several times in 2020.
General and Administrative Expenses
| Year ended December 31, | Percentage change | |||||||||||
| 2020 | 2019 | 2018 | 2020/2019 | 2019/2018 | ||||||||
| (dollars in millions) | ||||||||||||
| General and administrative expense | $ | 466.3 | $ | 451.6 | $ | 375.5 | 3.3% | 20.3% | ||||
| As a percentage of total revenue | 7.8% | 8.1% | 7.7% | (0.3%) | 0.4% |
General and administrative expenses increased in dollar terms in 2020, primarily due to the following: a $20.1 million increase in outside service expense related to company initiatives to support digital and restaurant growth; a $15.8 million increase in wages and benefits primarily due to headcount increase; and $3.8 million increase of lease costs primarily related to our previous corporate headquarters. These increases were partially offset by a $10.7 million decrease in non-cash stock-based compensation expense, primarily related to performance share awards, and a $7.1 million decrease in travel expense related to our decision to halt non-essential employee travel due to the COVID-19 pandemic.
Other than the impact on travel expenses and stock-based compensation discussed above, COVID-19 had a minimal impact on general and administrative expenses. We will continue to assess additional planned general and administrative investments as we better understand the length and severity of the COVID-19 impacts.
Depreciation and Amortization
| Year ended December 31, | Percentage change | |||||||||||
| 2020 | 2019 | 2018 | 2020/2019 | 2019/2018 | ||||||||
| (dollars in millions) | ||||||||||||
| Depreciation and amortization | $ | 238.5 | $ | 212.8 | $ | 202.0 | 12.1% | 5.3% | ||||
| As a percentage of total revenue | 4.0% | 3.8% | 4.2% | 0.2% | (0.4%) |
Depreciation and amortization increased as a percentage of total revenue in 2020 due to accelerated depreciation associated with our website, mobile app and other technology, new restaurant openings and equipment upgrades in the restaurants primarily to support the growth in our digital business. This increase was partially offset by sales leverage on a partially fixed-cost base.
Impairment, Closure Costs, and Asset Disposals
| Year ended December 31, | Percentage change | |||||||||||
| 2020 | 2019 | 2018 | 2020/2019 | 2019/2018 | ||||||||
| (dollars in millions) | ||||||||||||
| Impairment, closure costs, and asset disposals | $ | 30.6 | $ | 23.1 | $ | 66.6 | 32.4% | (65.3%) | ||||
| As a percentage of total revenue | 0.5% | 0.4% | 1.4% | 0.1% | (1.0%) |
Impairment, closure costs, and asset disposals increased in dollar terms in 2020 primarily due to impairments of leasehold improvements, property and equipment and operating lease assets. COVID-19 had a negative impact on our assumptions for future near-term restaurant level cash flows which resulted in elevated impairment charges.
Benefit/(Provision) for Income Taxes
| Year ended December 31, | Percentage change | |||||||||||
| 2020 | 2019 | 2018 | 2020/2019 | 2019/2018 | ||||||||
| (dollars in millions) | ||||||||||||
| Benefit/(provision) for income taxes | $ | 62.0 | $ | (108.1) | $ | (91.9) | (157.3%) | 17.7% | ||||
| Effective tax rate | (21.1%) | 23.6% | 34.2% | (44.7%) | (10.6%) |
The effective income tax rate for the year ended December 31, 2020 was lower than the effective income tax rate for the year ended December 31, 2019, primarily due to the federal net operating loss that is estimated for tax year 2020, which we expect to carryback to tax years 2015-2017. The tax benefit is due to the federal income tax rate differential between the 2020 statutory federal income tax rate of 21% and the 2015-2017 statutory federal income tax rate of 35%.
Quarterly Financial Data/Seasonality
See Note 15. “Quarterly Financial Data (Unaudited)” for a table presenting data from the consolidated statements of income for each of the eight quarters in the period ended December 31, 2020.
Seasonal factors cause our profitability to fluctuate from quarter to quarter. Historically, our average daily restaurant sales and net income are lower in the first and fourth quarters due, in part, to the holiday season and because fewer people eat out during periods of inclement weather (the winter months) than during periods of mild or warm weather (the spring, summer and fall months). Other factors also have a seasonal effect on our results. For example, restaurants located near colleges and universities generally do more business during the academic year. Seasonal factors, however, might be moderated or outweighed by other factors that may influence our quarterly results, such as unexpected publicity impacting our business in a positive or negative way, worldwide health pandemics, fluctuations in food or packaging costs, or the timing of menu price increases or promotional activities and other marketing initiatives. The number of trading days in a quarter can also affect our results, although, on an overall annual basis, changes in trading days do not have a significant impact.
Our quarterly results are also affected by other factors such as the amount and timing of non-cash stock-based compensation expense and related tax rate impacts, litigation, settlement costs and related legal expenses, impairment charges and non-operating costs, timing of marketing or promotional expenses, the number and timing of new restaurants opened in a quarter, and closure of restaurants. New restaurants typically have lower margins following opening because of the expenses associated with their opening
and operating inefficiencies in the months immediately following opening. Accordingly, results for a particular quarter are not necessarily indicative of results to be expected for any other quarter or for any year.
Liquidity and Capital Resources
Historically, our primary liquidity and capital requirements are for new restaurant construction, initiatives to improve the guest experience in our restaurants, working capital and general corporate needs. As of December 31, 2020, we had a cash and marketable investments balance of $1.1 billion, excluding restricted cash of $27.8 million. We expect to utilize cash flow from operations to continue investments in new restaurant construction, remodels primarily for restaurants that do not have a digital make line or Chipotlane and technology. Additionally, as of December 31, 2020, we had $600.0 million of undrawn borrowing capacity under a line of credit facility, which expires in May 2021.
As sales fell quickly from the impact of COVID-19, we proactively implemented several actions to reduce cash outlays and expenses. As part of our cash preservation strategy, in March 2020 we temporarily suspended our stock buyback program. In our restaurants, we are working to minimize waste, effectively schedule labor hours, and reduce non-essential controllable costs. We halted all non-essential travel and expenses. We believe that cash from operations, together with our cash and investment balances, will be sufficient to meet ongoing capital expenditures, working capital requirements and other cash needs for the foreseeable future. Assuming no significant declines in comparable restaurant sales, we expect that we will generate positive cash flow through the foreseeable future. Should our business deteriorate due to changing conditions, there are other actions we can take to further conserve liquidity.
We have not required significant working capital because customers generally pay using cash or credit and debit cards and because our operations do not require significant receivables, nor do they require significant inventories due, in part, to our use of various fresh ingredients. In addition, we generally have the right to pay for the purchase of food, beverages and supplies sometime after the receipt of those items, generally within ten days, thereby reducing the need for incremental working capital to support our growth.
Our total capital expenditures for 2020 were $373.4 million. In 2020, we spent on average about $1.1 million in development and construction costs per new restaurant, or about $1.0 million net of landlord reimbursements of $0.1 million. In 2021, we expect to incur about $390 million in total capital expenditures. We expect approximately $220 million in capital expenditures related to our construction of new restaurants, before any reductions for landlord reimbursements. For new restaurants to be opened in 2021, we anticipate average development costs will remain higher than the historical average due to a significant portion including Chipotlanes. We expect approximately $120 million in capital expenditures related to investments in existing restaurants, including updated equipment, technology, remodeling and similar improvements. Finally, we expect a portion of our capital expenditures for the year to be incurred for additional corporate initiatives including building corporate offices, upgrading our mobile app, and other projects.
Contractual Obligations
Our contractual obligations as of December 31, 2020 were as follows:
| Payments Due by Fiscal Year | |||||||||||||||
| Total | 2021 | 2022-2023 | 2024-2025 | Thereafter | |||||||||||
| (dollars in millions) | |||||||||||||||
| Operating leases(1) | $ | 4,502 | $ | 332 | $ | 715 | $ | 679 | $ | 2,776 | |||||
| Purchase obligations(2) | 1,862 | 584 | 359 | 454 | 465 | ||||||||||
| Deemed landlord financing(1) | 2 | - | 1 | 1 | - | ||||||||||
| Total | $ | 6,366 | $ | 916 | $ | 1,075 | $ | 1,134 | $ | 3,241 |
(1)See Note 10. “Leases” of our consolidated financial statements included in Item 8. “Financial Statements and Supplementary Data.” This includes commitments related to reasonably certain renewal periods.
(2)Purchase obligations include agreements to purchase goods or services that are enforceable and legally binding on us and that specify all significant terms. We have excluded agreements that are cancelable without penalty. The majority of our purchase obligations relate to amounts owed for produce and other ingredients and supplies, orders submitted for equipment for restaurants under construction and planned remodels, information technology, and marketing initiatives and corporate sponsorships.
The above table does not include income tax liabilities for uncertain tax positions for which we are not able to make a reasonably reliable estimate of the amount and period of related future payments. Additionally, we have excluded our estimated loss contingencies, due to uncertainty regarding the timing and amount of payment. See Note 12. “Commitments and Contingencies” of our consolidated financial statements included in Item 8. “Financial Statements and Supplementary Data.”
Off-Balance Sheet Arrangements
As of December 31, 2020 and 2019, we had no material off-balance sheet arrangements or obligations.
Inflation
The primary areas of our operations affected by inflation are food, labor, rent, healthcare costs, fuel, utility costs, and materials used in the construction of our restaurants. Although a significant majority of our crew members make more than the federal and applicable state and local minimum wage, increases in the applicable federal or state minimum wage may have an impact on our labor costs by causing wage inflation above the minimum wage level. Additionally, many of our leases require us to pay property taxes, maintenance, and utilities, all of which are generally subject to inflationary increases. In the past we have largely been able to offset inflationary increases with menu price increases. If we do raise menu prices in the future, general competitive pressures or negative consumer responses may limit our ability to completely recover cost increases attributable to inflation.
Critical Accounting Estimates
We describe our significant accounting policies in Note 1. “Description of Business and Summary of Significant Accounting Policies” of our consolidated financial statements included in Item 8. “Financial Statements and Supplementary Data.” Critical accounting estimates are those that we believe are both significant and that require us to make difficult, subjective or complex judgments, often because we need to estimate the effect of inherently uncertain matters. We base our estimates and judgments on historical experiences and various other factors that we believe to be appropriate under the circumstances. Actual results may differ from these estimates, and we might obtain different estimates if we used different assumptions or factors.
Leases
We determine if a contract contains a lease at inception. Our material operating leases consist of restaurant locations and office space. Our leases generally have remaining terms of 1-20 years and most include options to extend the leases for additional 5-year periods. Generally, the lease term is the minimum of the noncancelable period of the lease or the lease term inclusive of reasonably certain renewal periods up to a term of 20 years. If the estimate of our reasonably certain lease term was changed, our depreciation and rent expense could differ materially.
Operating lease assets and liabilities are recognized at time of lease inception. Operating lease liabilities represent the present value of lease payments not yet paid. Operating lease assets represent our right to use an underlying asset and are based upon the operating lease liabilities adjusted for prepayments or accrued lease payments, initial direct costs, lease incentives, and impairment of operating lease assets. To determine the present value of lease payments not yet paid, we estimate incremental borrowing rates corresponding to the reasonably certain lease term. As we have no outstanding debt nor committed credit facilities, secured or otherwise, we estimate this rate based on prevailing financial market conditions, comparable company and credit analysis, and management judgment. If the estimate of our incremental borrowing rate was changed, our operating lease assets and liabilities could differ materially.
Chipotle Rewards Loyalty Program
Eligible customers who enroll in the Chipotle Rewards loyalty program generally earn points for every dollar spent. After accumulating a certain number of points, the customer earns a reward that can be redeemed for a free entrée. Earned rewards generally expire one to two months after they are issued, and points generally expire if an account is inactive for a period of six months.
The estimation of the standalone selling price of points and other rewards issued to customers involves several assumptions, primarily the estimated value of product for which the reward is expected to be redeemed and the probability that the points or reward will expire. Our estimate of points and other rewards we expect to be redeemed is based on historical company specific data. These inputs are subject to change over time due to factors such as menu price increases, changes in point redemption options and changes in customer behavior.
Impairment of Long-Lived Assets
Long-lived assets are reviewed for impairment whenever events or changes in circumstances indicate that the carrying amount of an asset may not be recoverable. For the purpose of reviewing restaurant assets to be held and used for potential impairment, assets are grouped together at the market level, or in the case of a potential relocation or closure, at the restaurant level. We manage our restaurants as a group with significant common costs and promotional activities; as such, an individual restaurant’s cash flows are not generally independent of the cash flows of others in a market.
The fair value measurement for asset impairment is based on Level 3 inputs. We first compare the carrying value of the asset (or asset group, referred interchangeably throughout as asset) to the asset’s estimated future undiscounted cash flows. If the estimated
undiscounted future cash flows are less than the carrying value of the asset, we determine if we have an impairment loss by comparing the carrying value of the asset to the asset's estimated fair value. The estimated fair value of the asset is generally determined using the income approach to measure the fair value, which is based on the present value of estimated future cash flows. Key inputs to the income approach for restaurant assets include the discount rate, projected revenue and expenses, and sublease income if we are closing the restaurant. In certain cases, management uses other market information, when available, to estimate the fair value of an asset. The impairment charges represent the excess of each asset’s carrying amount over its estimated fair value and are allocated among the long-lived asset or assets of the group.
Our estimates of future revenues and expenses are highly subjective judgments based on internal projections and knowledge of our operations, historical performance, and trends in sales and restaurant operating costs, and can be significantly impacted by changes in our business or economic conditions. The determination of asset fair value is also subject to significant judgment and utilizes valuation techniques including discounting estimated future cash flows and market-based analyses to determine fair value. If our estimates or underlying assumptions, including discount rate and sublease income change in the future, our operating results may be materially impacted.
Stock-based Compensation
We recognize compensation expense for equity awards over the requisite service period based on the award’s fair value. We use the Black-Scholes valuation model to determine the fair value of our stock-only stock appreciation rights (“SOSARs”), and we use the Monte Carlo simulation model to determine the fair value of stock awards that contain market conditions. Both of these models require assumptions to be made regarding our stock price volatility, the expected life of the award and expected dividend rates. The volatility assumption was based on our historical data and implied volatility, and the expected life assumptions were based on our historical data. Similarly, the compensation expense of performance share awards is based in part on the estimated probability of achieving levels of performance associated with particular levels of payout for performance shares. We determine the probability of achievement of future levels of performance by comparing the relevant performance level with our internal estimates of future performance. Those estimates are based on a number of assumptions, including but not limited to growth in comparable restaurant sales and average restaurant level margin, and different assumptions may have resulted in different conclusions regarding the probability of our achieving future levels of performance relevant to the payout levels for the awards. Had we arrived at different assumptions of stock price volatility or expected lives of our SOSARs, or if we changed our assumptions regarding the probability of our achieving future levels of performance with respect to performance share awards, our stock-based compensation expense and results of operations may be materially different.
Insurance Liability
We are self-insured for a significant portion of our employee health benefits programs, and carry significant retentions for risks and associated liabilities with respect to workers’ compensation, general liability, property and auto damage, employment practices liability, cyber liability and directors and officer’s liability. Predetermined loss limits have been arranged with third-party insurance companies to limit exposure to these claims. We record a liability that represents our estimated cost of claims incurred and unpaid as of the balance sheet date. Our estimated liability is not discounted and is based on a number of assumptions and factors, including historical trends, actuarial assumptions and economic conditions, and is closely monitored and adjusted when warranted by changing circumstances. If a greater amount of claims occurs compared to what we have estimated, or if medical costs increase beyond what we expected, our accrued liabilities might not be sufficient and we may be required to record additional expense. Actual claims experience could also be more favorable than estimated, which would result in expense reductions. Unanticipated changes may produce materially different amounts of expense than that reported under these programs.
Reserves/Contingencies for Litigation and Other Matters
We are involved in various claims and legal actions that arise in the ordinary course of business. We record an accrual for legal contingencies when we determine that it is probable that we have incurred a liability and we can reasonably estimate the amount of the loss. Although we have recorded liabilities related to a number of legal actions, our estimates used to determine the amount of these liabilities may not be accurate, and there are other legal actions for which we have not recorded a liability. As a result, in the event legal actions for which we have not accrued a liability or for which our accrued liabilities are not accurate are resolved, such resolution may affect our operating results and cash flows.
Income Taxes
Our benefit/(provision) for income taxes, deferred tax assets and liabilities including valuation allowance requires the use of estimates based on our management’s interpretation and application of complex tax laws and accounting guidance. We are primarily subject to income taxes in the United States. We establish reserves for uncertain tax positions for material, known tax exposures in accordance with Accounting Standards Codification (“ASC”) 740 relating to deductions, transactions and other matters involving some uncertainty as to the measurement and recognition of the item. We may adjust these reserves when our judgment changes as a result of the evaluation of new information not previously available and will be reflected in the period in which the new information is available. While we believe that our reserves are adequate, issues raised by a tax authority may be resolved at an amount different than the related reserve and could materially increase or decrease our income tax provision in future periods.
Previous: Item 3. LEGAL PROCEEDINGS · Next: Item 7A. QUANTITATIVE AND QUALITATIVE DISCLOSURE ABOUT MARKET RISK