 filings.tools
Item 5. MARKET FOR REGISTRANT’S COMMON EQUITY, RELATED SHAREHOLDER MATTERS AND ISSUER PURCHASES OF EQUITY SECURITIES
4K characters. Original on sec.gov · Markdown
Item 5. MARKET FOR REGISTRANT’S COMMON EQUITY, RELATED SHAREHOLDER MATTERS AND ISSUER PURCHASES OF EQUITY SECURITIES
Our common stock trades on the New York Stock Exchange under the symbol “CMG.”
As of February 7, 2022, there were approximately 1,091 shareholders of record. This does not include persons whose stock is in nominee or “street name” accounts through brokers.
Purchases of Equity Securities by the Issuer
The table below reflects shares of common stock we repurchased during the fourth quarter of 2021.
| Total Number of Shares Purchased | Average Price Paid Per Share | Total Number of Shares Purchased as Part of Publicly Announced Plans or Programs**(1)** | Approximate Dollar Value of Shares that May Yet Be Purchased Under the Plans or Programs | ||||||||
| October | 27,172 | $ | 1,811.91 | 27,172 | $ | 160,558,269 | |||||
| Purchased 10/1 through 10/31 | |||||||||||
| November | 29,834 | $ | 1,767.37 | 29,834 | $ | 107,830,424 | |||||
| Purchased 11/1 through 11/30 | |||||||||||
| December(2) | 39,518 | $ | 1,694.41 | 39,518 | $ | 240,870,889 | |||||
| Purchased 12/1 through 12/31 | |||||||||||
| Total | 96,524 | $ | 1,750.04 | 96,524 |
(1) Shares were repurchased pursuant to repurchase programs announced on July 20, 2021 and October 21, 2021.
(2) The December total includes an additional $200 million in authorized repurchases approved on December 7, 2021 and announced February 8, 2022. There is no expiration date for this program. The authorization to repurchase shares will end when we have repurchased the maximum amount of shares authorized, or we have determined to discontinue such repurchases.
Dividend Policy
We are not required to pay any dividends and have not declared or paid any cash dividends on our common stock. We intend to continue to retain earnings for use in the operation and expansion of our business and to repurchase shares of common stock (subject to market conditions), and therefore do not anticipate paying any cash dividends on our common stock in the foreseeable future.
COMPARISON OF CUMULATIVE TOTAL RETURN
The following graph compares the cumulative annual stockholders return on our common stock from December 31, 2016, through December 31, 2021, to that of the total return index for the S&P 500 and the S&P 500 Restaurants Index assuming an investment of $100 on December 31, 2016. In calculating total annual stockholder return, reinvestment of dividends, if any, is assumed. The indices are included for comparative purposes only. They do not necessarily reflect management’s opinion that such indices are an appropriate measure of the relative performance of our common stock. The values shown are neither indicative nor determinative of future performance. This graph is not “soliciting material,” is not deemed filed with the Securities and Exchange Commission and is not to be incorporated by reference in any of our filings under the Securities Act or the Exchange Act, whether made before or after the date hereof and irrespective of any general incorporation language in any such filing.
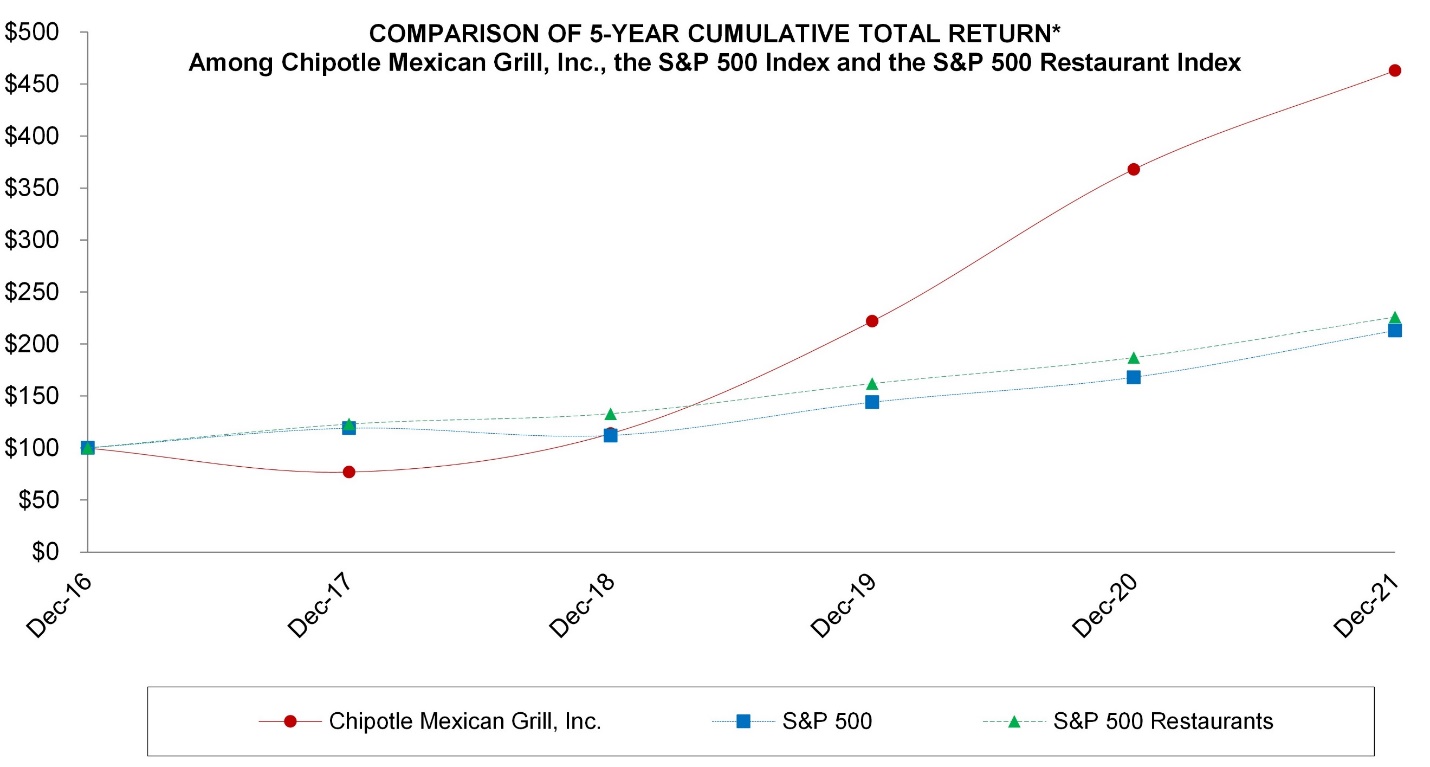
| Company/Index | 2016 | 2017 | 2018 | 2019 | 2020 | 2021 | |||||||||||
| Chipotle Mexican Grill, Inc. | $ | 100 | $ | 77 | $ | 114 | $ | 222 | $ | 368 | $ | 463 | |||||
| S&P 500 | 100 | 119 | 112 | 144 | 168 | 213 | |||||||||||
| S&P 500 Restaurants | 100 | 123 | 133 | 162 | 187 | 226 |
*$100 invested on December 31, 2016, in stock or index, including reinvestment of dividends.
Fiscal year ending December 31.
Source data: S&P Capital IQ
Previous: Item 4. MINE SAFETY DISCLOSURES · Next: Item 6. RESERVED