 filings.tools
Item 7. MANAGEMENT’S DISCUSSION AND ANALYSIS OF FINANCIAL CONDITION AND RESULTS OF OPERATIONS
172K characters. Original on sec.gov · Markdown
Item 7. MANAGEMENT’S DISCUSSION AND ANALYSIS OF FINANCIAL CONDITION AND RESULTS OF OPERATIONS
| --- | --- |
Management’s Discussion and Analysis is the company’s analysis of its financial performance and of significant trends that may affect future performance. It should be read in conjunction with the financial statements and notes, and supplemental oil and gas disclosures included elsewhere in this report. It contains forward-looking statements including, without limitation, statements relating to the company’s plans, strategies, objectives, expectations and intentions that are made pursuant to the “safe harbor” provisions of the Private Securities Litigation Reform Act of 1995. The words “anticipate,” “estimate,” “believe,” “budget,” “continue,” “could,” “intend,” “may,” “plan,” “potential,” “predict,” “seek,” “should,” “will,” “would,” “expect,” “objective,” “projection,” “forecast,” “goal,” “guidance,” “outlook,” “effort,” “target” and similar expressions identify forward-looking statements. The company does not undertake to update, revise or correct any of the forward-looking information unless required to do so under the federal securities laws. Readers are cautioned that such forward-looking statements should be read in conjunction with the company’s disclosures under the heading: “CAUTIONARY STATEMENT FOR THE PURPOSES OF THE ‘SAFE HARBOR’ PROVISIONS OF THE PRIVATE SECURITIES LITIGATION REFORM ACT OF 1995,” beginning on page 76.
The terms “earnings” and “loss” as used in Management’s Discussion and Analysis refer to net income (loss) attributable to ConocoPhillips.
BUSINESS ENVIRONMENT AND EXECUTIVE OVERVIEW
ConocoPhillips is the world’s largest independent exploration and production (E&P) company, based on proved reserves and production of liquids and natural gas. Headquartered in Houston, Texas, we have operations and activities in 16 countries. Our diverse, low cost of supply portfolio includes resource-rich unconventional plays in North America; lower-risk conventional assets in North America, Europe, Asia and Australia; liquefied natural gas (LNG) developments; oil sands assets in Canada; and an inventory of global conventional and unconventional exploration prospects. At December 31, 2018, we employed approximately 10,800 people worldwide and had total assets of $70 billion.
Overview
In 2018, the energy industry continued to be volatile. Forecasts of worldwide economic growth and strong global demand for crude oil at the beginning of the year transitioned to concerns about a worldwide economic slowdown and an oversupply of crude oil by the end of the year. Additionally, production from major oil producing countries, including the United States, was strong. These factors caused crude oil prices to fall rapidly in the fourth quarter of 2018. Our business strategy anticipates prices will remain cyclical and is designed to be resilient in lower price environments, with significant upside during periods of higher prices.
Our value proposition principles, namely to focus on returns, maintain financial strength, grow our dividend and pursue disciplined growth, are being executed in accordance with our priorities for allocating cash flows from the business. These priorities are: invest capital at a level that maintains flat production volumes and pays our existing dividend; grow our existing dividend; maintain debt at a level we believe is sufficient to maintain a strong investment grade credit rating through price cycles; repurchase shares to provide value to our shareholders; and invest capital to grow our cash from operations.
In 2018, we successfully delivered on our priorities. We increased our quarterly dividend by 15 percent to $0.305 per share; reduced our debt by $4.7 billion, achieving our debt reduction target 18 months ahead of plan and received credit rating upgrades from Fitch, Moody’s and Standard & Poor’s; repurchased 45 million shares of our common stock totaling $3.0 billion and received Board authorization for an incremental $9 billion of share repurchases; and added to our low cost of supply resource base, including increasing our legacy asset position in Alaska through two separate acquisitions.
Table of Contents
Portfolio optimization, debt reduction and disciplined capital investment have positioned our company to navigate through periods of volatile energy prices. In December 2018, we announced our 2019 capital budget of $6.1 billion, which is less than our 2018 capital expenditures and investments of $6.8 billion. Our 2019 capital budget is relatively flat to the prior year when excluding $0.6 billion of acquisitions made in 2018. At this level of capital, production excluding Libya is expected to be 1,300 to 1,350 thousand barrels of oil equivalent per day (MBOED) in 2019 and would exceed 2018 production excluding Libya of 1,242 MBOED. This plan anticipates cash provided by operating activities in excess of capital expenditures and investments at prices above $40 per barrel West Texas Intermediate (WTI).
Key Operating and Financial Summary
Significant items during 2018 included the following:
| • | Cash provided by operating activities was $12.9 billion and exceeded capital expenditures and investments of $6.8 billion, share repurchases of $3 billion and dividends of $1.4 billion. |
|---|
| • | The $4.4 billion of share repurchases and dividends represents 34 percent of cash provided by operating activities. |
|---|
| • | Reduced debt by $4.7 billion and achieved $15 billion debt target 18 months ahead of plan. |
|---|
| • | Received credit rating upgrades from Fitch, Moody’s and Standard & Poor’s. |
|---|
| • | Full-year production excluding Libya of 1,242 MBOED; underlying production grew 18 percent on a production per debt-adjusted share basis. |
|---|
| • | Increased full-year Lower 48 Big 3 production—Eagle Ford, Bakken and Delaware—by 37 percent. |
|---|
| • | Achieved first production from Bayu-Undan final development phase, GMT-1, Bohai Phase 3, Aasta Hansteen and Clair Ridge. |
|---|
| • | Acquired additional working interest in our legacy assets in Alaska and increased our acreage in the liquids-rich Montney play in Canada and in the early-life cycle unconventional Louisiana Austin Chalk. |
|---|
| • | Executed successful exploration program in Alaska and started drilling in Louisiana Austin Chalk. |
|---|
| • | Reached a settlement agreement with Petroleos de Venezuela, S.A. (PDVSA) to fully recover the International Chamber of Commerce (ICC) arbitration award of approximately $2 billion; recognized $430 million before-tax toward the settlement. |
|---|
| • | Generated disposition proceeds of $1.1 billion from noncore asset sales. |
|---|
| • | Year-end proved reserves of 5.3 billion barrels of oil equivalent (BOE); 147 percent total reserve replacement and 109 percent organic replacement ratio. |
|---|
Operationally, we continue to focus on safely executing our capital program and remaining diligent on our costs. Production, including Libya, of 1,283 MBOED decreased 7 percent in 2018 compared with 2017. The volume from closed dispositions was approximately 200 MBOED in 2017 and 15 MBOED in 2018. The volume from acquisitions was less than 10 MBOED in 2018. Production from Libya was 21 MBOED in 2017 and 41 MBOED in 2018. Our underlying production, which excludes the full-year impact of acquisitions, dispositions, and Libya, increased over 5 percent in 2018 compared with 2017. Underlying production on a per debt-adjusted share basis grew by 18 percent compared to 2017. Production per debt-adjusted share is calculated on an underlying production basis using ending period debt divided by ending share price plus ending shares outstanding. We believe production per debt-adjusted share is useful to investors as it provides a consistent view of production on a total equity basis by converting debt to equity and allows for comparison across peer companies.
In the second quarter of 2018, we obtained regulatory approvals and completed a transaction with Anadarko Petroleum Corporation to acquire its 22 percent nonoperated interest in the Western North Slope of Alaska, as well as its interest in the Alpine Transportation Pipeline, for $386 million, after customary adjustments. In 2018, our Alaska segment net production included 7 MBOED associated with the additional interest acquired. In addition, we now have 100 percent interest in approximately 1.2 million acres of exploration and development lands, including the Willow Discovery.
Table of Contents
In the fourth quarter of 2018, we completed a transaction with BP to acquire its nonoperated interest in the Greater Kuparuk Area and Kuparuk Transportation Company (Kuparuk Assets) in Alaska, and to sell a ConocoPhillips subsidiary to BP, which held 16.5 percent of our 24 percent interest in the BP-operated Clair Field in the United Kingdom. In 2018, our Alaska segment net production included 1 MBOED associated with the additional interest acquired in the Greater Kuparuk Area, and net production in our Europe and North Africa segment included 5 MBOED related to the disposed 16.5 percent interest in the Clair Field. We recognized a $774 million after-tax gain in the fourth quarter related to this transaction. Excluding receipt of $253 million in customary adjustments, this transaction was cash neutral.
In the fourth quarter of 2018, we completed the sale of our interests in the Barnett to Lime Rock Resources for $196 million after customary adjustments. In 2018, our Lower 48 segment net production included 8 MBOED related to the disposed interest in the Barnett, of which approximately 55 percent was natural gas and 45 percent was natural gas liquids. After-tax impairment charges of $69 million were recognized during 2018.
In the fourth quarter of 2018, we entered into an agreement to sell our 30 percent interest in the Greater Sunrise Fields to the government of Timor-Leste for $350 million, subject to customary adjustments. The transaction is conditional on the funding approval from the Timor-Leste government as well as regulatory approvals. No production or reserve impacts are associated with the sale. Proceeds from this transaction will be used for general corporate purposes. The Greater Sunrise Fields are included in our Asia Pacific and Middle East segment.
For more information regarding the accounting impacts of these transactions, see Note 5—Assets Held for Sale, Sold or Acquired and Other Planned Dispositions, in the Notes to Consolidated Financial Statements.
Also during 2018, we entered into a settlement agreement with PDVSA to recover approximately $2 billion, which reflects the full amount awarded to ConocoPhillips by an arbitral tribunal constituted under the rules of the ICC. PDVSA has agreed to recognize the ICC judgment and to make payments over the next four and a half years. During the year, we recognized in other income $417 million after-tax, consisting of $200 million in cash and the remainder in commodity inventory, the majority of which was sold by year end. For more information, see Note 4—Inventories and Note 13—Contingencies and Commitments, in the Notes to Consolidated Financial Statements.
Business Environment
Brent crude oil prices averaged over $60 per barrel in the first quarter of 2018, rising to over $70 per barrel in the second and third quarters of 2018, before falling to the $50 per barrel range at the end of the year. The energy industry has periodically experienced this type of volatility due to fluctuating supply-and-demand conditions. Commodity prices are the most significant factor impacting our profitability and related reinvestment of operating cash flows into our business. Our strategy is to create value through price cycles by delivering on the disciplined financial and operational priorities that underpin our value proposition.
Operational and Financial Factors Affecting Profitability
The focus areas we believe will drive our success through the price cycles include:
| • | Maintain a relentless focus on safety and environmental stewardship. Safety and environmental stewardship, including the operating integrity of our assets, remain our highest priorities, and we are committed to protecting the health and safety of everyone who has a role in our operations and the communities in which we operate. We strive to conduct our business with respect and care for both the local and global environment and systematically manage risk to drive sustainable business growth. Demonstrating our commitment to sustainability and environmental stewardship, on November 2017, we announced our intention to target a 5 to 15 percent reduction in our greenhouse gas emission |
|---|
Table of Contents
| intensity by 2030. Our sustainability efforts continued through 2018 with a focus on advancing our action plans for climate change, biodiversity, water and human rights. In December 2018, we became a Founding Member of the Climate Leadership Council (CLC), an international policy institute founded in collaboration with business and environmental interests to develop a carbon dividend plan. Participation in the CLC provides another opportunity for ongoing dialogue about carbon pricing and framing the issues in alignment with our public policy principles. We also belong to and fund Americans for Carbon Dividends, the education and advocacy branch of the CLC. We are committed to building a learning organization using human performance principles as we relentlessly pursue improved Health, Safety and Environment and operational performance. |
|---|
| • | Focus on financial returns. This is a core aspect of our value proposition. Our goal is to achieve strong financial returns by controlling our costs, exercising capital discipline and continually optimizing our portfolio. |
|---|
| ¡ | Control costs and expenses. Controlling operating and overhead costs, without compromising safety and environmental stewardship, is a high priority. We monitor these costs using various methodologies that are reported to senior management monthly, on both an absolute-dollar basis and a per-unit basis. Managing operating and overhead costs is critical to maintaining a competitive position in our industry, particularly in a low commodity price environment. The ability to control our operating and overhead costs impacts our ability to deliver strong cash from operations. In 2018, our production and operating expenses were relatively flat to 2017. |
|---|
| ¡ | Maintain capital discipline. We participate in a commodity price-driven and capital intensive industry, with varying lead times from when an investment decision is made to the time an asset is operational and generates cash flow. As a result, we must invest significant capital dollars to explore for new oil and gas fields, develop newly discovered fields, maintain existing fields, and construct pipelines and LNG facilities. We allocate capital across diverse, low cost of supply, programs in our resource base. Our cash allocation priorities call for the investment of sufficient capital to maintain production and pay the existing dividend. Additional allocations of capital toward growth projects will be dependent on satisfaction of other financial priorities. In setting our capital plans, we exercise a disciplined approach that evaluates projects on a cost of supply basis and is focused on value maximization and cash flow expansion. |
|---|
In December 2018, we announced a 2019 capital budget of $6.1 billion, including $3.8 billion of sustaining capital to maintain existing production levels, and $2.3 billion to grow production via short-cycle unconventional programs, future major projects and exploration activities.
| ¡ | Optimize our portfolio. We continue to optimize our asset portfolio by focusing on low cost of supply assets that support our strategy. In 2018, we continued to dispose of or market certain noncore assets and made two acquisitions in Alaska to enhance our existing legacy asset position. We will continue to evaluate our assets to determine whether they fit our strategic direction and will optimize the portfolio as necessary, directing our capital investments to areas that align with our objectives. |
|---|
| • | Maintain financial strength. We believe financial strength is critical in a cyclical business such as ours. In 2018, we reduced our debt by $4.7 billion to $15.0 billion at year end, achieving our debt reduction target 18 months ahead of plan and received credit rating upgrades from Fitch, Moody’s and Standard & Poor’s. We expect to retire outstanding debt as it matures and exercise flexibility in paying down our other debt instruments. |
|---|
| • | Return capital to shareholders. In 2018, we paid dividends on our common stock of approximately $1.4 billion and repurchased $3 billion of our common stock, representing 34 percent of our cash provided by operating activities. We believe in delivering value to our shareholders through the price cycles. As a result, we set a priority to increase our dividend rate annually and consistently repurchase shares on a dollar cost average basis. Since we initiated our current share repurchase program in late |
|---|
Table of Contents
2016, we have bought back $6 billion of shares, with $9 billion remaining on our existing authorization. Our 2018 dividends, share repurchases, and capital program were fully funded with cash provided by operating activities.
On February 1, 2018, we announced that our Board of Directors approved an increase in the quarterly dividend to $0.285 per share, compared with the previous quarterly dividend of $0.265 per share. In October 2018, we announced a dividend increase for the second time this year, an additional 7 percent, resulting in a quarterly dividend rate of $0.305 per share.
In addition to the $6 billion of shares repurchased in 2016 through the end of 2018, in July 2018 we announced the authorization of an additional $9 billion share repurchases. We expect to execute $3 billion of this $9 billion share repurchase program in 2019. Whether we undertake these additional repurchases is ultimately subject to numerous considerations, including market conditions and other factors. See Risk Factors “Our ability to declare and pay dividends and repurchase shares is subject to certain considerations.”
| • | Add to our proved reserve base. We primarily add to our proved reserve base in two ways: |
|---|
| ¡ | Successful exploration, exploitation and development of new and existing fields. |
|---|
| ¡ | Application of new technologies and processes to improve recovery from existing fields. |
|---|
Proved reserve estimates require economic production based on historical 12-month, first-of-month, average prices and current costs. Therefore, our proved reserves generally increase as prices rise and decrease as prices decline. Reserve replacement represents the net change in proved reserves, net of production, divided by our current year production, as shown in our supplemental reserve table disclosures. In 2018, our reserve replacement, which included a net increase of 0.2 billion BOE from sales and purchases, was 147 percent. Increased crude oil reserves accounted for over 90 percent of the total change in reserves. Our organic reserve replacement, which excludes the impact of sales and purchases, was 109 percent in 2018. Approximately 33 percent of organic reserve additions are from Lower 48 unconventional assets, 29 percent from Alaska and 22 percent from Asia Pacific and Middle East.
In the five years ended December 31, 2018, our reserve replacement was negative 30 percent, reflecting the impact of asset dispositions and lower prices during that period. Our organic reserve replacement during the five years ended December 31, 2018, which excludes a decrease of 2.1 billion MMBOE related to sales and purchases, was 44 percent, reflecting development activities as well as lower prices during that period.
Access to additional resources may become increasingly difficult as commodity prices can make projects uneconomic or unattractive. In addition, prohibition of direct investment in some nations, national fiscal terms, political instability, competition from national oil companies, and lack of access to high-potential areas due to environmental or other regulation may negatively impact our ability to increase our reserve base. As such, the timing and level at which we add to our reserve base may, or may not, allow us to replace our production over subsequent years.
| • | Apply technical capability. We leverage our knowledge and technology to create value and safely deliver on our plans. Technical strength is part of our heritage, and we are evolving our technical approach to optimally apply best practices. Companywide, we continue to evaluate potential solutions to leverage knowledge of technological successes across our operations. Such innovations enhance our ability to economically convert additional resources to reserves, achieve greater operating efficiencies and reduce our environmental impact. |
|---|
Table of Contents
| • | Develop and retain a talented work force. We strive to attract, train, develop and retain individuals with the knowledge and skills to implement our business strategy and who support our values and ethics. To this end, we offer university internships across multiple disciplines to attract the best talent and, as needed, recruit experienced hires to maintain a broad range of skills and experience. We promote continued learning, development and technical training through structured development programs designed to enhance the technical and functional skills of our employees. |
|---|
Other Factors Affecting Profitability
Other significant factors that can affect our profitability include:
| • | Energy commodity prices. Our earnings and operating cash flows generally correlate with industry price levels for crude oil and natural gas. Industry price levels are subject to factors external to the company and over which we have no control, including but not limited to global economic health, supply disruptions or fears thereof caused by civil unrest or military conflicts, actions taken by Organization of Petroleum Exporting Countries (OPEC), environmental laws, tax regulations, governmental policies and weather-related disruptions. The following graph depicts the average benchmark prices for WTI crude oil, Dated Brent crude oil and U.S. Henry Hub natural gas: |
|---|
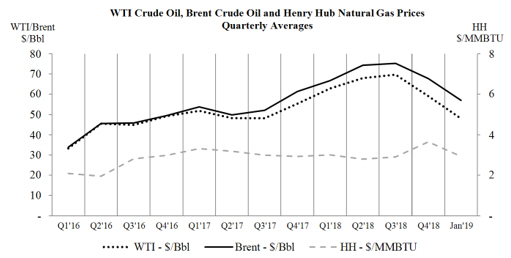
Brent crude oil prices averaged $71.04 per barrel in 2018, an increase of 31 percent compared with $54.27 per barrel in 2017. Similarly, WTI crude oil prices increased 28 percent from $50.90 per barrel in 2017 to $64.92 per barrel in the same period of 2018. Crude oil prices improved year over year due to slower growth in global oil production and robust growth in global oil demand. Oil price volatility escalated in the fourth quarter of 2018 due to geopolitics and concerns about future economic growth.
Henry Hub natural gas price averages were relatively unchanged, at $3.09 per million British thermal units (MMBTU) in 2018 compared with $3.11 per MMBTU in 2017. Despite record high natural gas production, prices remained relatively flat year over year as relatively low inventories and strong demand offset production growth.
Our realized natural gas liquids prices averaged $30.48 per barrel in 2018, an increase of 21 percent compared with $25.22 per barrel in 2017, in line with marker movements.
The Western Canada Select (WCS) differential to WTI at Hardisty weakened by $14 per barrel in 2018 relative to 2017 due to a lack of pipeline egress coupled with increasing supply from western Canada. The weaker WCS differential offset year-over-year gains in WTI, resulting in the WCS price
Table of Contents
at Hardisty remaining flat in 2018 compared with 2017 at $39 per barrel. We continue to optimize bitumen price realizations through the utilization of downstream transportation solutions and implementation of alternate blend capability which results in lower diluent costs. Our realized bitumen price was $22.29 per barrel in 2018, a decrease of 2 percent compared with $22.66 per barrel in 2017.
Our worldwide annual average realized price was $53.88 per barrel of oil equivalent (BOE) in 2018, an increase of 37 percent compared with $39.19 per BOE in 2017. The improvement reflects stronger marker prices, as well as a shift in our portfolio toward a higher mix of crude oil and less of bitumen and natural gas.
North America’s energy supply landscape has been transformed from one of resource scarcity to one of abundance. In recent years, the use of hydraulic fracturing and horizontal drilling in unconventional formations has led to increased industry actual and forecasted crude oil and natural gas production in the United States. Although providing significant short- and long-term growth opportunities for our company, the increased abundance of crude oil and natural gas due to development of unconventional plays could also have adverse financial implications to us, including: an extended period of low commodity prices; production curtailments; delay of plans to develop areas such as unconventional fields; and underutilization of LNG regasification facilities. Should one or more of these events occur, our revenues would be reduced and additional asset impairments might be possible.
| • | Impairments. We participate in a capital intensive industry. At times, our properties, plants and equipment and investments become impaired when, for example, commodity prices decline significantly for long periods of time, our reserve estimates are revised downward, or a decision to dispose of an asset leads to a write-down to its fair value. We may also invest large amounts of money in exploration which, if exploratory drilling proves unsuccessful, could lead to a material impairment of leasehold values. As we optimize our assets in the future, it is reasonably possible we may incur future losses upon sale or impairment charges to long-lived assets used in operations, investments in nonconsolidated entities accounted for under the equity method, and unproved properties. For additional information on our impairments in 2018, 2017 and 2016, see Note 9—Impairments, in the Notes to Consolidated Financial Statements. |
|---|
| • | Effective tax rate. Our operations are located in countries with different tax rates and fiscal structures. Accordingly, even in a stable commodity price and fiscal/regulatory environment, our overall effective tax rate can vary significantly between periods based on the “mix” of before-tax earnings within our global operations. |
|---|
| • | Fiscal and regulatory environment. Our operations can be affected by changing economic, regulatory and political environments in the various countries in which we operate, including the United States. Civil unrest or strained relationships with governments may impact our operations or investments. These changing environments could negatively impact our results of operations, and further changes to increase government fiscal take could have a negative impact on future operations. Our assets in Venezuela were expropriated in 2007. Our production operations in Libya and related oil exports were suspended or significantly curtailed periodically over the last several years due to the closure of the Es Sider crude oil export terminal. In 2016, the U.K. government enacted tax legislation which reduced our U.K. corporate tax rate by 10 percent. |
|---|
We applied the guidance in Staff Accounting Bulletin (SAB) 118 when accounting for the enactment-date effects of the Tax Cuts and Jobs Act (Tax Legislation) in 2017 and throughout 2018. At December 31, 2017, our assessment was ongoing for the enactment-date income tax effects of the Tax Legislation under Financial Accounting Standards Board (FASB) Accounting Standards Codification (ASC) Topic 740, “Income Taxes,” for the following aspects: remeasurement of deferred tax assets and liabilities, one-time transition tax, and tax on global intangible low-taxed income. As of
Table of Contents
December 31, 2018, we have now completed our assessment of the enactment-date income tax effects of the Tax Legislation. During 2018, we recognized adjustments of $10 million to the provisional tax benefit amount of $852 million recorded at December 31, 2017, and included these adjustments as a component of income tax expense. While we still anticipate the Tax Legislation will provide a positive impact to our U.S. operations in the future primarily because of the reduced U.S. federal statutory rate, we do not expect to realize cash tax benefits from the Tax Legislation until we move into a U.S. tax paying position. For additional information, see Note 19—Income Taxes, in the Notes to Consolidated Financial Statements.
Our management carefully considers the fiscal and regulatory environment when evaluating projects or determining the levels and locations of our activity.
Outlook
First-quarter 2019 production is expected to be 1,290 to 1,330 MBOED, reflecting the impacts of a planned turnaround in Qatar of approximately 15 MBOED and government-mandated production curtailment in Canada of approximately 10 MBOED. Production is expected to ramp up in the second half of the year, with full-year 2019 production expected to be 1,300 to 1,350 MBOED. Production guidance for 2019 excludes Libya.
Operating Segments
We manage our operations through six operating segments, which are primarily defined by geographic region: Alaska, Lower 48, Canada, Europe and North Africa, Asia Pacific and Middle East, and Other International.
Corporate and Other represents costs not directly associated with an operating segment, such as most interest expense, premiums incurred on the early retirement of debt, corporate overhead, certain technology activities, as well as licensing revenues received.
Our key performance indicators, shown in the statistical tables provided at the beginning of the operating segment sections that follow, reflect results from our operations, including commodity prices and production.
Table of Contents
RESULTS OF OPERATIONS
Consolidated Results
A summary of the company’s net income (loss) attributable to ConocoPhillips by business segment follows:
| Millions of Dollars | ||||||||||||
| Years Ended December 31 | 2018 | 2017 | 2016 | |||||||||
| Alaska | $ | 1,814 | 1,466 | 319 | ||||||||
| Lower 48 | 1,747 | (2,371 | ) | (2,257 | ) | |||||||
| Canada | 63 | 2,564 | (935 | ) | ||||||||
| Europe and North Africa | 1,866 | 553 | 394 | |||||||||
| Asia Pacific and Middle East | 2,070 | (1,098 | ) | 209 | ||||||||
| Other International | 364 | 167 | (16 | ) | ||||||||
| Corporate and Other | (1,667 | ) | (2,136 | ) | (1,329 | ) | ||||||
| Net income (loss) attributable to ConocoPhillips | $ | 6,257 | (855 | ) | (3,615 | ) | ||||||
2018 vs. 2017
Net income attributable to ConocoPhillips increased $7,112 million in 2018. The increase was mainly due to:
| • | Higher realized commodity prices on a more liquids-weighted portfolio. |
|---|
| • | The absence of a combined $2.5 billion after-tax impairment related to the sale of our interests in the San Juan Basin and the marketing of our Barnett asset, recognized in the second quarter of 2017. |
|---|
| • | The absence of a $2.4 billion before- and after-tax impairment of our equity investment in Australia Pacific LNG Pty Ltd (APLNG), recognized in the second quarter of 2017. |
|---|
| • | Recognition of $774 million after-tax gain on the Clair disposition in the United Kingdom, in the fourth quarter of 2018. |
|---|
| • | Lower depreciation, depletion and amortization (DD&A) expense, mainly due to lower unit-of-production rates from reserve revisions and disposition impacts. |
|---|
| • | Recognition of $417 million after-tax in other income from a settlement agreement with PDVSA in 2018. |
|---|
| • | Lower exploration expenses, primarily due to the absence of first quarter 2017 charges in our Lower 48 and Other International segments. |
|---|
| • | Lower interest and debt expense because of a lower debt balance. |
|---|
| • | Higher equity earnings in Qatar Liquefied Gas Company Limited (3) (QG3) and APLNG, primarily due to higher realized LNG prices, partly offset by the absence of volumes in 2018 related to the disposition of our interest in the FCCL Partnership in Canada in 2017. |
|---|
These increases in net income were partly offset by:
| • | The absence of $1.6 billion in after-tax gains related to the sale of certain Canadian assets in 2017. |
|---|
| • | The absence of a $996 million deferred tax benefit related to the disposition of certain Canadian assets, recognized in the first quarter of 2017. |
|---|
| • | The absence of deferred tax benefits totaling $852 million related to the Tax Legislation enacted on December 22, 2017. |
|---|
| • | An unrealized loss of $437 million on our Cenovus Energy common shares in 2018. |
|---|
| • | The absence of a $337 million after-tax award, including interest, from an arbitration settlement with The Republic of Ecuador in 2017. |
|---|
Table of Contents
2017 vs. 2016
Loss attributable to ConocoPhillips decreased $2,760 million in 2017. The decrease was mainly due to:
| • | Higher commodity prices. |
|---|
| • | Lower DD&A expense, mainly due to lower unit-of-production rates from reserve revisions and disposition impacts. |
|---|
| • | Higher gains on dispositions, primarily due to a $1.6 billion after-tax gain in 2017 on the sale of certain Canadian assets. |
|---|
| • | Recognition of deferred tax benefits totaling $996 million, primarily related to the disposition of certain Canadian assets. |
|---|
| • | Recognition of deferred tax benefits totaling $852 million related to the Tax Legislation enacted on December 22, 2017. |
|---|
| • | Improved equity earnings, mainly due to higher realized prices, lower DD&A from asset disposition impacts, and the absence of a 2016 deferred tax charge of $174 million resulting from the change of the tax functional currency for APLNG to the U.S. dollar. These increases were partly offset by lower volumes from the disposition of our interest in the FCCL Partnership. |
|---|
| • | Lower exploration expenses mainly due to reduced leasehold impairment expense, dry hole costs and other exploration expenses. |
|---|
| • | A $337 million after-tax award, including interest, from an arbitration settlement with The Republic of Ecuador. |
|---|
| • | Lower production and operating expenses, primarily due to asset disposition impacts. |
|---|
| • | Lower net interest expense, primarily due to impacts from the fair market value method of apportioning interest expense in the United States and reduced debt. |
|---|
The reduction in loss was partly offset by:
| • | Higher proved property and equity investment impairments, including a combined $2.5 billion after-tax impairment related to the sale of our interests in the San Juan Basin and the marketing of the Barnett, as well as a $2.4 billion before- and after-tax impairment of our equity investment in APLNG. |
|---|
| • | Lower volumes primarily due to asset dispositions in our Lower 48, Asia Pacific and Middle East, and Canada segments, as well as normal field decline. |
|---|
| • | A $238 million after-tax charge associated with our early retirements of debt in 2017. |
|---|
Income Statement Analysis
2018 vs. 2017
Sales and other operating revenues increased 25 percent in 2018, due to higher realized commodity prices, mainly crude oil, on a portfolio with a higher mix of crude oil and less of bitumen and natural gas. Partly offsetting this increase, were lower natural gas volumes sold due to 2017 dispositions in the Lower 48 and Canada.
Equity in earnings of affiliates increased $302 million in 2018. The increase in equity earnings was primarily due to higher earnings from QG3 and APLNG as a result of higher LNG prices for both affiliates and higher oil prices in QG3. Partly offsetting this increase, was the absence of equity in earnings resulting from the disposition of our investment in the FCCL Partnership in 2017.
Gain on dispositions decreased $1,114 million in 2018. The decrease was primarily due to the absence of a $2.1 billion before-tax gain on the sale of certain Canadian assets recognized in 2017, partly offset by a $715 million before-tax gain recognized in the fourth quarter of 2018 on the sale of a ConocoPhillips subsidiary to BP, which held 16.5 percent of our 24 percent interest in the BP-operated Clair Field in the United Kingdom. For additional information concerning gain on dispositions, see Note 5—Assets Held for Sale, Sold or Acquired and Other Planned Dispositions, in the Notes to Consolidated Financial Statements.
Table of Contents
Other income decreased $356 million in 2018, mainly due to a $437 million unrealized loss on our Cenovus Energy common shares in 2018 and the absence of a $337 million arbitration settlement, including interest, with The Republic of Ecuador in 2017. Partly offsetting the decrease, was $430 million before-tax from a settlement agreement with PDVSA in 2018.
For discussion of our Cenovus Energy shares, see Note 7—Investment in Cenovus Energy, in the Notes to Consolidated Financial Statements. For discussion of our Ecuador and PDVSA settlements, see Note 13—Contingencies and Commitments, in the Notes to Consolidated Financial Statements.
Purchased commodities increased 15 percent in 2018, mainly due to higher crude oil volumes purchased and higher crude oil prices.
Production and operating expenses increased 1 percent in 2018, primarily due to costs associated with higher underlying production volumes as well as higher maintenance and wellwork, largely offset by the absence of costs resulting from 2017 dispositions in our Canada and Lower 48 segments.
Exploration expenses decreased $565 million in 2018, primarily as a result of lower dry hole costs, leasehold impairment expense and other exploration expenses.
Dry hole costs were reduced primarily due to the absence of before-tax charges of $288 million for multiple Shenandoah wells in the deepwater Gulf of Mexico, including wells previously suspended. These charges were reflected in our Lower 48 segment during 2017.
Leasehold impairment expense was reduced mainly due to the absence of before-tax charges of $51 million for Shenandoah and $38 million for certain Lower 48 mineral assets, both recognized in 2017.
Other exploration expenses were reduced mainly due to the absence of a $43 million before-tax charge for the cancellation of our Athena drilling rig contract and other rig stacking costs in our Other International segment in 2017.
For additional information on leasehold impairments and other exploration expenses, see Note 8—Suspended Wells and Other Exploration Expenses, and Note 9—Impairments, in the Notes to Consolidated Financial Statements.
DD&A decreased $889 million in 2018, mainly due to lower unit-of-production rates from positive reserve revisions and impacts from the 2017 dispositions in our Canada and Lower 48 segments, partly offset by increased underlying production volumes.
Impairments decreased $6.6 billion in 2018, mainly due to the absence of 2017 impairments of $3.9 billion before-tax related to our former interests in the San Juan Basin and the Barnett, both in our Lower 48 segment, as well as a $2.4 billion before- and after-tax impairment of our equity investment in APLNG. For additional information, see Note 6—Investments, Loans and Long-Term Receivables and Note 9—Impairments, in the Notes to Consolidated Financial Statements.
Taxes other than income taxes increased $239 million in 2018, primarily due to higher production taxes in Alaska and the Lower 48 corresponding with higher realized commodity prices.
Interest and debt expense decreased $363 million in 2018, primarily due to lower debt balances.
See Note 19—Income Taxes, in the Notes to Consolidated Financial Statements, for information regarding our income tax provision (benefit) and effective tax rate.
Table of Contents
2017 vs. 2016
Sales and other operating revenues increased 23 percent in 2017, mainly due to higher realized prices across all commodities, partly offset by lower sales volumes, primarily in our Lower 48, Asia Pacific and Middle East, and Canada segments as a result of dispositions.
Equity in earnings of affiliates increased $720 million in 2017. The increase in equity earnings was primarily due to higher realized commodity prices at QG3, APLNG and FCCL; the absence of a 2016 deferred tax charge of $174 million resulting from a tax functional currency change; and reduced costs mainly from the disposition of our interest in the FCCL Partnership. The increase in earnings was partly offset by lower volumes as a result of our FCCL disposition.
Gain on dispositions increased $1.8 billion in 2017. The increase was primarily due to a before-tax gain of $2.1 billion on the sale of our 50 percent nonoperated interest in the FCCL Partnership, as well as the majority of our western Canada gas assets. For additional information on gains on dispositions, see Note 5—Assets Held for Sale, Sold or Acquired and Other Planned Dispositions, in the Notes to Consolidated Financial Statements.
Other income increased $274 million in 2017, mainly due to a $337 million before- and after-tax arbitration award from The Republic of Ecuador. The increase was partly offset by the absence of a gain of $88 million from our receipt of mineral properties and active leases from the Greater Northern Iron Ore Properties Trust and a $76 million before-tax damage claim settlement, both in our Lower 48 segment in 2016.
Purchased commodities increased 25 percent in 2017, mainly due to higher commodity prices and increased activity.
Selling, general and administrative expenses decreased 10 percent in 2017, primarily due to reduced restructuring expenses, lower headcount and reduced activity.
Exploration expenses decreased 51 percent in 2017, primarily as a result of lower leasehold impairment expense, dry hole costs and other exploration expenses.
Leasehold impairment expense was reduced mainly due to the absence of 2016 before-tax charges of $203 million for our Gibson and Tiber leaseholds. The expense was further reduced by the absence of before-tax charges of $95 million for our Melmar leasehold and $79 million for various Gulf of Mexico leases after completion of marketing efforts. The reduction was partly offset by a before-tax charge of $51 million for Shenandoah in deepwater Gulf of Mexico and a before-tax charge of $38 million for certain mineral assets in our Lower 48 segment, both in 2017.
Dry hole costs were reduced primarily due to the absence of 2016 before-tax charges in deepwater Gulf of Mexico of $249 million for our Gibson and Tiber wells, and $128 million for our Melmar well. The absence of a $256 million before-tax charge in 2016 for two dry holes in Nova Scotia further reduced costs. The reduction in dry hole costs was partly offset by 2017 before-tax charges of $288 million for multiple wells in Shenandoah, including wells previously suspended, and $63 million for several wells in the Powder River Basin.
Other exploration expenses were reduced mainly due to the absence of a $146 million before-tax expense in 2016 related to the cancellation of our final Gulf of Mexico deepwater drillship contract, as well as lower rig stacking costs in Angola. The decrease in expense was partly offset by a $43 million net before-tax charge in 2017 for the settlement of our drilling rig contract in Angola.
For additional information on leasehold impairments and other exploration expenses, see Note 8—Suspended Wells and Other Exploration Expenses, and Note 9—Impairments, in the Notes to Consolidated Financial Statements.
Table of Contents
DD&A decreased 24 percent in 2017, mainly due to lower unit-of-production rates from reserve revisions and disposition impacts in our Canada and Lower 48 segments.
Impairments increased $6.5 billion in 2017. For additional information, see Note 9—Impairments, in the Notes to Consolidated Financial Statements.
Interest and debt expense decreased 12 percent in 2017, primarily due to impacts from the fair market value method of apportioning interest expense in the United States and reduced debt balances.
Other expenses included before-tax charges of $302 million in 2017 for premiums on early debt retirements.
See Note 19—Income Taxes, in the Notes to Consolidated Financial Statements, for information regarding our income tax provision (benefit) and effective tax rate.
Summary Operating Statistics
| 2018 | 2017 | 2016 | ||||||||||
| Average Net Production | ||||||||||||
| Crude oil (MBD)(1) | 653 | 599 | 598 | |||||||||
| Natural gas liquids (MBD) | 102 | 111 | 145 | |||||||||
| Bitumen (MBD) | 66 | 122 | 183 | |||||||||
| Natural gas (MMCFD)(2) | 2,774 | 3,270 | 3,857 | |||||||||
| Total Production (MBOED)(3) | 1,283 | 1,377 | 1,569 | |||||||||
| Dollars Per Unit | ||||||||||||
| Average Sales Prices | ||||||||||||
| Crude oil (per barrel) | $ | 68.13 | 51.96 | 40.86 | ||||||||
| Natural gas liquids (per barrel) | 30.48 | 25.22 | 16.68 | |||||||||
| Bitumen (per barrel) | 22.29 | 22.66 | 15.27 | |||||||||
| Natural gas (per thousand cubic feet) | 5.65 | 4.07 | 3.00 | |||||||||
| Millions of Dollars | ||||||||||||
| Worldwide Exploration Expenses | ||||||||||||
| General and administrative; geological and geophysical, lease rental, and other(4) | $ | 274 | 368 | 728 | ||||||||
| Leasehold impairment | 56 | 136 | 466 | |||||||||
| Dry holes | 39 | 430 | 718 | |||||||||
| $ | 369 | 934 | 1,912 | |||||||||
(1)Thousands of barrels per day.
(2)Millions of cubic feet per day. Represents quantities available for sale and excludes gas equivalent of natural gas liquids included above.
(3)Thousands of barrels of oil equivalent per day.
(4)Certain prior period amounts in 2017 and 2016 have been reclassified to conform to the current-period presentation resulting from the adoption of ASU No. 2017-07.
See Note 2—Changes in Accounting Principles, in the Notes to Consolidated Financial Statements, for additional information.
We explore for, produce, transport and market crude oil, bitumen, natural gas, LNG and natural gas liquids on a worldwide basis. At December 31, 2018, our operations were producing in the United States, Norway, the United Kingdom, Canada, Australia, Timor-Leste, Indonesia, China, Malaysia, Qatar and Libya.
Table of Contents
2018 vs. 2017
Total production, including Libya, of 1,283 MBOED decreased 7 percent in 2018 compared with 2017, primarily due to:
| • | Disposition impacts from asset sales in Canada and the Lower 48 in 2017. |
|---|
| • | Normal field decline. |
|---|
| • | Higher unplanned downtime, including a third-party pipeline outage in Malaysia in 2018. |
|---|
The decrease in production during 2018 was partly offset by:
| • | New wells online, primarily from tight oil plays in the Lower 48 and Malikai in Malaysia. |
|---|
| • | Improved drilling and well performance in Alaska, Norway, Lower 48 and China. |
|---|
| • | The continued rampup in Libya. |
|---|
Production excluding Libya was 1,242 MBOED in 2018 compared with 1,356 MBOED in 2017. The volume from closed dispositions was approximately 200 MBOED in 2017 and 15 MBOED in 2018. The volume from acquisitions was less than 10 MBOED in 2018. Our underlying production, which excludes the full-year impact of acquisitions, dispositions, and Libya, increased over 5 percent in 2018 compared with 2017.
2017 vs. 2016
Total production, including Libya, of 1,377 MBOED decreased 12 percent in 2017 compared with 2016, primarily due to:
| • | Reductions from noncore asset dispositions, including Canada and the Lower 48 in 2017 and the sale of our interest in the Block B production sharing contract in Indonesia in 2016. |
|---|
| • | Normal field decline. |
|---|
The decrease in production during 2017 was partly offset by:
| • | Production from major developments, including tight oil plays in the Lower 48; Malikai and the Kebabangan gas field in Malaysia; Surmont in Canada; and APLNG in Australia. |
|---|
| • | Improved drilling and well performance in Alaska, Norway and China. |
|---|
Excluding Libya, our 2017 production was 1,356 MBOED. Adjusted for the impact of closed and planned dispositions of 191 MBOED in 2017 and 434 MBOED in 2016 and Libya, our underlying production increased 32 MBOED, or 3 percent, compared with 2016.
Table of Contents
Alaska
| 2018 | 2017 | 2016 | ||||||||||
| Net Income Attributable to ConocoPhillips (millions of dollars) | $ | 1,814 | 1,466 | 319 | ||||||||
| Average Net Production | ||||||||||||
| Crude oil (MBD) | 171 | 167 | 163 | |||||||||
| Natural gas liquids (MBD) | 14 | 14 | 12 | |||||||||
| Natural gas (MMCFD) | 6 | 7 | 25 | |||||||||
| Total Production (MBOED) | 186 | 182 | 179 | |||||||||
| Average Sales Prices | ||||||||||||
| Crude oil (per barrel) | $ | 70.86 | 53.33 | 41.93 | ||||||||
| Natural gas (per thousand cubic feet) | 2.48 | 2.72 | 5.22 | |||||||||
The Alaska segment primarily explores for, produces, transports and markets crude oil, natural gas liquids and natural gas. In 2018, Alaska contributed 23 percent of our worldwide liquids production and less than 1 percent of our natural gas production.
2018 vs. 2017
Alaska reported earnings of $1,814 million in 2018, compared with earnings of $1,466 million in 2017. The increase in earnings was mainly due to higher realized crude oil prices. Additionally, earnings were improved due to the absence of a $110 million after-tax impairment related to our small interest in the Point Thomson Unit, recognized in the first quarter of 2017; a $98 million reduction in tax valuation allowance, recognized in the fourth quarter of 2018; lower DD&A expense from reserve additions; and a $79 million after-tax benefit resulting from an accrual reduction due to a transportation cost ruling by the Federal Energy Regulatory Commission (FERC), recorded in the first quarter of 2018. Partly offsetting these increases in earnings, was the absence of an $892 million tax benefit from the revaluation of allocated U.S. deferred taxes at a lower federal statutory rate, in accordance with the Tax Legislation enacted in 2017.
Average production increased 2 percent in 2018 compared with 2017, primarily due to improved drilling and well performance, 8 MBOED from acquisitions in the Western North Slope and the Greater Kuparuk Area, and the startup of GMT-1 in the fourth quarter of 2018, partly offset by normal field decline.
Acquisitions
During the second quarter of 2018, we obtained regulatory approvals and completed a transaction with Anadarko Petroleum Corporation to acquire its 22 percent nonoperated interest in the Western North Slope of Alaska, as well as its interest in the Alpine Transportation Pipeline, for $386 million, after customary adjustments. In 2018, our Alaska segment net production included 7 MBOED associated with the additional interest acquired. In addition, we now have 100 percent interest in approximately 1.2 million acres of exploration and development lands, including the Willow Discovery.
In December of 2018, we completed a transaction with BP to acquire their nonoperated interest in the Kuparuk Assets in Alaska, and to sell a ConocoPhillips subsidiary to BP, which held 16.5 percent of our 24 percent interest in the BP-operated Clair Field in the United Kingdom. In 2018, our Alaska segment net production included 1 MBOED related to the additional interest acquired in the Greater Kuparuk Area. See Note 5—Assets Held for Sale, Sold or Acquired and Other Planned Dispositions in the Notes to Consolidated Financial Statements, for additional information.
Table of Contents
2017 vs. 2016
Alaska reported earnings of $1,466 million in 2017, compared with earnings of $319 million in 2016. The increase in earnings was mainly due to an $892 million tax benefit from the revaluation of allocated U.S. deferred taxes at a lower federal statutory rate, in accordance with the Tax Legislation. Earnings were additionally improved due to higher crude oil prices in 2017. The earnings increase was partly offset by a $110 million after-tax impairment charge for the associated properties, plants and equipment of our small interest in the Point Thomson unit.
Average production increased 2 percent in 2017 compared with 2016, as the impact of normal field decline was more than offset by well performance in the Western North Slope, Greater Prudhoe and Greater Kuparuk areas and lower unplanned downtime.
Lower 48
| 2018 | 2017 | 2016 | ||||||||||
| Net Income (Loss) Attributable to ConocoPhillips (millions of dollars) | $ | 1,747 | (2,371 | ) | (2,257 | ) | ||||||
| Average Net Production | ||||||||||||
| Crude oil (MBD) | 229 | 180 | 195 | |||||||||
| Natural gas liquids (MBD) | 69 | 69 | 88 | |||||||||
| Natural gas (MMCFD) | 596 | 898 | 1,219 | |||||||||
| Total Production (MBOED) | 397 | 399 | 486 | |||||||||
| Average Sales Prices | ||||||||||||
| Crude oil (per barrel) | $ | 62.99 | 47.36 | 37.49 | ||||||||
| Natural gas liquids (per barrel) | 27.30 | 22.20 | 14.34 | |||||||||
| Natural gas (per thousand cubic feet) | 2.82 | 2.73 | 2.20 | |||||||||
The Lower 48 segment consists of operations located in the contiguous United States and the Gulf of Mexico. During 2018, the Lower 48 contributed 36 percent of our worldwide liquids production and 21 percent of our natural gas production.
2018 vs. 2017
Lower 48 reported earnings of $1,747 million in 2018, compared with a net loss of $2,371 million in 2017. Earnings increased primarily due to the absence of a combined $2.5 billion after-tax impairment related to the sale of our interests in the San Juan Basin and the marketing of our Barnett asset, recognized in the second quarter of 2017; higher realized crude oil and NGL prices; higher crude oil sales volumes; lower DD&A expense, primarily due to reserve additions and asset disposition impacts, partly offset by higher underlying volumes; lower exploration expenses and higher gain on dispositions related to noncore asset sales. The increase in earnings was partly offset by lower natural gas sales volumes, primarily due to the disposition of our interests in the San Juan Basin in 2017.
In 2018, our average realized crude oil price of $62.99 per barrel was 3 percent less than WTI of $64.92 per barrel. The differential was driven primarily by local market dynamics in the Gulf Coast, Bakken and Permian Basin.
Table of Contents
Total average production decreased 1 percent in 2018 compared with 2017. The decrease was mainly attributable to normal field decline and disposition impacts related to interests sold in the San Juan Basin and other noncore assets. Adjusted for the impact of dispositions of 82 MBOED in 2017, underlying production increased approximately 25 percent in 2018 compared with 2017, primarily due to new production from unconventional assets in the Eagle Ford, Bakken and Permian Basin.
Asset Dispositions and Other Planned Disposition
In the first quarter of 2018, we completed the sale of certain properties in the Lower 48 segment for net proceeds of $112 million. No gain or loss was recognized on the sale. In the second quarter of 2018, we completed the sale of a package of largely undeveloped acreage for net proceeds of $105 million. No gain or loss was recognized on the sale. In the third quarter of 2018, we completed a noncash exchange of undeveloped acreage in the Lower 48 segment. This transaction was recorded at fair value resulting in the recognition of a $44 million after-tax gain. In the fourth quarter of 2018, we sold several packages of undeveloped acreage in the Lower 48 segment for total net proceeds of $162 million and recognized gains of approximately $140 million.
In the fourth quarter of 2018, we completed the sale of our interests in the Barnett to Lime Rock Resources for $196 million after customary adjustments. Production associated with the Barnett averaged 8 MBOED in 2018, of which approximately 55 percent was natural gas and 45 percent was natural gas liquids. After-tax impairment charges of $69 million were recognized during 2018.
In January 2019, we entered into agreements to sell our 12.4 percent ownership interests in Golden Pass LNG Terminal and Golden Pass Pipeline located adjacent to the Sabine-Neches Industrial Ship Channel northwest of Sabine Pass, Texas. The terminal and pipeline capacity was held for receipt, storage and regasification of LNG purchased from QG3. As a result of entering into these agreements, we expect to recognize a loss of approximately $60 million in the first quarter of 2019. We have also entered into agreements to amend our contractual obligations for remaining use of the facilities. Completion of the sale is subject to regulatory approval.
See Note 5—Assets Held for Sale, Sold or Acquired and Other Planned Dispositions in the Notes to Consolidated Financial Statements, for additional information.
Acquisition
We began acquiring early life-cycle acreage in the Austin Chalk in the fourth quarter of 2017 and have accumulated approximately 225,000 net acres at less than $1,000 per acre. We spud our first Austin Chalk well in late 2018 and plan to drill additional wells in 2019.
2017 vs. 2016
Lower 48 reported a loss of $2,371 million after-tax in 2017, compared with a loss of $2,257 million after-tax in 2016. The increase in loss was primarily due to proved property impairments in 2017, totaling $2.5 billion after-tax, for our interests in the San Juan Basin and the Barnett which were written down to fair value less costs to sell. Lower natural gas, crude oil and natural gas liquids sales volumes from asset dispositions and normal field decline further increased losses during the year.
Table of Contents
The increase in losses was partly offset by:
| • | Lower DD&A expense, mainly resulting from a lower unit-of-production rate from reserve revisions, disposition impacts and lower volumes. |
|---|
| • | A $689 million tax benefit, primarily related to the revaluation of allocated U.S. deferred taxes at a lower federal statutory rate, in accordance with the Tax Legislation enacted in 2017. |
|---|
| • | Higher realized crude oil, natural gas liquids and natural gas prices. |
|---|
| • | Lower exploration expenses mainly due to: |
|---|
| ¡ | Lower leasehold impairment expense, primarily the absence of 2016 after-tax charges of $132 million for our Gibson and Tiber leaseholds; $62 million for our Melmar leasehold and $52 million for various Gulf of Mexico leases after completion of marketing efforts. The reduction was partly offset by an after-tax charge of $33 million for Shenandoah in deepwater Gulf of Mexico and an after-tax charge of $24 million for certain mineral assets, both in 2017. |
|---|
| ¡ | Lower other exploration expenses, mainly due to the absence of a $95 million after-tax expense in 2016 related to the cancellation of our final Gulf of Mexico deepwater drillship contract. |
|---|
| ¡ | Lower dry hole costs primarily due to the absence of 2016 after-tax charges in deepwater Gulf of Mexico of $162 million for our Gibson and Tiber wells, and $83 million for our Melmar well, partly offset by 2017 after-tax charges of $187 million for multiple wells in Shenandoah and $41 million for several wells in the Powder River Basin. |
|---|
In 2017, our average realized crude oil price of $47.36 per barrel was 7 percent less than WTI of $50.90 per barrel. The differential is driven primarily by local market dynamics in the Gulf Coast and Bakken.
Total average production decreased 18 percent in 2017 compared with 2016. The decrease was mainly attributable to normal field decline and the disposition of our interests in the San Juan Basin, partly offset by new production, primarily from Eagle Ford and Bakken.
Asset Dispositions
On July 31, 2017, we completed the sale of our interests in the San Juan Basin for total proceeds comprised of $2.5 billion in cash after customary adjustments and a contingent payment of up to $300 million. The six-year contingent payment, effective beginning January 1, 2018, is due annually for the periods in which the monthly U.S. Henry Hub price is at or above $3.20 per million British thermal units. During 2018, we recorded gains on dispositions for these contingent payments of $28 million.
On September 29, 2017, we completed the sale of our interest in the Panhandle assets for $178 million in cash after customary adjustments.
See Note 5—Assets Held for Sale, Sold or Acquired and Other Planned Dispositions in the Notes to Consolidated Financial Statements, for additional information.
Table of Contents
Canada
| 2018 | 2017 | 2016 | ||||||||||
| Net Income (Loss) Attributable to ConocoPhillips (millions of dollars) | $ | 63 | 2,564 | (935 | ) | |||||||
| Average Net Production | ||||||||||||
| Crude oil (MBD) | 1 | 3 | 7 | |||||||||
| Natural gas liquids (MBD) | 1 | 9 | 23 | |||||||||
| Bitumen (MBD) | ||||||||||||
| Consolidated operations | 66 | 59 | 35 | |||||||||
| Equity affiliates | - | 63 | 148 | |||||||||
| Total bitumen | 66 | 122 | 183 | |||||||||
| Natural gas (MMCFD) | 12 | 187 | 524 | |||||||||
| Total Production (MBOED) | 70 | 165 | 300 | |||||||||
| Average Sales Prices | ||||||||||||
| Crude oil (per barrel) | $ | 48.73 | 43.69 | 35.25 | ||||||||
| Natural gas liquids (per barrel) | 43.70 | 21.51 | 14.82 | |||||||||
| Bitumen (dollars per barrel)* | ||||||||||||
| Consolidated operations | 22.29 | 21.43 | 12.91 | |||||||||
| Equity affiliates | - | 23.83 | 15.80 | |||||||||
| Total bitumen | 22.29 | 22.66 | 15.27 | |||||||||
| Natural gas (per thousand cubic feet) | 1.00 | 1.93 | 1.49 | |||||||||
*Average prices for sales of bitumen produced during 2018 excludes additional value realized from the purchase and sale of third-party volumes for optimization of our pipeline capacity between Canada and the U.S. Gulf Coast.
Our Canadian operations mainly consist of an oil sands development in the Athabasca region of northeastern Alberta and a liquids-rich unconventional play in western Canada. In 2018, Canada contributed 8 percent of our worldwide liquids production and less than one percent of our worldwide natural gas production.
2018 vs. 2017
Canada operations reported earnings of $63 million in 2018 compared with $2,564 million in 2017. The decrease was mainly due to the absence of a $1.6 billion after-tax gain on the sale of our interest in the FCCL Partnership and western Canada gas assets and an associated $1.0 billion deferred tax benefit, and equity earnings in the FCCL Partnership. For additional information on the Canada disposition, see Note 5—Assets Held for Sale, Sold or Acquired and Other Planned Dispositions and Note 7—Investment in Cenovus Energy, in the Notes to Consolidated Financial Statements.
Total average production decreased 95 MBOED in 2018 compared with 2017. The production decrease was primarily due to our 2017 Canada disposition, partly offset by strong well performance at Surmont.
Acquisition
In February 2018, we acquired approximately 34,500 net acres of undeveloped land in the Montney for a net purchase price of approximately $120 million. The additional acreage is adjacent to our existing position in the liquids-rich portion of the Montney.
Table of Contents
2017 vs. 2016
Canada operations reported earnings of $2,564 million in 2017, an increase of $3,499 million compared with 2016. The earnings increase was mainly due to an after-tax gain of $1.6 billion on the sale of certain Canadian assets, further discussed below, as well as the recognition of $1.0 billion in deferred tax benefits related to the capital gains component of our disposition and the recognition of previously unrealizable Canadian tax basis.
In addition to the items discussed above, earnings were further increased due to:
| • | Lower DD&A, mainly from disposition impacts. |
|---|
| • | Lower dry hole costs, mainly due to the absence of 2016 combined after-tax charges in offshore Nova Scotia of $187 million for our Cheshire and Monterey Jack wells. |
|---|
| • | Higher realized prices across all commodities. |
|---|
| • | A $114 million tax benefit related to our prior decision to exit Nova Scotia deepwater exploration. |
|---|
| • | Lower production and operating expenses. |
|---|
| • | Improved equity earnings, as improved prices and reduced DD&A more than offset the volume loss from our Canada disposition. |
|---|
The earnings increase was partly offset by additional volume reductions from the disposition of our western Canada gas assets.
Total average production decreased 45 percent in 2017 compared with 2016. The production decrease was primarily due to the Canada disposition, partly offset by production rampup at Surmont.
Asset Disposition
On May 17, 2017, we completed the sale of our 50 percent nonoperated interest in the FCCL Partnership, as well as the majority of our western Canada gas assets to Cenovus Energy. Consideration for the transaction was $11.0 billion in cash after customary adjustments, 208 million Cenovus Energy common shares and a five-year uncapped contingent payment. The contingent payment, calculated and paid on a quarterly basis, is $6 million Canadian dollars (CAD) for every $1 CAD by which the WCS quarterly average crude price exceeds $52 CAD per barrel. During 2018, we recorded gains on dispositions for these contingent payments of $95 million. See Note 5—Assets Held for Sale, Sold or Acquired and Other Planned Dispositions in the Notes to Consolidated Financial Statements, for additional information.
Europe and North Africa
| 2018 | 2017 | 2016 | ||||||||||
| Net Income Attributable to ConocoPhillips (millions of dollars) | $ | 1,866 | 553 | 394 | ||||||||
| Average Net Production | ||||||||||||
| Crude oil (MBD) | 149 | 142 | 122 | |||||||||
| Natural gas liquids (MBD) | 8 | 8 | 7 | |||||||||
| Natural gas (MMCFD) | 503 | 484 | 460 | |||||||||
| Total Production (MBOED) | 241 | 230 | 205 | |||||||||
| Average Sales Prices | ||||||||||||
| Crude oil (dollars per barrel) | $ | 70.71 | 54.21 | 43.66 | ||||||||
| Natural gas liquids (per barrel) | 36.87 | 34.07 | 22.62 | |||||||||
| Natural gas (per thousand cubic feet) | 7.65 | 5.70 | 4.71 | |||||||||
Table of Contents
The Europe and North Africa segment consists of operations principally located in the Norwegian and U.K. sectors of the North Sea, the Norwegian Sea and Libya. In 2018, our Europe and North Africa operations contributed 19 percent of our worldwide liquids production and 18 percent of our natural gas production.
2018 vs. 2017
Earnings for Europe and North Africa operations of $1,866 million increased $1,313 million in 2018 compared to 2017. Earnings in 2018 included a $774 million after-tax gain related to the sale of a ConocoPhillips subsidiary to BP, which held 16.5 percent of our 24 percent interest in the BP-operated Clair Field in the United Kingdom. Earnings were also improved due to higher realized crude oil and natural gas prices and lower DD&A expense, primarily due to reserve additions.
Average production increased 5 percent in 2018, compared with 2017. The increase was mainly due to higher production in Libya and new wells online in Norway and the United Kingdom. These increases in production were partly offset by normal field decline and the final cessation of production in several producing gas fields in the Southern North Sea in the third quarter of 2018. Production associated with the Southern North Sea was 22 million cubic feet a day or 4 MBOED in 2018.
Dispositions
In the fourth quarter of 2018, we completed a transaction to sell a ConocoPhillips subsidiary to BP, which held 16.5 percent of our 24 percent interest in the BP-operated Clair Field in the United Kingdom and acquire their nonoperated interest in the Kuparuk Assets in Alaska. In 2018, our Europe and North Africa segment net production associated with the disposed 16.5 percent interest in the Clair Field was approximately 5 MBOED. We recognized a $774 million after-tax gain in the fourth quarter related to this transaction, as discussed above. See Note 5—Assets Held for Sale, Sold or Acquired and Other Planned Dispositions in the Notes to Consolidated Financial Statements, for additional information.
We are currently marketing our United Kingdom Business Unit.
2017 vs. 2016
Earnings for Europe and North Africa operations of $553 million increased 40 percent in 2017. The increase in earnings was primarily due to higher realized crude oil, natural gas and natural gas liquids prices. Earnings were additionally improved by lower DD&A, mainly due to reserve revisions; a $60 million tax benefit from the revaluation of allocated U.S. deferred taxes at a lower U.S. federal statutory rate, in accordance with the Tax Legislation; and a $41 million tax benefit in Norway.
The increase in earnings was partly offset by the absence of a 2016 net deferred tax benefit of $161 million resulting from a change in the U.K. tax rate and a lower credit to impairment in 2017, compared with 2016, reflecting the annual updates to ARO on fields at or nearing the end of life which were impaired in prior years. The earnings improvement was further reduced by a net deferred tax charge of $65 million in the U.K. resulting from updated assumptions regarding applicable tax rates.
Average production increased 12 percent in 2017, compared with 2016. The increase was mainly due to the resumption and rampup of production in Libya; improved drilling and well performance in Norway; new production from the Greater Britannia Area and Norway; and higher Norway gas offtake, partly offset by normal field decline.
Table of Contents
Asia Pacific and Middle East
| 2018 | 2017 | 2016 | ||||||||||
| Net Income (Loss) Attributable to ConocoPhillips (millions of dollars) | $ | 2,070 | (1,098 | ) | 209 | |||||||
| Average Net Production | ||||||||||||
| Crude oil (MBD) | ||||||||||||
| Consolidated operations | 89 | 93 | 97 | |||||||||
| Equity affiliates | 14 | 14 | 14 | |||||||||
| Total crude oil | 103 | 107 | 111 | |||||||||
| Natural gas liquids (MBD) | ||||||||||||
| Consolidated operations | 3 | 4 | 7 | |||||||||
| Equity affiliates | 7 | 7 | 8 | |||||||||
| Total natural gas liquids | 10 | 11 | 15 | |||||||||
| Natural gas (MMCFD) | ||||||||||||
| Consolidated operations | 626 | 687 | 730 | |||||||||
| Equity affiliates | 1,031 | 1,007 | 899 | |||||||||
| Total natural gas | 1,657 | 1,694 | 1,629 | |||||||||
| Total Production (MBOED) | 389 | 401 | 399 | |||||||||
| Average Sales Prices | ||||||||||||
| Crude oil (dollars per barrel) | ||||||||||||
| Consolidated operations | $ | 70.93 | 54.38 | 42.23 | ||||||||
| Equity affiliates | 72.49 | 54.76 | 44.11 | |||||||||
| Total crude oil | 71.14 | 54.43 | 42.47 | |||||||||
| Natural gas liquids (dollars per barrel) | ||||||||||||
| Consolidated operations | 47.20 | 41.37 | 29.00 | |||||||||
| Equity affiliates | 45.69 | 38.74 | 31.13 | |||||||||
| Total natural gas liquids | 46.13 | 39.75 | 30.11 | |||||||||
| Natural gas (dollars per thousand cubic feet) | ||||||||||||
| Consolidated operations | 6.15 | 4.98 | 4.31 | |||||||||
| Equity affiliates | 6.06 | 4.27 | 2.97 | |||||||||
| Total natural gas | 6.09 | 4.55 | 3.57 | |||||||||
The Asia Pacific and Middle East segment has operations in China, Indonesia, Malaysia, Australia, Timor-Leste and Qatar. During 2018, Asia Pacific and Middle East contributed 14 percent of our worldwide liquids production and 60 percent of our natural gas production.
2018 vs. 2017
Asia Pacific and Middle East reported earnings of $2,070 million in 2018, compared with a loss of $1,098 million in 2017. The increase in earnings was mainly due to the absence of a $2,384 million before- and after-tax charge for the impairment of our APLNG investment in 2017, higher realized commodity prices, and increased equity in earnings of affiliates, mainly due to higher LNG prices. See the “APLNG” section of Note 6—Investments, Loans and Long-Term Receivables, in the Notes to Consolidated Financial Statements, for information on the 2017 impairment of our APLNG investment.
Table of Contents
Average production decreased 3 percent in 2018, compared with 2017. The decrease was primarily due to unplanned downtime in Malaysia related to the rupture of a third-party pipeline which carries gas production from the Kebabangan gas field in Malaysia and normal field decline. This decrease was partly offset by new wells online at Malakai in Malaysia and an infill drilling program in China.
Asset Disposition
In the fourth quarter of 2018, we entered into an agreement to sell our 30 percent interest in the Greater Sunrise Fields to the government of Timor-Leste for $350 million, subject to customary adjustments. The transaction is conditional on the funding approval from the Timor-Leste government as well as regulatory approvals. No production or reserve impacts are associated with the sale.
2017 vs. 2016
Asia Pacific and Middle East reported a loss of $1,098 million in 2017, compared with earnings of $209 million in 2016. The increase in loss was mainly due to a $2,384 million before- and after-tax charge for the impairment of our APLNG investment in 2017. For additional information on our APLNG impairment, see the “APLNG” section of Note 6—Investments, Loans and Long-Term Receivables, in the Notes to Consolidated Financial Statements. Additionally, lower sales volumes in Indonesia, Australia and China further increased losses.
The increase in losses was partly offset by higher equity earnings, mainly as a result of higher commodity prices, increased sales volumes at APLNG and the absence of a 2016 deferred tax charge of $174 million resulting from the change of our APLNG tax functional currency. Higher realized crude oil and natural gas prices on non-equity volumes further reduced the loss.
Average production was essentially flat in 2017.
Other International
| 2018 | 2017 | 2016 | ||||||||||
| Net Income (Loss) Attributable to ConocoPhillips (millions of dollars) | $ | 364 | 167 | (16 | ) | |||||||
The Other International segment includes exploration activities in Colombia and Chile.
2018 vs. 2017
Other International operations reported earnings of $364 million in 2018, compared with earnings of $167 million in 2017. The increase in earnings was primarily due to recognizing $417 million after-tax in other income under a settlement agreement with PDVSA associated with an arbitration award issued by the ICC. Partly offsetting the increase in earnings, was the absence of a $320 million after-tax award from an arbitration settlement with The Republic of Ecuador in 2017. See Note 13—Contingencies and Commitments in the Notes to Consolidated Financial Statements, for additional information.
New Country Entrance
We received approval from Argentina’s government in January 2019 for a 50 percent nonoperated interest in the El Turbio Este block in the Austral Basin.
2017 vs. 2016
Other International operations reported earnings of $167 million in 2017, compared with a loss of $16 million in 2016. The increase in earnings was primarily due to a $320 million after-tax International Centre for Settlement of Investment Disputes (ICSID) award from an arbitration with The Republic of Ecuador. Earnings were additionally increased due to lower rig stacking costs in Angola. The increase in earnings was partly
Table of Contents
offset by the absence of a $138 million gain in 2016 on the disposition of ConocoPhillips Senegal B.V., the entity that held our interest in three exploration blocks offshore Senegal, and a $45 million tax charge from the revaluation of allocated U.S. deferred taxes at a lower U.S. federal statutory rate, in accordance with the Tax Legislation.
Corporate and Other
| Millions of Dollars | ||||||||||||
| 2018 | 2017 | 2016 | ||||||||||
| Net Loss Attributable to ConocoPhillips | ||||||||||||
| Net interest | $ | (680 | ) | (739 | ) | (980 | ) | |||||
| Corporate general and administrative expenses | (91 | ) | (193 | )* | (147 | )* | ||||||
| Technology | 109 | 20 | 50 | |||||||||
| Other | (1,005 | ) | (1,224 | )* | (252 | )* | ||||||
| $ | (1,667 | ) | (2,136 | ) | (1,329 | ) | ||||||
*Certain amounts have been reclassified to reflect the adoption of ASU No. 2017-07. See Note 2—Changes in Accounting Principles, in the Notes to Consolidated Financial Statements, for additional information.
2018 vs. 2017
Net interest consists of interest and financing expense, net of interest income and capitalized interest. Net interest decreased $59 million in 2018 compared with 2017, primarily due to less interest from lower debt balances, higher capitalized interest on projects, and an accrual reduction due to a transportation cost ruling by the FERC in the first quarter of 2018. Partly offsetting these impacts, were reduced tax benefits on interest expense following the Tax Legislation, which lowered the U.S. corporate income tax rate from 35 percent to 21 percent effective January 1, 2018, and a lower tax benefit due to higher interest from the fair market value method of apportioning interest expense in the United States.
Corporate general and administrative expenses include compensation programs and staff costs. These costs decreased by $102 million in 2018 compared with 2017, primarily due to lower staff expenses and costs associated with certain key employee compensation programs.
Technology includes our investment in new technologies or businesses, as well as licensing revenues. Activities are focused on tight oil reservoirs, LNG, oil sands and other production operations. Earnings from Technology increased by $89 million in 2018 compared with 2017, primarily due to higher licensing revenues. See Note 24—Sales and Other Operating Revenues, in the Notes to Consolidated Financial Statements, for additional information.
The category “Other” includes certain foreign currency transaction gains and losses, environmental costs associated with sites no longer in operation, other costs not directly associated with an operating segment, premiums incurred on the early retirement of debt, unrealized holding gains or losses on equity securities, and pension settlement expense. Losses in “Other” decreased by $219 million in 2018 compared with 2017, primarily due to the absence of an $813 million tax charge from the revaluation of deferred taxes at a lower federal statutory rate, in accordance with the Tax Legislation enacted in 2017; lower premiums on the early retirement of debt; partly offset by a $437 million unrealized loss on our Cenovus Energy common shares.
Table of Contents
2017 vs. 2016
Net interest consists of interest and financing expense, net of interest income and capitalized interest. Net interest decreased 25 percent in 2017 compared with 2016, primarily due to impacts from the fair market value method of apportioning interest expense in the United States and lower interest as a result of reduced debt. Higher interest income further drove the decrease in net interest, which was partly offset by lower capitalized interest on projects.
Corporate general and administrative expenses which include pension settlement expenses and compensation program costs increased $46 million in 2017 compared with 2016, primarily due to higher costs associated with certain key employee compensation programs and staff expenses. See Note 2—Changes in Accounting Principles, in the Notes to Financial Statements, for additional information.
Technology includes our investment in new technologies or businesses, as well as licensing revenues received. Activities are focused on tight oil reservoirs, LNG, oil sands and other production operations. Earnings from Technology were $20 million in 2017, compared with $50 million in 2016. The decrease in earnings primarily resulted from lower licensing revenues, partly offset by reduced technology program spend.
The category “Other” includes certain foreign currency transaction gains and losses, environmental costs associated with sites no longer in operation, other costs not directly associated with an operating segment and premiums incurred on the early retirement of debt. Losses in “Other” increased $972 million in 2017, mainly due to an $813 million tax charge from the revaluation of deferred taxes at a lower federal statutory rate, in accordance with the Tax Legislation and premiums on our early retirement of debt.
Table of Contents
CAPITAL RESOURCES AND LIQUIDITY
Financial Indicators
| Millions of Dollars Except as Indicated | ||||||||||||
| 2018 | 2017 | 2016 | ||||||||||
| Net cash provided by operating activities | $ | 12,934 | 7,077 | 4,403 | ||||||||
| Cash and cash equivalents | 5,915 | 6,325 | 3,610 | |||||||||
| Short-term debt | 112 | 2,575 | 1,089 | |||||||||
| Total debt | 14,968 | 19,703 | 27,275 | |||||||||
| Total equity | 32,064 | 30,801 | 35,226 | |||||||||
| Percent of total debt to capital* | 32 | % | 39 | 44 | ||||||||
| Percent of floating-rate debt to total debt | 5 | % | 5 | 9 | ||||||||
*Capital includes total debt and total equity.
To meet our short- and long-term liquidity requirements, we look to a variety of funding sources, including cash generated from operating activities, proceeds from asset sales, our commercial paper and credit facility programs and our ability to sell securities using our shelf registration statement. In 2018, the primary uses of our available cash were $6,750 million to support our ongoing capital expenditures and investments program; $4,995 million to reduce debt; $2,999 million to repurchase our common stock; and $1,363 million to pay dividends on our common stock. During 2018, cash, cash equivalents, and restricted cash decreased by $385 million to $6,151 million.
We believe current cash balances and cash generated by operations, together with access to external sources of funds as described below in the “Significant Sources of Capital” section, will be sufficient to meet our funding requirements in the near and long term, including our capital spending program, share repurchases, dividend payments and required debt payments.
Significant Sources of Capital
Operating Activities
During 2018, cash provided by operating activities was $12,934 million, an 83 percent increase from 2017. The increase was primarily due to higher realized commodity prices and higher distributions from equity affiliates.
While the stability of our cash flows from operating activities benefits from geographic diversity, our short- and long-term operating cash flows are highly dependent upon prices for crude oil, bitumen, natural gas, LNG and natural gas liquids. Prices and margins in our industry have historically been volatile and are driven by market conditions over which we have no control. Absent other mitigating factors, as these prices and margins fluctuate, we would expect a corresponding change in our operating cash flows.
The level of absolute production volumes, as well as product and location mix, impacts our cash flows. Full-year production averaged 1,283 MBOED in 2018. Full-year production excluding Libya averaged 1,242 MBOED in 2018 and is expected to be 1,300 to 1,350 MBOED in 2019. Future production is subject to numerous uncertainties, including, among others, the volatile crude oil and natural gas price environment, which may impact investment decisions; the effects of price changes on production sharing and variable-royalty contracts; acquisition and disposition of fields; field production decline rates; new technologies; operating efficiencies; timing of startups and major turnarounds; political instability; weather-related disruptions; and the addition of proved reserves through exploratory success and their timely and cost-effective development. While we actively manage these factors, production levels can cause variability in cash flows, although generally this variability has not been as significant as that caused by commodity prices.
Table of Contents
To maintain or grow our production volumes on an ongoing basis, we must continue to add to our proved reserve base. Our proved reserves generally increase as prices rise and decrease as prices decline. In 2018, our reserve replacement, which included a net increase of 0.2 billion BOE from sales and purchases, was 147 percent. Increased crude oil reserves accounted for over 90 percent of the total change in reserves. Our organic reserve replacement, which excludes the impact of sales and purchases, was 109 percent in 2018. Approximately 33 percent of organic reserve additions are from Lower 48 unconventional assets, 29 percent from Alaska and 22 percent from Asia Pacific and Middle East.
In the five years ended December 31, 2018, our reserve replacement, which included a decrease of 2.1 billion BOE from sales and purchases, was negative 30 percent, reflecting the impact of asset dispositions and lower prices during that period. Our organic reserve replacement during the five years ended December 31, 2018, was 44 percent, reflecting development activities as well as lower prices during that period.
Reserve replacement represents the net change in proved reserves, net of production, divided by our current year production, as shown in our supplemental reserve table disclosures. For additional information about our 2019 capital budget, see the “2019 Capital Budget” section within “Capital Resources and Liquidity” and for additional information on proved reserves, including both developed and undeveloped reserves, see the “Oil and Gas Operations” section of this report.
As discussed in the “Critical Accounting Estimates” section, engineering estimates of proved reserves are imprecise; therefore, each year reserves may be revised upward or downward due to the impact of changes in commodity prices or as more technical data becomes available on reservoirs. In 2018 and 2017, revisions increased reserves, while in 2016, revisions decreased reserves. It is not possible to reliably predict how revisions will impact reserve quantities in the future.
Investing Activities
Proceeds from asset sales in 2018 were $1.1 billion. We completed several undeveloped acreage transactions in our Lower 48 segment for a total of $267 million after customary adjustments and another transaction in our Lower 48 segment for $112 million after customary adjustments. We completed the sale of our interests in the Barnett to Lime Rock Resources for $196 million after customary adjustments. We also received $253 million net proceeds for customary adjustments related to our transaction with BP for the disposition of a ConocoPhillips subsidiary holding a 16.5 percent interest in the Clair Field in the United Kingdom and the acquisition of the Kuparuk Assets. We received contingent payments of $95 million in relation to our 2017 Canada disposition to Cenovus Energy.
Proceeds from asset sales in 2017 were $13.9 billion. We completed the sale of our 50 percent nonoperated interest in the FCCL Partnership, as well as the majority of our western Canada gas assets to Cenovus Energy. Consideration for the transaction included $11.0 billion in cash after customary adjustments and 208 million Cenovus Energy common shares. We completed the sale of our interests in the San Juan Basin to an affiliate of Hilcorp Energy Company. Total proceeds for the sale were $2.5 billion in cash after customary adjustments. We also completed the sale of our interest in the Panhandle assets for $178 million in cash after customary adjustments.
For additional information on our dispositions and investment in Cenovus common shares, see Note 5—Assets Held for Sale, Sold or Acquired and Other Planned Dispositions and Note 7—Investment in Cenovus Energy, in the Notes to Consolidated Financial Statements, and the Results of Operations section within Management’s Discussion and Analysis.
Commercial Paper and Credit Facilities
In May 2018, we refinanced our revolving credit facility from a total aggregate principal amount of $6.75 billion to $6.0 billion with a new expiration date of May 2023. Our revolving credit facility may be used for direct bank borrowings, the issuance of letters of credit totaling up to $500 million, or as support for our commercial paper program. The revolving credit facility is broadly syndicated among financial institutions
Table of Contents
and does not contain any material adverse change provisions or any covenants requiring maintenance of specified financial ratios or credit ratings. The facility agreement contains a cross-default provision relating to the failure to pay principal or interest on other debt obligations of $200 million or more by ConocoPhillips, or any of its consolidated subsidiaries.
Credit facility borrowings may bear interest at a margin above rates offered by certain designated banks in the London interbank market or at a margin above the overnight federal funds rate or prime rates offered by certain designated banks in the United States. The agreement calls for commitment fees on available, but unused, amounts. The agreement also contains early termination rights if our current directors or their approved successors cease to be a majority of the Board of Directors.
The revolving credit facility supports the ConocoPhillips Company $6.0 billion commercial paper program which is primarily a funding source for short-term working capital needs. Commercial paper maturities are generally limited to 90 days. We had no commercial paper outstanding in programs in place at December 31, 2018 or December 31, 2017. We had no direct outstanding borrowings or letters of credit under the revolving credit facility at December 31, 2018 and December 31, 2017. Since we had no commercial paper outstanding and had issued no letters of credit, we had access to $6.0 billion in borrowing capacity under our revolving credit facility at December 31, 2018.
In August 2018, Fitch upgraded our long-term debt rating from “A-” to “A” and adjusted their outlook for our debt from “positive” to “stable.” In September 2018, Moody’s Investors Services upgraded its rating on our long-term debt from “Baa1” to “A3” and adjusted its outlook for our debt from “positive” to “stable.” In November 2018, Standard & Poor’s upgraded our long-term debt rating from “A-” to “A,” with a stable outlook. We do not have any ratings triggers on any of our corporate debt that would cause an automatic default, and thereby impact our access to liquidity, in the event of a downgrade of our credit rating. If our credit rating were downgraded, it could increase the cost of corporate debt available to us and restrict our access to the commercial paper markets. If our credit rating were to deteriorate to a level prohibiting us from accessing the commercial paper market, we would still be able to access funds under our revolving credit facility.
Certain of our project-related contracts, commercial contracts and derivative instruments contain provisions requiring us to post collateral. Many of these contracts and instruments permit us to post either cash or letters of credit as collateral. At December 31, 2018 and 2017, we had direct bank letters of credit of $323 million and $338 million, respectively, which secured performance obligations related to various purchase commitments incident to the ordinary conduct of business. In the event of credit ratings downgrades, we may be required to post additional letters of credit.
Shelf Registration
We have a universal shelf registration statement on file with the U.S. Securities and Exchange Commission (SEC) under which we, as a well-known seasoned issuer, have the ability to issue and sell an indeterminate amount of various types of debt and equity securities.
Off-Balance Sheet Arrangements
As part of our normal ongoing business operations and consistent with normal industry practice, we enter into numerous agreements with other parties to pursue business opportunities, which share costs and apportion risks among the parties as governed by the agreements.
For information about guarantees, see Note 12—Guarantees, in the Notes to Consolidated Financial Statements, which is incorporated herein by reference.
Table of Contents
Capital Requirements
For information about our capital expenditures and investments, see the “Capital Expenditures” section.
Our debt balance at December 31, 2018, was $15.0 billion, a decrease of $4.7 billion from the balance at December 31, 2017. We achieved our stated debt target of $15 billion eighteen months earlier than the original target date of year-end 2019.
In 2018, we repaid the $250 million floating rate note due in 2018 at its natural maturity. We also redeemed or repurchased a total $4,450 million of debt, described below, incurring $208 million in net premiums above book value, which are reported in the “Other expenses” line on our consolidated income statement.
| • | 4.20% Notes due 2021 with remaining principal of $1.0 billion. |
|---|
| • | 2.875% Notes due 2021 with principal of $750 million. |
|---|
| • | 2.4% Notes due 2022 with principal of $1.0 billion (partial repurchase of $671 million). |
|---|
| • | 3.35% Notes due 2024 with principal of $1.0 billion (partial repurchase of $574 million). |
|---|
| • | 2.2% Notes due 2020 with principal of $500 million. |
|---|
| • | 3.35% Notes due 2025 with principal of $500 million (partial repurchase of $301 million). |
|---|
| • | 4.15% Notes due 2034 with principal of $500 million (partial repurchase of $254 million). |
|---|
| • | 8.125% Notes due 2030 with principal of $600 million (partial repurchase of $210 million). |
|---|
| • | 7.8% Notes due 2027 with principal of $300 million (partial repurchase of $97 million). |
|---|
| • | 7.9% Notes due 2047 with principal of $100 million (partial repurchase of $40 million). |
|---|
| • | 9.125% Notes due 2021 with principal of $150 million (partial repurchase of $27 million). |
|---|
| • | 8.20% Notes due 2025 with principal of $150 million (partial repurchase of $16 million). |
|---|
| • | 7.65% Notes due 2023 with principal of $88 million (partial repurchase of $10 million). |
|---|
For more information on Debt, see Note 11—Debt, in the Notes to Consolidated Financial Statements.
On February 1, 2018, we announced an increase in the quarterly dividend to $0.285 per share, compared with the previous quarterly dividend of $0.265 per share. The dividend was paid on March 1, 2018, to stockholders of record at the close of business on February 12, 2018. On May 4, 2018, we announced a quarterly dividend of $0.285 per share. The dividend was paid on June 1, 2018, to stockholders of record at the close of business on May 14, 2018. On July 11, 2018, we announced a quarterly dividend of $0.285 per share. The dividend was paid on September 4, 2018, to stockholders of record at the close of business on July 23, 2018. On October 5, 2018, we announced a 7 percent increase in the quarterly dividend to $0.305 per share. The dividend was paid on December 3, 2018, to stockholders of record at the close of business on October 15, 2018. On January 30, 2019, we announced a quarterly dividend of $0.305 cents per share, payable March 1, 2019, to stockholders of record at the close of business on February 11, 2019.
In late 2016, we initiated our current share repurchase program. As of June 30, 2018, we had announced authorization to repurchase a total of $6 billion of our common stock. We repurchased $3 billion in 2017 and $3 billion in 2018. On July 12, 2018, we announced an authorization of an additional $9 billion in share repurchases bringing the total program authorization to $15 billion. We expect to execute $3 billion of the remaining $9 billion of our share repurchase program in 2019. Whether we undertake these additional repurchases is ultimately subject to numerous considerations, market conditions and other factors. See Risk Factors “Our ability to declare and pay dividends and repurchase shares is subject to certain considerations.”
Since our share repurchase program began in November 2016, we have repurchased 111 million shares at a cost of $6.1 billion through December 31, 2018.
During the third quarter of 2017, we made a $600 million contribution to our domestic qualified pension plan, which is included in the “Other” line in the “Cash Flows From Operating Activities” section of our consolidated statement of cash flows. This additional contribution lowered our domestic pension deficit, thereby reducing 2018 premiums charged by the Pension Benefit Guaranty Corporation.
Table of Contents
Contractual Obligations
The table below summarizes our aggregate contractual fixed and variable obligations as of December 31, 2018:
| Millions of Dollars | ||||||||||||||||||||
| Payments Due by Period | ||||||||||||||||||||
| Total | Up to 1 Year | Years 2–3 | Years 4–5 | After 5 Years | ||||||||||||||||
| Debt obligations (a) | $ | 14,191 | 33 | 159 | 987 | 13,012 | ||||||||||||||
| Capital lease obligations (b) | 777 | 79 | 155 | 143 | 400 | |||||||||||||||
| Total debt | 14,968 | 112 | 314 | 1,130 | 13,412 | |||||||||||||||
| Interest on debt and other obligations | 12,213 | 865 | 1,710 | 1,634 | 8,004 | |||||||||||||||
| Operating lease obligations (c) | 1,394 | 248 | 561 | 373 | 212 | |||||||||||||||
| Purchase obligations (d) | 9,703 | 4,000 | 1,854 | 1,422 | 2,427 | |||||||||||||||
| Other long-term liabilities | ||||||||||||||||||||
| Pension and postretirement benefit contributions (e) | 1,519 | 380 | 634 | 505 | – | |||||||||||||||
| Asset retirement obligations (f) | 7,908 | 378 | 672 | 681 | 6,177 | |||||||||||||||
| Accrued environmental costs (g) | 178 | 20 | 28 | 26 | 104 | |||||||||||||||
| Unrecognized tax benefits (h) | 115 | 115 | (h) | (h) | (h) | |||||||||||||||
| Total | $ | 47,998 | 6,118 | 5,773 | 5,771 | 30,336 | ||||||||||||||
| (a) | Includes $220 million of net unamortized premiums, discounts and debt issuance costs. See Note 11—Debt, in the Notes to Consolidated Financial Statements, for additional information. |
|---|
| (b) | Capital lease obligations are presented on a discounted basis. |
|---|
| (c) | Operating lease obligations are presented on an undiscounted basis. |
|---|
| (d) | Represents any agreement to purchase goods or services that is enforceable and legally binding and that specifies all significant terms, presented on an undiscounted basis. Does not include purchase commitments for jointly owned fields and facilities where we are not the operator. |
|---|
The majority of the purchase obligations are market-based contracts related to our commodity business. Product purchase commitments with third parties totaled $3,412 million.
Purchase obligations of $5,169 million are related to agreements to access and utilize the capacity of third-party equipment and facilities, including pipelines and LNG and product terminals, to transport, process, treat and store commodities. The remainder is primarily our net share of purchase commitments for materials and services for jointly owned fields and facilities where we are the operator.
| (e) | Represents contributions to qualified and nonqualified pension and postretirement benefit plans for the years 2019 through 2023. For additional information related to expected benefit payments subsequent to 2023, see Note 18—Employee Benefit Plans, in the Notes to Consolidated Financial Statements. |
|---|
| (f) | Represents estimated discounted costs to retire and remove long-lived assets at the end of their operations. |
|---|
| (g) | Represents estimated costs for accrued environmental expenditures presented on a discounted basis for costs acquired in various business combinations and an undiscounted basis for all other accrued environmental costs. |
|---|
Table of Contents
| (h) | Excludes unrecognized tax benefits of $966 million because the ultimate disposition and timing of any payments to be made with regard to such amounts are not reasonably estimable. Although unrecognized tax benefits are not a contractual obligation, they are presented in this table because they represent potential demands on our liquidity. |
|---|
Capital Expenditures
| Millions of Dollars | ||||||||||||
| 2018 | 2017 | 2016 | ||||||||||
| Alaska | $ | 1,298 | 815 | 883 | ||||||||
| Lower 48 | 3,184 | 2,136 | 1,262 | |||||||||
| Canada | 477 | 202 | 698 | |||||||||
| Europe and North Africa | 877 | 872 | 1,020 | |||||||||
| Asia Pacific and Middle East | 718 | 482 | 838 | |||||||||
| Other International | 6 | 21 | 104 | |||||||||
| Corporate and Other | 190 | 63 | 64 | |||||||||
| Capital Program | $ | 6,750 | 4,591 | 4,869 | ||||||||
Our capital expenditures and investments for the three-year period ended December 31, 2018, totaled $16.2 billion. The 2018 expenditures supported key exploration and developments, primarily:
| • | Development, appraisal and exploration activities in the Lower 48, including Eagle Ford, Bakken and Delaware in the Permian Basin. |
|---|
| • | Leasehold acquisition and exploration, appraisal and development activities in Alaska related to the Western North Slope; development activities in the Greater Kuparuk Area and the Greater Prudhoe Area. |
|---|
| • | Development activities in Europe, including the Greater Ekofisk Area, Clair Ridge and Aasta Hansteen. |
|---|
| • | Leasehold acquisition, optimization of oil sands development and appraisal activities in liquids-rich plays in Canada. |
|---|
| • | Continued development in China, Australia, Indonesia, and Malaysia, and exploration and appraisal activities in Malaysia. |
|---|
2019 CAPITAL BUDGET
In December 2018, we announced a 2019 capital budget of $6.1 billion which includes funding for ongoing conventional and unconventional development drilling programs, major projects, exploration and appraisal activities, and base maintenance activities. We are planning to allocate approximately:
| • | 70 percent of our 2019 capital expenditures budget to development drilling programs. These funds will focus predominantly on the Lower 48 unconventionals including the Eagle Ford, Bakken and Delaware, as well as development drilling in Alaska, Canada and Europe. |
|---|
| • | 15 percent of our 2019 capital expenditures budget to maintain base production and corporate expenditures. |
|---|
| • | 10 percent of our 2019 capital expenditures budget to major projects. These funds will focus on major projects in Alaska, China, Australia, Europe and Malaysia. |
|---|
| • | 5 percent of our 2019 capital expenditures budget to new exploration activity, primarily in Alaska and the Lower 48. |
|---|
Table of Contents
For information on proved undeveloped reserves and the associated costs to develop these reserves, see the “Oil and Gas Operations” section.
Contingencies
A number of lawsuits involving a variety of claims arising in the ordinary course of business have been filed against ConocoPhillips. We also may be required to remove or mitigate the effects on the environment of the placement, storage, disposal or release of certain chemical, mineral and petroleum substances at various active and inactive sites. We regularly assess the need for accounting recognition or disclosure of these contingencies. In the case of all known contingencies (other than those related to income taxes), we accrue a liability when the loss is probable and the amount is reasonably estimable. If a range of amounts can be reasonably estimated and no amount within the range is a better estimate than any other amount, then the minimum of the range is accrued. We do not reduce these liabilities for potential insurance or third-party recoveries. If applicable, we accrue receivables for probable insurance or other third-party recoveries. With respect to income tax related contingencies, we use a cumulative probability-weighted loss accrual in cases where sustaining a tax position is less than certain.
Based on currently available information, we believe it is remote that future costs related to known contingent liability exposures will exceed current accruals by an amount that would have a material adverse impact on our consolidated financial statements. For information on other contingencies, see “Critical Accounting Estimates” and Note 13—Contingencies and Commitments, in the Notes to Consolidated Financial Statements.
Legal and Tax Matters
We are subject to various lawsuits and claims including but not limited to matters involving oil and gas royalty and severance tax payments, gas measurement and valuation methods, contract disputes, environmental damages, personal injury, and property damage. Our primary exposures for such matters relate to alleged royalty and tax underpayments on certain federal, state and privately owned properties and claims of alleged environmental contamination from historic operations. We will continue to defend ourselves vigorously in these matters.
Our legal organization applies its knowledge, experience and professional judgment to the specific characteristics of our cases, employing a litigation management process to manage and monitor the legal proceedings against us. Our process facilitates the early evaluation and quantification of potential exposures in individual cases. This process also enables us to track those cases that have been scheduled for trial and/or mediation. Based on professional judgment and experience in using these litigation management tools and available information about current developments in all our cases, our legal organization regularly assesses the adequacy of current accruals and determines if adjustment of existing accruals, or establishment of new accruals, is required. See Note 19—Income Taxes, in the Notes to Consolidated Financial Statements, for additional information about income tax-related contingencies.
Environmental
We are subject to the same numerous international, federal, state and local environmental laws and regulations as other companies in our industry. The most significant of these environmental laws and regulations include, among others, the:
| • | U.S. Federal Clean Air Act, which governs air emissions. |
|---|
| • | U.S. Federal Clean Water Act, which governs discharges to water bodies. |
|---|
| • | European Union Regulation for Registration, Evaluation, Authorization and Restriction of Chemicals (REACH). |
|---|
| • | U.S. Federal Comprehensive Environmental Response, Compensation and Liability Act (CERCLA or Superfund), which imposes liability on generators, transporters and arrangers of hazardous substances at sites where hazardous substance releases have occurred or are threatening to occur. |
|---|
| • | U.S. Federal Resource Conservation and Recovery Act (RCRA), which governs the treatment, storage and disposal of solid waste. |
|---|
Table of Contents
| • | U.S. Federal Oil Pollution Act of 1990 (OPA90), under which owners and operators of onshore facilities and pipelines, lessees or permittees of an area in which an offshore facility is located, and owners and operators of vessels are liable for removal costs and damages that result from a discharge of oil into navigable waters of the United States. |
|---|
| • | U.S. Federal Emergency Planning and Community Right-to-Know Act (EPCRA), which requires facilities to report toxic chemical inventories with local emergency planning committees and response departments. |
|---|
| • | U.S. Federal Safe Drinking Water Act, which governs the disposal of wastewater in underground injection wells. |
|---|
| • | U.S. Department of the Interior regulations, which relate to offshore oil and gas operations in U.S. waters and impose liability for the cost of pollution cleanup resulting from operations, as well as potential liability for pollution damages. |
|---|
| • | European Union Trading Directive resulting in European Emissions Trading Scheme. |
|---|
These laws and their implementing regulations set limits on emissions and, in the case of discharges to water, establish water quality limits and establish standards and impose obligations for the remediation of releases of hazardous substances and hazardous wastes. They also, in most cases, require permits in association with new or modified operations. These permits can require an applicant to collect substantial information in connection with the application process, which can be expensive and time consuming. In addition, there can be delays associated with notice and comment periods and the agency’s processing of the application. Many of the delays associated with the permitting process are beyond the control of the applicant.
Many states and foreign countries where we operate also have, or are developing, similar environmental laws and regulations governing these same types of activities. While similar, in some cases these regulations may impose additional, or more stringent, requirements that can add to the cost and difficulty of marketing or transporting products across state and international borders.
The ultimate financial impact arising from environmental laws and regulations is neither clearly known nor easily determinable as new standards, such as air emission standards and water quality standards, continue to evolve. However, environmental laws and regulations, including those that may arise to address concerns about global climate change, are expected to continue to have an increasing impact on our operations in the United States and in other countries in which we operate. Notable areas of potential impacts include air emission compliance and remediation obligations in the United States and Canada.
An example is the use of hydraulic fracturing, an essential completion technique that facilitates production of oil and natural gas otherwise trapped in lower permeability rock formations. A range of local, state, federal or national laws and regulations currently govern hydraulic fracturing operations, with hydraulic fracturing currently prohibited in some jurisdictions. Although hydraulic fracturing has been conducted for many decades, a number of new laws, regulations and permitting requirements are under consideration by the U.S. Environmental Protection Agency (EPA), the U.S. Department of the Interior, and others which could result in increased costs, operating restrictions, operational delays and/or limit the ability to develop oil and natural gas resources. Governmental restrictions on hydraulic fracturing could impact the overall profitability or viability of certain of our oil and natural gas investments. We have adopted operating principles that incorporate established industry standards designed to meet or exceed government requirements. Our practices continually evolve as technology improves and regulations change.
We also are subject to certain laws and regulations relating to environmental remediation obligations associated with current and past operations. Such laws and regulations include CERCLA and RCRA and their state equivalents. Longer-term expenditures are subject to considerable uncertainty and may fluctuate significantly.
We occasionally receive requests for information or notices of potential liability from the EPA and state environmental agencies alleging we are a potentially responsible party under CERCLA or an equivalent state statute. On occasion, we also have been made a party to cost recovery litigation by those agencies or by
Table of Contents
private parties. These requests, notices and lawsuits assert potential liability for remediation costs at various sites that typically are not owned by us, but allegedly contain wastes attributable to our past operations. As of December 31, 2018, there were 14 sites around the United States in which we were identified as a potentially responsible party under CERCLA and comparable state laws.
For most Superfund sites, our potential liability will be significantly less than the total site remediation costs because the percentage of waste attributable to us, versus that attributable to all other potentially responsible parties, is relatively low. Although liability of those potentially responsible is generally joint and several for federal sites and frequently so for state sites, other potentially responsible parties at sites where we are a party typically have had the financial strength to meet their obligations, and where they have not, or where potentially responsible parties could not be located, our share of liability has not increased materially. Many of the sites at which we are potentially responsible are still under investigation by the EPA or the state agencies concerned. Prior to actual cleanup, those potentially responsible normally assess site conditions, apportion responsibility and determine the appropriate remediation. In some instances, we may have no liability or attain a settlement of liability. Actual cleanup costs generally occur after the parties obtain EPA or equivalent state agency approval. There are relatively few sites where we are a major participant, and given the timing and amounts of anticipated expenditures, neither the cost of remediation at those sites nor such costs at all CERCLA sites, in the aggregate, is expected to have a material adverse effect on our competitive or financial condition.
Expensed environmental costs were $442 million in 2018 and are expected to be about $530 million per year in 2019 and 2020. Capitalized environmental costs were $191 million in 2018 and are expected to be about $240 million per year in 2019 and 2020.
Accrued liabilities for remediation activities are not reduced for potential recoveries from insurers or other third parties and are not discounted (except those assumed in a purchase business combination, which we do record on a discounted basis).
Many of these liabilities result from CERCLA, RCRA and similar state or international laws that require us to undertake certain investigative and remedial activities at sites where we conduct, or once conducted, operations or at sites where ConocoPhillips-generated waste was disposed. The accrual also includes a number of sites we identified that may require environmental remediation, but which are not currently the subject of CERCLA, RCRA or other agency enforcement activities. The laws that require or address environmental remediation may apply retroactively and regardless of fault, the legality of the original activities or the current ownership or control of sites. If applicable, we accrue receivables for probable insurance or other third-party recoveries. In the future, we may incur significant costs under both CERCLA and RCRA.
Remediation activities vary substantially in duration and cost from site to site, depending on the mix of unique site characteristics, evolving remediation technologies, diverse regulatory agencies and enforcement policies, and the presence or absence of potentially liable third parties. Therefore, it is difficult to develop reasonable estimates of future site remediation costs.
At December 31, 2018, our balance sheet included total accrued environmental costs of $178 million, compared with $180 million at December 31, 2017, for remediation activities in the U.S. and Canada. We expect to incur a substantial amount of these expenditures within the next 30 years.
Notwithstanding any of the foregoing, and as with other companies engaged in similar businesses, environmental costs and liabilities are inherent concerns in our operations and products, and there can be no assurance that material costs and liabilities will not be incurred. However, we currently do not expect any material adverse effect upon our results of operations or financial position as a result of compliance with current environmental laws and regulations.
Climate Change
Continuing political and social attention to the issue of global climate change has resulted in a broad range of proposed or promulgated state, national and international laws focusing on greenhouse gas (GHG) reduction.
Table of Contents
These proposed or promulgated laws apply or could apply in countries where we have interests or may have interests in the future. Laws in this field continue to evolve, and while it is not possible to accurately estimate either a timetable for implementation or our future compliance costs relating to implementation, such laws, if enacted, could have a material impact on our results of operations and financial condition. Examples of legislation or precursors for possible regulation that do or could affect our operations include:
| • | European Emissions Trading Scheme (ETS), the program through which many of the European Union (EU) member states are implementing the Kyoto Protocol. Our cost of compliance with the EU ETS in 2018 was approximately $5.6 million (net share before-tax). |
|---|
| • | The Alberta Carbon Competitiveness Incentive Regulation (CCIR) requires any existing facility with emissions equal to or greater than 100,000 metric tonnes of carbon dioxide, or equivalent, per year to meet an industry benchmark intensity. The total cost of these regulations in 2018 was approximately $4 million. |
|---|
| • | The U.S. Supreme Court decision in Massachusetts v. EPA, 549 U.S. 497, 127 S.Ct. 1438 (2007), confirmed that the EPA has the authority to regulate carbon dioxide as an “air pollutant” under the Federal Clean Air Act. |
|---|
| • | The U.S. EPA’s announcement on March 29, 2010 (published as “Interpretation of Regulations that Determine Pollutants Covered by Clean Air Act Permitting Programs,” 75 Fed. Reg. 17004 (April 2, 2010)), and the EPA’s and U.S. Department of Transportation’s joint promulgation of a Final Rule on April 1, 2010, that triggers regulation of GHGs under the Clean Air Act, may trigger more climate-based claims for damages, and may result in longer agency review time for development projects. |
|---|
| • | The U.S. EPA’s announcement on January 14, 2015, outlining a series of steps it plans to take to address methane and smog-forming volatile organic compound emissions from the oil and gas industry. The former U.S. administration established a goal of reducing the 2012 levels in methane emissions from the oil and gas industry by 40 to 45 percent by 2025. |
|---|
| • | Carbon taxes in certain jurisdictions. Our cost of compliance with Norwegian carbon tax legislation in 2018 was approximately $30 million (net share before-tax). We also incur a carbon tax for emissions from fossil fuel combustion in our British Columbia and Alberta Operations totaling just over $0.6 million (net share before-tax). |
|---|
| • | The agreement reached in Paris in December 2015 at the 21st Conference of the Parties to the United Nations Framework on Climate Change, setting out a new process for achieving global emission reductions. While the United States announced its intention to withdraw from the Paris Agreement, there is no guarantee that the commitments made by the United States will not be implemented, in whole or in part, by U.S. state and local governments or by major corporations headquartered in the United States. |
|---|
In the United States, some additional form of regulation may be forthcoming in the future at the federal and state levels with respect to GHG emissions. Such regulation could take any of several forms that may result in the creation of additional costs in the form of taxes, the restriction of output, investments of capital to maintain compliance with laws and regulations, or required acquisition or trading of emission allowances. We are working to continuously improve operational and energy efficiency through resource and energy conservation throughout our operations.
Compliance with changes in laws and regulations that create a GHG tax, emission trading scheme or GHG reduction policies could significantly increase our costs, reduce demand for fossil energy derived products, impact the cost and availability of capital and increase our exposure to litigation. Such laws and regulations could also increase demand for less carbon intensive energy sources, including natural gas. The ultimate impact on our financial performance, either positive or negative, will depend on a number of factors, including but not limited to:
| • | Whether and to what extent legislation or regulation is enacted. |
|---|
| • | The timing of the introduction of such legislation or regulation. |
|---|
| • | The nature of the legislation (such as a cap and trade system or a tax on emissions) or regulation. |
|---|
| • | The price placed on GHG emissions (either by the market or through a tax). |
|---|
Table of Contents
| • | The GHG reductions required. |
|---|
| • | The price and availability of offsets. |
|---|
| • | The amount and allocation of allowances. |
|---|
| • | Technological and scientific developments leading to new products or services. |
|---|
| • | Any potential significant physical effects of climate change (such as increased severe weather events, changes in sea levels and changes in temperature). |
|---|
| • | Whether, and the extent to which, increased compliance costs are ultimately reflected in the prices of our products and services. |
|---|
The company has responded by putting in place a Sustainable Development Risk Management Practice covering the assessment and registering of significant and high sustainable development risks based on their consequence and likelihood of occurrence. A corporate Climate Change Action Plan has been developed to track mitigation activities for each climate-related risk included in the corporate Sustainable Development Risk Register.
The risks addressed in our Climate Change Action Plan fall into four broad categories:
| • | GHG-related legislation and regulation. |
|---|
| • | GHG emissions management. |
|---|
| • | Physical climate-related impacts. |
|---|
| • | Climate-related disclosure and reporting. |
|---|
The company uses a range of estimated future costs of GHG emissions for internal planning purposes, including an estimated market cost of GHG emissions of $40 per metric tonne applied beginning in the year 2024 to evaluate certain future projects and opportunities. The company does not use an estimated market cost of GHG emissions when assessing reserves in jurisdictions without existing GHG regulations.
In December 2018, we became a Founding Member of the Climate Leadership Council (CLC), an international policy institute founded in collaboration with business and environmental interests to develop a carbon dividend plan. Participation in the CLC provides another opportunity for ongoing dialogue about carbon pricing and framing the issues in alignment with our public policy principles. We also belong to and fund Americans for Carbon Dividends, the education and advocacy branch of the CLC.
In 2017 and 2018, cities, counties, a state government, and a trade association in California, New York, Washington, Rhode Island and Maryland, as well as the Pacific Coast Federation of Fishermen’s Association, Inc., have filed lawsuits against oil and gas companies, including ConocoPhillips, seeking compensatory damages and equitable relief to abate alleged climate change impacts. ConocoPhillips is vigorously defending against these lawsuits. The lawsuits brought by the Cities of San Francisco, Oakland and New York have been dismissed by the district courts and appeals are pending.
Other
We have deferred tax assets related to certain accrued liabilities, loss carryforwards and credit carryforwards. Valuation allowances have been established to reduce these deferred tax assets to an amount that will, more likely than not, be realized. Based on our historical taxable income, our expectations for the future, and available tax-planning strategies, management expects the net deferred tax assets will be realized as offsets to reversing deferred tax liabilities.
Table of Contents
NEW ACCOUNTING STANDARDS
In February 2016, the FASB issued Accounting Standards Update (ASU) No. 2016-02, “Leases” (ASU No. 2016-02), which establishes comprehensive accounting and financial reporting requirements for leasing arrangements. This ASU supersedes the existing requirements in FASB ASC Topic 840, “Leases” (FASB ASC Topic 840), and requires lessees to recognize substantially all lease assets and lease liabilities on the balance sheet. The provisions of ASU No. 2016-02 also modify the definition of a lease and outline requirements for recognition, measurement, presentation and disclosure of leasing arrangements by both lessees and lessors. The ASU is effective for interim and annual periods beginning after December 15, 2018, and early adoption of the standard is permitted. Entities are required to adopt the ASU using a modified retrospective approach, subject to certain optional practical expedients, and apply the provisions of ASU No. 2016-02 to leasing arrangements existing at or entered into after the earliest comparative period presented in the financial statements.
ASU No. 2016-02 was amended in January 2018 by the provisions of ASU No. 2018-01, “Land Easement Practical Expedient for Transition to Topic 842” (ASU No. 2018-01), and in July 2018 by the provisions of ASU No. 2018-10, “Codification Improvements to Topic 842, Leases” (ASU No. 2018-10). In addition, ASU No. 2016-02 was further amended in July 2018 by the provisions of ASU No. 2018-11, “Targeted Improvements” (ASU No. 2018-11), and in December 2018 by the provisions of ASU No. 2018-20, “Narrow-Scope Improvements for Lessors” (ASU No. 2018-20).
ASU No. 2018-11 sets forth certain additional practical expedients for lessors and provides entities with an option to apply the provisions of ASU No. 2016-02, as amended, to leasing arrangements existing at or entered into after the ASU’s effective date of adoption (the “Optional Transition Method”). Entities that elect to utilize the Optional Transition Method would not apply the provisions of ASU No. 2016-02, as amended, to comparative periods presented in the financial statements.
We plan to adopt ASU No. 2016-02, as amended, effective January 1, 2019, utilizing the Optional Transition Method. Accordingly, the comparative periods presented in the financial statements prior to January 1, 2019, will be presented pursuant to the existing requirements of FASB ASC Topic 840 and not be adjusted upon the adoption of the ASU. We also expect to utilize the package of optional transition-related practical expedients set forth by ASU No. 2016-02, as amended, which permit entities to not reassess upon the adoption of the ASU certain historical conclusions regarding lease contract identification and classification, as well as the historical accounting treatment of initial direct costs (the “Package of Optional Practical Expedients”). For lease arrangements containing both lease and non-lease components, we will adopt the optional practical expedient to not separate lease components from non-lease components for all new or modified leases executed on or after the effective date of the ASU, subject to making any elections for leases after the effective date in new asset classes. Furthermore, we do not expect to record assets and liabilities on our consolidated balance sheet for new or existing lease arrangements with terms of 12 months or less.
The expected impact of the adoption of ASU No. 2016-02, as amended, relates primarily to our balance sheet, resulting from the initial recognition of lease liabilities and corresponding right-of-use assets for our existing population of operating leases, as well as enhanced disclosure of our leasing arrangements. We expect to recognize on our consolidated balance sheet approximately $1 billion of operating lease liabilities and corresponding right-of-use assets upon the adoption of ASU No. 2016-02, as amended. We have implemented a third-party lease accounting software solution to facilitate the ongoing accounting and financial reporting requirements of the ASU and also expect the adoption of the ASU to result in certain changes being made to our existing accounting policies and systems, business processes, and internal controls.
While our evaluation of ASU No. 2016-02, as amended, and related implementation activities approach completion, we continue to monitor proposals issued by the FASB to clarify the ASU. For additional information, see Note 26—New Accounting Standards, in the Notes to Consolidated Financial Statements.
Table of Contents
CRITICAL ACCOUNTING ESTIMATES
The preparation of financial statements in conformity with generally accepted accounting principles requires management to select appropriate accounting policies and to make estimates and assumptions that affect the reported amounts of assets, liabilities, revenues and expenses. See Note 1—Accounting Policies, in the Notes to Consolidated Financial Statements, for descriptions of our major accounting policies. Certain of these accounting policies involve judgments and uncertainties to such an extent there is a reasonable likelihood materially different amounts would have been reported under different conditions, or if different assumptions had been used. These critical accounting estimates are discussed with the Audit and Finance Committee of the Board of Directors at least annually. We believe the following discussions of critical accounting estimates, along with the discussions of contingencies and of deferred tax asset valuation allowances in this report, address all important accounting areas where the nature of accounting estimates or assumptions is material due to the levels of subjectivity and judgment necessary to account for highly uncertain matters or the susceptibility of such matters to change.
Oil and Gas Accounting
Accounting for oil and gas exploratory activity is subject to special accounting rules unique to the oil and gas industry. The acquisition of geological and geophysical seismic information, prior to the discovery of proved reserves, is expensed as incurred, similar to accounting for research and development costs. However, leasehold acquisition costs and exploratory well costs are capitalized on the balance sheet pending determination of whether proved oil and gas reserves have been discovered on the prospect.
Property Acquisition Costs
For individually significant leaseholds, management periodically assesses for impairment based on exploration and drilling efforts to date. For relatively small individual leasehold acquisition costs, management exercises judgment and determines a percentage probability that the prospect ultimately will fail to find proved oil and gas reserves and pools that leasehold information with others in the geographic area. For prospects in areas with limited, or no, previous exploratory drilling, the percentage probability of ultimate failure is normally judged to be quite high. This judgmental percentage is multiplied by the leasehold acquisition cost, and that product is divided by the contractual period of the leasehold to determine a periodic leasehold impairment charge that is reported in exploration expense.
This judgmental probability percentage is reassessed and adjusted throughout the contractual period of the leasehold based on favorable or unfavorable exploratory activity on the leasehold or on adjacent leaseholds, and leasehold impairment amortization expense is adjusted prospectively. At year-end 2018, the book value of the pools of property acquisition costs, that individually are relatively small and thus subject to the above-described periodic leasehold impairment calculation, was $468 million and the accumulated impairment reserve was $153 million. The weighted-average judgmental percentage probability of ultimate failure was approximately 71 percent, and the weighted-average amortization period was approximately two years. If that judgmental percentage were to be raised by 5 percent across all calculations, before-tax leasehold impairment expense in 2019 would increase by approximately $7 million. At year-end 2018, the remaining $3.6 billion of net capitalized unproved property costs consisted primarily of individually significant leaseholds, mineral rights held in perpetuity by title ownership, exploratory wells currently being drilled, suspended exploratory wells, and capitalized interest. Of this amount, approximately $2.6 billion is concentrated in 10 major development areas, the majority of which are not expected to move to proved properties in 2019. Management periodically assesses individually significant leaseholds for impairment based on the results of exploration and drilling efforts and the outlook for commercialization.
Exploratory Costs
For exploratory wells, drilling costs are temporarily capitalized, or “suspended,” on the balance sheet, pending a determination of whether potentially economic oil and gas reserves have been discovered by the drilling effort to justify development.
Table of Contents
If exploratory wells encounter potentially economic quantities of oil and gas, the well costs remain capitalized on the balance sheet as long as sufficient progress assessing the reserves and the economic and operating viability of the project is being made. The accounting notion of “sufficient progress” is a judgmental area, but the accounting rules do prohibit continued capitalization of suspended well costs on the expectation future market conditions will improve or new technologies will be found that would make the development economically profitable. Often, the ability to move into the development phase and record proved reserves is dependent on obtaining permits and government or co-venturer approvals, the timing of which is ultimately beyond our control. Exploratory well costs remain suspended as long as we are actively pursuing such approvals and permits, and believe they will be obtained. Once all required approvals and permits have been obtained, the projects are moved into the development phase, and the oil and gas reserves are designated as proved reserves. For complex exploratory discoveries, it is not unusual to have exploratory wells remain suspended on the balance sheet for several years while we perform additional appraisal drilling and seismic work on the potential oil and gas field or while we seek government or co-venturer approval of development plans or seek environmental permitting. Once a determination is made the well did not encounter potentially economic oil and gas quantities, the well costs are expensed as a dry hole and reported in exploration expense.
Management reviews suspended well balances quarterly, continuously monitors the results of the additional appraisal drilling and seismic work, and expenses the suspended well costs as a dry hole when it determines the potential field does not warrant further investment in the near term. Criteria utilized in making this determination include evaluation of the reservoir characteristics and hydrocarbon properties, expected development costs, ability to apply existing technology to produce the reserves, fiscal terms, regulations or contract negotiations, and our expected return on investment.
At year-end 2018, total suspended well costs were $856 million, compared with $853 million at year-end 2017. For additional information on suspended wells, including an aging analysis, see Note 8—Suspended Wells and Other Exploration Expenses, in the Notes to Consolidated Financial Statements.
Proved Reserves
Engineering estimates of the quantities of proved reserves are inherently imprecise and represent only approximate amounts because of the judgments involved in developing such information. Reserve estimates are based on geological and engineering assessments of in-place hydrocarbon volumes, the production plan, historical extraction recovery and processing yield factors, installed plant operating capacity and approved operating limits. The reliability of these estimates at any point in time depends on both the quality and quantity of the technical and economic data and the efficiency of extracting and processing the hydrocarbons.
Despite the inherent imprecision in these engineering estimates, accounting rules require disclosure of “proved” reserve estimates due to the importance of these estimates to better understand the perceived value and future cash flows of a company’s operations. There are several authoritative guidelines regarding the engineering criteria that must be met before estimated reserves can be designated as “proved.” Our geosciences and reservoir engineering organization has policies and procedures in place consistent with these authoritative guidelines. We have trained and experienced internal engineering personnel who estimate our proved reserves held by consolidated companies, as well as our share of equity affiliates.
Proved reserve estimates are adjusted annually in the fourth quarter and during the year if significant changes occur, and take into account recent production and subsurface information about each field. Also, as required by current authoritative guidelines, the estimated future date when an asset will be permanently shut down for economic reasons is based on 12-month average prices and current costs. This estimated date when production will end affects the amount of estimated reserves. Therefore, as prices and cost levels change from year to year, the estimate of proved reserves also changes. Generally, our proved reserves decrease as prices decline and increase as prices rise.
Table of Contents
Our proved reserves include estimated quantities related to production sharing contracts, reported under the “economic interest” method, as well as variable-royalty regimes, and are subject to fluctuations in commodity prices; recoverable operating expenses; and capital costs. If costs remain stable, reserve quantities attributable to recovery of costs will change inversely to changes in commodity prices. We would expect reserves from these contracts to decrease when product prices rise and increase when prices decline.
The estimation of proved developed reserves also is important to the income statement because the proved developed reserve estimate for a field serves as the denominator in the unit-of-production calculation of the DD&A of the capitalized costs for that asset. At year-end 2018, the net book value of productive properties, plants and equipment (PP&E) subject to a unit-of-production calculation was approximately $37 billion and the DD&A recorded on these assets in 2018 was approximately $5.5 billion. The estimated proved developed reserves for our consolidated operations were 3.0 billion BOE at the end of 2017 and 3.3 billion BOE at the end of 2018. If the estimates of proved reserves used in the unit-of-production calculations had been lower by 10 percent across all calculations, before-tax DD&A in 2018 would have increased by an estimated $611 million.
Impairments
Long-lived assets used in operations are assessed for impairment whenever changes in facts and circumstances indicate a possible significant deterioration in future cash flows expected to be generated by an asset group and annually in the fourth quarter following updates to corporate planning assumptions. If there is an indication the carrying amount of an asset may not be recovered, the asset is monitored by management through an established process where changes to significant assumptions such as prices, volumes and future development plans are reviewed. If, upon review, the sum of the undiscounted before-tax cash flows is less than the carrying value of the asset group, the carrying value is written down to estimated fair value. Individual assets are grouped for impairment purposes based on a judgmental assessment of the lowest level for which there are identifiable cash flows that are largely independent of the cash flows of other groups of assets—generally on a field-by-field basis for exploration and production assets. Because there usually is a lack of quoted market prices for long-lived assets, the fair value of impaired assets is typically determined based on the present values of expected future cash flows using discount rates believed to be consistent with those used by principal market participants, or based on a multiple of operating cash flow validated with historical market transactions of similar assets where possible. The expected future cash flows used for impairment reviews and related fair value calculations are based on judgmental assessments of future production volumes, commodity prices, operating costs and capital decisions, considering all available information at the date of review. Differing assumptions could affect the timing and the amount of an impairment in any period. See Note 9—Impairments, in the Notes to Consolidated Financial Statements, for additional information.
Investments in nonconsolidated entities accounted for under the equity method are reviewed for impairment when there is evidence of a loss in value and annually following updates to corporate planning assumptions. Such evidence of a loss in value might include our inability to recover the carrying amount, the lack of sustained earnings capacity which would justify the current investment amount, or a current fair value less than the investment’s carrying amount. When it is determined such a loss in value is other than temporary, an impairment charge is recognized for the difference between the investment’s carrying value and its estimated fair value. When determining whether a decline in value is other than temporary, management considers factors such as the length of time and extent of the decline, the investee’s financial condition and near-term prospects, and our ability and intention to retain our investment for a period that will be sufficient to allow for any anticipated recovery in the market value of the investment. Since quoted market prices are usually not available, the fair value is typically based on the present value of expected future cash flows using discount rates believed to be consistent with those used by principal market participants, plus market analysis of comparable assets owned by the investee, if appropriate. Differing assumptions could affect the timing and the amount of an impairment of an investment in any period. See the “APLNG” section of Note 6—Investments, Loans and Long-Term Receivables, in the Notes to Consolidated Financial Statements, for additional information.
Table of Contents
Asset Retirement Obligations and Environmental Costs
Under various contracts, permits and regulations, we have material legal obligations to remove tangible equipment and restore the land or seabed at the end of operations at operational sites. Our largest asset removal obligations involve plugging and abandonment of wells, removal and disposal of offshore oil and gas platforms around the world, as well as oil and gas production facilities and pipelines in Alaska. The fair values of obligations for dismantling and removing these facilities are recorded as a liability and an increase to PP&E at the time of installation of the asset based on estimated discounted costs. Estimating future asset removal costs is difficult. Most of these removal obligations are many years, or decades, in the future and the contracts and regulations often have vague descriptions of what removal practices and criteria must be met when the removal event actually occurs. Asset removal technologies and costs, regulatory and other compliance considerations, expenditure timing, and other inputs into valuation of the obligation, including discount and inflation rates, are also subject to change.
Normally, changes in asset removal obligations are reflected in the income statement as increases or decreases to DD&A over the remaining life of the assets. However, for assets at or nearing the end of their operations, as well as previously sold assets for which we retained the asset removal obligation, an increase in the asset removal obligation can result in an immediate charge to earnings, because any increase in PP&E due to the increased obligation would immediately be subject to impairment, due to the low fair value of these properties.
In addition to asset removal obligations, under the above or similar contracts, permits and regulations, we have certain environmental-related projects. These are primarily related to remediation activities required by Canada and various states within the United States at exploration and production sites. Future environmental remediation costs are difficult to estimate because they are subject to change due to such factors as the uncertain magnitude of cleanup costs, the unknown time and extent of such remedial actions that may be required, and the determination of our liability in proportion to that of other responsible parties. See Note 10—Asset Retirement Obligations and Accrued Environmental Costs, in the Notes to Consolidated Financial Statements, for additional information.
Projected Benefit Obligations
Determination of the projected benefit obligations for our defined benefit pension and postretirement plans are important to the recorded amounts for such obligations on the balance sheet and to the amount of benefit expense in the income statement. The actuarial determination of projected benefit obligations and company contribution requirements involves judgment about uncertain future events, including estimated retirement dates, salary levels at retirement, mortality rates, lump-sum election rates, rates of return on plan assets, future health care cost-trend rates, and rates of utilization of health care services by retirees. Due to the specialized nature of these calculations, we engage outside actuarial firms to assist in the determination of these projected benefit obligations and company contribution requirements. For Employee Retirement Income Security Act-governed pension plans, the actuary exercises fiduciary care on behalf of plan participants in the determination of the judgmental assumptions used in determining required company contributions into the plans. Due to differing objectives and requirements between financial accounting rules and the pension plan funding regulations promulgated by governmental agencies, the actuarial methods and assumptions for the two purposes differ in certain important respects. Ultimately, we will be required to fund all vested benefits under pension and postretirement benefit plans not funded by plan assets or investment returns, but the judgmental assumptions used in the actuarial calculations significantly affect periodic financial statements and funding patterns over time. Projected benefit obligations are particularly sensitive to the discount rate assumption. A 1 percent decrease in the discount rate assumption would increase projected benefit obligations by $1,000 million. Benefit expense is particularly sensitive to the discount rate and return on plan assets assumptions. A 1 percent decrease in the discount rate assumption would increase annual benefit expense by $110 million, while a 1 percent decrease in the return on plan assets assumption would increase annual benefit expense by $40 million. In determining the discount rate, we use yields on high-quality fixed income investments matched to the estimated benefit cash flows of our plans. We are also exposed to the possibility that lump sum retirement benefits taken from pension plans during the year could exceed the total of service and interest components of annual pension expense and trigger accelerated recognition of a portion of unrecognized net
Table of Contents
actuarial losses and gains. These benefit payments are based on decisions by plan participants and are therefore difficult to predict. In the event there is a significant reduction in the expected years of future service of present employees or elimination for a significant number of employees the accrual of defined benefits for some or all of their future services, we could recognize a curtailment gain or loss. See Note 18—Employee Benefit Plans, in the Notes to Consolidated Financial Statements, for additional information.
Contingencies
A number of claims and lawsuits are made against the company arising in the ordinary course of business. Management exercises judgment related to accounting and disclosure of these claims which includes losses, damages, and underpayments associated with environmental remediation, tax, contracts, and other legal disputes. As we learn new facts concerning contingencies, we reassess our position both with respect to amounts recognized and disclosed considering changes to the probability of additional losses and potential exposure. However, actual losses can and do vary from estimates for a variety of reasons including legal, arbitration, or other third-party decisions; settlement discussions; evaluation of scope of damages; interpretation of regulatory or contractual terms; expected timing of future actions; and proportion of liability shared with other responsible parties. Estimated future costs related to contingencies are subject to change as events evolve and as additional information becomes available during the administrative and litigation processes. For additional information on contingent liabilities, see the “Contingencies” section within “Capital Resources and Liquidity.”
Table of Contents
CAUTIONARY STATEMENT FOR THE PURPOSES OF THE “SAFE HARBOR” PROVISIONS OF THE PRIVATE SECURITIES LITIGATION REFORM ACT OF 1995
This report includes forward-looking statements within the meaning of Section 27A of the Securities Act of 1933 and Section 21E of the Securities Exchange Act of 1934. All statements other than statements of historical fact included or incorporated by reference in this report, including, without limitation, statements regarding our future financial position, business strategy, budgets, projected revenues, projected costs and plans, and objectives of management for future operations, are forward-looking statements. Examples of forward-looking statements contained in this report include our expected production growth and outlook on the business environment generally, our expected capital budget and capital expenditures, and discussions concerning future dividends. You can often identify our forward-looking statements by the words “anticipate,” “estimate,” “believe,” “budget,” “continue,” “could,” “intend,” “may,” “plan,” “potential,” “predict,” “seek,” “should,” “will,” “would,” “expect,” “objective,” “projection,” “forecast,” “goal,” “guidance,” “outlook,” “effort,” “target” and similar expressions.
We based the forward-looking statements on our current expectations, estimates and projections about ourselves and the industries in which we operate in general. We caution you these statements are not guarantees of future performance as they involve assumptions that, while made in good faith, may prove to be incorrect, and involve risks and uncertainties we cannot predict. In addition, we based many of these forward-looking statements on assumptions about future events that may prove to be inaccurate. Accordingly, our actual outcomes and results may differ materially from what we have expressed or forecast in the forward-looking statements. Any differences could result from a variety of factors, including, but not limited to, the following:
| • | Fluctuations in crude oil, bitumen, natural gas, LNG and natural gas liquids prices, including a prolonged decline in these prices relative to historical or future expected levels. |
|---|
| • | The impact of significant declines in prices for crude oil, bitumen, natural gas, LNG and natural gas liquids, which may result in recognition of impairment costs on our long-lived assets, leaseholds and nonconsolidated equity investments. |
|---|
| • | Potential failures or delays in achieving expected reserve or production levels from existing and future oil and gas developments, including due to operating hazards, drilling risks and the inherent uncertainties in predicting reserves and reservoir performance. |
|---|
| • | Reductions in reserves replacement rates, whether as a result of the significant declines in commodity prices or otherwise. |
|---|
| • | Unsuccessful exploratory drilling activities or the inability to obtain access to exploratory acreage. |
|---|
| • | Unexpected changes in costs or technical requirements for constructing, modifying or operating exploration and production facilities. |
|---|
| • | Legislative and regulatory initiatives addressing environmental concerns, including initiatives addressing the impact of global climate change or further regulating hydraulic fracturing, methane emissions, flaring or water disposal. |
|---|
| • | Lack of, or disruptions in, adequate and reliable transportation for our crude oil, bitumen, natural gas, LNG and natural gas liquids. |
|---|
| • | Inability to timely obtain or maintain permits, including those necessary for construction, drilling and/or development, or inability to make capital expenditures required to maintain compliance with any necessary permits or applicable laws or regulations. |
|---|
| • | Failure to complete definitive agreements and feasibility studies for, and to complete construction of, announced and future exploration and production and LNG development in a timely manner (if at all) or on budget. |
|---|
| • | Potential disruption or interruption of our operations due to accidents, extraordinary weather events, civil unrest, political events, war, terrorism, cyber attacks, and information technology failures, constraints or disruptions. |
|---|
| • | Changes in international monetary conditions and foreign currency exchange rate fluctuations. |
|---|
Table of Contents
| • | Changes in international trade relationships, including the imposition of trade restrictions or tariffs relating to crude oil, bitumen, natural gas, LNG, natural gas liquids and any materials or products (such as aluminum and steel) used in the operation of our business. |
|---|
| • | Reduced demand for our products or the use of competing energy products, including alternative energy sources. |
|---|
| • | Substantial investment in and development of alternative energy sources, including as a result of existing or future environmental rules and regulations. |
|---|
| • | Liability for remedial actions, including removal and reclamation obligations, under environmental regulations. |
|---|
| • | Liability resulting from litigation or our failure to comply with applicable laws and regulations. |
|---|
| • | General domestic and international economic and political developments, including armed hostilities; expropriation of assets; changes in governmental policies relating to crude oil, bitumen, natural gas, LNG and natural gas liquids pricing, regulation or taxation; the impact of and uncertainty surrounding the United Kingdom’s decision to withdraw from the European Union; and other political, economic or diplomatic developments. |
|---|
| • | Volatility in the commodity futures markets. |
|---|
| • | Changes in tax and other laws, regulations (including alternative energy mandates), or royalty rules applicable to our business, including changes resulting from the implementation and interpretation of the Tax Cuts and Jobs Act. |
|---|
| • | Competition in the oil and gas exploration and production industry. |
|---|
| • | Any limitations on our access to capital or increase in our cost of capital, including as a result of illiquidity or uncertainty in domestic or international financial markets. |
|---|
| • | Our inability to execute, or delays in the completion, of any asset dispositions or acquisitions we elect to pursue. |
|---|
| • | Potential failure to obtain, or delays in obtaining, any necessary regulatory approvals for asset dispositions or acquisitions or that such approvals may require modification to the terms of the transactions or the operation of our remaining business. |
|---|
| • | Potential disruption of our operations as a result of asset dispositions or acquisitions, including the diversion of management time and attention. |
|---|
| • | Our inability to deploy the net proceeds from any asset dispositions we undertake in the manner and timeframe we currently anticipate, if at all. |
|---|
| • | Our inability to liquidate the common stock issued to us by Cenovus Energy as part of our sale of certain assets in western Canada at prices we deem acceptable, or at all. |
|---|
| • | The operation and financing of our joint ventures. |
|---|
| • | The ability of our customers and other contractual counterparties to satisfy their obligations to us, including our inability to collect payments when due under our ICC settlement agreement with PDVSA. |
|---|
| • | Our inability to realize anticipated cost savings and expenditure reductions. |
|---|
| • | The factors generally described in Item 1A—Risk Factors in this 2018 Annual Report on Form 10-K and any additional risks described in our other filings with the SEC. |
|---|
Table of Contents
Previous: Item 6. SELECTED FINANCIAL DATA · Next: Item 7A. QUANTITATIVE AND QUALITATIVE DISCLOSURES ABOUT MARKET RISK