 filings.tools
Item 2. Management’s Discussion and Analysis of Financial Condition and
86K characters. Original on sec.gov · Markdown
Item 2. Management’s Discussion and Analysis of Financial Condition and
Management’s Discussion and Analysis of Financial Condition and
Results of Operations
Management’s Discussion and Analysis is the company’s
analysis of its financial performance and of significant
trends that may affect future performance.
It should be read in conjunction with the financial statements
and
notes.
It contains forward-looking statements
including, without limitation, statements
relating to the company’s
plans, strategies, objectives, expectations
and intentions that are made pursuant to
the “safe harbor” provisions of
the Private Securities Litigation Reform Act of 1995.
The words “anticipate,”
“believe,” “budget,”
“continue,”
“could,”
“effort,”
“estimate,”
“expect,”
“forecast,”
“goal,”
“guidance,”
“intend,”
“may,”
“objective,”
“outlook,”
“plan,” “potential,”
“predict,” “projection,”
“seek,” “should,”
“target,”
“will,” “would,”
and similar expressions
identify forward-looking statements.
The company does not undertake
to update, revise or correct any of the
forward-looking information unless required to do so under
the federal securities laws.
Readers are cautioned that
such forward-looking statements
should be read in conjunction with the company’s
disclosures under the heading:
“CAUTIONARY STATEMENT
FOR THE PURPOSES OF THE ‘SAFE HARBOR’ PROVISIONS
OF THE PRIVATE
SECURITIES
LITIGATION REFORM
ACT OF 1995,”
beginning on page 57.
The terms “earnings” and “loss” as used in Management’s
Discussion and Analysis refer to net income (loss)
attributable to ConocoPhillips.
Business Environment and Executive Overview
ConocoPhillips is the world’s
largest independent E&P company
with operations and activities in 14 countries.
Our
diverse, low cost of supply portfolio
includes resource-rich unconventional
plays in North America; conventional
assets in North America, Europe, and Asia; LNG
developments; oil sands in Canada; and an inventory
of global
conventional and unconventional
exploration prospects.
Headquartered in Houston, Texas,
at September 30,
2021, we employed approximately
9,900 people worldwide and had total assets
of $87 billion.
Completed and Announced Acquisitions
On January 15, 2021, we completed our acquisition
of Concho Resources Inc. (Concho), an independent
oil and gas
exploration and production
company with operations across
New Mexico and West Texas.
The addition of
complementary acreage in the Delaware
and Midland Basins resulted in a significant
Permian presence to augment
our leading unconventional positions
in the Eagle Ford, Bakken and
Montney.
In September 2021, we signed a definitive agreement
to acquire Shell Enterprises LLC
’s assets in
the Delaware
Basin (Shell Permian Acquisition) in an all-cash transaction
for $9.5 billion before customary
adjustments.
Assets
to be acquired include approximately
225,000 net acres and producing properties
located entirely in Texas,
as well
as over 600 miles of operated crude, gas
and water pipelines and infrastructure.
This acquisition further enhances
our already sizeable Permian
position, and we believe that our development,
operational and commercial
expertise will deliver significant incremental
value.
This acquisition is expected to close in the
fourth quarter of
2021, subject to regulatory approval
and other customary closing conditions.
Factors” for further discussion of the risks related to the Shell Permian Acquisition.
Overview
While commodity prices in the third quarter of 2021 improve
d
to pre-pandemic levels,
we expect that they will
continue to be cyclical and volatile.
Our view is that a successful business strategy
in the E&P industry must be
resilient in lower price environments,
while also retaining upside during periods
of higher prices.
As such, we are
unhedged, remain highly disciplined in our investment
decisions and continually monitor market
fundamentals
including OPEC plus updates regarding
supply guidance and inventory
levels.
Demand continues to recover but
has yet to regain pre
-pandemic levels.
The speed and extent of this recovery
will be influenced by continual easing
of COVID-19 restrictions that have
reduced economic activity and depressed
the demand for our products globally.
Management’s Discussion and Analysis
ConocoPhillips
2021 Q3 10-Q
The energy macro-environment
,
including energy transition, continues
to evolve.
We believe ConocoPhillips can
play a valued role in the energy
transition.
We have adopted a triple mandate
that simultaneously calls for
meeting energy pathway demand,
delivering competitive returns of and on
capital, and achieving our net-zero
ambition on operational (scope 1 and 2) emissions.
Our triple mandate is supported by financial principles
and capital allocation priorities that
should allow us to
deliver superior returns through the price cycles
.
Our financial principles consist of maintaining
balance sheet
strength, providing peer-leading
distributions, making disciplined investment
s, and delivering ESG excellence,
all of
which are in service to delivering competitive financial
returns.
Our completed and announced acquisitions
this
year further reinforce our value
proposition.
In the third quarter,
total company production
was 1,544 MBOED
resulting in cash provided by operating
activities of $4.8 billion.
In the nine-month period ended September 30,
2021, we generated $11.1 billion in
cash provided by operating activities,
returning $1.8 billion to shareholders
through dividends and $2.2 billion through share
repurchases.
We ended the quarter with cash,
cash equivalents
and short-term investments totaling
$10.5 billion.
In February
2021, we resumed our share repurchase
program at an annualized
level of $1.5 billion, which we
increased in the second quarter to an annualized
level of $2.5 billion for 2021.
Additionally, in
May 2021 we announced a paced monetization
program related to the
208 million shares of
Cenovus Energy (CVE) common shares
owned at that time.
We plan to fully dispose of our CVE shares
by year-end
2022, however,
the sales pace for the remaining shares will
be guided by market conditions,
and we retain
discretion to adjust accordingly.
During the third quarter of 2021, we sold 47 million shares
for $404 million and
inception to date have sold
67 million shares for $584 million.
Proceeds from the disposition of CVE shares
will be
deployed toward incremental
share repurchases.
In September 2021, we declared an increase
in the company’s quarterly
ordinary dividend from 43 cents per share
to 46 cents per share, representing
a 7 percent increase.
The dividend is payable on December 1, 2021,
to
stockholders of record
at the close of business on October 28, 2021.
Planned distributions for 2021 amount to
a total of approximately $6 billion
between dividends
and share
repurchases combined.
Additionally in September 2021, we demonstrated
our commitment to preserving our ‘A’
-rated balance sheet by
restating our intent
to reduce the company’s
gross debt by $5 billion over five years
through natural and
accelerated maturities.
In conjunction with our Shell Permian Acquisition announcement
,
we also communicated an increase
to our
planned disposition target that was
initially set in June at $2 to $3 billion by 2022.
We are now targeting
$4 to $5
billion in disposition proceeds by 2023, with the additional
$2 billion sourced primarily from the Permian
Basin as
part of our ongoing portfolio high-grading and
optimization efforts.
To date,
we have generated
$0.2 billion in
disposition proceeds.
The proceeds from these transactions will be used
in accordance with the company’s
priorities, including returns of capital
to shareholders and reduction of gross
debt.
Management’s Discussion and Analysis
ConocoPhillips
2021 Q3 10-Q
In September 2021, in conjunction with the announcement
of the Shell Permian Acquisition,
we reaffirmed our
commitment to ESG leadership and
excellence by announcing an improvement
to our operational GHG emissions
intensity reduction targets
by 2030.
Our Paris-aligned climate-risk commitment
now includes:
●
Net-zero ambition for
operational (scope 1 and 2) emissions
by 2050 with active advocacy for a price
on
carbon to address end-use (scope 3) emissions;
●
Targeting
a reduction in gross operated
and net equity operational GHG emissions intensity
by 40 to 50
percent from 2016 levels by 2030, an
improvement from the previously
announced target of 35 to 45
percent on only a gross operated
basis;
●
Zero routine flaring by 2030, with an
ambition to get there by 2025;
●
10 percent reduction target
for methane emissions intensity
by 2025 from a 2019 baseline, in addition to
the 65 percent reductions we have
made since 2015;
●
Adding continuous methane detection devices
to our operations,
with an initial focus on the larger Lower
48 facilities;
●
Dedicated low carbon technology
organization responsible
for identifying and prioritizing global emissions
reduction initiatives and opportunities associated
with the energy transition including carbon capture,
utilization and storage
(CCUS) and hydrogen; and
●
ESG performance factoring into
executive and employee compensation
programs.
Operationally,
we remain focused on safely
executing the business.
Production was 1,544 MBOED in the third
quarter of 2021, an increase of 477 MBOED or 45 percent,
compared with the third quarter of 2020, primarily
due
to the addition of approximately
343 MBOED in the Permian Basin from our Concho
acquisition and the absence of
last year’s economic curtailments
predominantly in North American operated
assets as a result of lower oil prices.
We re-invested
$1.3 billion into the business in the form of capital
expenditures during the third quarter,
with over
half of our investments focused
on flexible, short-cycle unconventional
plays in the Lower 48 segment where our
production is liquids-weighted and
has access to both domestic and export markets
.
For the full year,
we remain
disciplined with our allocation of capital with a
planned $5.3 billion program excluding
the impacts of the recently
announced Shell Permian Acquisition which is anticipated
to close in the fourth quarter.
Business Environment
Commodity prices are the most significant
factor impacting our profitability and
related reinvestment of operating
cash flows into our business.
Dynamics that could influence world energy markets
and commodity prices are
global economic health, supply or demand disruptions
or fears thereof caused by civil
unrest, global pandemics,
military conflicts, actions taken
by OPEC plus and other major oil producing countries,
environmental laws, tax
regulations, governmental policies,
and weather-related disruptions.
Our strategy is to create
value through price
cycles by delivering on the financial, operational
and ESG priorities that underpin our value proposition
.
Our earnings and operating cash flows
generally correlate with
price levels for crude oil and natural
gas, which are
subject to factors external
to the company and over which we have
no control.
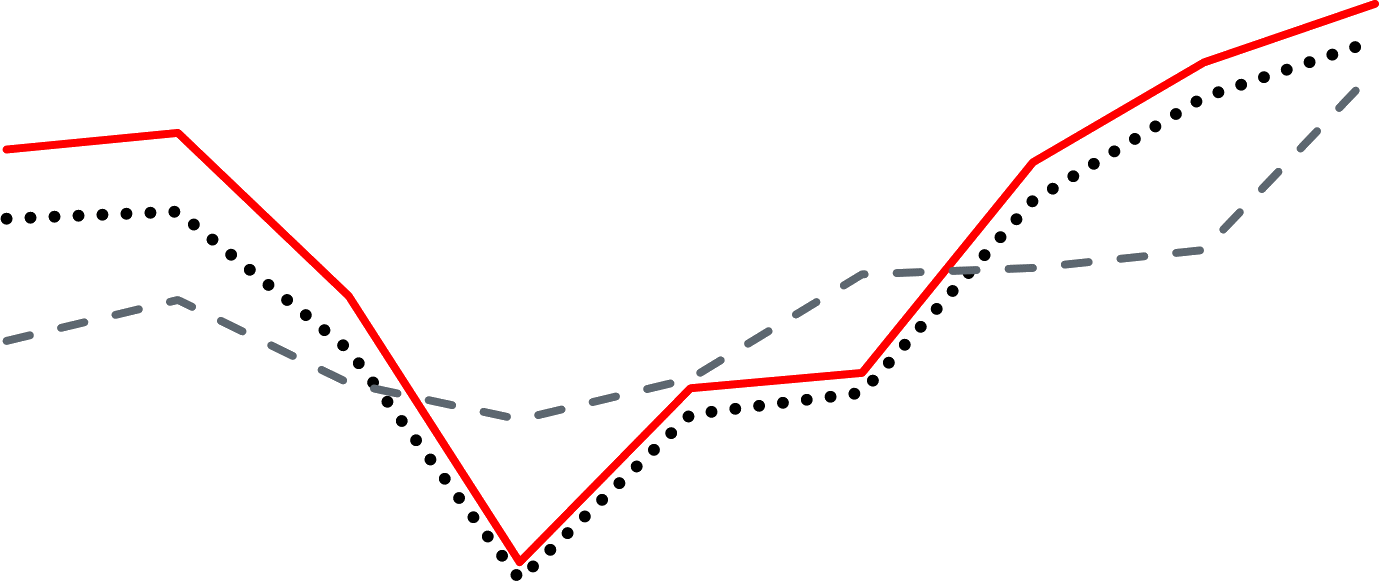
The following graph depicts the
trend in average benchmark prices
for WTI crude oil, Brent crude oil and
Henry Hub natural gas:
Management’s Discussion and Analysis
ConocoPhillips
2021 Q3 10-Q
-
Q3'19
Q4'19
Q1'20
Q2'20
Q3'20
Q4'20
Q1'21
Q2'21
Q3'21
WTI/Brent
$/Bbl
WTI Crude Oil, Brent Crude Oil and Henry Hub Natural Gas Prices
Quarterly Averages
WTI - $/Bbl
Brent - $/Bbl
HH - $/MMBTU
HH
$/MMBTU
Brent crude oil prices averaged
$73.47 per barrel in the third quarter of 2021, an increase
of 71 percent compared
with $43.00 per barrel in the third quarter of 2020.
WTI at Cushing crude oil prices averaged
$70.56 per barrel in
the third quarter of 2021, an increase of 72 percent
compared with $40.93 per barrel in the third
quarter of 2020.
Oil prices increased alongside the ongoing global economic
recovery following 2020’s
COVID impacts as well as
OPEC plus supply restraint,
continued capital discipline by U.S. E&P’s
and various unplanned supply disruptions in
producing countries.
Henry Hub natural gas prices averaged
$4.02 per MMBTU in the third quarter
of 2021, an increase of 103 percent
compared with $1.98 per MMBTU in the third
quarter of 2020.
Henry Hub prices have increased due to
healthy
domestic demand accompanied by record
levels of feedgas demand for
LNG exports to Europe and Asia.
Our realized bitumen price averaged
$41.19 per barrel in the third quarter of 2021, an
increase of 160 percent
compared with $15.87 per barrel in the third
quarter of 2020.
The increase in the third quarter of 2021 was driven
by higher blend price for Surmont sales, largely
attributed to a strengthening
of WTI price.
We continue to
optimize bitumen price realizations
through the utilization of downstream
transportation solutions
and
implementation of alternate
blend capability which results in lower diluent
costs.
For the third quarter of 2021 our total
average realized
price increased to $56.92 per BOE compared
with $30.94
per BOE in the third quarter of 2020.
Management’s Discussion and Analysis
ConocoPhillips
2021 Q3 10-Q
Key Operating and Financial
Summary
Significant items during the third quarter
of 2021 and recent announcements included the following:
●
Delivered strong operational
performance across the company’s
asset base, including successful planned
maintenance turnarounds, resulting
in third quarter production of 1,507 MBOED,
excluding Libya.
●
Net cash provided by operating
activities was $4.8 billion, exceeding capital
expenditures and investments
of $1.3 billion.
●
Distributed a total of $4.0 billion to
shareholders year to date,
comprised of $2.2 billion in share
repurchases and $1.8 billion in dividends as
part of the company’s plan to return
approximately $6.0
billion to shareholders during 2021.
●
Announced an increase to the quarterly dividend
by 7 percent to 46 cents per share.
●
Ended the quarter with cash and cash equivalents
totaling $9.8 billion and short-term investments
of $0.7
billion, equaling $10.5 billion in ending cash, cash equivalents
and short-term investments.
●
As part of a commitment to ESG excellence,
announced an improvement to
the company’s scope
1 and 2
GHG emissions intensity reduction targets
from a 2016 baseline to 40 to 50 percent
on a net equity and
gross operated basis, from
the previous target of 35 to 45 percent
on only a gross operated basis
.
●
Announced highly accretive pending acquisition
of Shell Enterprises LLC’s complementary
Delaware Basin
position in the Permian for $9.5 billion in cash,
before customary closing adjustments.
●
Generated approximately
$0.2 billion in disposition proceeds from Lower 48 noncore
asset sales as part of
the company’s target
to generate $4 to $5 billion in proceeds
by 2023.
Production from the disposed
assets average approximately
15 MBOED in the first nine months of 2021.
Outlook
Capital,
Cost and Production
Fourth-quarter 2021 production is
expected to be 1.53 to 1.57 MMBOED.
This guidance excludes Libya
and
impacts from pending acquisitions.
Guidance regarding capital and
cost are unchanged.
This production guidance includes the impact of planned conversion
of the significant majority of previously
acquired Concho two-stream contracted
volumes to a three-stream (crude oil,
natural gas and natural
gas liquids)
reporting basis as Concho volumes are integrated
into the company’s
commercial activities.
The conversion to
three-stream reporting is neutral
to earnings.
Effective in the fourth
quarter,
this conversion is expected
to add
production of approximately
40 MBOED and increase revenue and operating
costs by roughly $70 million.
Depreciation, Depletion and Amortization
Our proved reserve estimates
are greatly impacted by commodity
price fluctuations, and generally decrease
as
prices decline and increase as prices rise.
Proved reserves estimates
were updated and increased in the current
quarter utilizing historical twelve-month
first-of-month average
prices, which decreased third quarter DD&A
expense by approximately
$240 million before-tax.
As such, the company reduced its 2021 DD&A expense
guidance by $0.3 billion to $7.1 billion.
Results of Operations
ConocoPhillips
2021 Q3 10-Q
Results of Operations
Unless otherwise indicated, discussion of results for the three
-
and nine-month periods ended September 30, 2021,
is based on a comparison with the corresponding periods of 2020.
Consolidated Results
A summary of the company's net income (loss) attributable
to ConocoPhillips by business segment follows:
Millions of Dollars
Three Months Ended
Nine Months Ended
September 30
September 30
2021
2020
2021
2020
Alaska
$
(16)
(76)
Lower 48
1,631
(78)
3,274
(880)
Canada
(75)
(270)
Europe, Middle East and North Africa
Asia Pacific
Other International
(97)
(8)
(106)
Corporate and Other
(213)
(390)
(268)
(1,980)
Net income (loss) attributable to
ConocoPhillips
$
2,379
(450)
5,452
(1,929)
Net income (loss) attributable to
ConocoPhillips in the third quarter of 2021 increased
$2,829 million.
Third
quarter earnings were positively impacted
by:
●
Higher realized commodity prices.
●
Higher sales volumes, primarily due to our Concho
acquisition and absence of production curtailments in
our North American operated
assets.
●
Higher equity in earnings of affiliates, primarily due to
higher LNG sales prices.
●
A gain of $17 million after-tax on our CVE common shares
in the third quarter of 2021, as compared to a
$162 million after-tax loss on those shares
in the third quarter of 2020.
Third quarter 2021 net income increases
were partly offset by:
●
Higher production and operating expenses
and taxes other than income taxes,
primarily due to higher
sales volumes.
●
Higher DD&A expenses caused by higher production
volumes, partially offset by lower rates
driven from
price-related reserve revisions
due to higher commodity prices in 2021.
Net income (loss) attributable to
ConocoPhillips in the nine-month period ended September
30, 2021, increased
$7,381 million.
●
Inclusive of the third quarter gain associated
with our CVE common shares, in the nine-month period we
recognized a gain of $743 million
after-tax on our CVE common shares,
compared with an after-tax loss of
$1,302 million in the nine-month period of 2020.
In addition to the items detailed above,
earnings in the nine-month period were positively
impacted by:
●
Lower impairments of $611 million, primarily due to a
credit recognized for a decrease
in the ARO
estimate of a previously sold asset,
in which we retained the ARO liability,
as well as the absence of
impairments recognized in the prior period
for non-core gas assets
in our Lower 48 segment.
●
An after-tax gain of $194 million recognized
for a FID bonus associated with our
Australia-West divestiture
completed in the second quarter of 2020.
●
Lower exploration expenses
due to the absence of charges associated
with the early cancellation of our
2020 winter exploration program
as well as the absence of 2020 dry hole expenses in Alaska
,
and
unproved property impairment
and dry hole expenses for the Kamunsu
East Field in Malaysia,
which is no
longer in our development plans.
Results of Operations
ConocoPhillips
2021 Q3 10-Q
In addition to the items detailed above,
the increases in earnings in the nine-month period ended September
30,
2021, were partly offset by:
●
Absence of a $597 million after-tax gain
on our Australia-West
divestiture completed in May
●
Restructuring and transaction expenses
of $288 million after-tax associated
with the Concho acquisition
and mark-to-market impacts on certain
key employee compensation
programs.
●
Realized losses on hedges of $233 million after
-tax related to derivative
positions assumed through our
Concho acquisition.
These derivative positions were settled
entirely within the first quarter of 2021.
●
Absence of gains recorded in
2020 from foreign currency derivatives.
See the “Segment Results” section for additional
information.
Income Statement Analysis
Unless otherwise indicated, all results in Income Statement
Analysis are before-tax.
Sales and other operating revenues
for the three-
and nine-month periods of 2021 increased $6,940 million
and
$17,415 million, respectively,
mainly due to higher realized commodity
prices and higher sales volumes.
Equity in earnings of affiliates for
the three-
and nine-month periods of 2021 increased $204 million and
$154
million, respectively,
primarily due to higher earnings driven by higher LNG and
crude prices, partially offset by a
higher effective tax rate
related to equity method
investments in our Europe,
Middle East, and North Africa
segment.
Gain (loss) on dispositions in the third quarter of 2021 recognized
a loss of $179 million for the sale of noncore
assets in our Other International segment. Offsetting
the loss were gains recognized
for contingent payments
associated with previous dispositions
in our Canada and Lower 48 segments and gains
on sales of certain noncore
assets in our Lower 48 segment.
For the nine-month period of 2021, net gains on dispositions
decreased $257
million primarily due to the absence of a $587 million gain
associated with our Australia
-West divestiture,
partially
offset by a $200 million FID bonus recognized
in the first quarter of 2021 associated with
our Australia-West
divestiture.
Other income (loss) for the three-
and nine-month periods of 2021 increased $87 million
and $1,867 million,
respectively.
During these periods in 2021, we recognized
gains of $17 million and $743 million, respectively,
on
our CVE common shares,
compared with losses of $162 million and $1,302 million for
the same periods in 2020.
Purchased commodities for the three
-
and nine-month periods of 2021 increased $2,340 million and
$6,030
million, respectively,
primarily due to higher gas and crude prices and
volumes.
Production and operating expenses
for the three-
and nine-month periods of 2021 increased $426 million
and
$968 million, respectively,
primarily in line with higher production volumes.
Selling, general and administrative
expenses increased $307 million in the nine-month
period of 2021, primarily
due to transaction and restructuring
expenses associated with our Concho acquisition
,
and higher costs associated
with compensation and benefits, including mark-to
-market impacts of certain key
employee compensation
programs.
Exploration expenses for
the nine-month period of 2021 decreased $204 million, primarily
due to the absence of
charges associated with the early cancellation
of our 2020 winter exploration
program as well as the absence of
2020 dry hole expenses in Alaska and an unproved
property impairment and dry hole expenses related
to the
Kamunsu
East Field in Malaysia.
Results of Operations
ConocoPhillips
2021 Q3 10-Q
DD&A for the three-
and nine-month periods of 2021 increased $261 million and
$1,445 million, respectively,
mainly due to higher production volumes
partly offset by lower rates
from price-related reserve revisions
.
Impairments decreased $91 million in the third
quarter of 2021, primarily due to a decrease in an ARO
estimate for
a previously sold asset, in which we retained
the ARO liability.
The decrease of $611 million in the nine-month
period of 2021 was also impacted by the absence
of impairments
recorded for certain non-core
gas assets in our
Lower 48 segment.
Taxes
other than income taxes for
the three-
and nine-month periods of 2021 increased $224 million and
$584
million, respectively,
caused by higher sales volumes primarily in Lower
48 and higher commodity prices.
Foreign currency transaction
(gain) loss for the nine-month period of 2021 was
impaired by $107 million due to the
absence of derivative gains and
other remeasurements.
See
for information regarding
our income tax provision
(benefit) and effective tax
rate.
Results of Operations
ConocoPhillips
2021 Q3 10-Q
Summary Operating Statistics
Three Months Ended
Nine Months Ended
September 30
September 30
2021
2020
2021
2020
Average Net Production
Crude oil (MBD)
Consolidated operations
Equity affiliates
Total
crude oil
Natural gas liquids (MBD)
Consolidated operations
Equity affiliates
Total
natural gas liquids
Bitumen (MBD)
Natural gas (MMCFD)
Consolidated operations
2,144
1,201
2,143
1,353
Equity affiliates
1,033
1,034
1,055
1,042
Total
natural gas
3,177
2,235
3,198
2,395
Total Production
(MBOED)
1,544
1,067
1,553
1,112
Dollars Per Unit
Average Sales Prices
Crude oil (per bbl)
Consolidated operations*
$
70.39
39.49
64.62
39.04
Equity affiliates
73.44
37.56
65.71
38.22
Total
crude oil
70.43
39.45
64.63
39.02
Natural gas liquids (per bbl)
Consolidated operations
33.28
13.73
28.02
11.72
Equity affiliates
56.70
30.21
49.81
31.65
Total
natural gas liquids
34.79
15.29
29.58
13.45
Bitumen (per bbl)
41.19
15.87
36.61
2.90
Natural gas (per MCF)
Consolidated operations*
5.93
2.77
5.02
3.07
Equity affiliates
5.95
2.61
4.48
3.98
Total
natural gas
5.94
2.70
4.84
3.47
Millions of Dollars
Exploration Expenses
General administrative,
geological and geophysical,
lease rental, and other
$
Leasehold impairment
-
-
Dry holes
-
$
*Average sales prices, including the impact of hedges settling per initial contract terms in the first quarter of 2021 assumed in our
Concho
acquisition, were $63.95 per barrel for crude oil and $4.98 per mcf for natural gas for the nine-month
period ended September 30, 2021.
As of
March 31, 2021, we had settled all oil and gas hedging positions acquired from Concho.
Results of Operations
ConocoPhillips
2021 Q3 10-Q
We explore for,
produce, transport and market
crude oil, bitumen, natural gas,
LNG and NGLs on a worldwide
basis.
At September 30, 2021, our operations
were producing in the U.S., Norway,
Canada, Australia, Indonesia,
China, Malaysia, Qatar and Libya.
Total
production of 1,544 MBOED increased 477 MBOED or
45 percent in the third quarter of 2021 and 441
MBOED or 40 percent in the nine-month period of 2021, primarily
due to:
●
Higher volumes in the Lower 48 due to our Concho acquisition.
●
New wells online in the Lower 48, Canada, Norway
and Malaysia.
●
Higher volumes in our North American operated
assets due to the absence of production curtailments.
●
Higher production in Libya due the absence of a forced
shutdown of the Es Sider export terminal and
other eastern export terminals after
a period of civil unrest.
●
Improved well performance in
Norway,
Canada, Alaska and China.
Production increases
in the third quarter and in the nine-month period of 2021 were
partly offset by normal field
decline.
In addition to the normal field decline, in the nine-month period
of 2021, production also decreased due to:
●
Absence of production from Australia
-West due to our second quarter
2020 disposition.
●
Higher unplanned downtime in the Lower 48 due to Winter
Storm Uri, which impacted production by
approximately 50 MBOED in the first
quarter of 2021.
Production excluding Libya
for the third quarter of 2021 was
1,507 MBOED, an increase of 441 MBOED from the
same period a year ago.
After adjusting for closed acquisitions
and dispositions as well as estimated impacts from
the 2020 curtailment program,
third-quarter 2021 production increased
26 MBOED or 2 percent.
This increase
was primarily due to new production from
the Lower 48 and other development programs
across the portfolio,
partially offset by normal field decline.
Production from Libya averaged
37 MBOED.
Production excluding Libya
for the nine-month period of 2021 was 1,514 MBOED,
an increase of 406 MBOED from
the same period a year ago.
After adjusting for closed acquisitions
and dispositions as well as impacts from the
2020 curtailment program and
Winter Storm Uri impacts from 2021, production
increased 17 MBOED or 1 percent.
This increase was primarily due to new production
from the Lower 48 and other development
programs across the
portfolio, partially offset by
normal field decline.
Production from Libya averaged
39 MBOED.
Results of Operations
ConocoPhillips
2021 Q3 10-Q
Segment
Results
Alaska
Three Months Ended
Nine Months Ended
September 30
September 30
2021
2020
2021
2020
Net Income (Loss) Attributable
to ConocoPhillips
($MM)
$
(16)
(76)
Average Net Production
Crude oil (MBD)
Natural gas liquids (MBD)
Natural gas (MMCFD)
Total Production
(MBOED)
Average Sales Prices
Crude oil ($ per bbl)
$
72.55
40.88
66.78
41.92
Natural gas ($ per MCF)
2.63
2.48
3.06
2.71
The Alaska segment primarily explores for,
produces, transports and markets
crude oil, NGLs and natural gas.
As of
September 30, 2021, Alaska contributed
19 percent of our consolidated liquids production
and less than 1 percent
of our consolidated natural
gas production.
Net Income (Loss) Attributable to ConocoPhillips
Earnings from Alaska increased
$421 million in the third quarter of 2021 and $1,011 million
in the nine-month
period of 2021, respectively.
In the third quarter,
increases to earnings include:
●
Higher realized crude oil prices.
●
Lower DD&A expenses primarily driven by
lower production volumes and lower rates
in the quarter from
price-related reserve revisions
.
Offsets to the earnings increase include
:
●
Lower volumes due to a July turnaround
at our Western North Slope assets.
In addition to the items detailed above,
in the nine-month period of 2021, earnings also increased due to:
●
Lower exploration expenses
due to the absence of charges associated
with the early cancellation of our
2020 winter exploration program
as well as the absence of 2020 dry hole expenses.
●
Higher volumes due to the absence of production
curtailments.
In addition to the items detailed above,
in the nine-month period of 2021, earnings also decreased due to:
●
Higher DD&A expenses primarily caused by higher
rates in the first half of 2021.
Production
Average production
decreased 23 MBOED in the third quarter of 2021 and increased
1 MBOED in the nine-month
period of 2021, respectively.
In the third quarter of 2021, decreases to production
include:
●
Normal field decline.
●
A July turnaround at our Western
North Slope assets.
More than offsetting the items
detailed above, in the nine-month period of 2021, production
increased due to:
●
Absence of curtailments.
●
Improved performance in the Greater
Prudhoe Area and Western
North Slope assets.
Results of Operations
ConocoPhillips
2021 Q3 10-Q
Willow Update
In August 2021, an Alaska federal
judge vacated the U.S. government’s
approval granted
to our planned Willow
project previously approved
by the Bureau of Land Management (BLM) in October 2020.
The Department of
Justice did not appeal the decision and neither did we.
We believe the best path forward
is to work closely with
the BLM and engage directly with the relevant
agencies to address the matters
described in the decision.
In the
interim, we are continuing with FEED
work in service of a final investment decision.
Lower 48
Three Months Ended
Nine Months Ended
September 30
September 30
2021
2020
2021
2020
Net Income (Loss) Attributable
to ConocoPhillips
($MM)
$
1,631
(78)
3,274
(880)
Average Net Production*
Crude oil (MBD)
Natural gas liquids (MBD)
Natural gas (MMCFD)
1,389
1,389
Total Production
(MBOED)
Average Sales Prices
Crude oil ($ per bbl)**
$
68.59
36.43
63.14
34.02
Natural gas liquids ($ per bbl)
32.87
13.51
27.48
10.96
Natural gas ($ per MCF)**
4.63
1.63
4.13
1.45
*Subsequent to the current period, we anticipate a change in both product mix and average net production
attributed to the planned conversion
of previously acquired two-stream contracted volumes to three-stream.
**Average sales prices, including the impact of hedges settling per initial contract terms in the first quarter of 2021 assumed in our Concho
acquisition, were $61.90 per barrel for crude oil and $4.07 per mcf for natural gas for the nine-month
period ended September 30, 2021.
As of
March 31, 2021, we had settled all oil and gas hedging positions acquired from Concho.
The Lower 48 segment consists of operations
located in the U.S. Lower 48 states,
as well as producing properties in
the Gulf of Mexico.
As of September 30, 2021, the Lower 48 contributed
54 percent of our consolidated liquids
production and 65 percent of our consolidated
natural gas production.
Net Income (Loss) Attributable to ConocoPhillips
Earnings from the Lower 48 increased $1,709
million in the third quarter of 2021 and increased
$4,154 million in
the nine-month period of 2021, respectively.
In the third quarter,
increases to earnings include:
●
Higher realized crude oil, natural
gas and NGL prices.
●
Higher sales volumes of crude oil and natural
gas due to our Concho acquisition and the absence of
production curtailments.
Offsets to the earnings increase include:
●
Higher DD&A expenses, production and operating
expenses and taxes other than
income taxes primarily
due to higher production volumes.
Partially offsetting the increase
in DD&A expenses were lower rates
from price-related reserve revisions.
In addition to the items detailed above,
in the nine-month period of 2021, earnings also increased due to
:
●
The absence of $399 million in after-tax impairments
related to certain noncore
gas assets.
In addition to the items detailed above,
in the nine-month period of 2021, earnings also decreased due to:
●
Impacts resulting from our Concho Acquisition,
including higher selling, general and administrative
expenses for transaction and restructuring
charges, as well as realized losses
on derivative settlements.
and
Results of Operations
ConocoPhillips
2021 Q3 10-Q
Production
Average production increased
431 MBOED and 386 MBOED in the three-
and nine-month periods of 2021,
respectively.
In the third quarter,
increases to production include:
●
Higher volumes due to our Concho acquisition.
●
New wells online from our development programs
in Permian, Eagle Ford
and Bakken.
●
Absence of curtailments.
Offsets to the production increases
include:
●
Normal field decline.
In addition to normal field decline,
in the nine-month period of 2021, production also
decreased due to:
●
Higher unplanned downtime, primarily due to Winter
Storm Uri.
Asset Acquisitions and Dispositions
In September 2021, we announced the Shell Permian
Acquisition for $9.5 billion in cash before
customary
adjustments.
The transaction is anticipated to
close in the fourth quarter of 2021, subject to regulatory
approval
and other customary closing conditions.
See Item 1A “Risk Factors” for further discussion of risks
related to the Shell Permian Acquisition.
Additionally in September 2021, we completed
divestitures
of certain noncore assets in our Lower 48 segment
,
recording proceeds of approximately
$150 million.
Production from these assets averaged
approximately 15
MBOED in the nine-months ended September 30, 2021.
Results of Operations
ConocoPhillips
2021 Q3 10-Q
Canada
Three Months Ended
Nine Months Ended
September 30
September 30
2021
2020
2021
2020
Net Income (Loss) Attributable
to ConocoPhillips
($MM)
$
(75)
(270)
Average Net Production
Crude oil (MBD)
Natural gas liquids (MBD)
Bitumen (MBD)
Natural gas (MMCFD)
Total Production
(MBOED)
Average Sales Prices
Crude oil ($ per bbl)
$
58.99
25.16
53.81
15.39
Natural gas liquids ($ per bbl)
33.47
5.99
28.49
1.89
Bitumen ($ per bbl)
41.19
15.87
36.61
2.90
Natural gas ($ per MCF)
2.45
0.71
2.36
1.05
Average sales prices include unutilized transportation costs.
Our Canadian operations mainly consist
of the Surmont oil sands development in Alberta
and the liquids-rich
Montney unconventional
play in British Columbia.
As of September 30, 2021, Canada contributed 8 percent
of our
consolidated liquids production and
4 percent of our consolidated natural
gas production.
Net Income (Loss) Attributable to ConocoPhillips
Earnings from Canada increased $230 million
and $537 million,
respectively,
in the three-
and nine-month periods
of 2021.
Increases to earnings include:
●
Higher realized bitumen and crude oil prices.
●
Higher sales volumes in our Surmont and Montney
assets.
●
After-tax gains
on disposition related to contingent
payments of $77 million and $149 million in
the three-
and nine-month periods of 2021, respectively,
associated with the sale of certain assets
to CVE in 2017.
Offsets to the earnings increase include
:
●
Higher production and operating expenses
primarily due to increased Surmont and Montney
production.
Production
Average production
increased 29 MBOED in the third quarter of 2021 and
increased 34 MBOED in the nine-month
period of 2021, respectively.
In the third quarter,
increases to production include:
●
Absence of curtailments.
●
Absence of third quarter 2020 turnaround
activity in the Surmont.
●
New wells online in the Montney.
●
Production from our Kelt acquisition
completed in the third quarter of 2020.
Offsets to the production increases
include:
●
Higher well failures, plant power trips
and facility upsets in the Surmont.
In addition to the items detailed above,
in the nine-month period of 2021, production also increased
due to:
●
Improved well performance in
the Surmont.
Results of Operations
ConocoPhillips
2021 Q3 10-Q
Europe, Middle East and North Africa
Three Months Ended
Nine Months Ended
September 30
September 30
2021
2020
2021
2020
Net Income Attributable
to ConocoPhillips
($MM)
$
Consolidated Operations
Average Net Production
Crude oil (MBD)
Natural gas liquids (MBD)
Natural gas (MMCFD)
Total Production
(MBOED)
Average Sales Prices
Crude oil ($ per bbl)
$
72.43
41.79
65.94
43.72
Natural gas liquids ($ per bbl)
50.32
23.50
40.75
20.01
Natural gas ($ per MCF)
11.96
2.40
8.40
2.85
The Europe, Middle East and North Africa
segment consists of operations
principally located in the Norwegian
sector of the North Sea and the Norwegian Sea, Qatar,
Libya and commercial operations
in the U.K.
As of
September 30, 2021, our Europe, Middle East
and North Africa operations contributed
12 percent of our
consolidated liquids production and
14 percent of our consolidated natural
gas production.
Net Income Attributable to ConocoPhillips
Earnings from Europe, Middle East
and North Africa increased by $149 million and $283 million in the three
-
and
nine-month periods of 2021, respectively.
Increases to earnings include:
●
Higher realized natural
gas, crude oil and NGL prices.
●
Higher LNG sales prices, reflected in equity in earnings
of affiliates.
●
Higher sales volumes of crude oil and LNG.
Offsets to the earnings increases
include:
●
Higher taxes.
●
Higher production and operating expenses
and DD&A expenses.
Consolidated Production
Average consolidated
production increased 47 MBOED and 39 MBOED in the three
-
and nine-month periods of
2021, respectively.
Increases to production
include:
●
Higher production in Libya due to the absence of a
forced shutdown of the Es Sider export
terminal and
other eastern export terminals after
a period of civil unrest.
●
Improved well performance in
Norway.
●
New production from Norway
drilling activities including our Tor
II redevelopment project with first
production in December 2020.
Offsets to the production increases
include:
●
Normal field decline.
Results of Operations
ConocoPhillips
2021 Q3 10-Q
Asia Pacific
Three Months Ended
Nine Months Ended
September 30
September 30
2021
2020
2021
2020
Net Income Attributable
to ConocoPhillips
($MM)
$
Consolidated Operations
Average Net Production
Crude oil (MBD)
Natural gas liquids (MBD)
-
-
-
Natural gas (MMCFD)
Total Production
(MBOED)
Average Sales Prices
Crude oil ($ per bbl)
$
74.66
42.79
67.41
42.94
Natural gas liquids ($ per bbl)
-
-
-
33.21
Natural gas ($ per MCF)
6.66
5.33
6.30
5.42
The Asia Pacific segment has operations
in China, Indonesia, Malaysia and Australia.
As of September 30, 2021, Asia
Pacific contributed 7 percent
of our consolidated liquids production
and 17 percent of our consolidated natural
gas
production.
Net Income Attributable to ConocoPhillips
Earnings from Asia Pacific increased
$232 million in the third quarter of 2021 and decreased $196 million
in the nine-
month period of 2021, respectively.
In the third quarter,
increases to earnings include:
●
Higher crude oil and natural gas
prices.
●
Higher LNG sales prices, reflected in equity in earnings
of affiliates.
●
Lower DD&A expenses in the third quarter
of 2021 primarily driven by lower production volumes
and
lower rates from price-related
reserve revisions.
In addition to the items detailed above,
in the nine-month period of 2021, earnings also increased due to:
●
A $200 million gain on disposition related
to a FID bonus from our Australia-West
divestiture.
For additional
information related to
this FID bonus, see
and
●
Lower production and operating
expenses related to the absence of Australia
-West.
Offsetting the items detailed
above, in the nine-month period of 2021, earnings decreased
due to:
●
Absence of a $597 million after-tax gain
related to our Australia
-West divestiture.
●
Absence of sales volumes associated with Australia
-West.
Consolidated Production
Average consolidated
production decreased 6 MBOED and 22 MBOED in the three
-
and nine-month periods of 2021,
respectively.
In the third quarter,
the primary decrease to production was
normal field decline.
Partly offsetting the decrease
in production was:
●
Increased production in Malaysia
associated with Malikai Phase 2 first
production and ramp-up.
●
Bohai Bay development activity in
China.
In addition to normal field decline, in the nine-month period
of 2021, production also decreased due to:
●
The divestiture of our Australia
-West assets that contributed
23 MBOED in the nine-month period of 2020.
In addition to the items detailed above,
in the nine-month period of 2021, production also increased
due to:
●
The absence of curtailments across the segment
and increased demand in Indonesia from coal supply
restrictions.
Results of Operations
ConocoPhillips
2021 Q3 10-Q
Other International
Three Months Ended
Nine Months Ended
September 30
September 30
2021
2020
2021
2020
Net Income (Loss) Attributable
to ConocoPhillips
($MM)
$
(97)
(8)
(106)
The Other International segment consists
of exploration and appraisal
activities in Colombia as well as
contingencies associated with prior operations
in other countries.
Earnings from our Other International
operations decreased $89 million and $120
million in the three-
and nine-
month periods of 2021, respectively,
due to a loss on divestiture related to
our Argentina exploration
interests in
the third quarter as well as an absence of a $29 million after
-tax benefit to earnings from the dismissal
of
arbitration related to
prior operations in Senegal recognized
in the first quarter of 2020.
for additional
information
regarding the divestiture.
Corporate and Other
Millions of Dollars
Three Months Ended
Nine Months Ended
September 30
September 30
2021
2020
2021
2020
Net Loss Attributable to
ConocoPhillips
Net interest expense
$
(176)
(179)
(627)
(508)
Corporate general and administrative
expenses
(57)
(50)
(251)
(90)
Technology
(6)
(8)
(16)
Other income (expense)
(153)
(1,366)
$
(213)
(390)
(268)
(1,980)
Net interest expense consists
of interest and financing expense,
net of interest income and capitalized
interest.
Net interest expense increased
by $119 million in the nine-month period of 2021 primarily due
to higher debt
balances assumed due to our Concho acquisition.
Corporate G&A expenses include compensation
programs and staff
costs.
These expenses increased by $7 million
in the three-month period of 2021 primarily due to mark
to market adjustments
associated with certain
compensation programs.
For the nine-month period of 2021, Corporate
G&A expenses increased by $161 million
primarily due to restructuring expenses associated
with our Concho acquisition.
Technology includes
our investment in new technologies
or businesses, as well as licensing revenues.
Activities are
focused on both conventional
and tight oil reservoirs, shale gas,
heavy oil, oil sands, enhanced oil recovery,
as well
as LNG.
Earnings from Technology
increased $47 million in the nine-month period of 2021
primarily due to higher
licensing revenues.
Other income (expense) or “Other” includes certain corporate
tax-related items, foreign
currency transaction gains
and losses, environmental costs
associated with sites no longer in operation,
other costs not directly associated
with an operating segment, premiums
incurred on the early retirement of debt,
holding gains or losses on equity
securities, and pension settlement expense.
For the three-
and nine-month periods of 2021, “Other” increased
$179 million and $1,945 million, respectively.
During these periods in 2021, we recognized
gains of $17 million and
$743 million, respectively,
on our CVE common shares, compared
with losses of $162 million and $1,302 million for
the same periods in 2020.
Partially offsetting the impact on
the nine-month period was the release of a $92
million deferred tax asset
associated with our Australia West
divestiture.
Capital Resources and Liquidity
ConocoPhillips
2021 Q3 10-Q
Capital Resources and Liquidity
Financial Indicators
Millions of Dollars
September 30
December 31
2021
2020
Cash and cash equivalents
$
9,833
2,991
Short-term investments
3,609
Total
debt
19,668
15,369
Total
equity
44,115
29,849
Percent of total debt to
capital*
%
Percent of floating-rate
debt to total debt
%
*Capital includes total debt and total equity.
To meet our
short-
and long-term liquidity requirements,
we look to a variety of funding sources,
including cash
generated from operating
activities, our commercial paper and credit
facility programs, and our ability
to sell
securities using our shelf registration
statement.
During the first nine months of 2021, the primary uses of our
available cash were $3.8 billion to
support our ongoing capital expenditures
and investments program
;
$2.2 billion
to repurchase common stock
,
$1.8 billion to pay dividends, and $1.1 billion of hedging, transaction
and
restructuring costs.
During the first nine months of 2021, our cash and cash
equivalents increased by $6.8 billion
to $9.8 billion.
At September 30, 2021, we had cash
and cash equivalents of $9.8 billion, short-term investments
of $0.7 billion,
and available borrowing capacity
under our credit facility of $6.0 billion, totaling
approximately $16.5 billion of
liquidity.
We believe current cash
balances and cash generated by
operating activities, together with access
to
external sources of funds as described below in the “Significant
Changes in Capital” section, will be sufficient to
meet our funding requirements in the near-
and long-term, including our capital spending prog
ram,
acquisitions,
dividend payments and debt obligations
.
On September 20, 2021, we signed a definitive agreement
for the Shell Permian Acquisition for
$9.5 billion in cash
before customary adjustments
.
The effective date of the transaction
is July 1, 2021, and we expect to close in the
fourth quarter of 2021 subject to regulatory
clearance and the satisfaction
of other customary closing conditions.
The transaction will be funded from available
cash, and we expect our remaining cash
to meet our obligations and
business needs.
Significant Changes in Capital
Operating Activities
Cash provided by operating activities was
$11.1 billion for the first nine months
of 2021, compared with $3.1
billion for the corresponding period of 2020.
The increase in cash provided by operating
activities is primarily due
to higher realized commodity prices and
higher sales volumes mostly due to our acquisition of Concho.
The
increase in cash provided by operating
activities was partly offset by the settlement
of all oil and gas hedging
positions acquired from Concho,
and transaction and restructuring cost
s.
Our short-
and long-term operating cash flows
are highly dependent upon prices for crude oil, bitumen,
natural
gas, LNG and NGLs.
Prices and margins in our industry have historically
been volatile and are driven by market
conditions over which we have
no control.
Absent other mitigating factors,
as these prices and margins fluctuate,
we would expect a corresponding change
in our operating cash flows.
Capital Resources and Liquidity
ConocoPhillips
2021 Q3 10-Q
The level of production volumes, as well as
product and location mix, impacts our cash
flows.
Future production is
subject to numerous uncertainties, including,
among others, the volatile crude oil and natural
gas price
environment, which may impact
investment decisions; the effects
of price changes on production sharing and
variable-royalty contracts;
acquisition and disposition of fields; field production decline rates;
new technologies;
operating efficiencies; timing of startups
and major turnarounds; political instability;
impacts of a global pandemic;
weather-related disruptions; and
the addition of proved reserves through
exploratory success and their timely and
cost-effective development.
While we actively manage these factors,
production levels can cause variability
in
cash flows, although generally this
variability has not been as significant as that caused
by commodity prices.
To maintain
or grow our production volumes, we must
continue to add to our proved
reserve base.
See the
“Capital Expenditures and Investments”
section, for information about
our capital expenditures and investments.
On January 15, 2021, we assumed financial derivative instruments
consisting of oil and natural gas
swaps in
connection with our acquisition of Concho.
At March 31, 2021, all oil and natural
gas derivative financial
instruments acquired from Concho
were contractually settled.
In the first six months of 2021, we paid $761 million
relating to these settlements.
Investing Activities
For the first nine months of 2021, we invested
$3.8 billion in capital expenditures.
Our 2021 operating plan capital
expenditures is currently expected
to be $5.3 billion compared with $4.7 billion in 2020.
See the “Capital
Expenditures and Investments”
section, for information about our capital
expenditures and investments.
For additional information on Acquisitions
& Dispositions discussed below,
We completed our acquisition
of Concho on January 15, 2021.
The assets acquired in the transaction
included
$382 million of cash.
In May 2021, we announced and began
a paced monetization of our investment
in CVE common shares with the
plan to direct proceeds toward
our existing share repurchase program.
We expect to fully dispose
of our CVE
shares by year-end 2022, however,
the sales pace will be guided by market conditions,
and we retain discretion to
adjust accordingly.
Since we began our monetization program,
we have sold 67 million CVE shares,
representing
32% of our holdings at December 31, 2020, receiving $569
million of cash proceeds.
Other proceeds
from dispositions include our sale of certain noncore
assets in our Lower 48 segment for approximately
$150
million and contingent payments
associated with previous divestitures.
In September 2021, we signed a definitive agreement
to acquire the Shell Permian assets
for $9.5 billion, before
customary adjustments.
Under the terms of the agreement, we paid a deposit
of $475 million which is presented
within “Cash Flows from Investing
Activities - Other” on our consolidated statement
of cash flows.
“Risk Factors” for further discussion of risks related to the Shell Permian Acquisition.
We invest in short
-term investments as part of our
cash investment strategy,
the primary objective of which is to
protect principal, maintain liquidity
and provide yield and total returns;
these investments include time deposits,
commercial paper,
as well as debt securities classified as available
for sale.
Funds for short-term needs
to support
our operating plan and provide resiliency
to react to short-term price volatility
are invested in highly liquid
instruments with maturities within the year.
Funds we consider available to maintain
resiliency in longer term
price downturns and to capture opportunities
outside a given operating plan may
be invested in instruments
with
maturities greater than one year.
Investing activities in the first
nine months of 2021 included net sales of $2,846 million of investments.
We sold
$2,991 million of short-term instruments
and invested $145 million in long-term instruments
.
Capital Resources and Liquidity
ConocoPhillips
2021 Q3 10-Q
Financing Activities
We have a revolving
credit facility totaling $6.0 billion,
expiring in May 2023.
Our revolving credit facility
may be
used for direct bank borrowings,
the issuance of letters of credit totaling
up to $500 million, or as support for our
commercial paper program.
With no commercial paper outstanding
and no direct borrowings or letters
of credit,
we had access to $6.0 billion in available borrowing
capacity under our revolving credit
facility at September 30,
On January 15, 2021, we completed the acquisition
of Concho in an all-stock transaction.
In the acquisition, we
assumed Concho’s publicly
traded debt, which was recorded
at fair value of $4.7 billion on the acquisition
date.
In
June 2021, we reaffirmed our commitment
to preserving our ‘A’
-rated balance sheet by restating
our intent to
reduce gross debt by $5 billion over
the next five years, driving a more
resilient and efficient capital
structure.
The current credit ratings on our
long-term debt are:
●
Fitch: “A”
with a “stable” outlook
●
S&P:
“A-” with a “stable”
outlook
●
Moody’s: “A3”
with a “positive” outlook
for additional information on our Concho
acquisition and
for additional information on debt
,
revolving credit facility and credit
ratings.
Certain of our project-related
contracts, commercial contracts
and derivative instruments contain
provisions
requiring us to post collateral.
Many of these contracts and instruments
permit us to post either cash or letters
of
credit as collateral.
At September 30, 2021 and December 31, 2020, we
had direct bank letters of credit
of $281
million and $249 million, respectively,
which secured performance obligations
related to various purchase
commitments incident to the ordinary
conduct of business.
In the event of credit ratings
downgrades, we may be
required to post additional letters
of credit.
Shelf Registration
We have a universal
shelf registration statement
on file with the SEC under which we have the
ability to issue and
sell an indeterminate number of various
types of debt and equity securities.
Capital Requirements
For information about our capital
expenditures and investments,
see the “Capital Expenditures and Investments”
section.
In addition to our capital expenditure and
investments
program, we anticipate completing
the Shell
Permian Acquisition in the fourth quarter
for $9.5 billion before customary
adjustments.
Our debt balance at September 30, 2021, was
$19.7 billion, compared with $15.4 billion at December 31, 2020.
The net increase is primarily due to $4.7 billion of debt assumed
in the Concho acquisition.
The current portion of
debt, including payments for finance
leases, is $920 million.
Payments will be made using current
cash balances
and cash generated by
operations.
We believe in delivering va
lue to our shareholders through
a growing and sustainable dividend supplemented
by
additional returns of capital, including share
repurchases.
In 2020, we paid $1.8 billion, equating to $1.69 per
share of common stock, in dividends.
In the first nine months of 2021, we paid dividends totaling
$1.8 billion, the
equivalent of $1.29 per share.
On September 20, 2021, we announced an increase
in our quarterly dividend from
$0.43 per share to $0.46 per share,
representing a 7 percent increase.
The dividend is payable December 1, 2021,
to stockholders of record
at the close of business on October 28, 2021.
We anticipate returning
approximately
$2.4 billion to shareholders in dividends
in 2021, or $1.75 per share.
Capital Resources and Liquidity
ConocoPhillips
2021 Q3 10-Q
In late 2016, we initiated our current
share repurchase program,
which has a total program authorization
of $25
billion.
In May 2021, we began a paced monetization
of our CVE shares, the proceeds of which, have
been applied
to share repurchases.
The pace of CVE share sales will be guided by market conditions,
and we retain the
discretion to adjust accordingly.
In the nine months ended September 30, 2021, we repurchased
39.3 million
shares at a cost of $2,224 million, $561 million of which
was funded using CVE share proceeds.
Since the inception
of the share repurchase program,
we have repurchased 228 million shares
at a cost of $12.7 billion.
Our total
planned distributions for 2021, including dividends
and share repurchases, is approximately
$6.0 billion.
Our dividend and share repurchase programs
are subject to numerous considerations,
including market conditions,
management discretion and other factors.
See “Item 1A—Risk Factors
– Our ability to declare and pay dividends
and repurchase shares is subject to certain
considerations” in Part
I—Item 1A in our 2020 Annual Report on Form
10-K.
Capital Expenditures and Investments
Millions of Dollars
Nine Months Ended
September 30
2021
2020
Alaska
$
Lower 48
2,250
1,398
Canada
Europe, Middle East and North Africa
Asia Pacific
Other International
Corporate and Other
Capital expenditures and investments
$
3,767
3,657
During the first nine months of 2021, capital expenditures
and investments supported
key development programs,
primarily:
●
Development activities in the Lower 48, primarily Permian,
Eagle Ford and Bakken.
●
Appraisal and development activities in Alaska
related to the Western
North Slope and development
activities in the Greater Kuparuk Area.
●
Appraisal activities in liquids-rich plays
and optimization of oils sands development in Canada.
●
Continued development activities across
assets in Norway.
●
Continued development activities in China,
Malaysia and Indonesia.
In February 2021, we announced 2021 operating plan
capital expenditures of $5.5 billion.
In June 2021, we
reduced capital guidance to $5.3 billion, recognizing
synergistic savings
from our Concho acquisition.
Capital Resources and Liquidity
ConocoPhillips
2021 Q3 10-Q
Guarantor Summarized Financial
Information
We have various
cross guarantees among our Obligor group;
ConocoPhillips, ConocoPhillips Company
and
Burlington Resources LLC,
with respect to publicly held debt securities.
ConocoPhillips Company is 100 percent
owned by ConocoPhillips.
Burlington Resources LLC is
100 percent owned by ConocoPhillips
Company.
ConocoPhillips and/or ConocoPhillips
Company have fully and unconditionally
guaranteed the payment obligations
of Burlington Resources LLC,
with respect to its publicly held debt securities.
Similarly, ConocoPhillips
has fully and
unconditionally guaranteed the payment
obligations of ConocoPhillips Company
with respect to its publicly held
debt securities.
In addition, ConocoPhillips Company has
fully and unconditionally guaranteed the payment
obligations of ConocoPhillips with respect
to its publicly held debt securities.
All guarantees are joint and several.
The following tables present summarized
financial information for
the Obligor Group, as defined below:
●
The Obligor Group will reflect guarantors
and issuers of guaranteed securities consisting
of
ConocoPhillips, ConocoPhillips Company
and Burlington Resources LLC.
●
Consolidating adjustments for elimination
of investments in and transactions
between the collective
guarantors and issuers
of guaranteed securities are reflected
in the balances of the summarized financial
information.
●
Non-Obligated Subsidiaries are excluded
from the presentation.
Upon completion of the Concho acquisition on January 15, 2021, we assumed
Concho’s publicly traded
debt of
approximately $3.9 billion in aggregate
principal amount, which was recorded
at fair value of $4.7 billion on the
acquisition date.
We completed a debt exchange
offer that settled on February
8, 2021, of which 98 percent, or
approximately $3.8 billion in aggregate
principal amount of Concho’s
notes, were tendered and accepted
for new
debt issued by ConocoPhillips.
The new debt issued in the exchange is fully and
unconditionally guaranteed by
ConocoPhillips Company.
Both the guarantor and issuer of the exchange
debt is reflected within the Obligor Group
presented here.
See
and
for additional information relating
to the Concho transaction.
Transactions
and balances reflecting activity between the Obligors
and Non-Obligated Subsidiaries
are presented
below:
Summarized Income Statement
Data
Millions of Dollars
Nine Months Ended
September 30, 2021
Revenues and Other Income
$
20,893
Income (loss) before income taxes*
5,445
Net income (loss)
5,452
Net Income (Loss) Attributable
to ConocoPhillips
5,452
*Includes approximately $3.6 billion of purchased commodities expense for transactions with Non-Obligated Subsidiaries.
Summarized Balance Sheet Data
Millions of Dollars
September 30
December 31
2021
2020
Current assets
$
12,955
8,535
Amounts due from Non-Obligated Subsidiaries, current
1,194
Noncurrent assets
59,997
37,180
Amounts due from Non-Obligated Subsidiaries, noncurrent
8,223
7,730
Current liabilities
7,059
3,797
Amounts due to Non-Obligated Subsidiaries,
current
2,778
1,365
Noncurrent liabilities
28,336
18,627
Amounts due to Non-Obligated Subsidiaries,
noncurrent
10,304
3,972
Capital Resources and Liquidity
ConocoPhillips
2021 Q3 10-Q
Contingencies
A number of lawsuits involving a variety
of claims arising in the ordinary course of business
have been filed against
ConocoPhillips.
We also may be required
to remove or mitigate
the effects on the environment
of the placement,
storage, disposal or release of
certain chemical, mineral and petroleum
substances at various
active and inactive
sites.
We regularly assess the need for accounting
recognition or disclosure of these contingencies.
In the case of
all known contingencies (other than those related
to income taxes), we accrue
a liability when the loss is probable,
and the amount is reasonably estimable.
If a range of amounts can be reasonably
estimated and no amount within
the range is a better estimate
than any other amount, then the low end of the range
is accrued.
We do not reduce
these liabilities for potential insurance
or third-party recoveries.
We accrue receivables for
insurance or other
third-party recoveries when applicable.
With respect to income tax-related
contingencies, we use a cumulative
probability-weighted loss accrual
in cases where sustaining a tax
position is less than certain.
Based on currently available information,
we believe it is remote that future
costs related to known
contingent
liability exposures will exceed
current accruals by an amount that
would have a material adverse
impact on our
consolidated financial statements.
Legal and Tax
Matters
We are subject to various
lawsuits and claims including but not limited to matters
involving oil and gas royalty
and
severance tax payments,
gas measurement and valuation
methods, contract disputes,
environmental damages,
climate change, personal injury,
and property damage.
Our primary exposures for such matters
relate to alleged
royalty and tax underpayments
on certain federal, state
and privately owned properties, claims
of alleged
environmental contamination
from historic operations,
and other contract disputes.
We will continue to defend
ourselves vigorously in these matters.
Our legal organization
applies its knowledge, experience and professional
judgment to the specific characteristics
of our cases, employing a litigation management
process to manage and monitor the legal
proceedings against us.
Our process facilitates the
early evaluation and quantification
of potential exposures in individual cases.
This
process also enables us to track those cases
that have been scheduled for trial and/or
mediation.
Based on
professional judgment and experience
in using these litigation management
tools and available information
about
current developments in all our cases,
our legal organization regularly
assesses the adequacy of current accruals
and determines if adjustment of existing
accruals, or establishment of new accruals, is
required.
Environmental
We are subject to the same numerous
international, federal,
state and local environmental
laws and regulations as
other companies in our industry.
For a discussion of the most significant of these environmental
laws and
regulations, including those with associated
remediation obligations, see the “Environmental”
section in
Management’s Discussion and Analysis
of Financial Condition and Results of Operations on pages
64–66 of our
2020 Annual Report on Form 10-K.
We occasionally receive requests
for information or notices of potential
liability from the EPA
and state
environmental agencies alleging
that we are a potentially responsible
party under the Federal Comprehensive
Environmental Response,
Compensation and Liability Act (CERCLA) or an equivalent
state statute.
On occasion, we
also have been made a party to cost
recovery litigation by those agencies
or by private parties.
These requests,
notices and lawsuits assert potential liability for
remediation costs at various
sites that typically are not owned by
us, but allegedly contain waste
attributable to our past operations.
As of September 30, 2021, there were 15 sites
around the U.S. in which we were
identified as a potentially responsible
party under CERCLA and comparable state
laws.
At September 30, 2021, our balance sheet included
a total environmental
accrual of $191 million, compared with
$180 million at December 31, 2020, for remediation
activities in the U.S. and Canada.
We expect to incur a
substantial amount of these expe
nditures within the next 30 years.
Capital Resources and Liquidity
ConocoPhillips
2021 Q3 10-Q
Notwithstanding any of the foregoing,
and as with other companies engaged in similar businesses,
environmental
costs and liabilities are inherent
concerns in our operations and products,
and there can be no assurance that
material costs and liabilities will not be incurred.
However,
we currently do not expect any material
adverse effect
upon our results of operations or financial position
as a result of compliance with current environmental
laws and
regulations.
Environmental Litigation
Several Louisiana parishes and the State
of Louisiana have filed 43 lawsuits under Louisiana’s
State and Local
Coastal Resources Management
Act (SLCRMA) against oil and gas
companies, including ConocoPhillips, seeking
compensatory damages for contamination
and erosion of the Louisiana coastline allegedly
caused by historical oil
and gas operations.
ConocoPhillips entities are defendants
in 22 of the lawsuits and will vigorously defend
against
them.
Because Plaintiffs’ SLCRMA theories are
unprecedented, there is uncertainty
about these claims (both as to
scope and damages) and we continue to
evaluate our exposure in these
lawsuits.
Climate Change
Continuing political and social attention
to the issue of global climate change has resulted
in a broad range of
proposed or promulgated
state, national and international
laws focusing on GHG reduction.
These proposed or
promulgated laws apply
or could apply in countries where we have
interests or may have
interests in the future.
Laws in this field continue to evolve,
and while it is not possible to accurately estimate
either a timetable for
implementation or our future compliance costs
relating to implementation, such
laws, if enacted, could have a
material impact on our results of operations
and financial condition.
For examples of legislation or precursors
for
possible regulation and factors
on which the ultimate impact on our financial performance
will depend, see the
“Climate Change” section in Management’s
Discussion and Analysis of Financial Condition and Results
of
Operations on pages 67–69 of our 2020 Annual
Report on Form 10-K.
Climate Change Litigation
Beginning in 2017, governmental and
other entities in several states
in the U.S. have filed lawsuits against
oil and
gas companies, including ConocoPhillips,
seeking compensatory damages and equitable relief
to abate alleged
climate change impacts.
Additional lawsuits with similar allegations
are expected to be filed.
The amounts
claimed by plaintiffs are unspecified and
the legal and factual issues involved
in these cases are unprecedented.
ConocoPhillips believes these lawsuits are
factually and legally meritless and are
an inappropriate vehicle to
address the challenges associated with climate
change and will vigorously defend
against such lawsuits.
Company Response to Climate
-Related Risks
The company has responded by putting
in place a Sustainable Development Risk Management
Standard covering
the assessment and registering of significant
and high sustainable development risks
based on their consequence
and likelihood of occurrence.
We have developed a
company-wide Climate Change Action Plan
with the goal of
tracking mitigation activities for
each climate-related risk included in the corporate
Sustainable Development Risk
Register.
The risks addressed in our Climate Change Action
Plan fall into four broad
categories:
●
GHG-related legislation and regulation.
●
GHG emissions management.
●
Physical climate-related
impacts.
●
Climate-related disclosure
and reporting.
Emissions are categorized
into three different
scopes.
Gross operated scope
1 and scope 2 GHG emissions help us
understand our climate transition
risk.
●
Scope 1 emissions are direct GHG emissions from
sources that we own or control.
●
Scope 2 emissions are GHG emissions from the generation
of purchased electricity or steam that
we
consume.
Scope 3 emissions are indirect emissions from
sources that we neither own nor control.
Capital Resources and Liquidity
ConocoPhillips
2021 Q3 10-Q
We announced in October 2020 the adoption
of a Paris-aligned climate risk framework
with the objective of
implementing a coherent set of choices designed
to facilitate the success
of our existing exploration
and
production business through the energy transition.
Given the uncertainties remaining about
how the energy
transition
will evolve, the strategy aims to
be robust across a range of potential
future outcomes.
The strategy is comprised of four
pillars:
●
Targets
:
Our target framework
consists of a hierarchy
of targets, from a long-term ambition
that sets the
direction and aim of the strategy,
to a medium-term performance target
for GHG emissions intensity,
to
shorter-term targets for
flaring and methane intensity reductions.
These performance targets are
supported by lower-level internal
business unit goals to enable the company to
achieve the company-
wide targets.
In September 2021, we increased our interim
operational target and
have set it to reduce
our gross operated and net
equity (scope 1 and 2) emissions intensity by
40 to 50 percent from 2016
levels by 2030, an improvement from
the previously announced target
of 35 to 45 percent on only a gross
operated basis,
with an ambition to achieve net-zero
operated emissions by 2050.
We have joined the
World Bank Flaring Initiative to
work towards zero
routine flaring of associated gas
by 2030, with an
ambition to meet that goal by 2025.
●
Technology choices:
We expanded our Marginal
Abatement Cost Curve process
to provide a broader
range of opportunities for emission
reduction technology.
●
Portfolio choices: Our corporate
authorization process requires
all qualifying projects to include a GHG
price in their project approval economics.
Different GHG prices are used
depending on the region or
jurisdiction.
Projects in jurisdictions with existing GHG pricing regimes
incorporate the existing
GHG price
and forecast into
their economics.
Projects where no existing GHG pricing regime
exists utilize a scenario
forecast from our internally
consistent World
Energy Model.
In this way,
both existing and emerging
regulatory requirements are
considered in our decision-making.
The company does not use an estimated
market cost of GHG emissions when assessing
reserves in jurisdictions without existing GHG regulations.
●
External engagement:
Our external engagement aims to
differentiate ConocoPhillips
within the oil and
gas sector with our approach to managing
climate-related risk.
We are a Founding Member of the
Climate Leadership Council (CLC), an international
policy institute founded in collaboration
with business
and environmental interests
to develop a carbon dividend plan.
Participation in the CLC provides
another
opportunity for ongoing dialogue about carbon
pricing and framing the issues in alignment with our public
policy principles.
We also belong to and fund Americans For
Carbon Dividends, the education and
advocacy branch of the CLC.
Cautionary Statement for the Purposes of the “Safe Harbor” Provisions of the
Private Securities Litigation Reform Act
of 1995
This report includes forward-looking statements
within the meaning of Section 27A of the Securities Act of 1933
and Section 21E of the Securities Exchange Act of 1934.
All statements other than
statements of historical
fact
included or incorporated by
reference in this report, including, without
limitation, statements
regarding our future
financial position, business strategy,
budgets, projected revenues,
projected costs and plans, objectives
of
management for future operations,
the anticipated benefits of the transaction
between us and Concho Resources
Inc. (Concho), including the expected amount and
the timing of synergies from such transaction,
the anticipated
closing of the acquisition of assets from Shell Enterprises
LLC (Shell), and the anticipated impact of the Concho
and
Shell transactions on the combined company’s
business and future financial and operating results
are forward-
looking statements.
Examples of forward-looking statements
contained in this report include our expected
production growth and outlook on the business
environment generally,
our expected capital budget
and capital
expenditures, and discussions concerning future
dividends.
You can often
identify our forward-looking statements
by the words “anticipate,”
“believe,” “budget,”
“continue,”
“could,”
“effort,”
“estimate,”
“expect,”
“forecast,”
“intend,”
“goal,”
“guidance,”
“may,”
“objective,”
“outlook,”
“plan,” “potential,”
“predict,” “projection,”
“seek,”
“should,”
“target,”
“will,” “would” and similar
expressions.
ConocoPhillips
2021 Q3 10-Q
We based the forward-looking
statements on our current
expectations, estimates and
projections about ourselves
and the industries in which we operate in
general.
We caution you these
statements are not guarantees
of future
performance as they involve
assumptions that, while made in good faith, may
prove to be incorrect, and involve
risks and uncertainties we cannot predict.
In addition, we based many of these forward
-looking statements on
assumptions about future events
that may prove to be inaccurate.
Accordingly,
our actual outcomes and results
may differ materially from
what we have expressed
or forecast in the forward
-looking statements.
Any differences
could result from a variety of factors
and uncertainties, including, but not limited to,
the following:
●
The impact of public health crises, including pandemics (such as COVID
-19) and epidemics and any related
company or government policies
or actions.
●
Global and regional changes in the demand, supply,
prices, differentials or other market
conditions
affecting oil and gas, including changes
resulting from a public health crisis or from the imposition
or
lifting of crude oil production quotas or other actions
that might be imposed by OPEC and other producing
countries and the resulting company
or third-party actions in response to such changes.
●
Fluctuations in crude oil, bitumen, natural gas,
LNG and NGLs prices, including a prolonged decline in
these prices relative to historical
or future expected levels.
●
The impact of significant declines in prices for crude oil,
bitumen, natural gas, LNG and NGLs, which may
result in recognition of impairment charges
on our long-lived assets, leaseholds and nonconsolidated
equity investments.
●
Potential failures or delays
in achieving expected reserve or production
levels from existing and future
oil
and gas developments, including due to
operating hazards, drilling risks
and the inherent uncertainties in
predicting reserves and reservoir performance.
●
Reductions in reserves replacement rates,
whether as a result of the significant declines in
commodity
prices or otherwise.
●
Unsuccessful exploratory drilling
activities or the inability to obtain access to exploratory
acreage.
●
Unexpected changes in costs or technical
requirements for constructing,
modifying or operating E&P
facilities.
●
Legislative and regulatory initiatives
addressing environmental concerns,
including initiatives addressing
the impact of global climate change or further regulating
hydraulic fracturing, methane
emissions, flaring
or water disposal.
●
Lack of, or disruptions
in, adequate and reliable transportation
for our crude oil, bitumen, natural gas,
LNG and NGLs.
●
Inability to timely obtain or maintain
permits, including those necessary for construction, drilling
and/or
development, or inability to make
capital expenditures required
to maintain compliance with any
necessary permits or applicable laws or regulations.
●
Failure to complete definitive
agreements and feasibility studies
for,
and to complete construction of,
announced and future E&P and LNG development in a timely
manner (if at all) or on budget.
●
Potential disruption or interruption
of our operations due to accidents, extraordinary
weather events, civil
unrest, political events,
war, terrorism,
cyber attacks, and information
technology failures, constraints
or
disruptions.
●
Changes in international monetary
conditions and foreign currency exchange
rate fluctuations.
●
Changes in international trade relationships,
including the imposition of trade restrictions or
tariffs
relating to crude oil, bitumen, natural
gas, LNG, NGLs and any materials or products
(such as aluminum
and steel) used in the operation of our business.
●
Substantial investment
in and development use of, competing
or alternative energy sources, including
as
a result of existing or future environmental
rules and regulations.
●
Liability for remedial actions, including removal
and reclamation obligations,
under existing and future
environmental regulations
and litigation.
●
Significant operational or investment
changes imposed by existing or future
environmental statutes
and
regulations, including international
agreements and national or regional legislation
and regulatory
measures to limit or reduce GHG emissions.
ConocoPhillips
2021 Q3 10-Q
●
Liability resulting from litigation,
including litigation related to
the transaction with Concho, or our failure
to comply with applicable laws and regulations.
●
General domestic and international
economic and political developments, including armed
hostilities;
expropriation of assets; changes in governmental
policies relating to crude oil, bitumen, natural
gas, LNG
and NGLs pricing; regulation or taxation;
and other political, economic or diplomatic developments.
●
Volatility in the commodity futures
markets.
●
Changes in tax and other laws, regulations
(including alternative energy mandates),
or royalty rules
applicable to our business.
●
Competition and consolidation in the oil and gas
E&P industry.
●
Any limitations on our access to capital
or increase in our cost of capital, including
as a result of illiquidity
or uncertainty in domestic or international
financial markets or investment
sentiment.
●
Our inability to execute, or delays
in the completion, of any asset dispositions or acquisitions
we elect to
pursue.
●
Potential failure to obtain,
or delays in obtaining, any necessary
regulatory approvals
for pending or
future asset dispositions or acquisitions, or that such
approvals may require modification
to the terms of
the transactions or the operation
of our remaining business.
●
Potential disruption of our operations
as a result of pending or future asset dispositions or acquisitions,
including the diversion of management time and
attention.
●
Our inability to deploy the net proceeds from any
asset dispositions that are pending or that we elect
to
undertake in the future in the manner and
timeframe we currently anticipate,
if at all.
●
Our inability to liquidate the common stock
issued to us by Cenovus Energy as part of our sale of certain
assets in western Canada at prices we deem acceptable,
or at all.
●
The operation and financing of our joint ve
ntures.
●
The ability of our customers and other contractual
counterparties to satisfy their obligations
to us,
including our ability to collect payments
when due from the government of Venezuela
or PDVSA.
●
Our inability to realize anticipated
cost savings and capital expenditure
reductions.
●
The inadequacy of storage capacity
for our products, and ensuing curtailments,
whether voluntary or
involuntary,
required to mitigate this physical
constraint.
●
Our ability to successfully integrate
Concho’s business and
fully achieve the expected benefits and cost
reductions associated with the transaction
with Concho in a timely manner or at all.
●
The risk that we will be unable to retain
and hire key personnel.
●
Unanticipated difficulties or expenditures
relating to integration with Concho.
●
The risk that the conditions to close the acquisition
of assets from Shell are not satisfied on
a timely basis
or at all, or the failure of the transaction
to close for any reason.
●
The risk that any regulatory
approval, consent or authorization
that may be required for
the proposed
acquisition of assets from Shell is not obtained
or is obtained subject to conditions that are not
anticipated.
●
Unanticipated integration
issues relating to the proposed acquisition
of assets from Shell, such as
potential disruptions of our ongoing business and
higher than anticipated integration
costs.
●
Uncertainty as to the long-term value of our
common stock.
●
The diversion of management time on integration
-related matters.
●
The factors generally described
in Part I—Item 1A in our 2020 Annual Report
on Form 10-K and any
additional risks described in our other filings with the SEC.
Previous: Item 1. Financial Statements · Next: Item 3. Quantitative and Qualitative Disclosures about Market Risk