 filings.tools
Item 5. MARKET FOR REGISTRANT'S COMMON EQUITY, RELATED STOCKHOLDER MATTERS AND ISSUER PURCHASES OF EQUITY SECURITIES
6K characters. Original on sec.gov · Markdown
Item 5. MARKET FOR REGISTRANT'S COMMON EQUITY, RELATED STOCKHOLDER MATTERS AND ISSUER PURCHASES OF EQUITY SECURITIES
Effective August 30, 2023, the Company's common stock is traded on the New York Stock Exchange under the trading symbol "COR." Prior to August 30, 2023, the Company's common stock was traded on the New York Stock Exchange under the trading symbol "ABC." As of October 31, 2023, there were 2,170 record holders of the Company's common stock.
Our Board of Directors approved the following quarterly dividend increases:
| Dividend Increases | ||||||||||||||||||||
| Per Share | ||||||||||||||||||||
| Date | New Rate | Old Rate | % Increase | |||||||||||||||||
| November 2020 | $0.440 | $0.420 | 5% | |||||||||||||||||
| November 2021 | $0.460 | $0.440 | 5% | |||||||||||||||||
| November 2022 | $0.485 | $0.460 | 5% | |||||||||||||||||
| November 2023 | $0.510 | $0.485 | 5% |
Computershare is the Company's transfer agent. Computershare can be reached at (mail) Cencora, Inc. c/o Computershare, P.O. Box 50500, Louisville, KY 40233-500; (telephone): Domestic 1-800-522-6645, International 1-201-680-6578, and (internet) www.computershare.com/investor.
ISSUER PURCHASES OF EQUITY SECURITIES
The following sets forth the total number of shares purchased, the average price paid per share, the total number of shares purchased as part of publicly announced programs, and the approximate dollar value of shares that may yet be purchased under the programs during each month during the quarter ended September 30, 2023.
| Period | Total Number of Shares Purchased | Average Price Paid Per Share | Total Number of Shares Purchased as Part of Publicly Announced Programs | Approximate Dollar Value of Shares that May Yet Be Purchased Under the Programs | ||||||||||||||||||||||
| July 1 to July 31 | — | $ | — | — | $ | 1,082,525,179 | ||||||||||||||||||||
| August 1 to August 31 | 1,321,752 | $ | 189.27 | 1,320,858 | $ | 832,525,065 | ||||||||||||||||||||
| September 1 to September 30 | 135,083 | $ | 174.41 | 134,819 | $ | 809,013,277 | ||||||||||||||||||||
| Total | 1,456,835 | 1,455,677 |
(a)In May 2022, the Company's Board of Directors authorized a share repurchase program allowing the Company to purchase up to $1.0 billion of its outstanding shares of common stock, subject to market conditions. During the fiscal year ended September 30, 2023, the Company purchased 6.0 million shares of its common stock for a total of $961.3 million, including 5.5 million shares from WBA for $882.5 million, to complete its authorization under this program.
(b)In March 2023, the Company's Board of Directors authorized a new share repurchase program allowing the Company to purchase up to $1.0 billion of its outstanding shares of common stock, subject to market conditions. During the fiscal year ended September 30, 2023, the Company purchased 1.0 million shares of its common stock for a total of $191.0 million, including 0.9 million shares from WBA for $167.5 million. As of September 30, 2023, the Company had $809.0 million of availability under this program. From October 1, 2023 through November 20, 2023, the Company purchased 1.7 million shares of its common stock for a total of $325.3 million, including 1.3 million shares from WBA for $250.0 million.
(c)Employees surrendered 472,878 shares during the fiscal year ended September 30, 2023 to meet minimum tax-withholding obligations upon vesting of restricted stock.
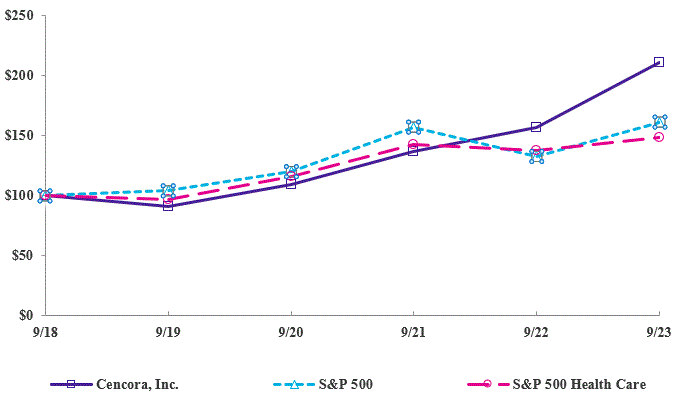
STOCK PERFORMANCE GRAPH
This graph depicts the Company's five-year cumulative total stockholder returns relative to the performance of the Standard and Poor's 500 Composite Stock Index and the S&P Health Care Index from the market close on September 30, 2018 to September 30, 2023. The graph assumes $100 invested at the closing price of the common stock of the Company and of each of the other indices on the New York Stock Exchange on September 30, 2018. The points on the graph represent fiscal year-end index levels based upon the last trading day in each fiscal year.
COMPARISON OF FIVE-YEAR CUMULATIVE TOTAL RETURN*
| September 30, | ||||||||||||||||||||||||||||||||||||||
| 2018 | 2019 | 2020 | 2021 | 2022 | 2023 | |||||||||||||||||||||||||||||||||
| Cencora, Inc. | $ | 100.00 | $ | 90.97 | $ | 109.03 | $ | 136.50 | $ | 156.67 | $ | 210.79 | ||||||||||||||||||||||||||
| S&P 500 | $ | 100.00 | $ | 104.25 | $ | 120.05 | $ | 156.07 | $ | 131.92 | $ | 160.44 | ||||||||||||||||||||||||||
| S&P Health Care | $ | 100.00 | $ | 96.43 | $ | 115.82 | $ | 141.96 | $ | 137.17 | $ | 148.40 |
- $100 invested on September 30, 2018 in stock or index, including reinvestment of dividends.
Previous: Item 4. MINE SAFETY DISCLOSURES · Next: Item 6. [RESERVED]