 filings.tools
Item 5. Market for Registrant’s Common Equity, Related Stockholder Matters and Issuer Purchases of Equity Securities
4K characters. Original on sec.gov · Markdown
Item 5. Market for Registrant’s Common Equity, Related Stockholder Matters and Issuer Purchases of Equity Securities
Market Information and Dividend Policy
Our common stock is traded on the NASDAQ Global Select Market under the symbol “COST.” On October 18, 2018, we had 8,829 stockholders of record. The following table shows the quarterly high and low closing prices of our common stock as reported by NASDAQ for each quarter during the last two fiscal years and the quarterly cash dividend declared per share.
| Price Range | Cash Dividends Declared | |||||||||||
| High | Low | |||||||||||
| 2018: | ||||||||||||
| Fourth Quarter | $ | 233.13 | $ | 195.48 | $ | 0.570 | ||||||
| Third Quarter | 197.16 | 180.84 | 0.570 | |||||||||
| Second Quarter | 198.91 | 172.61 | 0.500 | |||||||||
| First Quarter | 173.42 | 154.61 | 0.500 | |||||||||
| 2017: | ||||||||||||
| Fourth Quarter | $ | 182.20 | $ | 150.44 | $ | 0.500 | ||||||
| Third Quarter | 182.45 | 164.55 | 7.500 | (1) | ||||||||
| Second Quarter | 172.00 | 150.11 | 0.450 | |||||||||
| First Quarter | 163.98 | 142.24 | 0.450 |
| (1) | Includes a special cash dividend of $7.00 per share. |
Payment of future dividends is subject to declaration by the Board of Directors. Factors considered in determining dividends include our profitability and expected capital needs. Subject to these qualifications, we presently expect to continue to pay dividends on a quarterly basis.
Issuer Purchases of Equity Securities
The following table sets forth information on our common stock repurchase program activity for the fourth quarter of fiscal 2018 (dollars in millions, except per share data):
| Period | Total Number of Shares Purchased | Average Price Paid per Share | Total Number of Shares Purchased as Part of Publicly Announced Program(1) | Maximum Dollar Value of Shares that May Yet be Purchased under the Program | |||||||||||
| May 14—June 10, 2018 | 96,000 | $ | 198.61 | 96,000 | $ | 2,497 | |||||||||
| June 11—July 8, 2018 | 134,000 | 208.49 | 134,000 | 2,469 | |||||||||||
| July 9—August 5, 2018 | 111,000 | 216.06 | 111,000 | 2,445 | |||||||||||
| August 6—September 2, 2018 | 78,000 | 225.20 | 78,000 | 2,427 | |||||||||||
| Total fourth quarter | 419,000 | $ | 211.35 | 419,000 |
| (1) | The repurchase program is conducted under a $4,000 authorization approved by our Board of Directors in April 2015, which expires in April 2019. |
Performance Graph
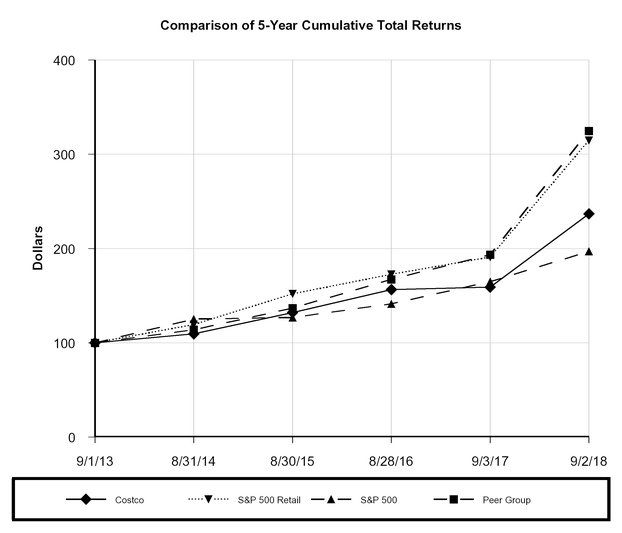
The following graph compares the cumulative total shareholder return (stock price appreciation plus dividends) on our common stock for the last five years with the cumulative total return of the S&P 500 Index, the S&P 500 Retail Index, and a peer group previously selected by the Company.
The S&P 500 Retail Index is intended to replace the previously selected peer group to allow for a more broad representation of industry performance. The transition to a larger retail index provides a better representation of total retail market performance. For the year ended September 2, 2018, the cumulative total return of the previous peer group is provided pursuant to SEC rules requiring presentation in the year of change, and consists of: Amazon.com Inc.; The Home Depot Inc.; Lowe's Companies; Best Buy Co., Inc.; Staples Inc.; Target Corporation; Kroger Company; and Walmart Stores, Inc. This group will not be presented in future periods.
The information provided is from September 1, 2013, through September 2, 2018. The graph assumes the investment of $100 in Costco common stock, the S&P 500 Index, the S&P 500 Retail Index, and the previously selected peer group on September 1, 2013, and reinvestment of all dividends.
Previous: Item 4. Mine Safety Disclosures · Next: Item 6. Selected Financial Data