 filings.tools
Cisco Systems 10-K 2020-07-25
Filed 2020-09-03. 22 sections, 503K characters. Original on sec.gov · Markdown · JSON
Cover and table of contents
UNITED STATES SECURITIES AND EXCHANGE COMMISSION
WASHINGTON, D.C. 20549
FORM 10-K
(Mark one)
| ☒ | ANNUAL REPORT PURSUANT TO SECTION 13 OR 15(d) OF THE SECURITIES EXCHANGE ACT OF 1934 |
For the fiscal year ended July 25, 2020
or
| ☐ | TRANSITION REPORT PURSUANT TO SECTION 13 OR 15(d) OF THE SECURITIES EXCHANGE ACT OF 1934 For the transition period from ____ to ____ |
Commission file number 0-18225
CISCO SYSTEMS, INC.
(Exact name of Registrant as specified in its charter)
| California | 77-0059951 | ||
| (State or other jurisdiction of incorporation or organization) | (IRS Employer Identification No.) | ||
| 170 West Tasman Drive | 95134-1706 | ||
| San Jose, | California | ||
| (Address of principal executive offices) | (Zip Code) |
Registrant’s telephone number, including area code: (408) 526-4000
Securities registered pursuant to Section 12(b) of the Act:
| Title of Each Class: | Trading Symbol(s) | Name of Each Exchange on which Registered |
| Common Stock, par value $0.001 per share | CSCO | The Nasdaq Stock Market LLC |
Securities registered pursuant to Section 12(g) of the Act: None
Indicate by check mark if the registrant is a well-known seasoned issuer, as defined in Rule 405 of the Securities Act. ☒ Yes ☐ No
Indicate by check mark if the registrant is not required to file reports pursuant to Section 13 or Section 15(d) of the Act. ☐ Yes ☒ No
Indicate by check mark whether the registrant (1) has filed all reports required to be filed by Section 13 or 15(d) of the Securities Exchange Act of 1934 during the preceding 12 months (or for such shorter period that the registrant was required to file such reports), and (2) has been subject to such filing requirements for the past 90 days. ☒ Yes ☐ No
Indicate by check mark whether the registrant has submitted electronically every Interactive Data File required to be submitted and posted pursuant to Rule 405 of Regulation S-T (§232.405 of this chapter) during the preceding 12 months (or for such shorter period that the registrant was required to submit and post such files). ☒ Yes ☐ No
Indicate by check mark whether the registrant is a large accelerated filer, an accelerated filer, a non-accelerated filer, a smaller reporting company, or an emerging growth company. See the definitions of “large accelerated filer,” “accelerated filer,” “smaller reporting company” and “emerging growth company” in Rule 12b-2 of the Exchange Act.
| Large accelerated filer | ☒ | Accelerated filer | ☐ | ||||
| Non-accelerated filer | ☐ | (Do not check if a smaller reporting company) | Smaller reporting company | ☐ | |||
| Emerging growth company | ☐ |
If an emerging growth company, indicate by check mark if the registrant has elected not to use the extended transition period for complying with any new or revised financial accounting standards provided pursuant to Section 13(a) of the Exchange Act. ☐
Indicate by check mark whether the registrant has filed a report on and attestation to its management’s assessment of the effectiveness of its internal control over financial reporting under Section 404(b) of the Sarbanes-Oxley Act (15 U.S.C. 7262(b)) by the registered public accounting firm that prepared or issued its audit report. ☒
Indicate by check mark whether the registrant is a shell company (as defined in Rule 12b-2 of the Exchange Act). ☐ Yes ☒ No
Aggregate market value of registrant’s common stock held by non-affiliates of the registrant, based upon the closing price of a share of the registrant’s common stock on January 24, 2020 as reported by the Nasdaq Global Select Market on that date: $207.1 billion
Number of shares of the registrant’s common stock outstanding as of August 28, 2020: 4,233,425,297
DOCUMENTS INCORPORATED BY REFERENCE
Portions of the registrant’s Proxy Statement relating to the registrant’s 2020 Annual Meeting of Shareholders, to be held on December 10, 2020, are incorporated by reference into Part III of this Annual Report on Form 10-K where indicated.
This Annual Report on Form 10-K, including the “Management’s Discussion and Analysis of Financial Condition and Results of Operations,” contains forward-looking statements regarding future events and our future results that are subject to the safe harbors created under the Securities Act of 1933 (the “Securities Act”) and the Securities Exchange Act of 1934 (the “Exchange Act”). All statements other than statements of historical facts are statements that could be deemed forward-looking statements. These statements are based on current expectations, estimates, forecasts, and projections about the industries in which we operate and the beliefs and assumptions of our management. Words such as “expects,” “anticipates,” “targets,” “goals,” “projects,” “intends,” “plans,” “believes,” "momentum," “seeks,” “estimates,” “continues,” “endeavors,” “strives,” “may,” variations of such words, and similar expressions are intended to identify such forward-looking statements. In addition, any statements that refer to projections of our future financial performance, our anticipated growth and trends in our businesses, future responses to and effects of the COVID-19 pandemic, and other characterizations of future events or circumstances are forward-looking statements. Readers are cautioned that these forward-looking statements are only predictions and are subject to risks, uncertainties, and assumptions that are difficult to predict, including those identified below, under “Item 1A. Risk Factors,” and elsewhere herein. Therefore, actual results may differ materially and adversely from those expressed in any forward-looking statements. We undertake no obligation to revise or update any forward-looking statements for any reason.
PART I
Item 1. Business
General
Cisco designs and sells a broad range of technologies that have been powering the Internet since 1984. We are integrating intent-based technologies across networking, security, collaboration, applications and the cloud. These technologies are designed to help our customers manage more users, devices and things connecting to their networks. This will enable us to provide customers with a highly secure, intelligent platform for their digital business.
We conduct our business globally and manage our business by geography. Our business is organized into the following three geographic segments: Americas; Europe, Middle East, and Africa (EMEA); and Asia Pacific, Japan, and China (APJC).
Our products and technologies are grouped into the following categories: Infrastructure Platforms; Applications; Security and Other Products. In addition to our product offerings, we provide a broad range of service offerings, including technical support services and advanced services. Increasingly, we are delivering our technologies through software and services. Our customers include businesses of all sizes, public institutions, governments, and service providers. These customers often look to us as a strategic partner to help them use information technology (IT) to differentiate themselves and drive positive business outcomes.
We were incorporated in California in December 1984, and our headquarters are in San Jose, California. The mailing address of our headquarters is 170 West Tasman Drive, San Jose, California 95134-1706, and our telephone number at that location is (408) 526-4000. Our website is www.cisco.com. Through a link on the Investor Relations section of our website, we make available the following filings as soon as reasonably practicable after they are electronically filed with or furnished to the Securities and Exchange Commission (SEC): our Annual Report on Form 10-K, Quarterly Reports on Form 10-Q, Current Reports on Form 8-K, and any amendments to those reports filed or furnished pursuant to Section 13(a) or 15(d) of the Exchange Act. All such filings are available free of charge. The information posted on our website is not incorporated into this report.
Strategy and Priorities
As our customers add billions of new connections to their enterprises, and as more applications move to a multicloud environment, the network becomes even more critical. Our customers are navigating change at an unprecedented pace and our mission is to inspire new possibilities for them by helping transform their infrastructure, expand applications and analytics, address their security needs, and empower their teams. We believe that our customers are looking for intent-based networks that provide meaningful business value through automation, security, and analytics across private, hybrid, and multicloud environments. Our vision is to deliver highly secure, software-defined, automated and intelligent platforms for our customers.
We are expanding our research and development (R&D) investments in certain product areas including cloud security, cloud collaboration, and application insights and analytics. We are investing to optimize our product offerings for application to education, healthcare and other specific industries. We are also making investments to enable us to increase automation and support the customer as the workplace changes. In addition, we continue to remain focused on investments around Software-Defined Wide Area Network (SD-WAN), multicloud environments, 5G and WiFi-6, 400G speeds, optical networking, next generation silicon and artificial intelligence (AI). We are also accelerating our efforts to enable the delivery of network functionality as a service.
Transforming Infrastructure
Our intent-based networking strategy began with Software-Defined Access (SD-Access) technology, one of our leading enterprise architectures. We announced the initial development of new network product offerings featuring our intent-based networking technology with the launch of the Catalyst 9000 series of switches. Our intent-based networking platform is designed to be intelligent, highly secure, powered by “intent” and informed by “context”— features aiming to constantly learn, adapt, automate and protect in order to optimize network operations and defend against an evolving cyber threat landscape. Our intent-based networking offerings are designed to provide a single, highly secure network fabric that helps ensure policy consistency and network assurance; enables faster launches of new business services; and significantly improves issue resolution times while being open and extendable. SD-Access, built on the principles of Cisco Digital Networking Architecture (DNA), provides what we see as a transformational shift in the building and managing of networks. Our Catalyst 9000 series of switches represented the initial build in our campus portfolio of our intent-based networking capabilities and provide highly differentiated advancements in security, programmability, and performance while lowering operating costs through innovations in hardware and software.
Since the initial launch, we have continued to transform our enterprise access portfolio by bringing together several technologies to form the only integrated, intent-based architecture, with security at the foundation. This architecture is designed to help our customers connect their users and devices over any network, to applications and data, no matter where they are.
We have introduced several innovations that extend our intent-based networking capabilities to wireless and enterprise routing products, including SD-WAN and Internet of Things (IoT) edge platforms. Our SD-WAN solutions are designed to provide direct branch to cloud connectivity, enabling the workforce to access their software-as-a-service (SaaS) applications and workloads in an optimized and highly secure manner.
To further our innovation in this area, we are applying the latest technologies such as machine learning and advanced analytics to operate and enhance network capabilities. These new network product offerings are designed to enable customers to detect cybersecurity threats, for instance in encrypted traffic. We have created what is in our view the only network that is designed for security while maintaining privacy.
Our customers are operating in multicloud environments with private, public and hybrid clouds. For the data center, our strategy is to deliver multicloud architectures that bring policy and operational consistency regardless of where applications or data reside by extending our Application Centric Infrastructure (ACI) and our hyperconverged offerings.
In fiscal 2020, we announced details of our technology strategy for the Internet for the Future aimed at addressing the broad adoption of multicloud and application environments. We have made significant investments in the development of software, silicon and optics — what we believe are the building blocks for the Internet for the future.
We introduced Cisco Silicon One, a single unified silicon architecture, as well as the Cisco 8000 carrier-class router family built on Silicon One and our new operating system.
Applications and Analytics
In our view, over the next several years, customers will be increasingly writing modern software applications that can run on any hybrid cloud, and will be adding billions of connections to their environment. They will need to be able to build applications quickly, deploy them nearly anywhere, monitor experiences, and act in real time.
We believe we are uniquely positioned to enable successful business outcomes for customers in hybrid and multicloud environments. In our view, the network is increasingly critical to business success and we believe our customers will benefit from the insights and intelligence that we are making accessible through our highly differentiated platforms.
As our customers navigate the multicloud world, the need to connect new devices, protect their assets and monitor cloud consumption, they will require advisory cloud services that are provided in a consistent manner. We are focused on enabling simple, intelligent, automated and highly secure clouds by delivering the infrastructure to navigate complex IT environments through our software and subscription-based offerings including Webex, Meraki cloud networking, and certain other Security and Application offerings. We believe that customers and partners view our approach to the cloud as differentiated and unique, recognizing that we offer a solution for all cloud environments, including private, hybrid and public clouds.
Security is Foundational
We believe data is one of our customers' most strategic assets, and this data is increasingly distributed across every organization and ecosystem, on customer premises, at the edge of the network, and in the cloud. As such, we believe that security is the top IT priority for many of our customers. Our security strategy is focused on delivering an effective cybersecurity architecture combining network, cloud and endpoint-based solutions. Our portfolio is designed to prevent, detect, and remediate a cyber-attack and to integrate security across networking domains. Our intent is to enable our customers to secure their networks for a multicloud world by delivering a platform that continuously detects threats and verifies trust. By combining a number of security technologies, we
are delivering an end-to-end, zero-trust architecture. Additionally, through our offerings we help our customers shorten the time between threat detection and response.
Empowering Teams
Our customers’ communications continue to evolve as we move to a digital, cloud-based world. As people are an important competitive advantage for our customers, teams need effective and simple ways to work better together and interact with their customers to build better relationships and increase collaboration. As an example, we believe our collaboration portfolio which includes our subscription-based Webex conferencing platform, is at the center of our customers’ strategy for enabling teams to increase productivity.
Transforming our Business Model
We are transforming our offerings to meet the evolving needs of our customers. Historically, our various networking technology products have aligned with their respective product categories. However, increasingly our offerings are crossing multiple product categories. As our core networking evolves, we expect we will add more common software features across our core networking platforms. We are increasing the amount of software offerings that we provide and the proportion of subscription software offerings. We have various types of software arrangements including system software, on premise software, hybrid software and SaaS offerings. In terms of monetization, our software offerings fall into the broad categories of subscription arrangements, including SaaS and term licenses, and perpetual licenses.
As part of the transformation of our business, we continued to make strides during fiscal 2020 to develop and sell more software and subscription-based offerings. We are also focused on the entire customer lifecycle to drive expansion and renewals.
For a discussion of the risks associated with our strategy, see “Item 1A. Risk Factors,” including the risk factor entitled “We depend upon the development of new products and services, and enhancements to existing products and services, and if we fail to predict and respond to emerging technological trends and customers’ changing needs, our operating results and market share may suffer.” For information regarding sales of our major products and services, see Note 19 to the Consolidated Financial Statements.
Products and Services
Our products and services are grouped into the following categories:
Infrastructure Platforms
Infrastructure Platforms consist of our core networking technologies of switching, routing, wireless, and data center products that are designed to work together to deliver networking capabilities and transport and/or store data. These technologies consist of both hardware and software offerings that help our customers build networks, automate, orchestrate, integrate, and digitize data. We believe it is critical for us to continue to deliver continuous value to our customers. We continued to make progress in shifting more of our business to software and subscriptions across our core networking portfolio, and in expanding our software offerings. Our objective is to continue moving to cloud-managed solutions across our enterprise networking portfolio. We continue to expand on our intent-based infrastructure, which focuses on simplicity, automation, and security, allowing enterprises to manage and govern the interactions of users, devices and applications across their IT environments. We started with our Nexus 9000 series of switches for the data center, which along with ACI provide enhancements in security, programmability and performance while lowering operating costs. Our Cisco Catalyst 9000 series of switches were developed for security, mobility, IoT, and the cloud. These switches formed the foundation for our leading enterprise architectures, built on the principles of Cisco DNA. We continued to expand on this technology by extending SD-Access and Cisco DNA Center across our enterprise networking portfolio and by extending ACI to the public and private cloud. In addition, we now have a unified operating system and policy management platform for our enterprise networking portfolio to drive simplicity and consistency across our customers’ networks.
Our switching portfolio encompasses campus switching as well as data center switching offerings. Our campus switching offerings provide the foundation for converged data, voice, video, and IoT services. These switches offer enhanced security and reliability and are designed to scale efficiently as our customers grow. Within campus switching are our Catalyst 9000 series of switches that include hardware with embedded software, along with a software subscription referred to as Cisco DNA. Cisco DNA provides automation, analytics and security features and can be centrally monitored, managed, and configured. Our data center switching offerings provide the foundation for mission critical data centers with high availability, scalability, and security across traditional data centers and private and public cloud data centers. We continue to add deeper and broader visibility and analytics across our networks and applications, enabling us to deliver better experiences for our customers.
Our routing portfolio interconnects public and private wireline and mobile networks, delivering highly secure and reliable connectivity to campus, data center and branch networks. Our routing solutions are designed to meet the scale, reliability, and security needs of our customers. We introduced the principles of Cisco DNA into our routing portfolio by integrating SD-WAN into our offerings. In fiscal 2020, we launched the Cisco 8000 portfolio, a family of high density, low power next generation routing platforms focused on our customers' evolution to support 100G and 400G connectivity speeds.
Our Wireless portfolio provides indoor and outdoor wireless coverage designed for seamless roaming use of voice, video, and data applications. These products include wireless access points that are standalone, controller appliance-based, switch-converged, and Meraki cloud-managed offerings. We expanded our capabilities to include network assurance and automation through Cisco DNA and Cisco DNA Spaces location-based services. Our Catalyst and Meraki Wi-Fi 6-based access points are designed for high-density public or private environments to improve speed, performance, and capacity for wireless networking in both homes and enterprises.
Our Data Center portfolio incorporates various technologies and solutions including the Cisco Unified Computing System, our hyperconverged offering, HyperFlex, and software management capabilities which combine computing, networking, and storage infrastructure management and virtualization to deliver agility, simplicity and scale. These products are designed to extend the power and simplicity of unified computing for data-intensive workloads, applications at the edge of the network, and the next generation of distributed application architectures.
Applications
The Applications product category consists primarily of software-related offerings that utilize the core networking and data center platforms to provide their functions. Our Applications offerings consist of both hardware and software-based solutions, including both software licenses and software-as-a-service. Applications include our collaboration offerings (unified communications, Cisco TelePresence and conferencing) as well as AppDynamics and IoT software offerings.
Our Collaboration strategy is to make communications more effective, comprehensive, and less complex by creating innovative solutions through combining the power of software, hardware, and the network. We offer end-to-end solutions which can be delivered from the cloud, premise or mixed environments, and which integrate voice, video, and messaging on fixed and mobile networks across a wide range of devices/endpoints such as mobile phones, tablets, desktop and laptop computers, video units, and collaboration appliances. Our Cognitive Collaboration integrates AI and machine learning across the Webex portfolio, bringing intelligence and context to help our customers work smarter and increase productivity. Our Webex Cloud Contact Center solution is designed to provide the agility, flexibility, scalability, security, efficiency and innovation in order to enable better customer experiences for businesses and their customers. For on-premise collaboration markets, we launched multi-party Internet Protocol (IP) Phones to extend our reach into third-party call control platforms as well as a new series of telephony headsets which offer innovative integration with our market leading IP phone business.
Our analytics solutions seek to help businesses deliver consistently high-quality digital experiences by connecting end-user experience and application performance to business outcomes. Our applications monitor, correlate, analyze, and act on application performance and business performance data in real time. This automated, cross-stack intelligence enables developers, IT operations, and business owners to make mission critical and strategic improvements.
We continue to invest in IoT as the number of connected IoT devices continues to grow. Our Control Center Platform enables enterprises to automate the lifecycle of connected devices, including tools designed to automatically and remotely onboard, manage, and monetize their IoT devices.
Security
The Security product category primarily includes our network security, cloud and email security, identity and access management, advanced threat protection, and unified threat management products. Our offerings are powered by cloud-delivered threat intelligence based on our Cisco Talos technology. All of these products are part of our integrated cybersecurity architecture that is designed to allow our customers to confront risks by continuously defending against threats and verifying trust, across their environments. Regardless of size or industry, security continues to be a leading priority for our customers as they defend against ongoing ransomware and account breaches that represent risk of compromise and economic loss to their businesses.
We continue to integrate security across our portfolio as we believe our security solutions can help build a foundation of trust between users, devices, and applications; across clouds, networks, and mobile workers. When targeted, our solutions help prevent attacks by continuously detecting and remediating the most advanced threats.
In fiscal 2020, we continued to invest in cloud-delivered security and extended our security platform with the launch of SecureX. These investments included extending our zero-trust architecture with the on-going integration of Duo Security (“Duo”) and integrating Umbrella with our SD-WAN solutions to help secure our customer's network transformation toward a secure access service edge (SASE). Building on our integrated architecture, we launched SecureX, a security platform that brings together the breadth of the Cisco Security portfolio helping our customers accelerate responsiveness across the security lifecycle.
Other Products
Our Other Products category primarily consists of our cloud and system management and emerging technologies products.
Services
In addition to our product offerings, we provide a broad range of service and support options for our customers. Our overall service and support offerings are combined into one organization, Customer Experience, that is responsible for the end-to-end customer experience.
Our support and maintenance services help our customers ensure their products operate efficiently, remain available, and benefit from the most up-to-date system, and application software. These services help customers protect their network investments, manage risk, and minimize downtime for systems running mission-critical applications. A key example is Cisco Smart Services, which leverages the intelligence from the installed base of our products and customer connections to protect and optimize network investment for our customers and partners. We have expanded these offerings from traditional hardware support to software, solutions, and premium support.
We also provide comprehensive advisory services that are focused on responsive, preventive, and consultative support of our technologies for specific networking needs. We are investing in and expanding advisory services in the areas of software, cloud, security, and analytics, which reflects our strategy of selling customer outcomes. We are focused on three priorities including, utilizing technology advisory services to drive higher product and services; assessment and migration services providing the tools, expertise and methodologies to enable our customers to migrate to new technology platforms; and providing optimization services aligned with customers’ business expectations.
Customers and Markets
Many factors influence the IT, collaboration, and networking requirements of our customers. These include the size of the organization, number and types of technology systems, geographic location, and business applications deployed throughout the customer’s network. Our customer base is not limited to any specific industry, geography, or market segment. In each of the past three fiscal years, no single customer accounted for 10% or more of revenue. Our customers primarily operate in the following markets: enterprise, commercial, service provider, and public sector.
Enterprise
Enterprise businesses are large regional, national, or global organizations with multiple locations or branch offices and typically employ 1,000 or more employees. Many enterprise businesses have unique IT, collaboration, and networking needs within a multivendor environment. We offer service and support packages, financing, and managed network services, primarily through our service provider partners. We sell these products through a network of third-party application and technology vendors and channel partners, as well as selling directly to these customers.
Commercial
We define commercial businesses as organizations which typically have fewer than 1,000 employees. We sell to the larger, or midmarket, customers within the commercial market through a combination of our direct sales force and channel partners. These customers typically require the latest advanced technologies that our enterprise customers demand, but with less complexity. Small businesses, or organizations with fewer than 100 employees, require information technologies and communication products that are easy to configure, install, and maintain. We sell to these smaller organizations within the commercial market primarily through channel partners.
Service Providers
Service providers offer data, voice, video, and mobile/wireless services to businesses, governments, utilities, and consumers worldwide. This customer market category includes regional, national, and international wireline carriers, web-scale operators as well as Internet, cable, and wireless providers. We also include media, broadcast, and content providers within our service provider market, as the lines in the telecommunications industry continue to blur between traditional network-based, content-based and application-based services. Service providers use a variety of our products and services for their own networks. In addition, many service providers use Cisco data center, virtualization, and collaboration technologies to offer managed or Internet-based services to their business customers. Compared with other customers, service providers are more likely to require network design, deployment, and support services because of the greater scale and higher complexity of their networks, whose requirements are addressed, we believe, by our architectural approach.
Public Sector
Public sector entities include federal governments, state and local governments, as well as educational institution customers. Many public sector entities have unique IT, collaboration, and networking needs within a multi-vendor environment. We sell to public sector entities through a network of third-party application and technology vendors, and channel partners, as well as through direct sales.
Sales Overview
As of the end of fiscal 2020, our worldwide sales and marketing functions consisted of approximately 25,800 employees, including managers, sales representatives, and technical support personnel. We have field sales offices in 95 countries, and we sell our products and services both directly and through a variety of channels with support from our salesforce. A substantial portion of our products and services is sold through channel partners, and the remainder is sold through direct sales. Channel partners include systems integrators, service providers, other resellers, and distributors.
Systems integrators and service providers typically sell directly to end users and often provide system installation, technical support, professional services, and other support services in addition to network equipment sales. Systems integrators also typically integrate our products into an overall solution. Some service providers are also systems integrators.
Distributors typically hold inventory and sell to systems integrators, service providers, and other resellers. We refer to sales through distributors as our two-tier system of sales to the end customer. Starting in fiscal 2019, in connection with the adoption of Accounting Standards Codification (ASC) 606, Revenue from Contracts with Customers, a new accounting standard related to revenue recognition, we started recognizing revenue from two-tier distributors on a sell-in method. Prior to this, we recognized revenue based on a sell-through method using point of sales information provided by these distributors. These distributors are generally given business terms that allow them to return a portion of inventory, receive credits for changes in selling prices, receive certain rebates, and participate in various cooperative marketing programs.
For information regarding risks related to our channels, see “Item 1A. Risk Factors,” including the risk factors entitled “Disruption of or changes in our distribution model could harm our sales and margins” and “Inventory management relating to our sales to our two-tier distribution channel is complex, and excess inventory may harm our gross margins.”
For information regarding risks relating to our international operations, see “Item 1A. Risk Factors,” including the risk factors entitled “Our operating results may be adversely affected by unfavorable economic and market conditions and the uncertain geopolitical environment;” “Entrance into new or developing markets exposes us to additional competition and will likely increase demands on our service and support operations;” “Due to the global nature of our operations, political or economic changes or other factors in a specific country or region could harm our operating results and financial condition;” “We are exposed to fluctuations in currency exchange rates that could negatively impact our financial results and cash flows;” and “Cyber-attacks, data breaches or malware may disrupt our operations, harm our operating results and financial condition, and damage our reputation, and cyber-attacks or data breaches on our customers' networks, or in cloud-based services provided by or enabled by us, could result in claims of liability against us, damage our reputation or otherwise harm our business,” among others.
Our service offerings complement our products through a range of consulting, technical, project, quality, and software maintenance services, including 24-hour online and telephone support through technical assistance centers.
Financing Arrangements
We provide financing arrangements for certain qualified customers to build, maintain, and upgrade their networks. We believe customer financing is a competitive advantage in obtaining business, particularly for those customers involved in significant infrastructure projects. Our financing arrangements include the following:
| Leases: |
| • Sales-type |
| • Direct financing |
| • Operating |
| Loans |
| Financed service contracts |
| Channels financing arrangements |
| End-user financing arrangements |
Acquisitions, Investments, and Alliances
The markets in which we compete require a wide variety of technologies, products, and capabilities. Our growth strategy is based on the components of innovation, which we sometimes refer to as “build, buy, partner, invest, and co-develop”. This five-prong approach to how we innovate can be summarized as follows:
| Build | Working within Cisco, with the developer community, or with customers |
| Buy | Acquiring or divesting, depending on goals |
| Partner | Strategically partnering to further build out the business |
| Invest | Making investments in areas where technology is in its infancy or where there is no dominant technology |
| Co-develop | Developing new solutions with multi-party teams that may include customers, channel partners, startups, independent software vendors, and academics |
Acquisitions
We have acquired many companies, and we expect to make future acquisitions. Mergers and acquisitions of high-technology companies are inherently risky, especially if the acquired company has yet to generate revenue. No assurance can be given that our previous or future acquisitions will be successful or will not materially adversely affect our financial condition or operating results. Prior acquisitions have resulted in a wide range of outcomes, from successful introduction of new products and technologies to an inability to do so. The risks associated with acquisitions are more fully discussed in “Item 1A. Risk Factors,” including the risk factor entitled “We have made and expect to continue to make acquisitions that could disrupt our operations and harm our operating results.”
Investments in Privately Held Companies
We make investments in privately held companies that develop technology or provide services that are complementary to our products or that provide strategic value. The risks associated with these investments are more fully discussed in “Item 1A. Risk Factors,” including the risk factor entitled “We are exposed to fluctuations in the market values of our portfolio investments and in interest rates; impairment of our investments could harm our earnings.”
Strategic Alliances
We pursue strategic alliances with other companies in areas where collaboration can produce industry advancement and acceleration of new markets. The objectives and goals of a strategic alliance can include one or more of the following: technology exchange, product development, joint sales and marketing, or new market creation. Companies with which we have added or expanded strategic alliances during fiscal 2020 and in recent years include Apple, Google, Microsoft, and Amazon Web Services, among others.
Companies with which we have strategic alliances in some areas may be competitors in other areas, and in our view this trend may increase. The risks associated with our strategic alliances are more fully discussed in “Item 1A. Risk Factors,” including the risk factor entitled “If we do not successfully manage our strategic alliances, we may not realize the expected benefits from such alliances and we may experience increased competition or delays in product development.”
Competition
We compete in the networking and communications equipment markets, providing products and services designed to transport, and help secure data, voice, and video traffic across cloud, private and public networks and the Internet. These markets are characterized by rapid change, converging technologies, and a migration to networking and communications solutions that offer relative advantages. These market factors represent both an opportunity and a competitive threat to us. We compete with numerous vendors in each product category. The overall number of our competitors providing niche product solutions may increase. Also, the identity and composition of competitors may change as we increase our activity in our new product markets. As we continue to expand globally, we may see new competition in different geographic regions. In particular, we have experienced price-focused competition from competitors in Asia, especially from China, and we anticipate this will continue.
Our competitors (in each case relative to only some of our products or services) include: Amazon Web Services LLC; Arista Networks, Inc.; Broadcom Inc.; CommScope Holding Company, Inc.; Check Point Software Technologies Ltd.; Dell Technologies Inc.; Dynatrace; F5 Networks, Inc.; FireEye, Inc.; Fortinet, Inc.; Hewlett-Packard Enterprise Company; Huawei Technologies Co., Ltd.; Juniper Networks, Inc.; Lenovo Group Limited; LogMeIn, Inc.; Microsoft Corporation; New Relic, Inc.; Nokia Corporation; Nutanix, Inc.; Palo Alto Networks, Inc.; RingCentral, Inc.; Slack Technologies, Inc.; Ubiquiti Networks; VMware, Inc.; Zoom Video Communications, Inc.; and Zscaler, Inc.; among others.
Some of these companies compete across many of our product lines, while others are primarily focused in a specific product area. Barriers to entry are relatively low, and new ventures to create products that do or could compete with our products are regularly formed. In addition, some of our competitors may have greater resources, including technical and engineering resources, than we do. As we expand into new markets, we will face competition not only from our existing competitors but also from other competitors, including existing companies with strong technological, marketing, and sales positions in those markets. We also sometimes face competition from resellers and distributors of our products. Companies with which we have strategic alliances in some areas may be competitors in other areas, and in our view this trend may increase. For example, the enterprise data center is undergoing a fundamental transformation arising from the convergence of technologies, including computing, networking, storage, and software, that previously were segregated within the data center. Due to several factors, including the availability of highly scalable and general purpose microprocessors, application-specific integrated circuits (ASICs) offering advanced services, standards-based protocols, cloud computing, and virtualization, the convergence of technologies within the enterprise data center is spanning multiple, previously independent, technology segments. Also, some of our current and potential competitors for enterprise data center business have made acquisitions, or announced new strategic alliances, designed to position them to provide end-to-end technology solutions for the enterprise data center. As a result of all of these developments, we face greater competition in the development and sale of enterprise data center technologies, including competition from entities that are among our long-term strategic alliance partners. Companies that are strategic alliance partners in some areas of our business may acquire or form alliances with our competitors, thereby reducing their business with us.
The principal competitive factors in the markets in which we presently compete and may compete in the future include:
| • | The ability to sell successful business outcomes |
| • | The ability to provide a broad range of networking and communications products and services |
| • | Product performance |
| • | Price |
| • | The ability to introduce new products, including providing continuous new customer value and products with price-performance advantages |
| • | The ability to reduce production costs |
| • | The ability to provide value-added features such as security, reliability, and investment protection |
| • | Conformance to standards |
| • | Market presence |
| • | The ability to provide financing |
| • | Disruptive technology shifts and new business models |
We also face competition from customers to which we license or supply technology, and suppliers from which we transfer technology. The inherent nature of networking requires interoperability. Therefore, we must cooperate and at the same time compete with many companies. Any inability to effectively manage these complicated relationships with customers, suppliers, and strategic alliance partners could have a material adverse effect on our business, operating results, and financial condition and, accordingly affect our chances of success.
Research and Development
We regularly introduce new products and features to address the requirements of our markets. We allocate our research and development budget among our product categories, which consist of Infrastructure Platforms, Applications, Security, and Other Product technologies. Our research and development expenditures are applied generally to all product areas, with specific areas of focus being identified from time to time. Recent areas of increased focus include our intent-based networking technologies (which encompasses switching, routing, and wireless technologies within Infrastructure Platforms), conferencing, security, and analytics products. Our expenditures for research and development costs were expensed as incurred.
The industry in which we compete is subject to rapid technological developments, evolving standards, changes in customer requirements, and new product introductions and enhancements. As a result, our success depends in part upon our ability, on a cost-effective and timely basis, to continue to enhance our existing products and to develop and introduce new products that improve performance and reduce total cost of ownership. To achieve these objectives, our management and engineering personnel work with customers to identify and respond to customer needs, as well as with other innovators of Internet working products, including universities, laboratories, and corporations. We also expect to continue to make acquisitions and investments, where appropriate, to provide us with access to new technologies. Nonetheless, there can be no assurance that we will be able to successfully
develop products to address new customer requirements and technological changes or that those products will achieve market acceptance.
Manufacturing
We rely on contract manufacturers for our manufacturing needs. We presently use a variety of independent third-party companies to provide services related to printed-circuit board assembly, in-circuit test, product repair, and product assembly. Proprietary software on electronically programmable memory chips is used to configure products that meet customer requirements and to maintain quality control and security. The manufacturing process enables us to configure the hardware and software in unique combinations to meet a wide variety of individual customer requirements. The manufacturing process uses automated testing equipment and burn-in procedures, as well as comprehensive inspection, testing, and statistical process controls, which are designed to help ensure the quality and reliability of our products. The manufacturing processes and procedures are generally certified to International Organization for Standardization (ISO) 9001 standards.
Our arrangements with contract manufacturers generally provide for quality, cost, and delivery requirements, as well as manufacturing process terms, such as continuity of supply; inventory management; flexibility regarding capacity, quality, and cost management; oversight of manufacturing; and conditions for use of our intellectual property. We have not entered into any significant long-term contracts with any manufacturing service provider. We generally have the option to renew arrangements on an as-needed basis. These arrangements generally do not commit us to purchase any particular amount or any quantities beyond amounts covered by orders or forecasts that we submit covering discrete periods of time.
Patents, Intellectual Property, and Licensing
We seek to establish and maintain our proprietary rights in our technology and products through the use of patents, copyrights, trademarks, and trade secret laws. We have a program to file applications for and obtain patents, copyrights, and trademarks in the United States and in selected foreign countries where we believe filing for such protection is appropriate. We also seek to maintain our trade secrets and confidential information by nondisclosure policies and through the use of appropriate confidentiality agreements. We have obtained a substantial number of patents and trademarks in the United States and in other countries. There can be no assurance, however, that the rights obtained can be successfully enforced against infringing products in every jurisdiction. Although we believe the protection afforded by our patents, copyrights, trademarks, and trade secrets has value, the rapidly changing technology in the networking industry and uncertainties in the legal process make our future success dependent primarily on the innovative skills, technological expertise, and management abilities of our employees rather than on the protection afforded by patent, copyright, trademark, and trade secret laws.
Many of our products are designed to include software or other intellectual property licensed from third parties. While it may be necessary in the future to seek or renew licenses relating to various aspects of our products, we believe, based upon past experience and standard industry practice that such licenses generally could be obtained on commercially reasonable terms. Nonetheless, there can be no assurance that the necessary licenses would be available on acceptable terms, if at all. Our inability to obtain certain licenses or other rights or to obtain such licenses or rights on favorable terms, or the need to engage in litigation regarding these matters, could have a material adverse effect on our business, operating results, and financial condition. Moreover, inclusion in our products of software or other intellectual property licensed from third parties on a nonexclusive basis can limit our ability to protect our proprietary rights in our products.
The industry in which we compete is characterized by rapidly changing technology, a large number of patents, and frequent claims and related litigation regarding patent and other intellectual property rights. There can be no assurance that our patents and other proprietary rights will not be challenged, invalidated, or circumvented; that others will not assert intellectual property rights to technologies that are relevant to us; or that our rights will give us a competitive advantage. In addition, the laws of some foreign countries may not protect our proprietary rights to the same extent as the laws of the United States. The risks associated with patents and intellectual property are more fully discussed in “Item 1A. Risk Factors,” including the risk factors entitled “Our proprietary rights may prove difficult to enforce,” “We may be found to infringe on intellectual property rights of others,” and “We rely on the availability of third-party licenses.”
Employees
Employees are summarized as follows (approximate numbers):
| July 25, 2020 | |
| Employees by geography: | |
| United States | 38,900 |
| Rest of world | 38,600 |
| Total | 77,500 |
| Employees by line item on the Consolidated Statements of Operations: | |
| Cost of sales (1) | 22,100 |
| Research and development | 22,200 |
| Sales and marketing | 25,800 |
| General and administrative | 7,400 |
| Total | 77,500 |
(1) Cost of sales includes manufacturing support, services, and training.
Information about our Executive Officers
The following table shows the name, age, and position as of August 31, 2020 of each of our executive officers:
| Name | Age | Position with the Company | ||
| Charles H. Robbins | 54 | Chairman and Chief Executive Officer | ||
| Mark Chandler | 64 | Executive Vice President, Chief Legal Officer and Chief Compliance Officer | ||
| Gerri Elliott | 64 | Executive Vice President and Chief Sales and Marketing Officer | ||
| Kelly A. Kramer | 53 | Executive Vice President and Chief Financial Officer | ||
| Maria Martinez | 62 | Executive Vice President and Chief Customer Experience Officer | ||
| Irving Tan | 50 | Executive Vice President, Chief of Operations |
Mr. Robbins has served as Chief Executive Officer since July 2015, as a member of the Board of Directors since May 2015 and as Chairman of the Board since December 2017. He joined Cisco in December 1997, from which time until March 2002 he held a number of managerial positions within Cisco’s sales organization. Mr. Robbins was promoted to Vice President in March 2002, assuming leadership of Cisco’s U.S. channel sales organization. Additionally, in July 2005 he assumed leadership of Cisco’s Canada channel sales organization. In December 2007, Mr. Robbins was promoted to Senior Vice President, U.S. Commercial, and in August 2009 he was appointed Senior Vice President, U.S. Enterprise, Commercial and Canada. In July 2011, Mr. Robbins was named Senior Vice President, Americas. In October 2012, Mr. Robbins was promoted to Senior Vice President, Worldwide Field Operations, in which position he served until assuming the role of Chief Executive Officer. He is a member of the board of directors of BlackRock, Inc.
Mr. Chandler joined Cisco in July 1996, upon Cisco’s acquisition of StrataCom, Inc., where he served as General Counsel. He served as Cisco’s Managing Attorney for Europe, the Middle East, and Africa from December 1996 until June 1999; as Director, Worldwide Legal Operations from June 1999 until February 2001; and was promoted to Vice President, Worldwide Legal Services in February 2001. In October 2001, Mr. Chandler was promoted to Vice President, Legal Services and General Counsel, and in May 2003 he additionally was appointed Secretary, a position he held through November 2015. In February 2006, Mr. Chandler was promoted to Senior Vice President, and in May 2012 he was appointed Chief Compliance Officer. In June 2018, Mr. Chandler was promoted to Executive Vice President and Chief Legal Officer. Before joining StrataCom, Mr. Chandler had served as Vice President, Corporate Development and General Counsel of Maxtor Corporation.
Ms. Elliott joined Cisco in April 2018. Ms. Elliott is a former Executive Vice President of Juniper Networks, Inc., where she served as EVP and Chief Customer Officer from March 2013 to February 2014, EVP and Chief Sales Officer from July 2011 to March 2013 and EVP, Strategic Alliances from June 2009 to July 2011. Before joining Juniper, Ms. Elliott held a series of senior executive positions with Microsoft Corporation from 2001-2008 including Corporate Vice President of Microsoft’s Industry Solutions Group, Worldwide Public Sector and North American Enterprise Sales organizations. Prior to joining Microsoft Corporation, Ms. Elliott spent 22 years at IBM Corporation, where she held several senior executive positions both in the U.S. and internationally. Since 2014 Ms. Elliott has served as a director on several public company boards including Whirlpool Corporation (since 2014), Bed Bath & Beyond, Inc. (2014-17), Imperva, Inc. (2015-18), Marvell Technology Group Ltd. (2017-18) and Mimecast Ltd. (2017-18),
and during this period she also founded and led the development of Broadrooms.com, an informational resource for executive women who serve or want to serve on corporate boards in the U.S.
Ms. Kramer joined Cisco in January 2012 as Senior Vice President, Corporate Finance. She served in that position until October 2014 and served as Cisco’s Senior Vice President, Business Technology and Operations Finance from October 2013 until December 2014. She was appointed to her current position effective January 2015. From January 2009 until she joined Cisco, Ms. Kramer served as Vice President and Chief Financial Officer of GE Healthcare Systems. Ms. Kramer served as Vice President and Chief Financial Officer of GE Healthcare Diagnostic Imaging from August 2007 to January 2009 and as Chief Financial Officer of GE Healthcare Biosciences from January 2006 to July 2007. Prior to that, Ms. Kramer held various leadership positions with GE corporate and other GE businesses. She is a member of the board of directors of Gilead Sciences, Inc. On August 12, 2020, Ms. Kramer notified Cisco of her decision to resign from Cisco. She will continue to serve in her role until such time as a replacement is appointed.
Ms. Martinez joined Cisco in April 2018. Prior to joining Cisco, she served in a variety of senior executive roles at Salesforce.com, inc. including President, Global Customer Success and Latin America from March 2016 to April 2018; President, Sales and Customer Success from February 2013 to March 2016; Executive Vice President and Chief Growth Officer from February 2012 to February 2013; and Executive Vice President, Customers for Life from February 2010 to February 2012. Ms. Martinez’s experience prior to Salesforce includes Corporate Vice President of Worldwide Services at Microsoft Corporation, President and Chief Executive Officer of Embrace Networks, Inc. and various senior leadership roles at Motorola, Inc. and AT&T Inc./Bell Laboratories. Ms. Martinez is a member of the board of directors of McKesson Corporation and was a member of the board of directors of Plantronics, Inc. from September 2015 to April 2018.
Mr. Tan joined Cisco in December 2005, serving in manager-level and director-level positions within Cisco’s Sales and Managed Services functions until March 2008, at which time he joined Hewlett Packard Corporation as General Manager of its Communications and Media Solutions Group in Asia Pacific and Japan. In April 2009, Mr. Tan rejoined Cisco, serving as Sales Director in charge of Malaysia and Singapore, and in February 2013 he was promoted to Vice President, Sales with responsibility for the Southeast Asia region. In April 2014, Mr. Tan was promoted to Senior Vice President, Sales with responsibility for Cisco’s APJ geography. In January 2018, Mr. Tan was promoted to Senior Vice President, Chief of Operations, and was promoted to Executive Vice President, Chief of Operations effective as of July 28, 2019. Mr. Tan is a member of the board of directors of Stanley Black & Decker, Inc.
Item 1A. Risk Factors
Set forth below and elsewhere in this report and in other documents we file with the SEC are descriptions of the risks and uncertainties that could cause our actual results to differ materially from the results contemplated by the forward-looking statements contained in this report.
OUR BUSINESS, RESULTS OF OPERATIONS AND FINANCIAL CONDITION HAVE BEEN ADVERSELY AFFECTED AND COULD IN THE FUTURE BE MATERIALLY ADVERSELY AFFECTED BY THE COVID-19 PANDEMIC
The COVID-19 pandemic and the resulting containment measures have caused economic and financial disruptions globally, including in most of the regions in which we sell our products and services and conduct our business operations. In the second half of fiscal 2020, the COVID-19 pandemic had an impact on our financial results and business operations, with a significant impact in the third quarter of fiscal 2020 on our supply chain where we saw manufacturing challenges and component constraints. The magnitude and duration of the disruption, its continuing impact on us, and resulting decline in global business activity is uncertain. These disruptions include the unprecedented actions taken to try to contain the pandemic such as travel bans and restrictions, business closures, and social distancing measures, such as quarantines and shelter-in-place orders.
The COVID-19 pandemic and the responsive measures taken in many countries have adversely affected and could in the future materially adversely affect our business, results of operations and financial condition. Shelter-in-place orders and other measures, including work-from-home and other policies implemented to protect workers, has and could in the future impact our supply chain. Vendors may be under pressure to allocate product to certain customers for business, regulatory or political reasons, and/or demand changes in agreed pricing as a condition of supply. Such disruptions may continue, or worsen, in the future. In addition, current and future restrictions or disruptions of transportation, such as reduced availability of air transport, port closures, and increased border controls or closures, can also impact our ability to meet customer demand and could materially adversely affect us. Our customers have also experienced, and may continue to experience, disruptions in their operations, which can result in delayed, reduced, or canceled orders, and increased collection risks, and which may adversely affect our results of operations. The COVID-19 pandemic may also result in long-term changes in customer needs for our products and services in various sectors, along with IT-
related capital spending reductions, or shifts in spending focus, that could materially adversely affect us if we are unable to adjust our product and service offerings to match customer needs.
The recent shift to a remote working environment also creates challenges. For example, governmental lockdowns, restrictions or new regulations has and could in the future impact the ability of our employees and vendors to work with the same speed and productivity in certain areas, even as other areas do not see negative impact. The extent and/or duration of ongoing workforce restrictions and limitations could impact our ability to enhance, develop and support existing products and services, and hold product sales and marketing events to the extent we were able to previously. In addition, malefactors are seeking to use the COVID-19 pandemic to launch new cyber-attacks. See the risk factors below entitled “Cyber-attacks, data breaches or malware may disrupt our operations, harm our operating results and financial condition, and damage our reputation, and cyber-attacks or data breaches on our customers’ networks, or in cloud-based services provided by or enabled by us, could result in claims of liability against us, damage our reputation or otherwise harm our business” and “Vulnerabilities and critical security defects, prioritization decisions regarding remedying vulnerabilities or security defects, failure of third party providers to remedy vulnerabilities or security defects, or customers not deploying security releases or deciding not to upgrade products, services or solutions could result in claims of liability against us, damage our reputation or otherwise harm our business.”
The COVID-19 pandemic has also led to increased disruption and volatility in capital markets and credit markets. The pandemic and resulting economic uncertainty could adversely affect our liquidity and capital resources in the future. The inputs into certain of our judgments, assumptions, and estimates considered the economic implications of the COVID-19 pandemic on our critical and significant accounting estimates. The actual results that we experience may differ materially from our estimates. As the COVID-19 pandemic continues to develop, many of our estimates could require increased judgment and carry a higher degree of variability and volatility. As events continue to evolve our estimates may change materially in future periods.
We are continuing to monitor the pandemic and take appropriate actions in accordance with the recommendations and requirements of relevant authorities. The extent of the impact of the COVID-19 pandemic on our operational and financial performance is currently uncertain and will depend on many factors outside our control, including, without limitation, the timing, extent, trajectory and duration of the pandemic, the development and availability of effective treatments and vaccines, the imposition of protective public safety measures, and the impact of the pandemic on the global economy. Potential negative impacts of these external factors include, but are not limited to, material adverse effects on demand for our products and services; our supply chain and sales and distribution channels; collectability of customer accounts; our ability to execute strategic plans; impairments; and our profitability and cost structure. To the extent the COVID-19 pandemic adversely affects our business, results of operations and financial condition, it may also have the effect of exacerbating the other risks discussed in this “Risk Factors” section.
OUR OPERATING RESULTS MAY FLUCTUATE IN FUTURE PERIODS, WHICH MAY ADVERSELY AFFECT OUR STOCK PRICE
Our operating results have been in the past, and will continue to be, subject to quarterly and annual fluctuations as a result of numerous factors, some of which may contribute to more pronounced fluctuations in an uncertain global economic environment. These factors include:
| • | Fluctuations in demand for our products and services, especially with respect to service providers and Internet businesses, in part due to changes in the global economic environment |
| • | Changes in sales and implementation cycles for our products and reduced visibility into our customers’ spending plans and associated revenue |
| • | Our ability to maintain appropriate inventory levels and purchase commitments |
| • | Price and product competition in the communications and networking industries, which can change rapidly due to technological innovation and different business models from various geographic regions |
| • | The overall movement toward industry consolidation among both our competitors and our customers |
| • | The introduction and market acceptance of new technologies and products, and our success in new and evolving markets, and in emerging technologies, as well as the adoption of new standards |
| • | The transformation of our business to d |
Showing the first 8K of 96K characters. Open the full section
Item 1B. Unresolved Staff Comments
None.
Item 2. Properties
Our corporate headquarters are located at an owned site in San Jose, California, in the United States of America. The locations of our headquarters by geographic segment are as follows:
| Americas | EMEA | APJC | ||
| San Jose, California, USA | Amsterdam, Netherlands | Singapore |
In addition to our headquarters site, we own additional sites in the United States, which include facilities in the surrounding areas of San Jose, California; Research Triangle Park, North Carolina; Richardson, Texas; Lawrenceville, Georgia; and Boxborough, Massachusetts. We also own land for expansion in some of these locations. In addition, we lease office space in many U.S. locations.
Outside the United States our operations are conducted primarily in leased sites. Other significant sites (in addition to the two non-U.S. headquarters locations) are located in Australia, Belgium, Canada, China, Germany, India, Japan, Mexico, Poland, and the United Kingdom.
We believe that our existing facilities, including both owned and leased, are in good condition and suitable for the conduct of our business.
Item 3. Legal Proceedings
For a description of our material pending legal proceedings, see Note 14 “Commitments and Contingencies - (f) Legal Proceedings” of the Notes to Consolidated Financial Statements included in Item 8 of this Annual Report on Form 10-K, which is incorporated herein by reference.
Item 4. Mine Safety Disclosures
Not applicable.
PART II
Item 5. Market for Registrant’s Common Equity, Related Stockholder Matters, and Issuer Purchases of Equity Securities
| (a) | Cisco common stock is traded on the Nasdaq Global Select Market under the symbol CSCO. Information regarding quarterly cash dividends declared on Cisco’s common stock during fiscal 2020 and 2019 may be found in Supplementary Financial Data on page 104 of this report. There were 37,920 registered shareholders as of August 28, 2020. |
| (b) | None. |
| (c) | Issuer purchases of equity securities (in millions, except per-share amounts): |
| Period | Total Number of Shares Purchased | Average Price Paid per Share | Total Number of Shares Purchased as Part of Publicly Announced Plans or Programs | Approximate Dollar Value of Shares That May Yet Be Purchased Under the Plans or Programs | |||||||||
| April 26, 2020 to May 23, 2020 | — | $ | — | — | $ | 10,841 | |||||||
| May 24, 2020 to June 20, 2020 | — | $ | — | — | $ | 10,841 | |||||||
| June 21, 2020 to July 25, 2020 | — | $ | — | — | $ | 10,841 | |||||||
| Total | — | $ | — | — |
On September 13, 2001, we announced that our Board of Directors had authorized a stock repurchase program. As of July 25, 2020, the remaining authorized amount for stock repurchases under this program, including the additional authorization, is approximately $10.8 billion with no termination date.
For the majority of restricted stock units granted, the number of shares issued on the date the restricted stock units vest is net of shares withheld to meet applicable tax withholding requirements. Although these withheld shares are not issued or considered common stock repurchases under our stock repurchase program and therefore are not included in the preceding table, they are treated as common stock repurchases in our financial statements as they reduce the number of shares that would have been issued upon vesting (see Note 15 to the Consolidated Financial Statements).
Stock Performance Graph
The information contained in this Stock Performance Graph section shall not be deemed to be “soliciting material” or “filed” or incorporated by reference in future filings with the SEC, or subject to the liabilities of Section 18 of the Securities Exchange Act of 1934, except to the extent that Cisco specifically incorporates it by reference into a document filed under the Securities Act of 1933 or the Securities Exchange Act of 1934.
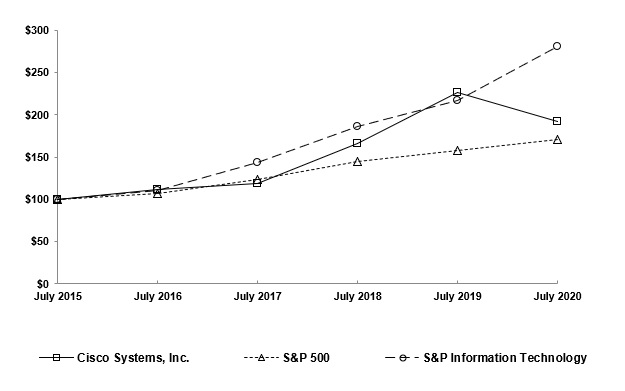
The following graph shows a five-year comparison of the cumulative total shareholder return on Cisco common stock with the cumulative total returns of the S&P 500 Index, and the S&P Information Technology Index. The graph tracks the performance of a $100 investment in the Company’s common stock and in each of the indexes (with the reinvestment of all dividends) on the date specified. Shareholder returns over the indicated period are based on historical data and should not be considered indicative of future shareholder returns.
Comparison of 5-Year Cumulative Total Return Among Cisco Systems, Inc.,
the S&P 500 Index, and the S&P Information Technology Index
| July 2015 | July 2016 | July 2017 | July 2018 | July 2019 | July 2020 | ||||||||||||||||||
| Cisco Systems, Inc. | $ | 100.00 | $ | 111.26 | $ | 118.93 | $ | 165.80 | $ | 226.27 | $ | 191.66 | |||||||||||
| S&P 500 | $ | 100.00 | $ | 106.87 | $ | 124.10 | $ | 144.26 | $ | 158.02 | $ | 171.27 | |||||||||||
| S&P Information Technology | $ | 100.00 | $ | 110.10 | $ | 143.32 | $ | 185.90 | $ | 216.69 | $ | 280.40 |
Item 6. Selected Financial Data
Five Years Ended July 25, 2020 (in millions, except per-share amounts)
| Years Ended | July 25, 2020 | July 27, 2019 (1)(2) | July 28, 2018 (1)(3) | July 29, 2017 | July 30, 2016 (4)(5) | ||||||||||||||
| Revenue | $ | 49,301 | $ | 51,904 | $ | 49,330 | $ | 48,005 | $ | 49,247 | |||||||||
| Net income | $ | 11,214 | $ | 11,621 | $ | 110 | $ | 9,609 | $ | 10,739 | |||||||||
| Net income per share—basic | $ | 2.65 | $ | 2.63 | $ | 0.02 | $ | 1.92 | $ | 2.13 | |||||||||
| Net income per share—diluted | $ | 2.64 | $ | 2.61 | $ | 0.02 | $ | 1.90 | $ | 2.11 | |||||||||
| Shares used in per-share calculation—basic | 4,236 | 4,419 | 4,837 | 5,010 | 5,053 | ||||||||||||||
| Shares used in per-share calculation—diluted | 4,254 | 4,453 | 4,881 | 5,049 | 5,088 | ||||||||||||||
| Cash dividends declared per common share | $ | 1.42 | $ | 1.36 | $ | 1.24 | $ | 1.10 | $ | 0.94 | |||||||||
| Net cash provided by operating activities | $ | 15,426 | $ | 15,831 | $ | 13,666 | $ | 13,876 | $ | 13,570 | |||||||||
| July 25, 2020 | July 27, 2019 | July 28, 2018 | July 29, 2017 | July 30, 2016 | |||||||||||||||
| Cash and cash equivalents and investments | $ | 29,419 | $ | 33,413 | $ | 46,548 | $ | 70,492 | $ | 65,756 | |||||||||
| Total assets | $ | 94,853 | $ | 97,793 | $ | 108,784 | $ | 129,818 | $ | 121,652 | |||||||||
| Debt | $ | 14,583 | $ | 24,666 | $ | 25,569 | $ | 33,717 | $ | 28,643 | |||||||||
| Deferred revenue | $ | 20,446 | $ | 18,467 | $ | 19,685 | $ | 18,494 | $ | 16,472 |
| (1) | In the second quarter of fiscal 2019, we completed the sale of the Service Provider Video Software Solutions (SPVSS) business. As a result, revenue from the SPVSS business did not recur in future periods. Revenue for the years ended July 27, 2019 and July 28, 2018 include SPVSS revenue of $168 million and $903 million, respectively. |
| (2) | In connection with the Tax Cuts and Jobs Act (“the Tax Act”), we recorded an $872 million charge which was the reversal of the previously recorded benefit associated with the U.S. taxation of deemed foreign dividends recorded in fiscal 2018 as a result of a retroactive final U.S. Treasury regulation issued during the fourth quarter of fiscal 2019. |
| (3) | In fiscal 2018, Cisco recorded a provisional tax expense of $10.4 billion related to the enactment of the Tax Act comprised of $8.1 billion of U.S. transition tax, $1.2 billion of foreign withholding tax, and $1.1 billion re-measurement of net deferred tax assets and liabilities (DTA). |
| (4) | In the second quarter of fiscal 2016, Cisco completed the sale of the SP Video CPE Business. As a result, revenue from this portion of the Service Provider Video product category did not recur in future periods. The sale resulted in a pre-tax gain of $253 million net of certain transaction costs. The year ended July 30, 2016 includes SP Video CPE Business revenue of $504 million. |
| (5) | In fiscal 2016 Cisco recognized total tax benefits of $593 million for the following: i) the Internal Revenue Service (IRS) and Cisco settled all outstanding items related to Cisco’s federal income tax returns for fiscal 2008 through fiscal 2010, as a result of which Cisco recorded a net tax benefit of $367 million; and ii) the Protecting Americans from Tax Hikes Act of 2015 reinstated the U.S. federal R&D tax credit permanently, as a result of which Cisco recognized tax benefits of $226 million. |
At the beginning of fiscal 2019, we adopted Accounting Standards Codification (ASC) 606, a new accounting standard related to revenue recognition, using the modified retrospective method to those contracts that were not completed as of July 28, 2018.
No other factors materially affected the comparability of the information presented above.
Item 7. Management’s Discussion and Analysis of Financial Condition and Results of Operations
Forward-Looking Statements
This Annual Report on Form 10-K, including this Management’s Discussion and Analysis of Financial Condition and Results of Operations, contains forward-looking statements regarding future events and our future results that are subject to the safe harbors created under the Securities Act of 1933 (the “Securities Act”) and the Securities Exchange Act of 1934 (the “Exchange Act”). All statements other than statements of historical facts are statements that could be deemed forward-looking statements. These statements are based on current expectations, estimates, forecasts, and projections about the industries in which we operate and the beliefs and assumptions of our management. Words such as “expects,” “anticipates,” “targets,” “goals,” “projects,” “intends,” “plans,” “believes,” “momentum,” “seeks,” “estimates,” “continues,” “endeavors,” “strives,” “may,” variations of such words, and similar expressions are intended to identify such forward-looking statements. In addition, any statements that refer to projections of our future financial performance, our anticipated growth and trends in our businesses, future responses to and effects of the COVID-19 pandemic, and other characterizations of future events or circumstances are forward-looking statements. Readers are cautioned that these forward-looking statements are only predictions and are subject to risks, uncertainties, and assumptions that are difficult to predict, including those under “Part I, Item 1A. Risk Factors,” and elsewhere herein. Therefore, actual results may differ materially and adversely from those expressed in any forward-looking statements. We undertake no obligation to revise or update any forward-looking statements for any reason.
OVERVIEW
Cisco designs and sells a broad range of technologies that have been powering the Internet since 1984. We are integrating intent-based technologies across networking, security, collaboration, applications and the cloud. These technologies are designed to help our customers manage more users, devices and things connecting to their networks. This will enable us to provide customers with a highly secure, intelligent platform for their digital business.
A summary of our results is as follows (in millions, except percentages and per-share amounts):
| Three Months Ended | Years Ended | |||||||||||||||||||||
| July 25, 2020 | July 27, 2019 | Variance | July 25, 2020 | July 27, 2019 | Variance | |||||||||||||||||
| Revenue (1) | $ | 12,154 | $ | 13,428 | (9 | )% | $ | 49,301 | $ | 51,904 | (5 | )% | ||||||||||
| Gross margin percentage | 63.2 | % | 63.9 | % | (0.7 | ) | pts | 64.3 | % | 62.9 | % | 1.4 | pts | |||||||||
| Research and development | $ | 1,565 | $ | 1,753 | (11 | )% | $ | 6,347 | $ | 6,577 | (3 | )% | ||||||||||
| Sales and marketing | $ | 2,218 | $ | 2,487 | (11 | )% | $ | 9,169 | $ | 9,571 | (4 | )% | ||||||||||
| General and administrative | $ | 494 | $ | 566 | (13 | )% | $ | 1,925 | $ | 1,827 | 5 | % | ||||||||||
| Total R&D, sales and marketing, general and administrative | $ | 4,277 | $ | 4,806 | (11 | )% | $ | 17,441 | $ | 17,975 | (3 | )% | ||||||||||
| Total as a percentage of revenue | 35.2 | % | 35.8 | % | (0.6 | ) | pts | 35.4 | % | 34.6 | % | 0.8 | pts | |||||||||
| Amortization of purchased intangible assets included in operating expenses | $ | 33 | $ | 38 | (13 | )% | $ | 141 | $ | 150 | (6 | )% | ||||||||||
| Restructuring and other charges included in operating expenses | $ | 127 | $ | 40 | 218 | % | $ | 481 | $ | 322 | 49 | % | ||||||||||
| Operating income as a percentage of revenue | 26.7 | % | 27.5 | % | (0.8 | ) | pts | 27.6 | % | 27.4 | % | 0.2 | pts | |||||||||
| Interest and other income (loss), net | $ | 59 | $ | 14 | 321 | % | $ | 350 | $ | 352 | (1 | )% | ||||||||||
| Income tax percentage (2) | 20.3 | % | 40.4 | % | (20.1 | ) | pts | 19.7 | % | 20.2 | % | (0.5 | ) | pts | ||||||||
| Net income (2) | $ | 2,636 | $ | 2,206 | 19 | % | $ | 11,214 | $ | 11,621 | (4 | )% | ||||||||||
| Net income as a percentage of revenue | 21.7 | % | 16.4 | % | 5.3 | pts | 22.7 | % | 22.4 | % | 0.3 | pts | ||||||||||
| Earnings per share—diluted (2) | $ | 0.62 | $ | 0.51 | 22 | % | $ | 2.64 | $ | 2.61 | 1 | % |
(1) During the second quarter of fiscal 2019, we completed the sale of our SPVSS business. As a result, revenue from this business will not recur in future periods. Includes SPVSS business revenue of $168 million for fiscal 2019.
(2) Includes a $0.9 billion charge for the fourth quarter of fiscal 2019 and fiscal 2019 related to the Tax Act.
Fiscal 2020 Compared with Fiscal 2019
In fiscal 2020, we delivered growth in margins and earnings per share in a very challenging environment with the COVID-19 pandemic. Total revenue decreased by 5% compared with fiscal 2019. Our product revenue declined in Infrastructure Platforms and Applications, partially offset by growth in Security, and we continued to make progress in the transition of our business model to increased software and subscriptions. We remain focused on accelerating innovation across our portfolio, and we believe that we have made continued progress on our strategic priorities. We continue to operate in a challenging macroeconomic and highly competitive environment. We saw broad-based weakening in the global macroeconomic environment during the fiscal year which impacted our commercial and enterprise markets. We also experienced continuing weakness in the service provider market and emerging countries, and we expect ongoing uncertainty in these markets. While the overall environment remains uncertain, we continue to aggressively invest in priority areas with the objective of driving profitable growth over the long term.
Within total revenue, product revenue decreased 8% and service revenue increased by 3%. Total gross margin increased by 1.4 percentage points, driven primarily by productivity benefits and product mix partially offset by unfavorable impacts from pricing. As a percentage of revenue, research and development, sales and marketing, and general and administrative expenses, collectively, increased by 0.8 percentage points. Operating income as a percentage of revenue increased by 0.2 percentage points. Diluted earnings per share increased by 1%, driven by a decrease in diluted share count of 199 million shares, partially offset by a decrease in net income of 4%.
In terms of our geographic segments, revenue from the Americas decreased by $1.6 billion, driven in large part by a product revenue decline in the United States. EMEA revenue decreased by $0.4 billion and revenue in our APJC segment decreased by $0.5 billion. The “BRICM” countries experienced a product revenue decline of 25% in the aggregate, driven by decreased product revenue in the emerging countries of India, China, Mexico and Brazil.
From a customer market standpoint, we experienced product revenue declines across all customer segments, with the most significant declines in the commercial and service provider markets. During fiscal 2020, we saw a decline in business momentum
Showing the first 8K of 87K characters. Open the full section
Item 7A. Quantitative and Qualitative Disclosures About Market Risk
Our financial position is exposed to a variety of risks, including interest rate risk, equity price risk, and foreign currency exchange risk. We have seen an increase in these risks and related uncertainties with increased volatility in the financial markets in the current environment with the COVID-19 pandemic.
Interest Rate Risk
Available-for-Sale Debt Investments We maintain an investment portfolio of various holdings, types, and maturities. Our primary objective for holding available-for-sale debt investments is to achieve an appropriate investment return consistent with preserving principal and managing risk. At any time, a sharp rise in market interest rates could have a material adverse impact on the fair value of our available-for-sale debt investment portfolio. Conversely, declines in interest rates as has also happened recently, including the impact from lower credit spreads, could have a material adverse impact on interest income for our investment portfolio. We may utilize derivative instruments designated as hedging instruments to achieve our investment objectives. We had no outstanding hedging instruments for our available-for-sale debt investments as of July 25, 2020. Our available-for-sale debt investments are held for purposes other than trading. Our available-for-sale debt investments are not leveraged as of July 25, 2020. We monitor our interest rate and credit risks, including our credit exposures to specific rating categories and to individual issuers. We believe the overall credit quality of our portfolio is strong.
The following tables present the hypothetical fair values of our available-for-sale debt investments, including the hedging effects when applicable, as a result of selected potential market decreases and increases in interest rates. The market changes reflect immediate hypothetical parallel shifts in the yield curve of plus or minus 50 basis points (BPS), plus 100 BPS, and plus 150 BPS. The hypothetical fair values as of July 25, 2020 and July 27, 2019 are as follows (in millions):
| VALUATION OF SECURITIES GIVEN AN INTEREST RATE DECREASE OF X BASIS POINTS | FAIR VALUE AS OF JULY 25, 2020 | VALUATION OF SECURITIES GIVEN AN INTEREST RATE INCREASE OF X BASIS POINTS | |||||||||||
| (150 BPS) | (100 BPS) | (50 BPS) | 50 BPS | 100 BPS | 150 BPS | ||||||||
| Available-for-sale debt investments | $17,877 | $17,788 | $17,699 | $17,610 | $17,522 | $17,433 | $17,344 |
| VALUATION OF SECURITIES GIVEN AN INTEREST RATE DECREASE OF X BASIS POINTS | FAIR VALUE AS OF JULY 27, 2019 | VALUATION OF SECURITIES GIVEN AN INTEREST RATE INCREASE OF X BASIS POINTS | |||||||||||
| (150 BPS) | (100 BPS) | (50 BPS) | 50 BPS | 100 BPS | 150 BPS | ||||||||
| Available-for-sale debt investments | $22,017 | $21,898 | $21,779 | $21,660 | $21,541 | $21,421 | $21,302 |
Financing Receivables As of July 25, 2020, our financing receivables had a carrying value of $10.8 billion, compared with $10.1 billion as of July 27, 2019. As of July 25, 2020, a hypothetical 50 BPS increase or decrease in market interest rates would change the fair value of our financing receivables by a decrease or increase of approximately $0.1 billion, respectively.
Debt As of July 25, 2020, we had $14.5 billion in principal amount of senior fixed-rate notes outstanding. The carrying amount of the senior notes was $14.6 billion, and the related fair value based on market prices was $17.4 billion. As of July 25, 2020, a hypothetical 50 BPS increase or decrease in market interest rates would change the fair value of the fixed-rate debt, excluding the $2.5 billion of hedged debt, by a decrease or increase of approximately $0.5 billion, respectively. However, this hypothetical change in interest rates would not impact the interest expense on the fixed-rate debt that is not hedged.
Equity Price Risk
Marketable Equity Investments The fair value of our marketable equity investments is subject to market price volatility. We may hold equity securities for strategic purposes or to diversify our overall investment portfolio. These equity securities are held for purposes other than trading. We had no outstanding marketable equity securities as of July 25, 2020.
Non-marketable Equity and Other Investments These investments are recorded in other assets in our Consolidated Balance Sheets. As of July 25, 2020, the total carrying amount of our non-marketable equity and other investments was $1.3 billion, compared with $1.2 billion at July 27, 2019. Some of these companies in which we invested are in the startup or development stages. These investments are inherently risky because the markets for the technologies or products these companies are developing are typically in the early stages and may never materialize. We could lose our entire investment in these companies. Our evaluation of non-marketable equity and other investments is based on the fundamentals of the businesses invested in, including, among other factors, the nature of their technologies and potential for financial return.
Foreign Currency Exchange Risk
Our foreign exchange forward contracts outstanding at fiscal year-end are summarized in U.S. dollar equivalents as follows (in millions):
| July 25, 2020 | July 27, 2019 | ||||||||||||||
| Notional Amount | Fair Value | Notional Amount | Fair Value | ||||||||||||
| Forward contracts: | |||||||||||||||
| Purchased | $ | 2,441 | $ | 1 | $ | 2,239 | $ | 14 | |||||||
| Sold | $ | 1,874 | $ | 4 | $ | 1,441 | $ | (14 | ) |
At July 25, 2020 and July 27, 2019, we had no option contracts outstanding.
We conduct business globally in numerous currencies. The direct effect of foreign currency fluctuations on revenue has not been material because our revenue is primarily denominated in U.S. dollars. However, if the U.S. dollar strengthens relative to other currencies, such strengthening could have an indirect effect on our revenue to the extent it raises the cost of our products to non-U.S. customers and thereby reduces demand. A weaker U.S. dollar could have the opposite effect. However, the precise indirect effect of currency fluctuations is difficult to measure or predict because our revenue is influenced by many factors in addition to the impact of such currency fluctuations.
Approximately 70% of our operating expenses are U.S.-dollar denominated. In fiscal 2020, foreign currency fluctuations, net of hedging, decreased our combined R&D, sales and marketing, and G&A expenses by approximately $141 million, or 0.8%, as compared with fiscal 2019. To reduce variability in operating expenses and service cost of sales caused by non-U.S.-dollar denominated operating expenses and costs, we may hedge certain forecasted foreign currency transactions with currency options and forward contracts. These hedging programs are not designed to provide foreign currency protection over long time horizons. In designing a specific hedging approach, we consider several factors, including offsetting exposures, significance of exposures, costs associated with entering into a particular hedge instrument, and potential effectiveness of the hedge. The gains and losses on foreign exchange contracts mitigate the effect of currency movements on our operating expenses and service cost of sales.
We also enter into foreign exchange forward and option contracts to reduce the short-term effects of foreign currency fluctuations on receivables and payables that are denominated in currencies other than the functional currencies of the entities. The market risks associated with these foreign currency receivables, investments, and payables relate primarily to variances from our forecasted foreign currency transactions and balances. We do not enter into foreign exchange forward or option contracts for speculative purposes.
Item 8. Financial Statements and Supplementary Data
Index to Consolidated Financial Statements
Report of Independent Registered Public Accounting Firm
To the Board of Directors and Shareholders of Cisco Systems, Inc.
Opinions on the Financial Statements and Internal Control over Financial Reporting
We have audited the accompanying consolidated balance sheets of Cisco Systems, Inc. and its subsidiaries (the “Company”) as of July 25, 2020 and July 27, 2019, and the related consolidated statements of operations, comprehensive income (loss), equity and cash flows for each of the three years in the period ended July 25, 2020, including the related notes and schedule of valuation and qualifying accounts for each of the three years in the period ended July 25, 2020 appearing under Item 15 (collectively referred to as the “consolidated financial statements”). We also have audited the Company's internal control over financial reporting as of July 25, 2020, based on criteria established in Internal Control - Integrated Framework (2013) issued by the Committee of Sponsoring Organizations of the Treadway Commission (COSO).
In our opinion, the consolidated financial statements referred to above present fairly, in all material respects, the financial position of the Company as of July 25, 2020 and July 27, 2019, and the results of its operations and its cash flows for each of the three years in the period ended July 25, 2020 in conformity with accounting principles generally accepted in the United States of America. Also in our opinion, the Company maintained, in all material respects, effective internal control over financial reporting as of July 25, 2020, based on criteria established in Internal Control - Integrated Framework (2013) issued by the COSO.
Changes in Accounting Principles
As discussed in Note 2 to the consolidated financial statements, the Company changed the manner in which it accounts for leases in 2020 and the manner in which it accounts for revenue from contracts with customers in 2019.
Basis for Opinions
The Company's management is responsible for these consolidated financial statements, for maintaining effective internal control over financial reporting, and for its assessment of the effectiveness of internal control over financial reporting, included in the accompanying Management’s Report on Internal Control over Financial Reporting. Our responsibility is to express opinions on the Company’s consolidated financial statements and on the Company's internal control over financial reporting based on our audits. We are a public accounting firm registered with the Public Company Accounting Oversight Board (United States) (PCAOB) and are required to be independent with respect to the Company in accordance with the U.S. federal securities laws and the applicable rules and regulations of the Securities and Exchange Commission and the PCAOB.
We conducted our audits in accordance with the standards of the PCAOB. Those standards require that we plan and perform the audits to obtain reasonable assurance about whether the consolidated financial statements are free of material misstatement, whether due to error or fraud, and whether effective internal control over financial reporting was maintained in all material respects.
Our audits of the consolidated financial statements included performing procedures to assess the risks of material misstatement of the consolidated financial statements, whether due to error or fraud, and performing procedures that respond to those risks. Such procedures included examining, on a test basis, evidence regarding the amounts and disclosures in the consolidated financial statements. Our audits also included evaluating the accounting principles used and significant estimates made by management, as well as evaluating the overall presentation of the consolidated financial statements. Our audit of internal control over financial reporting included obtaining an understanding of internal control over financial reporting, assessing the risk that a material weakness exists, and testing and evaluating the design and operating effectiveness of internal control based on the assessed risk. Our audits also included performing such other procedures as we considered necessary in the circumstances. We believe that our audits provide a reasonable basis for our opinions.
Definition and Limitations of Internal Control over Financial Reporting
A company’s internal c
Showing the first 8K of 219K characters. Open the full section
Item 9. Changes in and Disagreements with Accountants on Accounting and Financial Disclosures
None.
Item 9A. Controls and Procedures
Evaluation of Disclosure Controls and Procedures
Based on our management’s evaluation (with the participation of our principal executive officer and principal financial officer), as of the end of the period covered by this report, our principal executive officer and principal financial officer have concluded that our disclosure controls and procedures (as defined in Rules 13a-15(e) and 15d-15(e) under the Securities Exchange Act of 1934, as amended, (the “Exchange Act”)) are effective to ensure that information required to be disclosed by us in reports that we file or submit under the Exchange Act is recorded, processed, summarized and reported within the time periods specified in Securities and Exchange Commission rules and forms and is accumulated and communicated to our management, including our principal executive officer and principal financial officer, as appropriate to allow timely decisions regarding required disclosure.
Internal Control over Financial Reporting
Management’s report on our internal control over financial reporting and the report of our independent registered public accounting firm on our internal control over financial reporting are set forth, respectively, on page 58 under the caption “Management’s Report on Internal Control Over Financial Reporting” and on page 56 of this report.
There was no change in our internal control over financial reporting during our fourth quarter of fiscal 2020 that has materially affected, or is reasonably likely to materially affect, our internal control over financial reporting.
Item 9B. Other Information
None.
PART III
Item 10. Directors, Executive Officers and Corporate Governance
The information required by this item relating to our directors and nominees is included under the captions “Proposal No. 1 — Election of Directors,” “Business Experience and Qualifications of Nominees” and “Board Meetings and Committees” in our Proxy Statement related to the 2020 Annual Meeting of Shareholders and is incorporated herein by reference.
The information required by this item regarding our Audit Committee is included under the caption “Board Meetings and Committees” in our Proxy Statement related to the 2020 Annual Meeting of Shareholders and is incorporated herein by reference.
Pursuant to General Instruction G(3) of Form 10-K, the information required by this item relating to our executive officers is included under the caption “Information about our Executive Officers” in Part I of this report.
With regard to the information required by this item regarding compliance with Section 16(a) of the Exchange Act, we will provide disclosure of delinquent Section 16(a) reports, if any, in our Proxy Statement related to the 2020 Annual Meeting of Shareholders, and such disclosure, if any, is incorporated herein by reference.
We have adopted a code of ethics that applies to our principal executive officer and all members of our finance department, including the principal financial officer and principal accounting officer. This code of ethics is entitled “Financial Officer Code of Ethics: Additional Ethics Obligations for All Finance Employees” and can be found at the “Financial Officer Code of Ethics” link in the Corporate Governance section of Cisco’s Investor Relations website at investor.cisco.com.
We intend to satisfy any disclosure requirement under Item 5.05 of Form 8-K regarding an amendment to, or waiver from, a provision of this code of ethics by posting such information on our investor relations website
Item 11. Executive Compensation
The information required by this item relating to executive compensation is included under the captions “Director Compensation,” “Compensation Discussion and Analysis,” “Compensation Committee Report,” “Compensation Committee Interlocks and Insider Participation,” “Summary Compensation Table,” “Grants of Plan-Based Awards—Fiscal 2020,” “Outstanding Equity Awards at 2020 Fiscal Year End,” “Option Exercises and Stock Vested — Fiscal 2020,” “Nonqualified Deferred Compensation — Fiscal 2020,” “Potential Payments upon Termination or Change in Control,” “Potential Payments — Accelerated Equity Awards,” and “CEO Pay Ratio” in our Proxy Statement related to the 2020 Annual Meeting of Shareholders and is incorporated herein by reference.
Item 12. Security Ownership of Certain Beneficial Owners and Management and Related Stockholder Matters
The information required by this item relating to security ownership of certain beneficial owners and management is included under the caption “Ownership of Securities,” and the information required by this item relating to securities authorized for issuance under equity compensation plans is included under the caption “Proposal No. 3 — Approval of the Amendment and Restatement of the 2005 Stock Incentive Plan,” in each case in our Proxy Statement related to the 2020 Annual Meeting of Shareholders, and is incorporated herein by reference.
Item 13. Certain Relationships and Related Transactions, and Director Independence
The information required by this item relating to review, approval or ratification of transactions with related persons is included under the caption “Certain Relationships and Transactions with Related Persons,” and the information required by this item relating to director independence is included under the caption “Independent Directors,” in each case in our Proxy Statement related to the 2020 Annual Meeting of Shareholders, and is incorporated herein by reference.
Item 14. Principal Accountant Fees and Services
The information required by this item is included under the captions “Proposal No. 5 — Ratification of Independent Registered Public Accounting Firm” in our Proxy Statement related to the 2020 Annual Meeting of Shareholders, and is incorporated herein by reference.
PART IV
Item 15. Exhibits and Financial Statement Schedules
| (a) | 1. Financial Statements |
See the “Index to Consolidated Financial Statements” on page 55 of this report.
| 2. | Financial Statement Schedule |
See “Schedule II—Valuation and Qualifying Accounts” (below) within Item 15 of this report.
| 3. | Exhibits |
See the “Index to Exhibits” beginning on page 107 of this report.
SCHEDULE II
VALUATION AND QUALIFYING ACCOUNTS
(in millions)
| July 25, 2020 | July 27, 2019 | July 28, 2018 | |||||||||
| Allowance for Doubtful Accounts: | |||||||||||
| Balance at beginning of fiscal year | $ | 136 | $ | 129 | $ | 211 | |||||
| Provisions (benefits) | 55 | 56 | (45 | ) | |||||||
| Recoveries (write-offs), net | (48 | ) | (50 | ) | (37 | ) | |||||
| Foreign exchange and other | — | 1 | — | ||||||||
| Balance at end of fiscal year | $ | 143 | $ | 136 | $ | 129 | |||||
| Allowance for Financing Receivables: | |||||||||||
| Balance at beginning of fiscal year | $ | 126 | $ | 205 | $ | 295 | |||||
| Provisions (benefits) | 38 | (16 | ) | (89 | ) | ||||||
| Recoveries (write-offs), net | (22 | ) | (42 | ) | (6 | ) | |||||
| Foreign exchange and other | (4 | ) | (21 | ) | 5 | ||||||
| Balance at end of fiscal year | $ | 138 | $ | 126 | $ | 205 | |||||
| Deferred Tax Asset Valuation Allowance: | |||||||||||
| Balance at beginning of fiscal year | $ | 457 | $ | 374 | $ | 244 | |||||
| Additions | 279 | 112 | 163 | ||||||||
| Deductions | (29 | ) | (20 | ) | (7 | ) | |||||
| Write-offs | (7 | ) | (8 | ) | (26 | ) | |||||
| Foreign exchange and other | — | (1 | ) | — | |||||||
| Balance at end of fiscal year | $ | 700 | $ | 457 | $ | 374 |
INDEX TO EXHIBITS
| Exhibit Number | Exhibit Description | Incorporated by Reference | Filed Herewith | |||||||||
| Form | File No. | Exhibit | Filing Date | |||||||||
| 31.1 | Rule 13a–14(a)/15d–14(a) Certification of Principal Executive Officer | X | ||||||||||
| 31.2 | Rule 13a–14(a)/15d–14(a) Certification of Principal Financial Officer | X | ||||||||||
| 32.1 | Section 1350 Certification of Principal Executive Officer | X | ||||||||||
| 32.2 | Section 1350 Certification of Principal Financial Officer | X | ||||||||||
| 101.INS | Inline XBRL Instance Document | X | ||||||||||
| 101.SCH | Inline XBRL Taxonomy Extension Schema Document | X | ||||||||||
| 101.CAL | Inline XBRL Taxonomy Extension Calculation Linkbase Document | X | ||||||||||
| 101.DEF | Inline XBRL Taxonomy Extension Definition Linkbase Document | X | ||||||||||
| 101.LAB | Inline XBRL Taxonomy Extension Label Linkbase Document | X | ||||||||||
| 101.PRE | Inline XBRL Taxonomy Extension Presentation Linkbase Document | X | ||||||||||
| 104 | Cover Page Interactive Data File (Embedded within the Inline XBRL document and included in Exhibit 101) | X |
| * | Indicates a management contract or compensatory plan or arrangement. |
Item 16. Form 10-K Summary
None.
SIGNATURES
Pursuant to the requirements of Section 13 or 15(d) of the Securities Exchange Act of 1934, the registrant has duly caused this Report on Form 10-K to be signed on its behalf by the undersigned, thereunto duly authorized.
| September 3, 2020 | CISCO SYSTEMS, INC. | |||
| /S/ CHARLES H. ROBBINS | ||||
| Charles H. Robbins | ||||
| Chairman and Chief Executive Officer |
POWER OF ATTORNEY
KNOW ALL PERSONS BY THESE PRESENTS, that each person whose signature appears below constitutes and appoints Charles H. Robbins and Kelly A. Kramer, jointly and severally, his attorney-in-fact, each with the full power of substitution, for such person, in any and all capacities, to sign any and all amendments to this Annual Report on Form 10-K, and to file the same, with all exhibits thereto and other documents in connection therewith, with the Securities and Exchange Commission, granting unto said attorney-in-fact and agent full power and authority to do and perform each and every act and thing requisite and necessary to be done in connection therewith, as fully to all intents and purposes as he might do or could do in person hereby ratifying and confirming all that each of said attorneys-in-fact and agents, or his substitute, may do or cause to be done by virtue hereof.
Pursuant to the requirements of the Securities Exchange Act of 1934, this Report on Form 10-K has been signed below by the following persons on behalf of the registrant and in the capacities and on the dates indicated.
| Signature | Title | Date |
| /S/ CHARLES H. ROBBINS | Chairman and Chief Executive Officer | September 3, 2020 |
| Charles H. Robbins | (Principal Executive Officer) | |
| /S/ KELLY A. KRAMER | Executive Vice President and Chief Financial Officer | September 3, 2020 |
| Kelly A. Kramer | (Principal Financial Officer) | |
| /S/ PRAT S. BHATT | Senior Vice President, Corporate Controller and | September 3, 2020 |
| Prat S. Bhatt | Chief Accounting Officer | |
| (Principal Accounting Officer) | ||
| Signature | Title | Date |
| /S/ M. MICHELE BURNS | Director | September 3, 2020 |
| M. Michele Burns | ||
| /S/ WESLEY G. BUSH | Director | September 3, 2020 |
| Wesley G. Bush | ||
| /S/ MICHAEL D. CAPELLAS | Lead Independent Director | September 3, 2020 |
| Michael D. Capellas | ||
| /S/ MARK GARRETT | Director | September 3, 2020 |
| Mark Garrett | ||
| /S/ KRISTINA M. JOHNSON | Director | September 3, 2020 |
| Dr. Kristina M. Johnson | ||
| /S/ RODERICK C. MCGEARY | Director | September 3, 2020 |
| Roderick C. McGeary | ||
| /S/ ARUN SARIN | Director | September 3, 2020 |
| Arun Sarin | ||
| /S/ BRENTON L. SAUNDERS | Director | September 3, 2020 |
| Brenton L. Saunders | ||
| /S/ LISA T. SU | Director | September 3, 2020 |
| Dr. Lisa T. Su |