 filings.tools
Item 5. Market for the Registrant’s Common Stock, Related Stockholder Matters and Issuer Purchases of Equity Securities
6K characters. Original on sec.gov · Markdown
Item 5. Market for the Registrant’s Common Stock, Related Stockholder Matters and Issuer Purchases of Equity Securities
Price Range of Common Stock. Our common stock is traded on the Nasdaq Global Select Market under the symbol “CSGP.” The following table sets forth, for the periods indicated, the high and low daily closing prices per share of our common stock, as reported by the Nasdaq Global Select Market.
| High | Low | ||||||
| Year Ended December 31, 2011 | |||||||
| First Quarter | $ | 62.89 | $ | 55.58 | |||
| Second Quarter | $ | 72.84 | $ | 55.86 | |||
| Third Quarter | $ | 59.50 | $ | 46.70 | |||
| Fourth Quarter | $ | 68.39 | $ | 49.22 | |||
| Year Ended December 31, 2012 | |||||||
| First Quarter | $ | 69.86 | $ | 56.67 | |||
| Second Quarter | $ | 81.20 | $ | 67.26 | |||
| Third Quarter | $ | 85.40 | $ | 77.79 | |||
| Fourth Quarter | $ | 89.54 | $ | 77.06 |
As of February 1, 2013, there were 695 holders of record of our common stock.
Dividend Policy. We have never declared or paid any dividends on our common stock. Any future determination to pay dividends will be at the discretion of our Board of Directors, subject to applicable limitations under Delaware law, and will be dependent upon our results of operations, financial position and other factors deemed relevant by our Board of Directors. We do not anticipate paying any dividends on our common stock during the foreseeable future, but intend to retain any earnings for future growth of our business.
Recent Issues of Unregistered Securities. We did not issue any unregistered securities during the year ended December 31, 2012.
Issuer Purchases of Equity Securities. The following table is a summary of our repurchases of common stock during each of the three months in the quarter ended December 31, 2012:
ISSUER PURCHASES OF EQUITY SECURITIES
| Month, 2012 | Total Number of Shares Purchased | Average Price Paid per Share | Total Number of Shares Purchased as Part of Publicly Announced Plans or Programs | Maximum Number of Shares that May Yet Be Purchased Under the Plans or Programs | |||||
| October 1 through 31 | — | — | — | — | |||||
| November 1 through 30 | — | — | — | — | |||||
| December 1 through 31 | 4,485 | $86.47 | — | — | |||||
| Total | 4,485 | (1) | $86.47 | — | — |
(1) The number of shares purchased consists of shares of common stock tendered by employees to the Company to satisfy the employees’ minimum tax withholding obligations arising as a result of vesting of restricted stock grants under the Company’s 2007 Stock Incentive Plan, as amended, which shares were purchased by the Company based on their fair market value on the vesting date. None of these share purchases were part of a publicly announced program to purchase common stock of the Company.
Stock Price Performance Graph
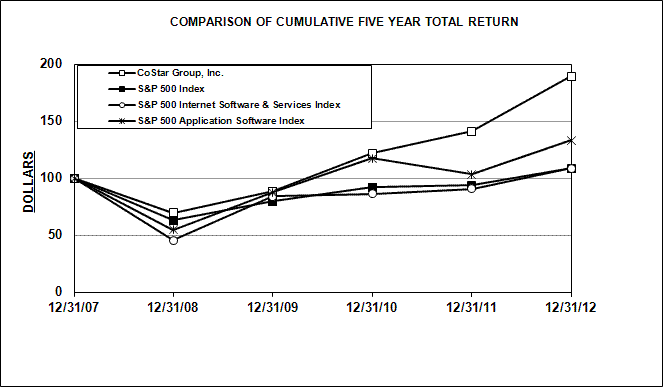
The stock performance graph below shows how an initial investment of $100 in our common stock would have compared to:
| • | An equal investment in the Standards & Poor's Stock 500 (“S&P 500”) Index; |
| • | An equal investment in the S&P 500 Internet Software & Services Index; and |
| • | An equal investment in the S&P 500 Application Software Index. |
As a result of the evolving nature of our business and our acquisition of LoopNet, on April 30, 2012, the company's Global Industry Classification Standard ("GICS") code was re-assigned by Standard & Poor's as Internet Software & Services. Therefore, we now use the S&P 500 Internet Software & Services Index instead of the S&P 500 Application Software Index presented in prior years as an industry index for comparison against our total return. In general, a comparable S&P 500 Index may change whenever there is a major corporate action. SEC rules require that if an index is selected which is different from the index used in the immediately preceding fiscal year, the total return must be compared with both the newly selected index and the index used in the prior year. As a result, a comparison of our total return to that of the S&P 500 Internet Software & Services Index and the S&P 500 Application Software Index is presented below. We believe that the S&P 500 Internet Software & Services Index is an appropriate index to compare us with other companies in our industry and that it is a widely recognized and used index for which components and total return information are readily accessible to our stockholders to assist in their understanding of our performance relative to other companies in our industry.
The comparison covers the period beginning December 31, 2007, and ending on December 31, 2012, and assumes the reinvestment of any dividends. You should note that this performance is historical and is not necessarily indicative of future price performance.
| Company / Index | 12/31/07 | 12/31/08 | 12/31/09 | 12/31/10 | 12/31/11 | 12/31/12 | ||||||||||||
| CoStar Group, Inc. | 100 | 69.71 | 88.40 | 121.82 | 141.23 | 189.14 | ||||||||||||
| S&P 500 Index | 100 | 63.00 | 79.67 | 91.68 | 93.61 | 108.59 | ||||||||||||
| S&P 500 Internet Software & Services Index | 100 | 45.41 | 83.86 | 86.01 | 90.53 | 108.48 | ||||||||||||
| S&P 500 Application Software Index | 100 | 54.67 | 87.37 | 117.42 | 103.20 | 133.32 |
Previous: Item 4. Mine Safety Disclosures · Next: Item 6. Selected Consolidated Financial and Operating Data