 filings.tools
CoStar Group (CSGP) 10-K risk factor changes: FY2014 vs FY2013
The 2014-12-31 10-K against the 2013-12-31 one, compared heading by heading and sentence by sentence. One of these filings carries no fiscal year tag, so its year is the calendar year of the period end.
Item 1A54 rewritten127 added14 removed280 unchanged
All filing items878 rewritten579 added280 removed1,875 unchanged
Summary
counted, not written
- Item 1A headings could not be compared: only 0 carried over between the two years, which usually means one filing was read wrongly, so none is reported as new or removed.
- Sentence by sentence, 579 added, 280 removed, 878 rewritten and 1,875 unchanged across 15 items that differ.
Sentences by item
21 items, with every count and a link to each item that changed
Underlined words on a shaded ground are new in FY2014; struck-through words were in FY2013. Sentences that are wholly new or wholly gone are labelled rather than marked.
Item 1A. Risk Factors
54 rewritten, 127 added, 14 removed, 280 unchanged
Forward-looking statements include information that is not purely historic fact and include, without limitation, statements concerning our financial outlook for [removed: 2014] [added: 2015] and beyond, our possible or assumed future results of operations generally, and other statements and information regarding assumptions about our revenues, EBITDA, adjusted EBITDA, [removed: non-GAAP] [added: non-generally accepted accounting principles (“GAAP”)] net income, non-GAAP net income per share, net [added: income, net] income per share, fully diluted net income per share, weighted-average outstanding shares, taxable income, cash flow from operating activities, available cash, operating costs, amortization expense, intangible asset recovery, capital and other expenditures, effective tax rate, equity compensation charges, future taxable income, purchase amortization, the anticipated benefits of completed acquisitions, the anticipated benefits of cross-selling efforts, [added: product development and release, sales and marketing campaigns, product integrations, elimination and de-emphasizing of services, contract renewal rate,] the timing of future payments of principal under our [removed: $175.0] [added: $400.0] million term loan facility available to us under a credit agreement [removed: (as amended, the “Credit] [added: dated April 1, 2014 (the “2014 Credit] Agreement”), expectations regarding our compliance with financial and restrictive covenants in [removed: our] [added: the 2014] Credit Agreement, acquisitions, financing plans, geographic expansion, [removed: product development and release, sales and marketing campaigns, product integrations, elimination and de-emphasizing of services, contract renewal rate,] capital structure, contractual obligations, legal proceedings and claims, our database, database growth, services and facilities, employee relations, future economic performance, our ability to liquidate or realize our long-term investments, management’s plans, goals and objectives for future operations, and growth and markets for our stock.
The following important factors, in addition to those discussed or referred to under the heading “Risk Factors,” and other unforeseen events or circumstances, could affect our future results and could cause those results or other outcomes to differ materially from those expressed or implied in our forward-looking statements: commercial real estate market conditions; the pace of recovery in the commercial real estate market; general economic conditions; our ability to identify, acquire and integrate acquisition candidates; our ability to realize the expected benefits, cost savings or other synergies from [removed: acquisitions] [added: acquisitions, including the Apartments.com acquisition,] on a timely basis or at all; our ability to combine [removed: the] acquired businesses successfully or in a timely and cost-efficient manner; business disruption relating to integration of acquired [removed: businesses;] [added: businesses or other business initiatives;] the amount of investment for sales and marketing [removed: related] [added: and our ability] to [removed: cross-selling services of acquired businesses, the amount of investment for] [added: realize a return on investments in] sales and [removed: marketing initiatives with respect] [added: marketing; our ability] to [removed: product enhancements] [added: effectively] and [removed: releases, and/or the amount of investment in CoStarGo] [added: strategically combine, eliminate] or [removed: other marketing initiatives;] [added: de-emphasize service offerings; reductions in revenues as a result of service changes;] the time and resources required to develop upgraded services and [removed: expansion of] [added: expand] service offerings; changes or consolidations within the commercial real estate industry; customer retention; our ability to attract new clients; our ability to sell additional services to existing clients; our ability to integrate our [removed: U.S.] [added: North America] and [removed: international] [added: International] product offerings; our ability to successfully introduce new products or upgraded services in U.S. and foreign markets; our ability to [removed: effectively and strategically combine, eliminate or de-emphasize service offerings;] [added: attract consumers to our online marketplaces;] competition; foreign currency fluctuations; global credit market conditions affecting investments; our ability to continue to expand successfully, timely and in a cost-efficient manner, including internationally; our ability to effectively penetrate [removed: the market for retail real estate information] and gain acceptance in [removed: that market;] [added: new sectors;] our ability to control costs; litigation; changes in accounting policies or practices; release of new and upgraded services or entry into new markets by us or our competitors; data quality; [removed: growth and] [added: expansion, growth,] development [added: and reorganization] of our sales force; employee retention; technical problems with our services; managerial execution; changes in relationships with real estate brokers and other strategic partners; legal and regulatory issues; and successful adoption of and training on our services.
Our success and revenues depend on attracting and retaining subscribers to our information, analytics and [removed: marketing services.][added: online marketplaces.]
Our subscription-based information, analytics and [removed: marketing services] [added: online marketplaces] generate the largest portion of our revenues.
A reversal of [removed: recent] improvements in the commercial real estate industry’s leasing activity and absorption rates or a renewed downturn in the commercial real estate market may affect our ability to generate revenues and may lead to more cancellations by our current or future customers, either of which could cause our revenues or our revenue growth rate to decline and reduce our profitability.
A depressed commercial real estate market has a negative impact on our core customer base, which could decrease demand for our information, analytics and [removed: marketing services.][added: online marketplaces.]
Consolidation, or other cost-cutting measures by our customers, may lead to [removed: more] cancellations of our information, analytics and [removed: marketing] [added: online marketplace] services by our customers, reduce the number of our existing clients, reduce the size of our target market or increase our clients’ bargaining power, all of which could cause our revenues to decline and reduce our profitability.
[added: During 2015, we plan to continue to increase the depth of our coverage in the U.S., Canada and the U.K.] If we are unable to manage our expansion efforts effectively, if our expansion efforts take longer than planned or if our costs for these efforts exceed our expectations, our financial position could be adversely affected.
If we are not able to obtain and maintain accurate, comprehensive or reliable data, we could experience reduced demand for our information, analytics and [removed: marketing] [added: online marketplace] services.
We may not be able to successfully introduce new or upgraded information, analytics and [removed: marketing] [added: online marketplace] services or combine or shift focus from services with less demand, which could decrease our revenues and our profitability.
To be successful, we must adapt to changes in the industry, as well as rapid technological changes by continually enhancing our information, analytics and [removed: marketing] [added: online marketplace] services.
Competition in this market may increase further [removed: as a result of current recessionary] [added: if] economic [removed: conditions, as] [added: conditions or other circumstances cause] customer bases and customer spending [removed: have decreased] [added: to decrease] and service providers [removed: are competing] [added: to compete] for fewer customer resources.
Our investment strategy is intended to increase our revenue growth in the [removed: future as activity in the commercial real estate industry shows signs of economic recovery.][added: future.]
Furthermore, [removed: if the industry fails to stabilize or deteriorates further in 2014 and beyond,] our investments may not have their intended effect.
If we are unable to enforce or defend our ownership and use of intellectual property, our business, [added: brands,] competitive position and operating results could be harmed.
The success of our business depends in large part on [removed: the] [added: our] intellectual [added: property, including intellectual] property involved in our methodologies, database, services and software.
We rely on a combination of [added: trademark,] trade secret, patent, copyright and other laws, nondisclosure and noncompetition provisions, license agreements and other contractual provisions and technical measures to protect our intellectual property rights.
In addition, if we do not prevail on any intellectual property claims, this could result in a change to our methodology or information, analytics and [removed: marketing] [added: online marketplace] services and could reduce our profitability.
In addition, “copycat” websites may misappropriate data on our website and attempt to imitate our [removed: brand] [added: brands] or the functionality of our website.
[removed: In certain circumstances, we] [added: We] also [removed: collect] [added: collect, store] and use [added: sensitive or confidential transaction information and, in certain circumstances,] credit card information.
Our policies concerning the collection, use and disclosure of [removed: personally identifiable] [added: these types of] information are described on our websites.
While we believe that our policies are appropriate and that we are in compliance with our policies, we could be subject to legal claims, government [removed: action or] [added: action,] harm to our reputation [added: or experience significant remediation costs] if [added: we experience a security breach or] our practices fail, or are seen as failing, to comply with our policies or with applicable laws concerning personally identifiable information.
Our potential liability for information distributed by us to others could require us to implement measures to reduce our exposure to such liability, which may require us to expend substantial resources and limit the attractiveness of our information, analytics and [removed: marketing services] [added: online marketplaces] to users.
We may face adverse publicity and loss of consumer confidence if we are not able to comply with laws requiring us to take adequate measures to assure the confidentiality of the personally identifiable information that our customers [removed: had] [added: have] given to us.
To retain and attract key personnel, we use various measures, including employment agreements, awards under a stock incentive plan and incentive bonuses for key [removed: executive officers.][added: employees.]
We consider our operating segments, [removed: U.S.] [added: North America] and International, as our reporting units under Financial Accounting Standards Board (“FASB”) authoritative guidance for consideration of potential impairment of goodwill.
As of December 31, [removed: 2013,] [added: 2014,] we had [removed: $718.6 million] [added: approximately $1.1 billion] of goodwill, [removed: $692.6 million] [added: including $1.1 billion] in our [removed: U.S.] [added: North America] segment and [removed: $26.0] [added: $24.4] million in our International segment.
If we are unable to obtain or retain listings from commercial real estate brokers, agents, [removed: and] property owners, [added: and apartment property managers,] our commercial real estate ("CRE") marketplace services, including but not limited to [removed: the LoopNet marketplace,] [added: LoopNet, Apartments.com,] CoStar Showcase, LandandFarm.com and Lands of America, could be less attractive to current or potential customers, which could reduce our revenues.
The success of our CRE marketplace services depends substantially on the number of [removed: commercial real estate] property listings submitted by brokers, [removed: agents and] [added: agents,] property [removed: owners.][added: owners and, in the case of apartment rentals, property managers.]
Reduced demand, whether due to changes in customer preference, a [removed: further] weakening of the U.S. or global economy, competition or other reasons, may result in decreased revenue and growth, adversely affecting our operating results.
Due to our acquisitions of CoStar U.K. Limited (formerly FOCUS Information Limited), Grecam S.A.S., and Property and Portfolio Research Ltd., [added: as well as our expansion into Canada,] a portion of our business is denominated in the British [removed: Pound] [added: Pound, Euro] and [removed: Euro.][added: Canadian dollar.]
On [removed: February 16, 2012,] [added: April 1, 2014 (the “Closing Date”),] we entered into [removed: a] [added: the 2014] Credit Agreement by and among CoStar, as borrower, CoStar Realty Information, Inc., as co-borrower, the lenders from time to time party thereto and [removed: J.P. Morgan] [added: JPMorgan Chase] Bank, [added: N.A.,] as administrative agent.
The [added: 2014] Credit Agreement provides for a [removed: $175.0] [added: $400.0] million term loan facility and a [removed: $50.0] [added: $225.0] million revolving credit facility, each with a term of five years.
The [added: 2014] Credit Agreement contains customary restrictive covenants imposing operating and financial restrictions on us, including restrictions that may limit our ability to engage in acts that we believe may be in our long-term best interests.
These covenants restrict our ability and the ability of our subsidiaries [removed: (i)] to [added: (i)] incur additional indebtedness, (ii) [removed: to] create, incur, assume or permit to exist any liens, (iii) [removed: to] enter into mergers, consolidations or similar transactions, (iv) [removed: to] make investments and acquisitions, (v) [removed: to] make certain dispositions of assets, (vi) [removed: to] make dividends, distributions and prepayments of certain indebtedness, and (vii) [removed: to] enter into certain transactions with affiliates.
The operating restrictions and financial covenants in the [added: 2014] Credit Agreement and any future financing agreements may limit our ability to finance future operations or capital needs, to engage in other business activities or to respond to changes in market conditions.
Our ability to comply with any financial covenants could be [removed: materially] affected [added: materially] by events beyond our [removed: control.][added: control, and we may be unable to satisfy any such requirements.]
We are required to make periodic principal and interest payments pursuant to the terms of the [added: 2014] Credit Agreement.
If an event of default occurs, the [added: interest rate on overdue amounts will increase and the] lenders under the [added: 2014] Credit Agreement may declare all outstanding borrowings, together with accrued interest and other fees, to be immediately due and payable and may exercise remedies in respect of the collateral.
We may not be able to repay all amounts due under the [added: 2014] Credit Agreement in the event these amounts are declared due upon an event of default.
We compete against many other commercial real estate information, analytics, and marketing service providers for business, including competitors that offer their services through rapidly changing methods of delivering real estate information.
The commercial real estate market may be adversely impacted by many different factors, including lower than expected job growth or job losses resulting in reduced real estate demand; rising interest rates and slowing transaction volumes that negatively impact investment returns; excessive speculative new construction in localized markets resulting in increased vacancy rates and diminished rent growth; and unanticipated disasters and other adverse events such as slowing of the growth in the working age population resulting in reduced demand for all types of real estate.
If cancellations, reductions of services, and failures to pay increase, and we are unable to offset the resulting decrease in revenue by increasing sales to new or existing customers, our revenues may decline or grow at lower rates.
We may not be able to compete successfully against existing or future competitors in attracting advertisers, which could harm our business, results of operations and financial condition.
We compete to attract advertisers.
Large companies with significant brand recognition have large numbers of direct sales personnel and web traffic, which may provide a competitive advantage.
To compete successfully for advertisers against future and existing competitors, we must continue to invest resources in developing our advertising platform and proving the effectiveness and relevance of our advertising services.
Pressure from competitors seeking to acquire a greater share of our advertisers’ overall marketing budget could adversely affect our pricing and margins, lower our revenue, and increase our research and development and marketing expenses.
If we are unable to compete successfully against our existing or future competitors, our business, results of operations or financial condition could be adversely affected.
We may be unable to increase awareness of our brands, including CoStar, LoopNet or Apartments.com, which could adversely affect our business.
We rely heavily on our brands, which we believe are key assets of our Company.
Awareness and differentiation of our brands are important for attracting and expanding the number of users of, and subscribers to, our online marketplaces, such as Apartments.com and LoopNet.com.
In 2015, we expect to increase our investment in sales and marketing activities by approximately $75.0 million to increase brand awareness and grow traffic in conjunction a wide-scale marketing campaign commencing during the first quarter of 2015 and running throughout the remainder of 2015 to generate brand awareness and site traffic for the improved Apartments.com website.
Further, we expect that sales and marketing expenses for our other brands will continue to increase as we seek to grow the number of subscribers or advertisers to our marketplaces.
Increased advertising may not be successful in increasing brand awareness or, ultimately, be cost-effective.
If we are unable to maintain or enhance user and advertiser awareness of our brands, or if we are unable to recover our additional marketing and advertising costs through increased usage of our services, our business, results of operations and financial condition could be adversely affected.
We rely on Internet search engines to drive traffic to our websites.
If search results do not feature our websites prominently, traffic to our websites would decrease and our business could be adversely affected.
Google, Bing, Yahoo!
and other Internet search websites drive traffic to our websites, including Apartments.com and LoopNet.com.
For example, when a user types an apartment building address into an Internet search engine, organic search ranking of our Apartments.com webpages will determine how prominently such webpages are displayed in the search results.
However, our ability to maintain high organic search result rankings is not entirely within our control.
Our competitors’ search engine optimization, or SEO, efforts may result in their websites receiving a higher search result page ranking than the rankings our websites receive, or Internet search engines could revise their methodologies in a way that would adversely affect our search result rankings, each of which could slow the growth of our user base.
Further, search engine providers could align with our competitors, which could adversely affect traffic to our websites.
Our websites have experienced fluctuations in search result rankings in the past, and we anticipate similar fluctuations in the future.
If we experience a material reduction in the number of users directed to our websites through Internet search engines, our business, results of operations and financial condition could be adversely affected.
If we are unable to maintain or increase traffic to our marketplaces, our business and operating results could be adversely affected.
Our ability to generate revenue from our marketplace businesses depends, in part, on our ability to attract users to our websites.
If we fail to maintain or increase traffic to our marketplaces, our ability to acquire additional subscribers or advertisers and deliver leads to existing subscribers and advertisers could be adversely affected.
We expect that our marketing expenses may increase in connection with our efforts to maintain or increase traffic to our websites.
Our efforts to maintain or generate additional traffic to our marketplaces may not be successful.
Even if we are able to attract additional users, increases in our operating expenses could negatively impact our operating results if we are unable to generate more revenue through increased sales of subscriptions to our marketplace products.
We also face competition to attract users to our marketplace websites.
Our existing and potential competitors include companies that could devote greater technical and other resources than we have available to provide services that users might view as superior to our offerings.
Any of our future or existing competitors may introduce different solutions that attract users away from our services or provide solutions similar to our own that have the advantage of better branding or marketing resources.
If we are unable to increase traffic to our marketplaces, or if we are unable to generate enough additional revenue to offset increases in expenses related to increasing traffic to our marketplaces, our business and operating results could be adversely affected.
If real estate professionals or other advertisers reduce or cancel their advertising spending with us and we are unable to attract new advertisers, our operating results would be harmed.
Our marketplace businesses, including the Apartments.com Business and LoopNet.com, depend on advertising revenue generated primarily through sales to persons in the real estate industry, including property managers and owners, and other advertisers.
Our ability to attract and retain advertisers, and ultimately to generate advertising revenue, depends on a number of factors, including:
| • | increasing the number of unique visitors to, and users of, our websites and mobile applications; |
During 2014, we plan to continue to increase the depth of our coverage in the U.S. and U.K., and we expect to expand into additional geographies including Toronto, Canada.
Our business could be significantly harmed if we are not able to protect our content and our other intellectual property.
If we expand into Canada as expected, a portion of our business will be denominated in Canadian dollars.
Our expansion into the commercial real estate analytics sector may not be successful or may not result in increased revenues, which may negatively impact our business, results of operations and financial position.
Expanding into the commercial real estate market research and forecasting sector has imposed and may continue to impose additional burdens on our research, systems development, sales, marketing and general management resources.
During 2014, we expect to continue to expand our presence in the commercial real estate analytics sector.
If we are unable to manage this expansion effectively or if our costs for this effort exceed our expectations, our financial position could be adversely affected.
In addition, if we incur additional costs to expand our analytics services and we are not successful in marketing or selling these expanded services, our expansion may have a material adverse effect on our financial position by increasing our expenses without increasing our revenues, adversely affecting our profitability.
On April 30, 2012, we used the proceeds of the $175.0 million term loan facility to fund a portion of the merger consideration and transaction costs for the LoopNet acquisition.
Problems with our website, the Internet or the services provided by our local exchange carriers or internet service providers could result in slower connections for our customers or interfere with our customers’ access to our information, analytics and marketing services.
If we experience technical problems in distributing our services, we could experience reduced demand for our information, analytics and marketing services.
Temporary or permanent outages of our computers, software or telecommunications equipment could lead to reduced demand for our information, analytics and marketing services, lower revenues and increased costs.
Any temporary or permanent loss of one or more of these systems or facilities from an accident, equipment malfunction or some other cause could harm our business.
If we experience a failure that prevents us from delivering our information, analytics and marketing services to clients, we could experience reduced demand for our information, analytics and marketing services, lower revenues and increased costs.
An excerpt. Shown here: 40 of 54 rewritten, 40 of 127 added and all 14 removed. The counts are complete. For every sentence, read Item 1A. Risk Factors in the FY2014 filing and the FY2013 filing.
Item 7. Management’s Discussion and Analysis of Financial Condition and Results of Operations
166 rewritten, 118 added, 96 removed, 275 unchanged
CoStar Group, Inc. (the “Company” or “CoStar”) is the number one provider of information, analytics and [removed: marketing services] [added: online marketplaces] to the commercial real estate industry in the United States ("U.S.") and the United Kingdom ("U.K.") based on the fact that we offer the most comprehensive commercial real estate database available; have the largest research department in the industry; own and operate the leading online [removed: marketplace] [added: marketplaces] for commercial real estate in the U.S. based on the number of unique visitors per month; provide more information, analytics and marketing services than any of our competitors and believe that we generate more revenues than any of our competitors.
We [removed: have] created and compiled our standardized [added: platform of] information, analytics and [removed: marketing platform] [added: online marketplace services] where members of the commercial real estate and related business community can continuously interact and facilitate transactions by efficiently exchanging accurate and standardized commercial real estate information.
LoopNet, our subsidiary, operates an online marketplace that enables [added: commercial] property owners, landlords, and [removed: commercial] real estate agents working on their behalf to list properties for sale or for lease and to submit detailed information about property listings.
We [removed: also] provide market research and analysis for commercial real estate investors and lenders via our [removed: Property and] [added: CoStar] Portfolio [removed: Research (“PPR”)] [added: Strategy and CoStar Market Analytics] service offerings, portfolio and debt [added: analysis,] management and reporting capabilities through our [removed: Resolve Technology] [added: CoStar Investment Analysis and CoStar Risk Analytics] service offerings, and real estate and lease management solutions, including lease administration and abstraction services, through our [removed: Virtual Premise] [added: CoStar Real Estate Manager] service offerings.
Our service offerings span all commercial property types, including office, [removed: industrial,] retail, [added: industrial, multifamily, commercial] land, [removed: mixed-use, hospitality] [added: mixed-use] and [removed: multifamily.][added: hospitality.]
Our subscription-based information services consist primarily of CoStar SuiteTM [removed: and FOCUSTM] services.
CoStar Suite is our primary service offering in our [removed: U.S.] [added: North America and International] operating [removed: segment.][added: segments.]
[added: Prior to the third quarter of 2014,] FOCUS [removed: is] [added: was] our primary service offering in our International operating segment.
[removed: Additionally, we] [added: We] introduced CoStar Suite in the U.K. in the fourth quarter of 2012 and no longer offered FOCUS to new clients beginning in 2013.
Contract rates are generally based on the number of sites, number of users, organization size, the client's business focus, geography and the number [added: and types] of services to which a client subscribes.
As of December 31, [removed: 2012] [added: 2013] and [removed: 2013,] [added: 2014,] our annualized net new sales of subscription-based services on annual contracts were approximately [removed: $10.9] [added: $15.8] million and [removed: $15.8] [added: $17.3] million, respectively, calculated based on the annualized amount of change in our sales resulting from new annual subscription-based contracts or upsales on existing annual subscription-based contracts, less write downs and cancellations, for the period reported.
For the twelve months ended December 31, [removed: 2012] [added: 2013] and [removed: 2013,] [added: 2014,] our contract renewal rate for existing CoStar subscription-based services was approximately [removed: 94%] [added: 93%] and [removed: 93%,] [added: 92%,] respectively, and therefore our cancellation rate for those services was approximately [removed: 6%] [added: 7%] and [removed: 7%,] [added: 8%,] respectively, for the same time periods.
We expect to continue [added: our] software development [added: efforts] to improve existing services, introduce new services, integrate products and services, cross-sell existing services, and expand and develop supporting technologies for our research, sales and marketing organizations.
We are committed to supporting and improving our [removed: existing core] information, news, analytic and [removed: marketing services.][added: online marketplace solutions.]
[removed: In] [added: Another example is our introduction in] October [removed: 2013, we introduced] [added: 2013 of] technology enhancements to CoStar Suite, our platform of service offerings consisting of CoStar Property Professional, CoStar COMPS Professional and CoStar Tenant.
[removed: The newly introduced] [added: For example, the] CoStar [removed: MultifamilyTM] [added: Multifamily®] information search allows [removed: access] [added: users] to [added: access] our extensive multifamily property database.
In addition, [removed: we introduced] CoStar Lease AnalysisTM, an integrated workflow [removed: tool that] [added: tool,] provides users a simple way to produce understandable cash flows for any proposed or existing lease.
We [removed: will] [added: plan to] continue [added: our] software development [removed: on] [added: efforts to enhance] our new Lease Analysis workflow tool [removed: throughout 2014.][added: and to develop other potential lease comparable services in 2015.]
[removed: Further, these] [added: These] technology enhancements are expected to drive continued revenue growth in [removed: 2014] [added: 2015] and for the foreseeable future.
[removed: We have] [added: In 2014, we] introduced enhancements to our flagship marketing platform, LoopNet.com.
For example, we added a [removed: broker] [added: targeted] advertising service that allows brokers [added: or firms] to purchase advertisements based on geographic and property type criteria.
Additionally, we introduced ProVideo, a service that enables owners and brokers to enhance their [added: LoopNet] listings with high quality videos of interior spaces, amenities and exterior features.
We continue to integrate, develop and cross-sell the services offered by the [removed: companies] [added: businesses] we [added: have] acquired, including [removed: LoopNet, Virtual Premise, Resolve Technology] [added: Apartments.com] and [removed: PPR.][added: LoopNet.]
[removed: In] [added: Further, in] some cases, when integrating and coordinating our services and assessing industry [added: and client] needs, we may [removed: decide, or may have previously decided,] [added: decide] to combine, shift focus from, de-emphasize, phase out, or eliminate a service [removed: that] [added: that, among other things,] overlaps or is redundant with other services we offer.
Our revenues have increased as a result of [removed: the LoopNet merger and prior acquisitions, due to] revenue from [removed: the] acquired businesses and from cross-selling opportunities among the customers of CoStar and the acquired companies.
[removed: We] [added: Internationally, we] continue to integrate our [removed: international] operations more fully with those in the U.S. [removed: We] [added: Similar to our North America operating segment, we] intend to continue to upgrade [removed: the] [added: our international] platform of services and expand the coverage of our service offerings within our International segment.
To further [removed: develop] those initiatives, we introduced CoStar Suite in the U.K. during the fourth quarter of 2012 and no longer offered FOCUS to new clients beginning in 2013.
CoStarGo 2.0 was released in the U.K. in October 2013 simultaneous with [removed: the] [added: its] release in the U.S. Additionally, we have upgraded our back-end research operations, fulfillment and Customer Relationship Management [removed: (“CRM”)] systems to support these new U.K. services.
The International operating segment continues to experience improved financial performance and [removed: most recently,] during the three months ended December 31, 2013, International EBITDA increased to a positive amount as a result of increased revenue and decreased operating expenses.
In 2014, we [removed: expect to expand further internationally by] [added: began] offering our services in Toronto, Canada.
We believe that our integration efforts and continued investments in our services, including expansion of our existing service [removed: offerings internationally,] [added: offerings,] have created a platform for long-term revenue growth.
We expect these investments to result in further penetration of our [removed: international] subscription-based information services and the successful cross-selling of our services to customers in existing markets.
We intend to continue to assess the need for additional investments in our business, in addition to the investments discussed above in order to develop and distribute new services within our current [removed: platform.][added: platform or expand the reach of our current service offerings.]
Any future product development or expansion of services, combination and coordination of services or elimination of services [added: or internal expansion, development or restructuring efforts] could reduce our profitability and increase our capital expenditures.
Therefore, while we expect current service offerings to remain profitable, driving overall earnings in [removed: 2014] [added: 2015] and providing substantial cash flow for our business, it is possible that any new investments, changes to our service offerings or other unforeseen events could cause us to generate losses and negative cash flow from operations in the future.
[removed: There was no] [added: No stock-based compensation expense related to the grant of 2014] performance-based restricted common stock [removed: granted during] [added: was recorded for] the [removed: year] [added: years] ended December 31, [added: 2012 and] 2013.
As of [removed: March] [added: December] 31, [removed: 2013,] [added: 2014,] we [removed: initially] [added: reassessed the probability of achieving the performance and market conditions and] determined that it was [added: still] probable that the performance [removed: condition] [added: and market conditions] for these [removed: performance-based restricted common stock] awards would be met by the [removed: March] [added: December] 31, [removed: 2017] [added: 2016] forfeiture date.
As a [removed: result,we] [added: result, we] recorded a total of approximately [removed: $21.8] [added: $1.1] million of stock-based compensation expense related to [added: the] performance-based restricted common stock for the year ended December 31, [removed: 2013.][added: 2014.]
We have used a discounted cash flow model to determine the estimated fair value of our investment in ARS as of December 31, [removed: 2013.][added: 2014.]
The weighted average discount rate used in the discounted cash flow model as of December 31, [removed: 2012 and] 2013 [added: and 2014] was approximately [removed: 5.1%] [added: 4.9%] and [removed: 4.9%,] [added: 4.1%,] respectively.
We have five flagship brands - CoStar, LoopNet, Apartments.com, BizBuySell and LandsofAmerica.
Apartments, LLC (doing business as Apartments.com), our subsidiary, operates an online apartment marketplace for renters that matches apartment seekers with apartment homes and provides property managers and owners a platform for marketing their properties.
BizBuySell is an online marketplace for operating businesses for sale, and LandsofAmerica is an online marketplace for rural land for sale.
To more fully integrate and connect our services and, ultimately, to provide improved access to our resources, we launched a new brand identity in May 2014.
The new branding is designed to unite our flagship brands - CoStar, LoopNet, Apartments.com, BizBuySell and LandsofAmerica - with a modern, cohesive look that will enhance customers’ access to the full breadth of our information, analytics and online marketplace solutions.
The resulting streamlined network of platforms is expected to improve the customer experience and make it easier for customers to find the most useful tools for their commercial real estate information, analytics and online marketplace needs.
The new brand identity was unveiled in connection with the launch of our new corporate website and newly designed website interfaces for CoStar, LoopNet and Apartments.com.
Our new website interfaces provide streamlined navigation and search functions for visitors and enable customers to quickly access our market-leading services.
Since introducing our new brand identity in May 2014, we have relaunched the Apartments.com website.
Our subscription-based information services consist primarily of CoStar SuiteTM services.
Prior to the third quarter of 2014, FOCUSTM was our primary service offering in our International operating segment.
Recent Acquisition
On April 1, 2014 (the “Closing Date”), we increased our presence in the multifamily vertical by acquiring the Apartments.com Business, a national online apartment rentals resource for renters, property managers and owners.
We purchased from CV the Apartments.com Business for $584.2 million in cash, after taking into account net working capital adjustments.
Apartments.com offers renters a database of apartment listings and provides professional property management companies and landlords with an advertising destination.
Renters can conduct personalized searches of apartment listings and view video demonstrations and community reviews through the Apartments.com website and mobile applications.
The Apartments.com network of rental websites also includes ApartmentHomeLiving.com, another national online apartment rentals resource.
Apartments.com draws on CoStar’s multifamily database, which contains detailed information on apartment properties, and a research effort to document the apartment industry in the U.S. CoStar designed the new Apartments.com website, which was launched in February 2015, around the needs of the renter in order to drive traffic to the site and attract advertisers who prefer to advertise on heavily trafficked apartment websites.
The newly launched site provides a comprehensive selection of rentals, information on actual availabilities and rents, and in-depth data on neighborhoods, including restaurants, nightlife, history, schools and other important facts.
To help renters find the information that meets their needs, the new site also offers innovative search tools.
Similar to our other past acquisitions, we plan to integrate, further develop and cross-sell the services offered by the Apartments.com Business and the other services we offer.
We have incurred and plan to continue to incur product development costs to improve the online Apartments.com platform, and we plan to increase our sales and marketing expenses in order to support the Apartments.com Business and to increase brand awareness.
In conjunction with the launch of the new Apartments.com website, we plan to embark on a wide-scale marketing campaign commencing during the first quarter of 2015 and running throughout the remainder of 2015 to generate brand awareness and site traffic for Apartments.com, including an incremental investment of $75.0 million above Apartments.com’s 2014 annualized marketing spend since the close of the acquisition of the Apartments.com Business.
The marketing campaign is expected to feature television and radio advertising, online/digital advertising, social media and out-of-home ads and will be reinforced by Search Engine Marketing.
On the Closing Date, we also entered into the 2014 Credit Agreement by and among CoStar, as Borrower, CoStar Realty Information, Inc., as Co-Borrower, the Lenders from time to time party thereto and JPMorgan Chase Bank, N.A., as Administrative Agent.
The proceeds of the term loan facility and the initial borrowing of $150.0 million under the revolving credit facility on the Closing Date were used to refinance the term loan facility and revolving credit facility established under a credit agreement dated February 16, 2012 (the “2012 Credit Agreement”), including related fees and expenses, and to pay a portion of the consideration and transaction costs related to the acquisition of the Apartments.com Business.
The undrawn proceeds of the revolving credit facility are available for our working capital needs and other general corporate purposes.
The obligations under the 2014 Credit Agreement are guaranteed by all of our material subsidiaries and are secured by a lien on substantially all of our assets and those of our material subsidiaries, in each case subject to certain exceptions, pursuant to security and guarantee documents entered into on the Closing Date.
The launch of the new Apartments.com website in February 2015 is one example of our software development efforts to improve existing services, introduce new services, integrate products and services, and cross-sell existing services.
We believe the improved site, enhanced search capabilities, and real-time vacancies will draw more consumers, making the service more valuable to property managers and increasing cross-selling opportunities.
We evaluate potential changes to our service offerings from time to time in order to better align the services we offer with customers’ needs.
In the event that we eliminate or phase out service offerings, we may experience reduced revenues and earnings.
The decision to eliminate or phase out a service offering may also ultimately result in increased revenues and earnings from sales of other services we offer in lieu of the eliminated or phased out services.
For example, we are currently assessing whether to transition the LoopNet marketplace to a pure marketing site for commercial real estate where, eventually, all listings would be paid and users could search the site for free.
We would expect to see a short-term reduction in revenues and earnings if we implement this transition.
Although we are assessing the best strategy to implement this shift and will seek to convert customers to higher value, more profitable annual subscription information services to increase revenues and earnings over time, we cannot predict with certainty the amount or timing of any reductions in revenues and earnings or subsequent increases in revenues and earnings, if any, resulting from eliminations or phasing out of the LoopNet information services or any other service offering, if implemented.
We expect to continue to achieve revenue synergies from acquisitions as a result of cross-selling opportunities.
We may incur increased expenses in connection with any related marketing and sales campaigns involving cross-selling opportunities and initiatives and in connection with promotion of our new services and brands.
The financial performance of our International operating segment continues to improve.
During the twelve months ended December 31, 2014, International EBITDA increased to a positive amount as a result of increased revenue and decreased operating expenses as compared to the twelve months ended December 31, 2013.
We expect additional selling and marketing activities to promote our new service enhancements will result in increased expenses in 2014.
We expect to continue software development to improve the LoopNet marketing platform in 2014.
Our sales and marketing efforts have focused and will continue to focus on cross-selling and marketing our services.
We recently implemented an automatic cross-selling initiative within the LoopNet marketplace.
As searchers view properties within the LoopNet marketplace, a message may appear indicating that there are additional listings available within CoStar Suite with the same search criteria that they are not able to access under their current subscription.
The message provides contact information, so that the customer can reach their customer service or sales representative and review the most appropriate service for their needs.
In addition, we have added a comparison feature to CoStarGo, which allows our sales force to demonstrate how many more properties a prospect could see with respect to a particular search area if that prospect were using CoStar Suite rather than the prospect’s current subscription with LoopNet.
As a result of cross selling CoStar's and LoopNet's complementary services, we began to achieve increased revenue synergies in 2013.
We also incurred increased expenses associated with the related marketing and sales campaign in 2012 and during the first half of 2013.
These initiatives resulted in revenue growth, and we expect they will continue to position the company for revenue growth during 2014 and for the foreseeable future.
In order to implement these services in the U.K., we incurred increased development costs through 2012; however, development costs incurred by the International segment decreased in 2013.
Market Conditions
In general, the current economic recovery has been slower than past economic recoveries.
Job growth, in particular, has recovered more slowly than in past economic recoveries, and as a result, the improvement in the commercial real estate industry has been slower, especially with respect to the rental rate growth.
Continuing near-term risks related to lower-than-expected job growth, government fiscal challenges, and uncertainty over U.S. and global economic issues may impede the ability and willingness of clients to purchase services from us or result in reductions of services purchased.
Additionally, since many of our clients use debt to finance a portion of their real estate purchases, material changes in interest rates and risk premiums could harm their ability to complete transactions, especially if the change was relatively rapid and unexpected.
As is typical of this point in the economic cycle, business consolidations, and in some circumstances, business failures, continue to occur.
If cancellations, reductions of services, and failures to pay increase, and we are unable to offset the resulting decrease in revenue by increasing sales to new or existing customers, our revenues may decline or grow at lower rates.
We compete against many other commercial real estate information, analytics, and marketing service providers for business, including competitors that offer rapidly changing methods of delivering real estate information.
If customers choose to cancel our services because of cost cutting, desire to access real estate information through other delivery methods, or other reasons, our revenue could decline.
In February 2012, the Compensation Committee (the “Committee”) of the Board of Directors approved grants of restricted common stock to our executive officers that vest based on the achievement of CoStar performance conditions.
Specifically, these shares of performance-based restricted common stock vest upon our achievement of $90.0 million of cumulative net income before interest, income taxes, depreciation and amortization ("EBITDA") over a period of four consecutive calendar quarters, and are subject to forfeiture in the event the foregoing performance condition is not met by March 31, 2017.
These awards support the Committee’s goals of aligning executive incentives with long-term stockholder value and ensuring that executive officers have a continuing stake in the long-term success of CoStar.
In May and December of 2012, we granted additional shares of restricted common stock that vest based on the achievement of the same performance conditions to other key employees.
We granted a total of 399,413 shares of performance-based restricted common stock during the year ended December 31, 2012.
All of the awards were made under the CoStar Group, Inc. 2007 Stock Incentive Plan and pursuant to our standard form of restricted stock grant agreement.
The number of shares granted was based on the fair market value of CoStar’s common stock on the grant date.
As of December 31, 2013, we reassessed the probability of achieving this performance condition and determined that it was still probable that the performance condition for these awards would be met by the March 31, 2017 forfeiture date, subject to certain approvals under the CoStar Group, Inc. 2007 Stock Incentive Plan.
There was no stock-based compensation expense related to performance-based restricted common stock recorded for the years ended December 31, 2011 and 2012.
Purchase Amortization.
Revenues increased to $349.9 million in 2012, from $251.7 million in 2011.
Gross margin increased to $235.1 million in 2012, from $163.6 million in 2011.
Selling and marketing expenses increased to $84.1 million in 2012, from $61.2 million in 2011, and decreased as a percentage of revenues to 24.0% in 2012, from 24.3% in 2011.
Software development expenses increased to $32.8 million in 2012, from $20.0 million in 2011, and increased as a percentage of revenues to 9.4% in 2012, from 8.0% in 2011.
Purchase amortization increased to $13.6 million in 2012, from $2.2 million in 2011, and increased as a percentage of revenue to 3.9% in 2012, compared to 0.9% in 2011.
The decrease was primarily due to our lower cash and cash equivalent balance in 2012 resulting from the net cash paid for our April 30, 2012 acquisition of LoopNet.
The increase was due to the interest expense incurred in 2012 for the term loan facility used to fund a portion of the merger consideration and transaction costs for the LoopNet acquisition.
This increase was primarily due to the impact of costs related to the LoopNet acquisition that are not deductible for tax purposes.
U.S. revenues increased to $330.8 million from $233.4 million for the years ended December 31, 2012 and 2011 respectively.
International revenues increased to $19.1 million from $18.4 million for the years ended December 31, 2012 and 2011, respectively.
An excerpt. Shown here: 40 of 166 rewritten, 40 of 118 added and 40 of 96 removed. The counts are complete. For every sentence, read Item 7. Management’s Discussion and Analysis of Financial Condition and Results of Operations in the FY2014 filing and the FY2013 filing.
Item 7A. Quantitative and Qualitative Disclosures About Market Risk
17 rewritten, 1 added, 1 removed, 18 unchanged
We provide information, analytics and [removed: marketing] [added: online marketplace] services to the commercial real estate and related business community in the U.S., [removed: U.K.] [added: U.K., Toronto, Canada] and France.
Our functional currency for our operations in the [removed: U.K.] [added: U.K., Canada] and France is the local currency.
As such, fluctuations in the British [removed: Pound] [added: Pound, Canadian dollar] and Euro may have an impact on our business, results of operations and financial position.
For the year ended December 31, [removed: 2013,] [added: 2014,] revenue denominated in foreign currencies was approximately [removed: 4.6%] [added: 4.7%] of total revenue.
For the year ended December 31, [removed: 2013,] [added: 2014,] our revenue would have decreased by approximately [removed: $2.0 million] [added: $236,000] if the U.S. dollar exchange rate used strengthened by 10%.
A 10% strengthening of the U.S. dollar exchange rate against all currencies with which we have exposure at December 31, [removed: 2013] [added: 2014] would have resulted in an increase of approximately [removed: $3.6] [added: $3.3] million in the carrying amount of net assets.
For the year ended December 31, [removed: 2013,] [added: 2014,] our revenue would have increased by approximately [removed: $2.0 million] [added: $236,000] if the U.S. dollar exchange rate used weakened by 10%.
A 10% weakening of the U.S. dollar exchange rate against all currencies with which we have exposure at December 31, [removed: 2013] [added: 2014] would have resulted in a decrease of approximately [removed: $3.6] [added: $3.3] million in the carrying amount of net assets.
As of December 31, [removed: 2013,] [added: 2014,] accumulated other comprehensive loss included a loss from foreign currency translation adjustments of approximately [removed: $4.0] [added: $5.7] million.
We do not have material exposure to market risks associated with changes in interest rates related to cash equivalent securities held as of December 31, [removed: 2013.][added: 2014.]
As of December 31, [removed: 2013,] [added: 2014,] we had [removed: $256.0] [added: $527.0] million of cash and cash equivalents.
Based on our outstanding borrowings as of December 31, [removed: 2013,] [added: 2014,] an increase in the interest rate by 25 basis points would result in an increase of approximately [removed: $400,000] [added: $1.0 million] in interest expense annually.
Based on our outstanding borrowings as of December 31, [removed: 2013,] [added: 2014,] a decrease in the interest rate by 25 basis points would result in a decrease of approximately [removed: $400,000] [added: $1.0 million] in interest expense annually.
As of December 31, [removed: 2013,] [added: 2014,] auctions for [removed: $24.3] [added: $18.7] million of our investments in auction rate securities [removed: failed.][added: failed to settle at auction.]
Based on an assessment of fair value of these investments in ARS as of December 31, [removed: 2013,] [added: 2014,] we determined that there was a decline in the fair value of our ARS investments of approximately [removed: $1.5 million,] [added: $691,000,] which was deemed to be a temporary impairment and recorded as an unrealized loss in accumulated other comprehensive loss in stockholders’ equity.
We have approximately [removed: $863.1 million] [added: $1.4 billion] in intangible assets as of December 31, [removed: 2013.][added: 2014.]
As of December 31, [removed: 2013,] [added: 2014,] we believe our intangible assets will be recoverable, however, changes in the economy, the business in which we operate and our own relative performance could change the assumptions used to evaluate intangible asset recoverability.
As of December 31, 2014, we had $385.0 million of long-term debt bearing interest at a variable rate of LIBOR plus 2.00%, subject to adjustment based on our First Lien Secured Leverage Ratio (as defined in the 2014 Credit Agreement).
As of December 31, 2013, we had $153.1 million of long-term debt bearing interest at a variable rate of LIBOR plus 2.00%.
Item 1. Business
132 rewritten, 74 added, 28 removed, 312 unchanged
CoStar Group, Inc., a Delaware corporation, founded in 1987, is the number one provider of information, analytics and [removed: marketing services] [added: online marketplaces] to the commercial real estate industry in the United States [removed: ("U.S.")] [added: (“U.S.”)] and United Kingdom [removed: ("U.K.")] [added: (“U.K.”)] based on the fact that we offer the most comprehensive commercial real estate database available; have the largest research department in the industry; own and operate the leading online [removed: marketplace] [added: marketplaces] for commercial real estate in the U.S. based on the number of unique visitors per month; provide more information, analytics and marketing services than any of our competitors and believe that we generate more revenues than any of our competitors.
We [removed: have] created and compiled our standardized [added: platform of] information, analytics and [removed: marketing platform] [added: online marketplace services] where members of the commercial real estate and related business community can continuously interact and facilitate transactions by efficiently exchanging accurate and standardized commercial real estate information.
Our service offerings span all commercial property types, including office, [removed: industrial,] retail, [added: industrial, multifamily, commercial] land, [removed: mixed-use, hospitality] [added: mixed-use properties] and [removed: multifamily.][added: hospitality.]
We manage our business geographically in two operating segments, with our primary areas of measurement and decision-making being [added: North America, which includes] the U.S. and [added: Canada, and] International, which includes the U.K. and France.
We have [added: also] extended our offering of comprehensive commercial real estate information to include London and other parts of the [removed: U.K.] [added: U.K., Toronto, Canada,] and parts of France, through acquisitions and internal growth and development.
We deliver our [added: commercial real estate] content to our U.S. customers primarily via an integrated suite of online service offerings that includes information about space available for lease, [removed: tenant information,] comparable sales information, information about properties for sale, [added: tenant information,] internet marketing services, analytical capabilities, information for clients’ websites, information about industry professionals and their business relationships, data integration and industry news.
LoopNet, our subsidiary, operates an online marketplace that enables [added: commercial] property owners, landlords, and [removed: commercial] real estate agents working on their behalf to list properties for sale or for lease and to submit detailed information about property listings.
We [removed: also] provide market research and analysis for commercial real estate investors and lenders via our [removed: Property and] [added: CoStar] Portfolio [removed: Research (“PPR”)] [added: Strategy and CoStar Market Analytics] service offerings, portfolio and debt [added: analysis,] management and reporting capabilities through our [removed: Resolve Technology] [added: CoStar Investment Analysis and CoStar Risk Analytics] service offerings; and real estate and lease management solutions, including lease administration and abstraction services, through our [removed: Virtual Premise] [added: CoStar Real Estate Manager] service offerings.
We have created and are continually improving our standardized [added: platform of] information, analytics and [removed: marketing platform] [added: online marketplaces] where members of the commercial real estate and related business community can continuously interact and facilitate transactions by efficiently exchanging accurate and standardized commercial real estate information.
Our standardized platform includes the most comprehensive proprietary database in the industry; the largest research department in the industry; proprietary data collection, information management and quality control systems; a large in-house product development team; a broad suite of web-based information, analytics and [removed: marketing services;] [added: online marketplaces;] a large team of analysts and economists; and a large base of clients.
Our database has been developed and enhanced for more than [removed: 26] [added: 27] years by a research department that makes thousands of daily database updates.
In addition to our internal efforts to grow the database, we have obtained and assimilated [removed: approximately 80] [added: over 90] proprietary databases.
Our subscription-based information services consist primarily of CoStar SuiteTM [removed: and FOCUSTM] services.
CoStar Suite is our primary service offering in [removed: the U.S.] [added: our North America and International] operating [removed: segment.][added: segments.]
[removed: FOCUS is] [added: Prior to the third quarter of 2014, FOCUSTM was] our primary service offering in [removed: the] [added: our] International operating segment.
[removed: Additionally, we] [added: We] introduced CoStar Suite in the U.K. in the fourth quarter of 2012 and no longer offered FOCUS to new clients beginning in 2013.
Contract rates are generally based on the number of sites, number of users, organization size, the client's business focus, geography and the number [added: and types] of services to which a client subscribes.
We have continually expanded the geographical coverage of our existing information services and developed new information, analytics and [removed: marketing] [added: online marketplace] services.
In [removed: August 1998, we expanded into the Houston region through the acquisition of Houston-based real estate information provider C Data Services In] January 1999, we expanded further into the Midwest and Florida by acquiring LeaseTrend and into Atlanta and Dallas/Fort Worth by acquiring Jamison Research.
In July 2009, we acquired Massachusetts-based [removed: PPR,] [added: CoStar Portfolio Strategy (formerly known as Property and Portfolio Research),] a provider of real estate analysis, market forecasts and credit risk analytics to the commercial real estate industry, and its wholly owned U.K. subsidiary Property and Portfolio Research Ltd., and in October 2009, we acquired Massachusetts-based [added: CoStar Investment Analysis (formerly known as] Resolve [removed: Technology,] [added: Technology),] a provider of business intelligence and portfolio management software serving the institutional real estate investment industry.
In October 2011, we acquired [added: CoStar Real Estate Manager (formerly known as] Virtual [removed: Premise,] [added: Premise),] a Software as a Service, or on-demand software provider of real estate and lease management solutions located in Atlanta, Georgia.
[removed: More recently, on] [added: In] April [removed: 30,] 2012, we completed the acquisition of LoopNet, an online marketplace that enables property owners, landlords, and commercial real estate agents working on their behalf to list properties for sale or for lease and to submit detailed information about property listings.
We expect to continue [added: our] software development [added: efforts] to improve existing services, introduce new services, integrate products and services, cross-sell existing services, and expand and develop supporting technologies for our research, sales and marketing organizations.
We are committed to supporting and improving our [removed: existing core] information, [removed: news, analytic] [added: analytics] and [removed: marketing services.][added: online marketplace solutions.]
[removed: The newly introduced] [added: For example, the] CoStar [removed: MultifamilyTM] [added: Multifamily®] information search [added: feature] allows [removed: access] [added: users] to [added: access] our extensive multifamily property database.
In addition, [removed: we introduced] CoStar Lease AnalysisTM, an integrated workflow [removed: tool that] [added: tool,] provides users a simple way to produce understandable cash flows for any proposed or existing lease.
We [removed: expect] [added: plan] to continue [added: our] software development [removed: on] [added: efforts to enhance] our new Lease Analysis workflow tool [removed: throughout 2014.][added: and to develop other potential lease comparable services in 2015.]
[removed: Further, in] [added: In] October 2013, we [added: also] released CoStarGo® 2.0, the next generation of our mobile application, which was launched in the U.S. on August 15, 2011 and introduced in the U.K. on November 5, 2012.
[removed: We have] [added: In 2014, we] introduced enhancements to our flagship marketing platform, LoopNet.com.
For example, we added a [removed: broker] [added: targeted] advertising service that allows brokers [added: or firms] to purchase advertisements based on geographic and property type criteria.
Additionally, we introduced ProVideo, a service that enables owners and brokers to enhance their [added: LoopNet] listings with high quality videos of interior spaces, amenities and exterior features.
We continue to integrate, develop and cross-sell the services offered by the [removed: companies] [added: businesses] we [removed: acquired most recently,] [added: have acquired,] including [removed: LoopNet, Virtual Premise, Resolve Technology] [added: Apartments.com] and [removed: PPR.][added: LoopNet.]
[removed: In] [added: Further, in] some cases, when integrating and coordinating our services and assessing industry [added: and client] needs, we may [removed: decide, or may have previously decided,] [added: decide] to combine, shift focus from, de-emphasize, phase out, or eliminate a service [removed: that] [added: that, among other things,] overlaps or is redundant with other services we offer.
[removed: International] Expansion and Development
[removed: We] [added: Internationally, we] continue to integrate our [removed: international] operations more fully with those in the U.S. [removed: As part of our integration efforts, in 2007 we introduced “CoStar Group” as the brand encompassing our international operations, and in early 2010 we launched Showcase,] [added: Similar to] our [removed: internet marketing service that provides commercial real estate professionals high quality internet lead generation, in the U.K. In addition,] [added: North America operating segment,] we intend to continue to upgrade [removed: the] [added: our international] platform of services and expand the coverage of our service offerings within our International segment.
To further [removed: develop] those initiatives, we introduced CoStar Suite in the U.K. during the fourth quarter of 2012 and no longer offered FOCUS to new clients beginning in 2013.
CoStarGo 2.0 was released in the U.K. in October 2013 simultaneous with [removed: the] [added: its] release in the U.S. Additionally, we [removed: have] upgraded our back-end research operations, fulfillment and Customer Relationship Management [removed: (“CRM”)] systems to support these new U.K. services.
[removed: The International operating segment continues to experience improved financial performance and most recently, during] [added: During] the [removed: three] [added: twelve] months ended December 31, [removed: 2013,] [added: 2014,] International EBITDA increased to a positive amount as a result of increased revenue and decreased operating [removed: expenses.][added: expenses as compared to the twelve months ended December 31, 2013.]
In 2014, we [removed: expect to expand further internationally by] [added: began] offering our services in Toronto, Canada.
We believe that our integration efforts and continued investments in our services, including expansion of our existing service [removed: offerings internationally,] [added: offerings,] have created a platform for long-term revenue growth.
As we have grown and further developed our plans, we have expanded our services for commercial real estate information, analytics and online marketplaces in an effort to continue to meet the needs of this industry as it grows and evolves.
We also operate complementary online marketplaces for commercial real estate listings and apartment rentals.
Apartments, LLC (doing business as Apartments.com), our subsidiary, operates an online apartment marketplace for renters that matches apartment seekers with apartment homes and provides property managers and owners a platform for marketing their properties.
Apartments.com draws on CoStar’s multifamily database, which contains detailed information on apartment properties, and a research effort to document the apartment industry in the U.S. CoStar designed the new Apartments.com site, which was launched in February 2015, around the needs of the renter in order to drive traffic to the site and attract advertisers who prefer to advertise on heavily trafficked apartment websites.
The newly launched site provides a comprehensive selection of rentals, information on actual rental availabilities and rents, and in-depth data on neighborhoods, including restaurants, nightlife, history, schools and other important facts.
To help renters find the information that meets their needs, the new site also offers innovative search tools.
We have five flagship brands - CoStar, LoopNet, Apartments.com, BizBuySell and LandsofAmerica.
In August 1998, we expanded into the Houston region through the acquisition of Houston-based real estate information provider C Data Services.
More recently, on April 1, 2014, we purchased certain assets and assumed certain liabilities related to the Apartments.com business (collectively, the “Apartments.com Business”), a national online apartment rentals resource for renters, property managers and owners, from Classified Ventures, LLC (“CV”).
In February 2015, as a result of our product development efforts, we launched a new Apartments.com website with a cleaner look, information about actual rental availabilities, rents and other fees, and better search functionality.
In conjunction with the launch, we plan to embark on a wide-scale marketing campaign commencing during the first quarter of 2015 and running throughout the remainder of 2015 to generate brand awareness and site traffic for Apartments.com, including an incremental investment of $75.0 million above Apartments.com’s 2014 annualized marketing spend since the close of the acquisition of the Apartments.com Business.
The marketing campaign is expected to feature television and radio advertising, online/digital advertising, social media and out-of-home ads and will be reinforced by Search Engine Marketing.
We evaluate potential changes to our service offerings from time to time in order to better align the services we offer with customers’ needs.
For example, we are currently assessing whether to transition the LoopNet marketplace to a pure marketing site for commercial real estate where, eventually, all listings would be paid and users could search the site for free.
To more fully integrate and connect our services and, ultimately, to provide improved access to our resources, we launched a new brand identity in May 2014.
The new branding is designed to unite our flagship brands - CoStar, LoopNet, Apartments.com, BizBuySell and LandsofAmerica - with a modern, cohesive look that will enhance customers’ access to the full breadth of our information, analytics and marketplace solutions.
The resulting streamlined network of platforms is expected to improve the customer experience and make it easier for customers to find the most useful tools for their commercial real estate information, analytic and marketplace needs.
The new brand identity was unveiled in connection with the launch of our new corporate website and newly designed website interfaces for CoStar, LoopNet and Apartments.com.
Our new website interfaces provide streamlined navigation and search functions for visitors and enable customers to quickly access our market-leading services.
The financial performance of our International operating segment continues to improve.
See the “Non-GAAP Financial Measures” section included in this Annual Report on Form 10-K for further details on the non-GAAP financial measures.
We recently expanded the geographic reach of our North America services.
Building on our experience in Toronto, we plan to expand our research into additional Canadian cities.
We have invested in the expansion and development of our field sales force to support the growth and expansion of our company in North America and internationally.
We plan to continue to invest in, evaluate and strategically position our sales force as the Company continues to develop and grow.
We are also investing in our research capacity to support continued growth of our information and analytics offerings, to support the Apartments.com Business and to expand into additional Canadian markets.
In support of our continued expansion and development, during June 2014, we completed a public equity offering of 3,450,000 shares of common stock for $160.00 per share, resulting in net proceeds to the Company of approximately $529.4 million.
We intend to use the net proceeds from the public equity offering to fund all or a portion of the costs of any strategic acquisitions we decide to pursue in the future, to finance the growth of our business and for working capital and other general corporate purposes.
Within the apartment rental community, most apartment websites primarily supply only the listings that property owners pay to advertise and often return results that are inconsistent with the renter's search criteria.
These limited results generally do not provide information about the actual rental availabilities.
We believe that consumers expect accurate, actionable and comprehensive apartment rental information.
To create the new Apartments.com website, we have drawn on our multifamily database and undertaken a research effort collecting and verifying information and visiting and photographing properties.
With the launch of the new Apartments.com website, we believe that we have created an easily searchable site with a comprehensive selection of rentals, information on actual rental availabilities and rents, and in-depth data on neighborhoods, including restaurants, nightlife, history, schools and other important facts.
Our subsidiary, CoStar Field Research, LLC, recently entered into an agreement to purchase a low-flying airplane capable of conducting aerial research of commercial real estate.
In 2015, we plan to place researchers on the low-flying aircraft to scout additional commercial developments and take aerial photographs.
Our subscription-based information services consist primarily of CoStar SuiteTM services.
CoStar
CoStar Real Estate Manager also provides lease abstraction and data review services in order to facilitate the effective implementation of this software solution.
CoStar Private Sale NetworkTM CoStar Private Sale Network provides clients with custom-designed and branded websites to market their listings directly to investors.
CoStar Private Sale Network allows investors to customize a commercial real estate website and build and send email communications to announce listings, calls for offers, and bid deadlines.
Development
We expect to continue software development to improve the LoopNet marketing platform in 2014.
In order to implement these services in the U.K., we incurred increased development costs through 2012; however, development costs incurred by the International segment decreased in 2013.
- PPR PortalTM is PPR’s primary delivery platform for research, forecasts, analytics, and granular data surrounding a specific address and property type.
Information is organized around clearly defined tabs, for ease of access.
The information is presented in written, table data, graphic, and map formats, and can easily be downloaded by the user for integration into its own analytical framework.
The PPR Portal is used by lenders, investors, and owners to identify and price investment opportunities, manage assets and portfolios, and source and service capital.
FOCUSTM Our U.K. subsidiary, CoStar U.K. Limited, offers several services; its primary service is FOCUS.
FOCUS is a digital online service offering information on the U.K. commercial real estate market.
This service seamlessly links data on individual properties and companies across the U.K., including comparable sales, available space, requirements, tenants, lease deals, planning information, socio-economics and demographics, credit ratings, photos and maps.
GrecamTM Our French subsidiary, Grecam S.A.S., provides commercial real estate information throughout the Paris region through its Observatoire Immobilier D’ Entreprise (“OIE”) service offering.
The OIE service provides commercial property availability and transaction information to its subscribers through both an online service and market reports.
| Binswanger | | AEGON USA Realty Advisors | | Aberdeen Asset Management — U.K. |
| CB Richard Ellis — U.K. | | Deutsche Bank | | M&G Real Estate — U.K. |
| DAUM Commercial Real Estate Services | | | | |
| GVA Grimley — U.K. | | Grosvenor Estate Holdings — U.K. | | Deloitte |
| HFF | | Hines | | Integra |
| Lambert Smith Hampton — U.K. | | | | |
| NAI Global | | Retailers | | Government Agencies |
| NB Real Estate — U.K. | | Carter's | | City of Chicago |
| Sperry Van Ness | | Petco | | Federal Reserve Bank of New York |
| Studley | | Rent-A-Center | | Internal Revenue Service |
| U.S. Equities Realty | | Spencer Gifts LLC | | U.S. Department of Housing and Urban Development |
For example, after the acquisition of LoopNet, we launched a sales and marketing campaign to cross-sell CoStar's information services to LoopNet customers and cross-sell LoopNet's marketing services to CoStar customers.
We recently implemented an automatic cross-selling initiative within the LoopNet marketplace.
As searchers view properties within the LoopNet marketplace, a message may appear indicating that there are additional listings available within CoStar Suite with the same search criteria that they are not able to access under their current subscription.
The message provides contact information, so that the customer can reach their customer service or sales representative and review the most appropriate service for their needs.
In addition, we have added a comparison feature to CoStarGo, which allows our sales force to demonstrate how many more properties a prospect could see with respect to a particular search area if that prospect were using CoStar rather than the prospect’s current subscription with LoopNet.
An excerpt. Shown here: 40 of 132 rewritten, 40 of 74 added and all 28 removed. The counts are complete. For every sentence, read Item 1. Business in the FY2014 filing and the FY2013 filing.
Cover and table of contents
28 rewritten, 2 added, 4 removed, 65 unchanged
For the fiscal year ended December 31, [removed: 2013][added: 2014]
[removed: |  |][added: ]
Indicate by check mark if disclosure of delinquent filers pursuant to Item 405 of Regulation S-K is not contained herein, and will not be contained, to the best of registrant’s knowledge, in definitive proxy or information statements incorporated by reference in Part III of this Form 10-K or any amendment to this Form 10-K. [removed: x]
Based on the closing price of the common stock on June [removed: 28, 2013] [added: 30, 2014] on the Nasdaq Stock Market, Nasdaq Global Select Market, the aggregate market value of registrant’s common stock held by non-affiliates of the registrant was approximately [removed: $3.5] [added: $4.9] billion.
As of February [removed: 14, 2014,] [added: 20, 2015,] there were [removed: 28,853,559] [added: 32,311,866] shares of the registrant’s common stock outstanding.
Portions of the registrant’s definitive proxy statement, which is expected to be filed with the Securities and Exchange Commission within 120 days after the end of the registrant’s fiscal year ended December 31, [removed: 2013,] [added: 2014,] are incorporated by reference into Part III of this Report.
| Item 1. | [removed: [Business](#sECF6B8D62A6F073AF74AFF4B735DBB09)] [added: [Business](#s2EE97C55920C8BA9B2D666C97080D661)] | [removed: [4](#sECF6B8D62A6F073AF74AFF4B735DBB09)] [added: [4](#s2EE97C55920C8BA9B2D666C97080D661)] |
| Item 1A. | [Risk [removed: Factors](#sF2226646C231260BBD61FF4B737C525B)] [added: Factors](#s24543FD42B3E6C6FE5DC66C9709F13EF)] | [removed: [17](#sF2226646C231260BBD61FF4B737C525B)] [added: [18](#s24543FD42B3E6C6FE5DC66C9709F13EF)] |
| Item 1B. | [Unresolved Staff [removed: Comments](#s1795FE0B4A0555D499F8FF4B73AB6EDC)] [added: Comments](#s0F65E69C24389F25553866C970DD368E)] | [removed: [27](#s1795FE0B4A0555D499F8FF4B73AB6EDC)] [added: [31](#s0F65E69C24389F25553866C970DD368E)] |
| Item 2. | [removed: [Properties](#s5AC01178AB9491E35A3AFF4B73CA016F)] [added: [Properties](#s44C0C3D4C6C6071DD59E66C970ED7EE1)] | [removed: [27](#s5AC01178AB9491E35A3AFF4B73CA016F)] [added: [31](#s44C0C3D4C6C6071DD59E66C970ED7EE1)] |
| Item 3. | [Legal [removed: Proceedings](#sD02FAC9E5DDA7E47F724FF4B73F9BD3A)] [added: Proceedings](#s74AB3D0B1D582884580366C9711C1903)] | [removed: [27](#sD02FAC9E5DDA7E47F724FF4B73F9BD3A)] [added: [32](#s74AB3D0B1D582884580366C9711C1903)] |
| Item 4. | [Mine Safety [removed: Disclosures](#s14284DE857F8646F2A2DFF4B742868C9)] [added: Disclosures](#sBF78C8525C37CB04E4F166C9714A6388)] | [removed: [27](#s14284DE857F8646F2A2DFF4B742868C9)] [added: [32](#sBF78C8525C37CB04E4F166C9714A6388)] |
| Item 5. | [Market for the Registrant’s Common Stock, Related Stockholder Matters and Issuer Purchases of Equity [removed: Securities](#s07EC8C24B1F0B6F01E11FF4B63856533)] [added: Securities](#s14E40679C92F7CBB91B166C95D0F834E)] | [removed: [28](#s07EC8C24B1F0B6F01E11FF4B63856533)] [added: [33](#s14E40679C92F7CBB91B166C95D0F834E)] |
| Item 6. | [Selected Consolidated Financial and Operating [removed: Data](#s0ED81D6D6DED1C33CD6DFF4B5E86ABAA)] [added: Data](#sD7D5A49D4731183432A566C958BC4D2B)] | [removed: [30](#s0ED81D6D6DED1C33CD6DFF4B5E86ABAA)] [added: [35](#sD7D5A49D4731183432A566C958BC4D2B)] |
| Item 7. | [Management’s Discussion and Analysis of Financial Condition and Results of [removed: Operations](#s7336E5A834AFC4057748FF4B74C4D098)] [added: Operations](#s0251E46D128AD04BE53666C971E62F51)] | [removed: [31](#s7336E5A834AFC4057748FF4B74C4D098)] [added: [36](#s0251E46D128AD04BE53666C971E62F51)] |
| Item 7A. | [Quantitative and Qualitative Disclosures about Market [removed: Risk](#s2E71F100CDF7B697BBD5FF4B77929EC5)] [added: Risk](#sC9537143C8ED8D807BCE66C974B4C87E)] | [removed: [48](#s2E71F100CDF7B697BBD5FF4B77929EC5)] [added: [54](#sC9537143C8ED8D807BCE66C974B4C87E)] |
| Item 8. | [Financial Statements and Supplementary [removed: Data](#sB863684C8E7208A14BD0FF4B77B18B92)] [added: Data](#sAF24B47784E471DD485F66C974D331DB)] | [removed: [49](#sB863684C8E7208A14BD0FF4B77B18B92)] [added: [55](#sAF24B47784E471DD485F66C974D331DB)] |
| Item 9. | [Changes in and Disagreements with Accountants on Accounting and Financial [removed: Disclosure](#s9955490078D243556FEBFF4B77EFC637)] [added: Disclosure](#s1CAE8E84AC4B61CF4E0D66C97502ED2D)] | [removed: [49](#s9955490078D243556FEBFF4B77EFC637)] [added: [55](#s1CAE8E84AC4B61CF4E0D66C97502ED2D)] |
| Item 9A. | [Controls and [removed: Procedures](#s49C5A85B9091A9492D27FF4B780E050C)] [added: Procedures](#s255C49B6675CBD218BE466C97531EF9D)] | [removed: [49](#s49C5A85B9091A9492D27FF4B780E050C)] [added: [55](#s255C49B6675CBD218BE466C97531EF9D)] |
| Item 9B. | [Other [removed: Information](#s394C55C43D9870A4E0E5FF4B783DECD6)] [added: Information](#s456CDF1E1EB05DE4506C66C9756057CA)] | [removed: [50](#s394C55C43D9870A4E0E5FF4B783DECD6)] [added: [56](#s456CDF1E1EB05DE4506C66C9756057CA)] |
| Item 10. | [Directors, Executive Officers and Corporate [removed: Governance](#s9F185E0DC76DDF30B212FF4B788BB1FF)] [added: Governance](#s5D9A59EE5AE284DB610F66C975BD8791)] | [removed: [51](#s9F185E0DC76DDF30B212FF4B788BB1FF)] [added: [57](#s5D9A59EE5AE284DB610F66C975BD8791)] |
| Item 11. | [Executive [removed: Compensation](#sF893455D12307DD780EBFF4B78AA444A)] [added: Compensation](#s335E4DC5CB01BC44542A66C975CD9A90)] | [removed: [51](#sF893455D12307DD780EBFF4B78AA444A)] [added: [57](#s335E4DC5CB01BC44542A66C975CD9A90)] |
| Item 12. | [Security Ownership of Certain Beneficial Owners and Management and Related Stockholder [removed: Matters](#s7B0315F4B1875696DFB3FF4B78E92DB0)] [added: Matters](#sDC51DE35A39C7E7DFDF366C9760B82CB)] | [removed: [51](#s7B0315F4B1875696DFB3FF4B78E92DB0)] [added: [57](#sDC51DE35A39C7E7DFDF366C9760B82CB)] |
| Item 13. | [Certain Relationships and Related Transactions, and Director [removed: Independence](#s2AF3BDB0BF614EED7EC7FF4B790881AF)] [added: Independence](#sE0F8FC0C9B7B63F1E97466C9762A10E6)] | [removed: [51](#s2AF3BDB0BF614EED7EC7FF4B790881AF)] [added: [57](#sE0F8FC0C9B7B63F1E97466C9762A10E6)] |
| Item 14. | [Principal Accountant Fees and [removed: Services](#s2E54957E78D8EE848FA1FF4B79373BCC)] [added: Services](#s0F99E82D4CB1F15F3DC766C976599CB8)] | [removed: [51](#s2E54957E78D8EE848FA1FF4B79373BCC)] [added: [57](#s0F99E82D4CB1F15F3DC766C976599CB8)] |
| Item 15. | [Exhibits and Financial Statement [removed: Schedules](#s071D5B1C278334629397FF4B56C98ECE)] [added: Schedules](#s8F4945CE8BF9833809B566C953CCBCF9)] | [removed: [52](#s071D5B1C278334629397FF4B56C98ECE)] [added: [58](#s8F4945CE8BF9833809B566C953CCBCF9)] |
| | [Index to [removed: Exhibits](#sBC442ED122F3AF6F26B7FF4B79E22D48)] [added: Exhibits](#s417CF124C9A44D06ED8466C97705A06B)] | [removed: [55](#sBC442ED122F3AF6F26B7FF4B79E22D48)] [added: [61](#s417CF124C9A44D06ED8466C97705A06B)] |
| | [Index to Consolidated Financial [removed: Statements](#sAD7B8196741763E85C42FF4B7A02E47B)] [added: Statements](#s04BFC4A1810784BD4E0466C9772406B1)] | [removed: [F-1](#sAD7B8196741763E85C42FF4B7A02E47B)] [added: [F-1](#s04BFC4A1810784BD4E0466C9772406B1)] |
10-K 1 csgp-10k_20141231.htm 2014 10-K
| | [Signatures](#sAED913B788CC7786B9EB66C976C6FB8E) | [59](#sAED913B788CC7786B9EB66C976C6FB8E) |
10-K 1 csgp20131231-10k.htm 2013 10-K
| |
| --- |
| | [Signatures](#sA23C2D2E995D652B8EA2FF4B79A4C49F) | [53](#sA23C2D2E995D652B8EA2FF4B79A4C49F) |
Item 2. Properties
3 rewritten, 1 added, 0 removed, 8 unchanged
This facility is used primarily by our International [added: operating] segment.
In addition to [removed: our] two downtown Washington, DC leased facilities [added: (including our headquarters)] and our London, England facility, our research operations are principally run out of leased spaces in San Diego, California; Columbia, Maryland; Atlanta, Georgia; Glasgow, Scotland; and Paris, France.
These locations include, without limitation, the following: New York; Los Angeles; Chicago; San Francisco; Sacramento; Boston; Orange County, California; Philadelphia; Houston; Phoenix; Detroit; Pittsburgh; Miami; Orlando; Denver; Dallas; Kansas City; Cleveland; Cincinnati; Indianapolis; Austin; Salt Lake City; Las Vegas; Seattle; Portland; St. Louis; [removed: Glendora, California;] [added: Louisville; Minneapolis;] San Luis Obispo, California; [added: Ontario, California;] Charlotte; Durham, North Carolina; Manchester, England and Toronto, Canada.
Our headquarters is used primarily by our North America operating segment.
Item 5. Market for the Registrant’s Common Stock, Related Stockholder Matters and Issuer Purchases of Equity Securities
10 rewritten, 9 added, 9 removed, 39 unchanged
| Year Ended December 31, [removed: 2012] [added: 2014] | | | | | | | |
As of February [removed: 3, 2014,] [added: 2, 2015,] there were [removed: 797] [added: 900] holders of record of our common stock.
[removed: Our] [added: The 2014] Credit Agreement includes covenants that, subject to certain exceptions, restrict our ability and the ability of our subsidiaries to pay dividends or distributions.
We did not issue any unregistered securities during the year ended December 31, [removed: 2013.][added: 2014.]
The following table is a summary of our repurchases of common stock during each of the three months in the quarter ended December 31, [removed: 2013:][added: 2014:]
| Month, [removed: 2013] [added: 2014] | | Total Number of Shares Purchased | | | Average Price Paid per Share | | Total Number of Shares Purchased as Part of Publicly Announced Plans or Programs | | Maximum Number of Shares that May Yet Be Purchased Under the Plans or Programs |
| October 1 through 31 | | [removed: —] [added: 58] | | | [removed: —] [added: $148.32] | | — | | — |
The comparison covers the period beginning December 31, [removed: 2008,] [added: 2009,] and ending on December 31, [removed: 2013,] [added: 2014,] and assumes the reinvestment of any dividends.
[removed: ][added: 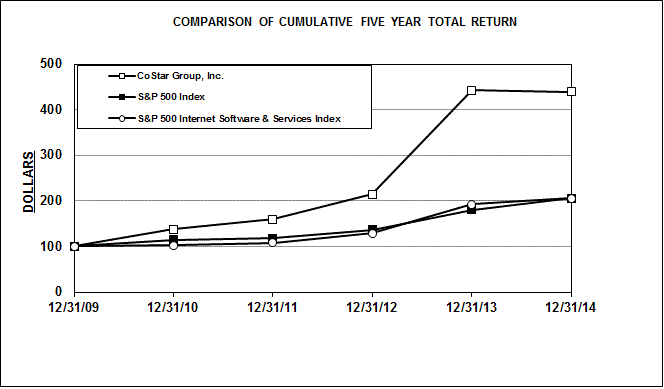]
| Company / Index | | [removed: 12/31/08 | | |] 12/31/09 | | | 12/31/10 | | | 12/31/11 | | | 12/31/12 | | | 12/31/13 | | [added: | 12/31/14 | |]
| First Quarter | $ | 214.00 | | | $ | 166.78 | |
| Second Quarter | $ | 188.95 | | | $ | 150.55 | |
| Third Quarter | $ | 160.10 | | | $ | 138.76 | |
| Fourth Quarter | $ | 188.39 | | | $ | 137.60 | |
| December 1 through 31 | | 3,273 | | | 167.10 | | — | | — |
| Total | | 3,331 | (1) | | $166.78 | | — | | — |
| CoStar Group, Inc. | | 100 | | | 137.80 | | | 159.76 | | | 213.96 | | | 441.90 | | | 439.62 | |
| S&P 500 Index | | 100 | | | 115.06 | | | 117.49 | | | 136.30 | | | 180.44 | | | 205.14 | |
| S&P 500 Internet Software & Services Index | | 100 | | | 102.56 | | | 107.95 | | | 129.36 | | | 192.46 | | | 205.16 | |
| First Quarter | $ | 69.86 | | | $ | 56.67 | |
| Second Quarter | $ | 81.20 | | | $ | 67.26 | |
| Third Quarter | $ | 85.40 | | | $ | 77.79 | |
| Fourth Quarter | $ | 89.54 | | | $ | 77.06 | |
| December 1 through 31 | | 4,948 | | | $183.12 | | — | | — |
| Total | | 4,948 | (1) | | $183.12 | | — | | — |
| CoStar Group, Inc. | | 100 | | | 126.81 | | | 174.74 | | | 202.58 | | | 271.31 | | | 560.35 | |
| S&P 500 Index | | 100 | | | 126.46 | | | 145.51 | | | 148.59 | | | 172.37 | | | 228.19 | |
| S&P 500 Internet Software & Services Index | | 100 | | | 184.67 | | | 189.39 | | | 199.35 | | | 238.88 | | | 355.42 | |
Item 6. Selected Consolidated Financial and Operating Data
25 rewritten, 0 added, 0 removed, 13 unchanged
(in thousands, except per share [removed: data and other operating] data)
The following table provides selected consolidated financial and other operating data for the five years ended December 31, [removed: 2013.][added: 2014.]
The consolidated statement of operations data shown below for each of the three years ended December 31, [removed: 2011,] 2012, [added: 2013,] and [removed: 2013] [added: 2014] and the consolidated balance sheet data as of December 31, [removed: 2012 and] 2013 [added: and 2014] are derived from audited consolidated financial statements that are included in this report.
The consolidated statement of operations data for each of the years ended December 31, [removed: 2009 and] 2010 and [added: 2011 and] the consolidated balance sheet data as of December 31, [removed: 2009,] 2010, [added: 2011,] and [removed: 2011] [added: 2012] shown below are derived from audited consolidated financial statements for those years that are not included in this report.
| Consolidated Statement of Operations Data: | [removed: 2009 | | | |] 2010 | | | | 2011 | | | | 2012 | | | | 2013 | | | [added: | 2014 | | |]
| Revenues | $ | [removed: 209,659] [added: 226,260] | | | $ | [removed: 226,260] [added: 251,738] | | | $ | [removed: 251,738] [added: 349,936] | | | $ | [removed: 349,936] [added: 440,943] | | | $ | [removed: 440,943] [added: 575,936] | |
| Cost of revenues | [removed: 73,714 | | | |] 83,599 | | | | 88,167 | | | | 114,866 | | | | 129,185 | | | [added: | 156,979 | | |]
| Gross margin | [removed: 135,945 | | | |] 142,661 | | | | 163,571 | | | | 235,070 | | | | 311,758 | | | [added: | 418,957 | | |]
| Operating expenses | [removed: 104,110 | | | |] 119,886 | | | | 141,800 | | | | 207,630 | | | | 257,604 | | | [added: | 338,079 | | |]
| Income from operations | [removed: 31,835 | | | |] 22,775 | | | | 21,771 | | | | 27,440 | | | | 54,154 | | | [added: | 80,878 | | |]
| Interest and other income | [removed: 1,253 | | | |] 735 | | | | 798 | | | | 526 | | | | 326 | | | [added: | 516 | | |]
| Interest and other expense | — | | | | — | | | | [removed: —] [added: (4,832] | | [added: )] | | [removed: (4,832] [added: (6,943] | | ) | | [removed: (6,943] [added: (10,481] | | ) |
| Income before income taxes | [removed: 33,088 | | | |] 23,510 | | | | 22,569 | | | | 23,134 | | | | 47,537 | | | [added: | 70,913 | | |]
| Income tax expense, net | [removed: 14,395 | | | |] 10,221 | | | | 7,913 | | | | 13,219 | | | | 17,803 | | | [added: | 26,044 | | |]
| Net income | $ | [removed: 18,693] [added: 13,289] | | | $ | [removed: 13,289] [added: 14,656] | | | $ | [removed: 14,656] [added: 9,915] | | | $ | [removed: 9,915] [added: 29,734] | | | $ | [removed: 29,734] [added: 44,869] | |
| Net income per share — basic | $ | [removed: 0.95] [added: 0.65] | | | $ | [removed: 0.65] [added: 0.63] | | | $ | [removed: 0.63] [added: 0.37] | | | $ | [removed: 0.37] [added: 1.07] | | | $ | [removed: 1.07] [added: 1.48] | |
| Net income per share — diluted | $ | [removed: 0.94] [added: 0.64] | | | $ | [removed: 0.64] [added: 0.62] | | | $ | [removed: 0.62] [added: 0.37] | | | $ | [removed: 0.37] [added: 1.05] | | | $ | [removed: 1.05] [added: 1.46] | |
| Weighted average shares outstanding — basic | [removed: 19,780 | | | |] 20,330 | | | | 23,131 | | | | 26,533 | | | | 27,670 | | | [added: | 30,215 | | |]
| Weighted average shares outstanding — diluted | [removed: 19,925 | | | |] 20,707 | | | | 23,527 | | | | 26,949 | | | | 28,212 | | | [added: | 30,641 | | |]
| Consolidated Balance Sheet Data: | [removed: 2009 | | | |] 2010 | | | | 2011 | | | | 2012 | | | | 2013 | | | [added: | 2014 | | |]
| Cash, cash equivalents, short-term and long-term investments | $ | [removed: 255,698] [added: 239,316] | | | $ | [removed: 239,316] [added: 573,379] | | | $ | [removed: 573,379] [added: 177,726] | | | $ | [removed: 177,726] [added: 277,943] | | | $ | [removed: 277,943] [added: 544,163] | |
| Working capital | [removed: 203,660 | | | |] 188,279 | | | | 521,401 | | | | 97,925 | | | | 196,913 | | | [added: | 480,521 | | |]
| Total assets | [removed: 404,579 | | | |] 439,648 | | | | 771,035 | | | | 1,165,139 | | | | 1,256,982 | | | [added: | 2,083,682 | | |]
| Total long-term liabilities | [removed: 1,826 | | | |] 7,252 | | | | 50,076 | | | | 237,158 | | | | 217,567 | | | [added: | 450,846 | | |]
| Stockholders’ equity | [removed: 359,006 | | | |] 381,502 | | | | 659,177 | | | | 826,343 | | | | 927,862 | | | [added: | 1,513,546 | | |]
Item 9A. Controls and Procedures
3 rewritten, 0 added, 0 removed, 14 unchanged
As of December 31, [removed: 2013,] [added: 2014,] we carried out an evaluation, under the supervision and with the participation of our management, including our Chief Executive Officer and our Chief Financial Officer, of the effectiveness of the design and operation of our disclosure controls and procedures.
In connection with the preparation of the Company's annual financial statements, management of the Company has undertaken an assessment of the effectiveness of the Company’s internal control over financial reporting as of December 31, [removed: 2013] [added: 2014] based on criteria established in Internal Control – Integrated Framework [removed: (1992] [added: (2013] framework) issued by the Committee of Sponsoring Organizations of the Treadway Commission (“the COSO Framework”).
Based on this assessment, management did not identify any material weakness in the Company's internal control, and management has concluded that the Company's internal control over financial reporting was effective as of December 31, [removed: 2013.][added: 2014.]
Item 10. Directors, Executive Officers and Corporate Governance
2 rewritten, 0 added, 0 removed, 5 unchanged
Copies of each of these codes may be found in the “Investors” section of the Company’s website at [removed: www.CoStar.com/Investors/Corpgovernance.aspx.][added: http://www.costargroup.com/investors/governance.]
The remaining information required by this Item is incorporated by reference to our Proxy Statement for our [removed: 2014] [added: 2015] annual meeting of stockholders.
Item 11. Executive Compensation
1 rewritten, 0 added, 0 removed, 2 unchanged
The information required by this Item is incorporated by reference to our Proxy Statement for our [removed: 2014] [added: 2015] annual meeting of stockholders.
Item 12. Security Ownership of Certain Beneficial Owners and Management and Related Stockholder Matters
1 rewritten, 0 added, 0 removed, 2 unchanged
The information required by this Item is incorporated by reference to our Proxy Statement for our [removed: 2014] [added: 2015] annual meeting of stockholders.
Item 13. Certain Relationships and Related Transactions, and Director Independence
1 rewritten, 0 added, 0 removed, 2 unchanged
The information required by this Item is incorporated by reference to our Proxy Statement for our [removed: 2014] [added: 2015] annual meeting of stockholders.
Item 14. Principal Accountant Fees and Services
1 rewritten, 0 added, 0 removed, 3 unchanged
The information required by this Item is incorporated by reference to our Proxy Statement for our [removed: 2014] [added: 2015] annual meeting of stockholders.
Item 15. Exhibits and Financial Statement Schedules
434 rewritten, 247 added, 128 removed, 814 unchanged
Years Ended December 31, [removed: 2011,] 2012, [added: 2013,] and [removed: 2013] [added: 2014] (in thousands):
Pursuant to the requirements of Section 13 of the Securities Act of 1934, as amended, the Registrant has duly caused this report to be signed on its behalf by the undersigned, thereunto duly authorized, in the City of Washington, District of Columbia, on the [removed: 20th] [added: 26th] day of February [removed: 2014.][added: 2015.]
| /s/ Michael R. Klein | | Chairman of the Board | | February [removed: 20, 2014] [added: 26, 2015] |
| /s/ Andrew C. Florance | | Chief Executive Officer and | | February [removed: 20, 2014] [added: 26, 2015] |
| /s/ Brian J. Radecki | | Chief Financial Officer | | February [removed: 20, 2014] [added: 26, 2015] |
| /s/ David Bonderman | | Director | | February [removed: 20, 2014] [added: 26, 2015] |
| /s/ Michael J. Glosserman | | Director | | February [removed: 20, 2014] [added: 22, 2015] |
| /s/ Warren H. Haber | | Director | | February [removed: 18, 2014] [added: 24, 2015] |
| /s/ John W. Hill | | Director | | February [removed: 19, 2014] [added: 22, 2015] |
| /s/ Christopher J. Nassetta | | Director | | February [removed: 17, 2014] [added: 23, 2015] |
| /s/ David J. Steinberg | | Director | | February [removed: 17, 2014] [added: 23, 2015] |
| *10.8 | | Form of 2007 Plan Restricted Stock Unit Agreement between the Registrant and certain of its officers and employees [removed: (filed herewith).] [added: (Incorporated by reference to Exhibit 10.8 to the Registrant's Report on Form 10-K for the year ended December 31, 2013).] |
| *10.22 | | Separation Agreement and General Release dated October 6, 2013, between CoStar Realty Information, Inc. and Jennifer Kitchen [removed: (filed herewith).] [added: (Incorporated by reference to Exhibit 10.22 to the Registrant's Report on Form 10-K for the year ended December 31, 2013).] |
| 101 | | The following materials from CoStar Group, Inc.’s Annual Report on Form 10-K for the year ended December 31, [removed: 2013,] [added: 2014,] formatted in XBRL (eXtensible Business Reporting Language): (i) Consolidated Statement of Operations for the years ended December 31, [removed: 2011, 2012] [added: 2012, 2013] and [removed: 2013,] [added: 2014,] respectively; (ii) Consolidated Statements of Comprehensive Income for the years ended December 31, [removed: 2011, 2012] [added: 2012, 2013] and [removed: 2013,] [added: 2014,] respectively; (iii) Consolidated Balance Sheets at December 31, [removed: 2012] [added: 2013] and December 31, [removed: 2013,] [added: 2014,] respectively; (iv) Consolidated Statements of Stockholders’ Equity for the years ended December 31, [removed: 2011, 2012] [added: 2012, 2013] and [removed: 2013,] [added: 2014,] respectively; (v) Consolidated Statements of Cash Flows for the years ended December 31, [removed: 2011, 2012] [added: 2012, 2013] and [removed: 2013,] [added: 2014,] respectively; (vi) Notes to the Consolidated Financial Statements that have been detail tagged; and (vii) Schedule II – Valuation and Qualifying Accounts (submitted electronically with this report). |
| Reports of Independent Registered Public Accounting Firm | [removed: [F-2](#sDE1D7819C556725ABBA8FF4B7A30F753)] [added: [F-2](#s84847B18F1FBA562921D66C977538277)] |
| Consolidated Statements of Operations for the years ended December 31, [removed: 2011, 2012 and] [added: 2012,] 2013 [added: and 2014] | [removed: [F-4](#s2DEB1F44C1B1E13EBC27FF4B56C90364)] [added: [F-4](#sA330DAE6CFD01D61EFE166C953CCBB8E)] |
| Consolidated Statements of Comprehensive Income for the years ended December 31, [removed: 2011, 2012 and] [added: 2012,] 2013 [added: and 2014] | [removed: [F-5](#s966A8CAEFC5D9B7E2026FF4B5717351F)] [added: [F-5](#s704C0C2C1EE9B2C8061166C953EB4CA7)] |
| Consolidated Balance Sheets as of December 31, [removed: 2012 and] 2013 [added: and 2014] | [removed: [F-6](#s3CC94A9B5B7EF1D3C1DFFF4B56F779C4)] [added: [F-6](#s10B9652A48CFEE4E6B4F66C953EBA1B6)] |
| Consolidated Statements of Stockholders’ Equity for the years ended December 31, [removed: 2011, 2012 and] [added: 2012,] 2013 [added: and 2014] | [removed: [F-7](#sB4031CD45EF284FE97D5FF4B5736D4C0)] [added: [F-7](#s82417701F4472AAB590F66C9541AFCC4)] |
| Consolidated Statements of Cash Flows for the years ended December 31, [removed: 2011, 2012 and] [added: 2012,] 2013 [added: and 2014] | [removed: [F-8](#s69EF73FA91DAE8268836FF4B5726DEC3)] [added: [F-8](#sB9B989D497A4F02DB59666C954499D01)] |
| Notes to Consolidated Financial Statements | [removed: [F-9](#sEFB64F90AF60E14172C4FF4B7B597D4C)] [added: [F-9](#s50B99623869AA7B918D166C9786CDB7E)] |
We have audited the accompanying consolidated balance sheets of CoStar Group, Inc. as of December 31, [removed: 2013] [added: 2014] and [removed: 2012,] [added: 2013,] and the related consolidated statements of operations, comprehensive income, stockholders' equity and cash flows for each of the three years in the period ended December 31, [removed: 2013.][added: 2014.]
Our audits also included the financial statement schedule listed in the Index at Item [removed: 15(a).These financial statements and schedule are the responsibility of the Company's management.][added: 15(a)(2).]
In our opinion, the financial statements referred to above present fairly, in all material respects, the consolidated financial position of CoStar Group, Inc. at December 31, [removed: 2013] [added: 2014] and [removed: 2012,] [added: 2013,] and the consolidated results of its operations and its cash flows for each of the three years in the period ended December 31, [removed: 2013,] [added: 2014,] in conformity with U.S. generally accepted accounting principles.
We also have audited, in accordance with the standards of the Public Company Accounting Oversight Board (United States), CoStar Group, Inc.'s internal control over financial reporting as of December 31, [removed: 2013,] [added: 2014,] based on criteria established in Internal Control-Integrated Framework issued by the Committee of Sponsoring Organizations of the Treadway Commission [removed: (1992] [added: (2013] framework) and our report dated February [removed: 20, 2014] [added: 26, 2015] expressed an unqualified opinion thereon.
We have audited CoStar Group, Inc.’s internal control over financial reporting as of December 31, [removed: 2013,] [added: 2014,] based on criteria established in Internal Control-Integrated Framework issued by the Committee of Sponsoring Organizations of the Treadway Commission [removed: (1992] [added: (2013] framework) (the COSO criteria).
In our opinion, CoStar Group, Inc. maintained, in all material respects, effective internal control over financial reporting as of December 31, [removed: 2013,] [added: 2014,] based on the COSO criteria.
We also have audited, in accordance with the standards of the Public Company Accounting Oversight Board (United States), the consolidated balance sheets of CoStar Group, Inc. as of December 31, [removed: 2013] [added: 2014] and [removed: 2012,] [added: 2013,] and the related consolidated statements of operations, comprehensive income, stockholders' equity and cash flows for each of the three years in the period ended December 31, [removed: 2013] [added: 2014] and our report dated February [removed: 20, 2014] [added: 26, 2015] expressed an unqualified opinion thereon.
| | [removed: 2011] [added: 2012] | | | | [removed: 2012] [added: 2013] | | | | [removed: 2013] [added: 2014] | | |
| Revenues | $ | [removed: 251,738] [added: 349,936] | | | $ | [removed: 349,936] [added: 440,943] | | | $ | [removed: 440,943] [added: 575,936] | |
| Cost of revenues | [removed: 88,167] [added: 114,866] | | | | [removed: 114,866] [added: 129,185] | | | | [removed: 129,185] [added: 156,979] | | |
| Gross margin | [removed: 163,571] [added: 235,070] | | | | [removed: 235,070] [added: 311,758] | | | | [removed: 311,758] [added: 418,957] | | |
| Selling and marketing | [removed: 61,164] [added: 84,113] | | | | [removed: 84,113] [added: 98,708] | | | | [removed: 98,708] [added: 150,305] | | |
| Software development | [removed: 20,037] [added: 32,756] | | | | [removed: 32,756] [added: 46,757] | | | | [removed: 46,757] [added: 55,426] | | |
| General and administrative | [removed: 58,362] [added: 77,154] | | | | [removed: 77,154] [added: 96,956] | | | | [removed: 96,956] [added: 103,916] | | |
| Purchase amortization | [removed: 2,237] [added: 13,607] | | | | [removed: 13,607] [added: 15,183] | | | | [removed: 15,183] [added: 28,432] | | |
| | [removed: 141,800] [added: 207,630] | | | | [removed: 207,630] [added: 257,604] | | | | [removed: 257,604] [added: 338,079] | | |
| Income from operations | [removed: 21,771] [added: 27,440] | | | | [removed: 27,440] [added: 54,154] | | | | [removed: 54,154] [added: 80,878] | | |
| Interest and other income | [removed: 798] [added: 526] | | | | [removed: 526] [added: 326] | | | | [removed: 326] [added: 516] | | |
| Interest and other expense | [removed: —] [added: (4,832] | | [added: )] | | [removed: (4,832] [added: (6,943] | | ) | | [removed: (6,943] [added: (10,481] | | ) |
| Year ended December 31, 2014 | | $ | 3,397 | | | $ | 4,822 | | | $ | 881 | | | $ | 4,285 | | | $ | 4,815 | |
| 10.29 | | Asset Purchase Agreement, dated as of February 28, 2014, by and between Classified Ventures, LLC and CoStar Group, Inc. (Incorporated by reference to Exhibit 10.1 to CoStar’s Current Report on Form 8-K, filed March 3, 2014). |
| 10.30 | | Credit Agreement, dated as of April 1, 2014, by and among CoStar Group, Inc., as Borrower, CoStar Realty Information, Inc., as Co-Borrower, the Lenders from time to time party thereto and JPMorgan Chase Bank, N.A., as Administrative Agent (Incorporated by reference to Exhibit 10.1 to CoStar’s Current Report on Form 8-K, filed April 4, 2014). |
INDEX TO EXHIBITS — (CONTINUED)
| Exhibit No. | | Description |
These financial statements and schedule are the responsibility of the Company's management.
February 26, 2015
February 26, 2015
| Cash and cash equivalents | $ | 255,953 | | | $ | 527,012 | |
| Intangible assets, net | 144,472 | | | | 241,622 | | |
| Exercise of stock options | 68 | | | 1 | | | | 3,802 | | | | — | | | | — | | | | 3,803 | | |
| Stock issued for equity offering | 3,450 | | | 34 | | | | 529,326 | | | | — | | | | — | | | | 529,360 | | |
| Balance at December 31, 2014 | 32,318 | | | $ | 323 | | | $ | 1,405,414 | | | $ | (6,384 | ) | | $ | 114,193 | | | $ | 1,513,546 | |
| Net income | $ | 9,915 | | | $ | 29,734 | | | $ | 44,869 | |
| Impairment loss | — | | | | — | | | | 1,799 | | |
December 31, 2014
The Company provides online marketplaces for commercial real estate listings, apartment rentals, lands for sale and businesses for sale.
| | 2013 | | | | 2014 | | |
For equity instruments that vest based on a performance condition and a market condition, the Company estimates the fair value of each equity instrument granted on the date of grant using a Monte-Carlo simulation model.
This pricing model uses multiple simulations to evaluate the probability of achieving the market condition to calculate the fair value of the awards.
Stock-based compensation expense is updated based on the expected achievement of the related performance conditions at the end of each reporting period.
As of March 31, 2014, the Company had satisfied all performance and service conditions, and as a result, the restricted common stock granted under these awards vested.
The Company recorded approximately $0, $21.8 million and $2.2 million of stock-based compensation expense related to the 2012 performance-based restricted common stock awards for the years ended December 31, 2012, 2013 and 2014, respectively.
In February 2014, the Compensation Committee (the “Committee”) of the Board of Directors of the Company approved grants of restricted common stock to the executive officers that vest based on the Company’s achievement of a three-year cumulative revenue goal established at the grant date, and are subject to forfeiture in the event the foregoing performance condition is not met by December 31, 2016.
These grants of restricted common stock are also subject to continuing employment requirements and a market condition based on total shareholder return (“TSR”).
The actual number of shares that vest at the end of the respective three-year period is determined based on the Company’s achievement of the three\-year performance goals described above, as well as its TSR relative to the Russell 1000 Index over the related three-year performance period.
| | | |
| --- | --- | --- |
| | | |
Acquired database technology is amortized on a straight-line basis over periods ranging from one to eight years.
Upon a refinancing, previously capitalized debt issuance costs are expensed and included in loss on extinguishment of debt if the Company determines that there has been a substantial modification of the related debt.
If the Company determines that there has not been a substantial modification of the related debt, any previously capitalized debt issuance costs are amortized as interest expense over the term of the new debt instrument using the effective interest method.
In May 2014, the Financial Accounting Standards Board (“FASB”) and International Accounting Standards Board (“IASB”) jointly issued a new revenue recognition standard that will improve financial reporting by creating common recognition guidance for U.S. GAAP and International Financial Reporting Standards (“IFRS”).
This guidance provides a more robust framework for addressing revenue issues, improves the comparability of revenue recognition practices across industries, provides more useful information to users of financial statements through improved disclosure requirements and simplifies the presentation of financial statements.
The core principle of the guidance is that an entity should recognize revenue to depict the transfer of promised goods or services to customers in an amount that reflects the consideration to which the entity expects to be entitled in exchange for those goods or services.
Early application is not permitted.
This guidance permits the use of either a full retrospective method or a modified retrospective approach in which it would be applied only to the most current period presented along with a cumulative-effect adjustment at the date of adoption.
The Company has not yet selected a transition method and is currently evaluating the impact this guidance will have on its financial statements.
On February 28, 2014, the Company and Classified Ventures, LLC (“CV”) entered into an Asset Purchase Agreement (the “Asset Purchase Agreement”).
Pursuant to the Asset Purchase Agreement, on April 1, 2014 (the “Closing Date”), the Company purchased from CV certain assets and assumed certain liabilities, in each case, related to the Apartments.com business (collectively, the “Apartments.com Business”).
| Year ended December 31, 2011 | | $ | 2,415 | | | $ | 1,525 | | | $ | — | | | $ | 1,416 | | | $ | 2,524 | |
February 20, 2014
| | | | | | | | | | | | |
| Short-term investments | 37 | | | | — | | |
| Intangibles and other assets, net | 170,632 | | | | 144,472 | | |
| Other long-term liabilities | 1,030 | | | | — | | |
| Balance at December 31, 2010 | 20,773 | | | $ | 208 | | | $ | 374,981 | | | $ | (8,706 | ) | | $ | 15,019 | | | $ | 381,502 | |
| Exercise of stock options | 198 | | | 2 | | | | 6,212 | | | | — | | | | — | | | | 6,214 | | |
| Stock issued for equity offering | 4,313 | | | 43 | | | | 247,881 | | | | — | | | | — | | | | 247,924 | | |
| Deferred consideration settlement | (1,207 | | ) | | — | | | | — | | |
| Proceeds from sale of building, net | 83,553 | | | | — | | | | — | | |
| Cash and cash equivalents at beginning of year | 206,405 | | | | 545,280 | | | | 156,027 | | |
Reclassifications
Certain previously reported amounts in the consolidated statements of cash flows have been reclassified to conform to the Company’s current presentation.
Short-term investments consisted of government/federal notes and bonds with maturities greater than 90 days at the time of purchase.
Available-for-sale short-term investments with contractual maturities beyond one year were classified as current in the Company’s consolidated balance sheets because they represented the investment of cash that is available for current operations.
No amortization expense for debt issuance costs was recognized by the Company for the year ended December 31, 2011.
In July 2012, the Financial Accounting Standards Board ("FASB") issued authoritative guidance to simplify how companies test indefinite-lived intangible assets for impairment.
The guidance permits a company to first assess qualitative factors to determine whether it is more likely than not that an indefinite-lived intangible asset is impaired as a basis for determining whether it is necessary to perform the quantitative impairment test.
This guidance is effective for annual and interim impairment tests performed for fiscal years beginning after September 15, 2012, with early adoption permitted.
This guidance did not have a material impact on the Company's results of operations or financial position.
In February 2013, the FASB issued authoritative guidance to improve the reporting of reclassifications out of accumulated other comprehensive income.
This guidance requires a company to present, either on the consolidated statements of operations or in the notes to the consolidated financial statements, significant amounts reclassified out of accumulated other comprehensive income by the respective line items of net income, but only if the amount reclassified is required under GAAP to be reclassified in its entirety to net income.
For other amounts that are not required under GAAP to be reclassified in their entirety to net income in the same reporting period, an entity is required to cross-reference other disclosures required under GAAP that provide additional detail about those amounts.
This guidance did not have a material impact on the Company's results of operations or financial position, but the Company provided additional disclosures in its financial statements.
There are no accounting pronouncements that have been recently issued but not yet adopted by the Company that would have a material impact on the Company’s results of operations or financial position.
On April 30, 2012, the Company acquired 100% of the outstanding stock of LoopNet pursuant to an Agreement and Plan of Merger dated April 27, 2011, as amended May 20, 2011 (the “Merger Agreement”).
LoopNet owns and operates an online marketplace for commercial real estate in the U.S. The online marketplace enables commercial real estate agents, working on behalf of property owners and landlords, to list properties for sale or for lease and submit detailed information on property listings to find a buyer or tenant.
The acquisition combines the research capabilities of the Company with the marketing solutions offered by LoopNet to create efficiencies in operations and provide more opportunities for the combined company's customers.
The following table summarizes the consideration paid for LoopNet (in thousands except share and per share data):
| Cash | $ | 746,393 | |
| Equity interest (1,880,300 shares at $72.89) | 137,055 | | |
| Fair value of total consideration transferred | $ | 883,448 | |
| Cash and cash equivalents | $ | 105,464 | |
| Goodwill | 625,174 | | |
| Deferred income taxes, net | (32,623 | | ) |
The acquired trade names recorded in connection with this acquisition are not amortized, but are subject to annual impairment tests.
The $625.2 million of goodwill recorded as part of the acquisition is associated with the Company's U.S. operating segment.
None of the goodwill recognized is deductible for income tax purposes.
| 3. | ACQUISITION — (CONTINUED) |
An excerpt. Shown here: 40 of 434 rewritten, 40 of 247 added and 40 of 128 removed. The counts are complete. For every sentence, read Item 15. Exhibits and Financial Statement Schedules in the FY2014 filing and the FY2013 filing.