 filings.tools
CoStar Group 10-K 2019-12-31
Filed 2020-02-26. 22 sections, 411K characters. Original on sec.gov · Markdown · JSON
Cover and table of contents
UNITED STATES
SECURITIES AND EXCHANGE COMMISSION
Washington, DC 20549
FORM 10-K
| ☒ | ANNUAL REPORT PURSUANT TO SECTION 13 OR 15(d) OF THE SECURITIES EXCHANGE ACT OF 1934 |
For the fiscal year ended December 31, 2019
OR
| ☐ | TRANSITION REPORT PURSUANT TO SECTION 13 OR 15(d) OF THE SECURITIES EXCHANGE ACT OF 1934 |
For the transition period from ______ to ______
Commission file number 0-24531

CoStar Group, Inc.
(Exact name of registrant as specified in its charter)
| Delaware | 52-2091509 | |
| (State or other jurisdiction of incorporation or organization) | (I.R.S. Employer Identification No.) |
| 1331 L Street, NW | ||
| Washington, | DC | 20005 |
(Address of principal executive offices) (zip code)
**(**202) 346-6500
(Registrant’s telephone number, including area code)
(877) 739-0486
(Registrant’s facsimile number, including area code)
Securities registered pursuant to Section 12(b) of the Act:
| Title of each class | Trading Symbol | Name of each exchange on which registered |
| Common Stock ($0.01 par value) | CSGP | Nasdaq Global Select Market |
Securities registered pursuant to section 12(g) of the Act: None
Indicate by check mark if the registrant is a well-known seasoned issuer, as defined in Rule 405 of the Securities Act.
Yes x No o
Indicate by check mark if the registrant is not required to file reports pursuant to Section 13 or Section 15(d) of the Act.
Yes o No x
Indicate by check mark whether the registrant (1) has filed all reports required to be filed by Section 13 or 15(d) of the Securities Exchange Act of 1934 during the preceding 12 months (or for such shorter period that the registrant was required to file such reports) and (2) has been subject to such filing requirements for the past 90 days. Yes x No o
Indicate by check mark whether the registrant has submitted electronically every Interactive Data File required to be submitted pursuant to Rule 405 of Regulation S-T (§232.405 of this chapter) during the preceding 12 months (or for such shorter period that the registrant was required to submit such files).
Yes x No o
Indicate by check mark whether the registrant is a large accelerated filer, an accelerated filer, a non-accelerated filer, a smaller reporting company, or an emerging growth company. See the definitions of “large accelerated filer,” “accelerated filer”, “smaller reporting company,” and "emerging growth company" in Rule 12b-2 of the Exchange Act.
| Large accelerated filer | x | Accelerated filer | o |
| Non-accelerated filer | o | Smaller reporting company | ☐ |
| Emerging growth company | ☐ |
If an emerging growth company, indicate by check mark if the registrant has elected not to use the extended transition period for complying with any new or revised financial accounting standards provided pursuant to Section 13(a) of the Exchange Act. o
Indicate by check mark whether the registrant is a shell company (as defined in Rule 12b-2 of the Act). Yes ☐ No x
As of June 28, 2019, the aggregate market value of the common stock (based upon the closing price of the stock on the Nasdaq Global Select Market) of the registrant held by non-affiliates was approximately $20 billion. As of February 21, 2020, 36,644,734 shares of common stock were outstanding.
DOCUMENTS INCORPORATED BY REFERENCE
Portions of the registrant’s definitive proxy statement, which is expected to be filed with the Securities and Exchange Commission within 120 days after the end of the registrant’s fiscal year ended December 31, 2019, are incorporated by reference into Part III of this Report.
TABLE OF CONTENTS
PART I
Item 1. Business
In this report, the words “we,” “our,” “us,” “CoStar” or the “Company” refer to CoStar Group, Inc. and its direct and indirect wholly owned subsidiaries. This report also refers to our websites, but information contained on those sites is not part of this report.
CoStar Group, Inc., a Delaware corporation, founded in 1987, is the number one provider of information, analytics and online marketplaces to the commercial real estate industry in the United States (“U.S.”) and United Kingdom (“U.K.”) based on the fact that we offer the most comprehensive commercial real estate database available; have the largest research department in the industry; own and operate leading online marketplaces for commercial real estate and apartment listings in the U.S. based on the numbers of unique visitors and site visits per month; and provide more information, analytics and marketing services than any of our competitors. We have created and compiled a standardized platform of information, analytics and online marketplace services where industry professionals and consumers of commercial real estate, including apartments, and the related business communities, can continuously interact and facilitate transactions by efficiently accessing and exchanging accurate and standardized real estate-related information. Our service offerings span all commercial property types, including office, retail, industrial, multifamily, commercial land, mixed-use and hospitality. We manage our business geographically in two operating segments, with our primary areas of measurement and decision-making being North America, which includes the U.S. and Canada, and International, which primarily includes Europe, Asia-Pacific and Latin America. On October 22, 2019, we acquired STR, Inc. and STR Global, Ltd. (together with STR, Inc., "STR"), which provides benchmarking and analytics for the hospitality industry. See Note 4 to the accompanying Notes to the Consolidated Financial Statements included in Part IV of this Annual Report on Form 10-K for further discussion of this acquisition.
Strategy
Our strategy is to provide industry professionals and consumers of commercial real estate and apartments with critical knowledge to explore and complete transactions by offering the most comprehensive, timely and standardized information on commercial real estate and apartments and the right tools to be able to effectively utilize that information. Over time, we have expanded, and we continue to expand, our services for commercial real estate information, analytics and online marketplaces in an effort to continue to meet the needs of the industry as it grows and evolves.
Our standardized platform includes the most comprehensive proprietary database in the industry; the largest research department in the industry; proprietary data collection, information management and quality control systems; a large in-house product development team; a broad suite of web-based information, analytics and online marketplace services; a large team of analysts and economists; and a large, diverse base of clients. Our database has been developed and enhanced for more than 30 years by a research department that makes thousands of daily database updates. In addition to our internal efforts to grow the database, we have obtained and assimilated a significant number of proprietary databases. Our comprehensive commercial real estate database powers our information services, sources data used in our analytic services and provides content for most of our online marketplace services. Our ability to utilize the same commercial real estate information across our standardized platform creates efficiencies in operations and improves data quality for our customers.
We deliver our comprehensive commercial real estate information content to our U.S. and certain customers in Europe primarily via an integrated suite of online service offerings that includes information about space available for-lease, comparable sales information, information about properties for-sale, tenant information, Internet marketing services, analytical capabilities, information for clients’ websites, information about industry professionals and their business relationships, data integration and industry news. We also operate complementary online marketplaces for commercial real estate listings and apartment rentals. We strive to cross-sell our services to our customers in order to best suit their needs.
Information about our revenues, long-lived assets and total assets derived from and located in foreign countries is included in Notes 2, 3 and 14 of the Notes to Consolidated Financial Statements included in this Annual Report on Form 10-K. Revenues; net income (loss) before interest and other income (expense), income taxes, depreciation and amortization (“EBITDA”); and total assets and liabilities for each of our segments are set forth in Notes 3 and 14 to our consolidated financial statements. Information about risks associated with our foreign operations is included in “Item 1A. Risk Factors” and “Item 7A. Quantitative and Qualitative Disclosures about Market Risk” in this Annual Report on Form 10-K.
We have five flagship brands - CoStar*®, LoopNet®, Apartments.comTM, BizBuySell®* and LandsofAmericaTM, which are accessible via the Internet and through our mobile applications. Our subscription-based services consist primarily of CoStar Suite*®* services, which include information, analytics and online marketplace services offered to the commercial real estate industry and related professionals. CoStar Suite*®* is sold as a platform of service offerings consisting of CoStar Property Professional®, CoStar
COMPS Professional® and CoStar Tenant®, and is our largest service offering in our North America and International operating segments.
Our LoopNet subscription-based, online marketplace enables commercial property owners, landlords, and brokers to list properties for-sale or for-lease and to submit detailed information about property listings. Commercial real estate agents, buyers and tenants use LoopNet extensively to search for available property listings that meet their criteria.
Apartments.comTM is part of our network of apartment marketing sites, which also includes ApartmentFinder.comTM, ForRent.com®, ApartmentHomeLiving.comTM, WestsideRentals.com*®*, AFTER55.com®, CorporateHousing.comTM, ForRentUniversity.com®, Apartamentos.comTM, which is our apartment-listing site offered exclusively in Spanish, and OffCampusPartners.com, which we acquired on June 12, 2019, and which provides student housing marketplace content and powers off campus housing sites for many universities across the U.S. Our apartment marketing network of subscription-based services offers renters a searchable database of apartment listings and provides property owners, professional property management companies and landlords with an advertising destination. Our apartment marketing network draws on and leverages CoStar’s multifamily database, which contains detailed information on apartment properties and is designed to meet renter preferences and demands, in order to drive traffic to those sites and attract advertisers who prefer to advertise on heavily trafficked apartment websites. Our network of apartment marketing sites provides a comprehensive selection of rentals, information on actual availabilities and rents, and in-depth data on neighborhoods, including restaurants, nightlife, history, schools and other facts important to renters. To help renters find the information that meets their needs, we have sites that also offer innovative search tools such as the PolygonTM Search tool, which allow renters to specifically define the area in which they want to find an apartment and Plan Commute tools, which allow renters to search property listings that meet their transportation needs. We also offer complementary services to the apartment industry, including the ability for rent
Showing the first 8K of 61K characters. Open the full section
Item 1A. Risk Factors
Cautionary Statement Concerning Forward-Looking Statements
We have made forward-looking statements in this Report and make forward-looking statements in our press releases and conference calls that are subject to risks and uncertainties. Forward-looking statements include information that is not purely historic fact and include, without limitation, statements concerning our financial outlook for 2020 and beyond, our possible or assumed future results of operations generally, and other statements and information regarding assumptions about our revenues, revenue growth rates, gross margin percentage, net income, net income per share, fully diluted net income per share, EBITDA, adjusted EBITDA, non-generally accepted accounting principles (“GAAP”) net income, non-GAAP net income per share, weighted-average outstanding shares, taxable income (loss), cash flow from operating activities, available cash, operating costs, amortization expense, intangible asset recovery, capital and other expenditures, legal proceedings and claims, legal costs, effective tax rate, equity compensation charges, future taxable income, pending acquisitions, the anticipated benefits of completed or proposed acquisitions, the anticipated timing of acquisition closings, the anticipated benefits of cross-selling efforts, product development and release, planned product enhancements, sales and marketing campaigns, product integrations, elimination and de-emphasizing of services, contract renewal rate, the timing of future payments of principal under our $750 million credit facility available to us under the amended and restated credit agreement dated October 19, 2017 (the “2017 Credit Agreement”), expectations regarding our compliance with financial and restrictive covenants in the 2017 Credit Agreement, financing plans, geographic expansion, development of new products and services, capital structure, contractual obligations, our database, database growth, services and facilities, employee relations, future economic performance, our ability to liquidate or realize our long-term investments, management’s plans, goals and objectives for future operations and growth and markets for our stock. Sections of this Report which contain forward-looking statements include “Business,” “Risk Factors,” “Properties,” “Legal Proceedings,” “Management’s Discussion and Analysis of Financial Condition and Results of Operations,” “Quantitative and Qualitative Disclosures About Market Risk,” “Controls and Procedures” and the Financial Statements and related Notes.
Our forward-looking statements are also identified by words such as “hope,” “anticipate,” “may,” “believe,” “expect,” “intend,” “will,” “should,” “plan,” “estimate,” “predict,” “continue” and “potential” or the negative of these terms or other comparable terminology. You should understand that these forward-looking statements are estimates reflecting our judgment, beliefs and expectations, not guarantees of future performance. They are subject to a number of assumptions, risks and uncertainties that could cause actual results to differ materially from those expressed or implied in the forward-looking statements. The following important factors, in addition to those discussed or referred to under the heading “Risk Factors,” and other unforeseen events or circumstances, could affect our future results and could cause those results or other outcomes to differ materially from those expressed or implied in our forward-looking statements: commercial real estate market conditions; general economic conditions, both domestic and international , including the impacts of “Brexit” and uncertainty from the expected discontinuance of LIBOR and the transition to any other interest rate benchmark; our ability to identify, acquire and integrate acquisition candidates; our ability to realize the expected benefits, cost savings or other synergies from acquisitions, including STR and OCP, on a timely basis or at all; our ability to combine acquired businesses successfully or in a timely and cost-efficient manner; business disruption relating to integration of acquired businesses or other business initiatives; business disruption relating to acquisitions may be greater than expected; our ability to transition acquired service platforms to our model in a timely manner or at all; changes and developments in business plans; theft of any personally identifiable information we, or the businesses that we acquire, maintain or process; any actual or perceived failure to comply with privacy or data protection laws, regulations or standards; the amount of investment for sales and marketing and our ability to realize a return on investments in sales and marketing; our ability to effectively and strategically combine, eliminate or de-emphasize service offerings; reductions in revenues as a result of service changes; the time and resources required to develop upgraded or new services and to expand service offerings; changes or consolidations within the commercial real estate industry; customer retention; our ability to attract new clients; our ability to sell additional services to existing clients; our ability to successfully introduce and cross-sell new products or upgraded services in U.S. and foreign markets; our ability to attract consumers to our online marketplaces; our ability to increase traffic on our network of sites; the success of our marketing campaigns in generating brand awareness and site traffic; competition; foreign currency fluctuations; global credit market conditions affecting investments; our ability to continue to expand successfully, timely and in a cost-efficient manner, including internationally; our ability to effectively penetrate and gain acceptance in new sectors and geographies; our ability to control costs; litigation or government investigations in which we become involved; changes in accounting policies or practices; release of new and upgraded services or entry into new markets by us or our competitors; data quality; expansion, growth, development or reorganization of our sales force; employee retention; technical problems with our services; managerial execution; changes in relationships with real estate brokers, property managers and other strategic partners; legal and regulatory issues, including any actual or perceived failure to comply with U.S. or international laws, rules or regulations; and successful adoption of and training on our services.
Accordingly, you should not place undue reliance on forward-looking statements, which speak only as of, and are based on information available to us on, the date of this Report. All subsequent written and oral forward-looking statements attributable to
us or any person acting on our behalf are expressly qualified in their entirety by the cautionary statements contained or referred to in this section. We do not undertake any obligation to update any such statements or release publicly any revisions to these forward-looking statements to reflect new information or events or circumstances after the date of this Report or to reflect the occurrence of unanticipated events.
Risk Factors
Our revenues and financial position will be adversely affected if we are not able to attract and retain clients. Our success and revenues depend on attracting and retaining subscribers to our information, analytics and online marketplaces. Our subscription-based information, analytics and online marketplaces generate the largest portion of our revenues. However, we may be unable to attract new clients, and our existing clients may decide not to add, not to renew or to cancel subscription services. In addition, in order to increase our revenue, we must continue to attract new customers, continue to keep our cancellation rate low and continue to sell new services to our existing customers. We may not be able to continue to grow our customer base, keep the cancellation rate for customers and services low o
Showing the first 8K of 82K characters. Open the full section
Item 1B. Unresolved Staff Comments
None.
Item 2. Properties
Our headquarters is located at 1331 L Street, NW, in downtown Washington, DC, where we occupy approximately 159,331 square feet of office space, with a lease that expires May 31, 2025 (with two 5-year renewal options). Our headquarters is used primarily by our North America operating segment. Our principal facility in the U.K. is located in London, where we occupy 23,064 square feet of office space. Our lease for this facility has a term ending August 31, 2025. This facility is used by our International operating segment.
We also operate our research functions out of leased office spaces in Richmond, Virginia; San Diego, California; and Atlanta, Georgia. Additionally, we lease office space in a variety of other metropolitan areas. These locations include, among others, the following: Hendersonville, Tennessee; Irvine, California; Boston, Massachusetts; San Francisco, California; Ontario, California; and Los Angeles, California.
We believe these facilities are suitable and appropriately support our business needs.
Item 3. Legal Proceedings
Currently, and from time to time, we are involved in litigation incidental to the conduct of our business. We are not currently a party to any lawsuit or proceeding that, in the opinion of our management based on consultations with legal counsel, is likely to have a material adverse effect on our financial position or results of operations.
Item 4. Mine Safety Disclosures
Not Applicable.
PART II
Item 5. Market for Registrant’s Common Equity, Related Stockholder Matters and Issuer Purchases of Equity Securities
Our common stock is traded on the Nasdaq Global Select Market under the symbol “CSGP.” As of January 31, 2020, there were 1,527 holders of record of our common stock.
Dividend Policy. We have never declared or paid any dividends on our common stock. We do not anticipate paying any dividends on our common stock during the foreseeable future, but intend to retain any earnings for future growth of our business.
Recent Issues of Unregistered Securities. We did not issue any unregistered securities during the years ended December 31, 2018 and 2019 other than as disclosed in our Current Report on Form 8-K filed with the SEC on February 21, 2018.
Issuer Purchases of Equity Securities. The following table is a summary of our repurchases of common stock during each of the three months in the quarter ended December 31, 2019:
ISSUER PURCHASES OF EQUITY SECURITIES
| Month, 2019 | Total Number of Shares Purchased | Average Price Paid per Share | Total Number of Shares Purchased as Part of Publicly Announced Plans or Programs | Maximum Number of Shares that May Yet Be Purchased Under the Plans or Programs | |||||
| October 1 through 31 | 1,609 | $594.50 | — | — | |||||
| November 1 through 30 | 1,221 | 568.88 | — | — | |||||
| December 1 through 31 | 1,481 | 596.27 | — | — | |||||
| Total | 4,311 | (1) | $587.85 | — | — | ||||
| __________________________ |
(1) The number of shares purchased consists of shares of common stock tendered by employees to the Company to satisfy the employees' minimum tax withholding obligations arising as a result of vesting of restricted stock grants under the Company's 2007 Stock Incentive Plan, as amended (the "2007 Plan"), and the Company’s 2016 Stock Incentive Plan, as amended, which shares were purchased by the Company based on their fair market value on the trading day immediately preceding the vesting date. None of these share purchases were part of a publicly announced program to purchase common stock of the Company.
Stock Price Performance Graph
The stock performance graph below shows how an initial investment of $100 in our common stock would have compared to:
| • | An equal investment in the Standards & Poor's Stock 500 (“S&P 500”) Index; and |
| • | An equal investment in the S&P 500 Internet Services & Infrastructure Index. |
The comparison covers the period beginning December 31, 2014, and ending on December 31, 2019, and assumes the reinvestment of any dividends. Note that this performance is historical and is not necessarily indicative of future price performance.
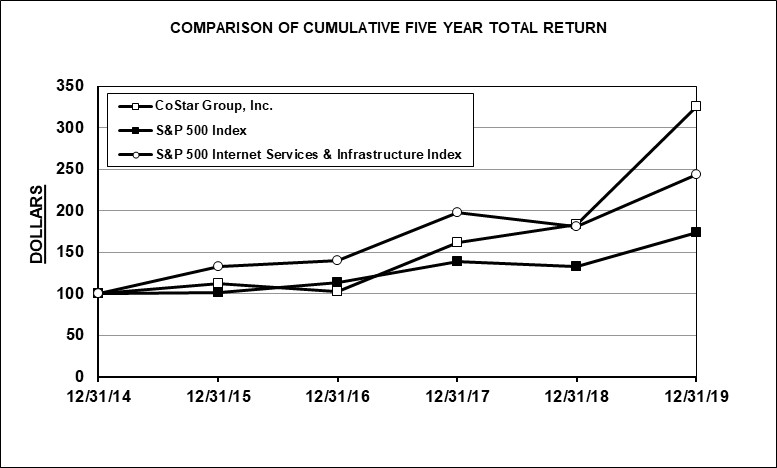
| Company / Index | 12/31/14 | 12/31/15 | 12/31/16 | 12/31/17 | 12/31/18 | 12/31/19 | ||||||||||||||||||
| CoStar Group, Inc. | $ | 100.00 | $ | 112.56 | $ | 102.65 | $ | 161.71 | $ | 183.71 | $ | 325.82 | ||||||||||||
| S&P 500 Index | 100.00 | 101.38 | 113.51 | 138.29 | 132.23 | 173.86 | ||||||||||||||||||
| S&P 500 Internet Services & Infrastructure Index (1) | 100.00 | 133.32 | 140.22 | 197.36 | 180.67 | 242.93 | ||||||||||||||||||
| __________________________ |
(1) As a result of revisions to the Global Industry Classification Standards, we now prepare the comparison above using the S&P 500 Internet Services & Infrastructure index. This index replaced the discontinued Internet Software & Services index that we used previously; however, the S&P 500 Internet Services & Infrastructure index uses the historical information from the discontinued index. Therefore, there is no change in the historical data presented under the index.
Item 6. Selected Financial Data
Selected Financial Data
(in thousands, except per share data)
The following table provides selected consolidated financial data for the five years ended December 31, 2019. The consolidated statements of operations data shown below for each of the three years ended December 31, 2019, 2018 and 2017 and the consolidated balance sheet data as of December 31, 2019 and 2018 are derived from audited consolidated financial statements that are included in this report. The consolidated statements of operations data for each of the years ended 2016 and 2015 and the consolidated balance sheet data as of December 31, 2017, 2016 and 2015 shown below are derived from audited consolidated financial statements for those years that are not included in this report. Information about prior period acquisitions and the adoption of recent accounting pronouncements that may affect the comparability of the selected financial information presented below are included in "Item 1. Business" and Note 2 to the Notes to the Consolidated Financial Statements included in Part IV of this Annual Report on Form 10-K. The total assets and total long-term liabilities reported in the consolidated balance sheet data have been reclassified to conform to our current presentation as a result of the retrospective application of the authoritative guidance to simplify the presentation of debt issuance costs.
The following data should be read in conjunction with “Item 7. Management’s Discussion and Analysis of Financial Condition and Results of Operations,” “Item 8. Financial Statements and Supplementary Data,” and the other information contained elsewhere in this Annual Report on Form 10-K.
| Year Ended December 31, | |||||||||||||||||||
| Consolidated Statements of Operations Data: | 2015 | 2016 | 2017 | 2018 | 2019 | ||||||||||||||
| Revenues | $ | 711,764 | $ | 837,630 | $ | 965,230 | $ | 1,191,832 | $ | 1,399,719 | |||||||||
| Cost of revenues | 188,885 | 173,814 | 220,403 | 269,933 | 289,239 | ||||||||||||||
| Gross profit | 522,879 | 663,816 | 744,827 | 921,899 | 1,110,480 | ||||||||||||||
| Operating expenses | 511,424 | 518,911 | 571,011 | 648,335 | 746,933 | ||||||||||||||
| Income from operations | 11,455 | 144,905 | 173,816 | 273,564 | 363,547 | ||||||||||||||
| Interest and other income | 537 | 1,773 | 4,044 | 13,281 | 30,017 | ||||||||||||||
| Interest and other expense | (9,411 | ) | (10,016 | ) | (9,014 | ) | (2,830 | ) | (2,615 | ) | |||||||||
| Loss on debt extinguishment | — | — | (3,788 | ) | — | — | |||||||||||||
| Income before income taxes | 2,581 | 136,662 | 165,058 | 284,015 | 390,949 | ||||||||||||||
| Income tax expense | 6,046 | 51,591 | 42,363 | 45,681 | 75,986 | ||||||||||||||
| Net income (loss) | $ | (3,465 | ) | $ | 85,071 | $ | 122,695 | $ | 238,334 | $ | 314,963 | ||||||||
| Net income (loss) per share — basic | $ | (0.11 | ) | $ | 2.64 | $ | 3.70 | $ | 6.61 | $ | 8.67 | ||||||||
| Net income (loss) per share — diluted | $ | (0.11 | ) | $ | 2.62 | $ | 3.66 | $ | 6.54 | $ | 8.60 | ||||||||
| Weighted average shares outstanding — basic | 31,950 | 32,167 | 33,200 | 36,058 | 36,310 | ||||||||||||||
| Weighted average shares outstanding — diluted | 31,950 | 32,436 | 33,559 | 36,448 | 36,630 |
| As of December 31, | |||||||||||||||||||
| Consolidated Balance Sheet Data: | 2015 | 2016 | 2017 | 2018 | 2019 | ||||||||||||||
| Cash, cash equivalents and long-term investments | $ | 437,325 | $ | 577,175 | $ | 1,221,533 | $ | 1,110,486 | $ | 1,080,801 | |||||||||
| Working capital | 337,452 | 472,545 | 1,141,269 | 1,059,139 | 992,109 | ||||||||||||||
| Total assets | 2,079,571 | 2,185,063 | 2,873,441 | 3,312,957 | 3,853,986 | ||||||||||||||
| Total long-term liabilities | 400,510 | 375,904 | 75,525 | 136,856 | 241,337 | ||||||||||||||
| Stockholders’ equity | 1,543,780 | 1,654,213 | 2,651,250 | 3,021,942 | 3,405,593 |
Item 7. Management’s Discussion and Analysis of Financial Condition and Results of Operations
The following Management’s Discussion and Analysis of Financial Condition and Results of Operations contains “forward-looking statements,” including statements about our beliefs and expectations. There are many risks and uncertainties that could cause actual results to differ materially from those discussed in the forward-looking statements. Potential factors that could cause actual results to differ materially from those discussed in any forward-looking statements include, but are not limited to, those stated above in Item 1A. under the headings “Risk Factors - Cautionary Statement Concerning Forward-Looking Statements” and “Risk Factors,” as well as those described from time to time in our filings with the Securities and Exchange Commission.
All forward-looking statements are based on information available to us on the date of this filing and we assume no obligation to update such statements, whether as a result of new information, future events or otherwise. The following discussion should be read in conjunction with our Quarterly Reports on Form 10-Q, Current Reports on Form 8-K and other filings with the Securities and Exchange Commission and the consolidated financial statements and related notes included in this Annual Report on Form 10-K.
Overview
Our principal information, analytics and online marketplace services are described in the following paragraphs by type of service:
Information and Analytics
CoStar Suite®. Our subscription-based information services consist primarily of CoStar Suite services. CoStar Suite is sold as a platform of service offerings consisting of CoStar Property®, CoStar COMPS®, CoStar Market Analytics, CoStar Tenant®, CoStar Lease Comps and CoStar Public Record through our mobile applications. Our integrated suite of online service offerings includes information about space available for-lease, comparable sales information, information about properties for-sale, tenant information, Internet marketing services, analytical capabilities, information for clients' websites, information about industry professionals and their business relationships, and industry news. Our sales force is responsible for selling multiple product lines, including CoStar Suite and LoopNet. During 2020, we plan to shift the focus of our sales force to sales of LoopNet Signature Ads. As a result, we anticipate CoStar Suite revenue growth will moderate during the year.
Information services. We provide real estate and lease management solutions, including lease administration and abstraction services, through our CoStar Real Estate Manager® service offerings, as well as portfolio and debt analysis, management and reporting capabilities through our CoStar Investment Analysis and CoStar Risk Analytics® service offerings. We provide information services internationally, through our Grecam, Belbex and Thomas Daily businesses in France, Spain and Germany, respectively. Sales of CoStar Real Estate Manager represent a significant portion of our information services revenue. CoStar Real Estate Manager's revenue growth rates increased significantly in 2018 as new clients adopted, and existing clients expanded their use of, CoStar Real Estate Manager to manage compliance with new lease accounting and reporting requirements which became effective for public companies for financial reporting periods beginning after December 15, 2018. As a result, we expect the growth rate for CoStar Real Estate Manager to normalize as the initial surge of the demand has eased. On October 22, 2019, we acquired STR and we now also provide STR’s complementary benchmarking and analytics services to the hospitality industry. We expect that the acquisition of STR and the combination of STR's and CoStar's offerings will allow us to create valuable new and improved tools for industry participants. See Note 4 to the accompanying Notes to the Consolidated Financial Statements included in Part IV of this Annual Report on Form 10-K for further discussion of the acquisition of STR.
Online Marketplaces
Multifamily. Apartments.comTM is part of our network of apartment marketing sites, which primarily includes ApartmentFinder®, ForRent.com®, ApartmentHomeLiving.comTM, Apartamentos.comTM, Westside Rentals and Off Campus Partners, LLC ("OCP"). Our apartment marketing network of subscription-based services offers renters a searchable database of apartment listings and provides professional property management companies and landlords with an advertising destination. On February 21, 2018, we completed the acquisition of ForRent, a division of Dominion Enterprises, including the ForRent.com, AFTER55.com, CorporateHousing.com and ForRentUniversity.com apartment marketing sites. On November 8, 2018, we acquired Cozy Services, Ltd. ("Cozy"), a provider of online rental solutions that provides a broad spectrum of services to both landlords and tenants, including property listings, rent estimates, rental applications, tenant screening, online rent payments and expense tracking. On June 12, 2019, we acquired OCP, a provider of student housing marketplace content and technology to U.S. universities. We expect the multifamily annual revenue growth rate to remain consistent with 2019 as we have fully integrated our ForRent and Cozy acquisitions into our service offerings. We continue to work on integrating the OCP acquisition and the
services they offer into our Apartments.com network. See Note 4 to the accompanying Notes to the Consolidated Financial Statements included in Part IV of this Annual Report on Form 10-K for further discussion of these acquisitions.
Commercial property and land. Our LoopNet.com network of commercial real estate websites offer subscription-based, online marketplace services that enable commercial property owners, landlords and real estate agents working on their behalf to list properties for-sale or for-lease and to submit detailed information about property listings. Commercial real estate agents, buyers and tenants use the LoopNet.com network of online marketplace services to search for available property listings that meet their criteria. As part of our rebuild and launch of the LoopNet Signature Ads product, we rolled out new packages in the fourth quarter of 2019. As a result, the growth rate increased in the fourth quarter of 2019, and LoopNet is expected to continue to grow in the subsequent periods. In addition, on October 12, 2018, we acquired all of the issued share capital of Realla Ltd. ("Realla"), the operator of a commercial property listings and data management platform in the U.K., including a free-to-list search engine for commercial property listings. See Note 4 to the accompanying Notes to the Consolidated Financial Statements included in Part IV of this Annual Report on Form 10-K for further discussion of the acquisition of Realla. Our BizBuySell.com network, which includes BizQuest® and FindaFranchise, provides online marketplaces for businesses for-sale. Our Land.com network of sites, which provides online marketplaces for rural lands for-sale, includes LandsofAmerica, LandAndFarm and LandWatch®.
For the years ended December 31, 2019, 2018 and 2017 our annualized net new bookings of subscription-based services on all contracts were approximately $210 million, $169 million and $148 million, respectively, calculated based on the annualized amount of change in our sales resulting from all new subscription-based contracts or upsales on all existing subscription-based contracts, less write downs and cancellations, for the period reported. We recognize subscription revenues on a straight-line basis over the life of the contract. Net bookings is considered a key indicator of future subscription revenue growth and is also used as a metric of salesforce productivity by management and investors.
For the years ended December 31, 2019, 2018 and 2017, our contract renewal rate for existing CoStar subscription-based services on annual contracts was approximately 90%, 90% and 91% respectively, and, therefore, our cancellation rate for those services was approximately 10%, 10%, and 9%, respectively. Our contract renewal rate is a quantitative measurement that is typically closely correlated with our revenue results. As a result, management also believes that the rate may be a reliable indicator of short-term and long-term performance. Our trailing twelve-month contract renewal rate may decline if, among other reasons, negative economic conditions lead to greater business failures and/or consolidations among our clients, reductions in customer spending, or decreases in our customer base.
Development, Investments and Expansion
We are committed to supporting, improving and enhancing our information, analytics and online marketplace solutions, including expanding and improving our offerings for property owners, property managers and renters. We expect to continue our software development efforts to improve existing services, introduce new services, integrate and cross-sell services, and expand and develop supporting technologies for our research, sales and marketing organizations.
Our key priorities for 2020 include:
| • | Continue to develop, improve and market our recently launched Apartments.com service offerings that focus on the digital rental experience and enable renters to apply for-leases, and for landlords to run tenant credit and background checks and make rent payments, all online through a single platform. We plan to aggressively market our multifamily listing services in an effort to provide more value to advertisers and, in turn, to attract advertisers. As such, we plan to increase our investment in Apartments.com marketing in 2020 by approximately $100 million, which may reduce our margins and profitability while we invest in future growth. The increased investment is focused on search engine marketing and enhanced brand awareness. We also plan to continue to invest in our multifamily business by increasing the size of our sales force with a focus on increasing sales to midsize and smaller apartment communities. |
| • | Obtaining necessary bankruptcy court and regulatory approvals to close the pending acquisition of RentPath and integrating RentPath with the Apartments.com network post-closing. On February 11, 2020, a wholly owned subsidiary of the Company entered into an agreement to acquire for $588 million in cash all of the equity interests of RentPath Holdings, Inc., as reorganized following an internal restructuring pursuant to and under the joint chapter 11 plan of reorganization of RentPath and certain of its subsidiaries. Closing of the acquisition is subject to customary closing conditions, including the expiration or termination of any applicable waiting period under applicable antitrust laws and approval by the bankruptcy court. See Note 19 to the accompanying Notes to the Consolidated Financial Statements included in Part IV of this Annual Report on Form 10-K for further discussion. |
| • | Continue to invest in the LoopNet marketplace by enhancing the content on the site (including high-quality imagery), seeking targeted advertisements, providing premium listing services (such as LoopNet Signature Ads) that increase a property listing’s exposure, and adding more content for premium listings to better meet the needs of a broader cross section of the commercial real estate industry. Additionally, we initiated training and incentive programs for our sales team to increase sales of LoopNet Signature Ads, with a focus on property owners. |
| • | Integrating recently completed acquisitions, including STR, with CoStar’s business operations. We plan to consolidate STR data and services with CoStar Suite to create an integrated platform. We plan to drive international expansion, in part, through STR's global operations and to apply STR's benchmarking expertise to other commercial real estate segments served by CoStar. |
| • | Continue to invest in CoStar Suite, including capabilities that allow us to broaden the reach of CoStar Suite in Europe by offering multiple languages and currencies on the platform. We plan to enhance CoStar Suite by making additional investments in analytical capabilities focused on owners and lenders of commercial real estate. In addition, we plan to invest in integrating the technology and infrastructure from other existing service offerings into the CoStar Suite platform, including CoStar Real Estate Manager, in order to leverage data and technology across our platforms and provide customers with additional functionality. |
We intend to continue to assess the need for additional investments in our business, in addition to the investments discussed above, in order to develop and distribute new services and functionality within our current platform or expand the reach of, or otherwise improve, our current service offerings. Any future product development or expansion of services, combination and coordination of services or elimination of services or corporate expansion, development or restructuring efforts could reduce our profitability and increase our capital expenditures. Any new investments, changes to our service offerings or other unforeseen events could cause us to experience reduced revenues or generate losses and negative cash flow from operations in the future. Any development efforts must comply with our credit facility, which contains restrictive covenants that restrict our operations and use of our cash flow and may prevent us from taking certain actions that we believe could increase our profitability or otherwise enhance our business.
For further discussion of our Company, strategy and products, see our business overview set forth in "Item 1. Business" in this Annual Report on Form 10-K.
Non-GAAP Financial Measures
We prepare and publicly release quarterly unaudited financial statements prepared in accordance with generally accepted accounting principles (“GAAP”). We also disclose and discuss certain non-GAAP financial measures in our public releases, investor conference calls and filings with the Securities and Exchange Commission. The non-GAAP financial measures that we may disclose include net income before interest and other income (expense), loss on debt extinguishment, income taxes, depreciation and amortization (“EBITDA”), adjusted EBITDA, adjusted EBITDA margin, non-GAAP net income and non-GAAP net income per diluted share. EBITDA is our net income before interest and other income (expense), loss on debt extinguishment, income taxes, depreciation and amortization. We typically disclose EBITDA on a consolidated and an operating segment basis in our earnings releases, investor conference calls and filings with the Securities and Exchange Commission. Adjusted EBITDA is different from EBITDA because we further adjust EBITDA for stock-based compensation expense, acquisition- and integration-related costs for pending and completed acquisitions, restructuring costs and settlements and impairments incurred outside our ordinary course of business. Non-GAAP net income is determined by adjusting our net income for stock-based compensation expense, acquisition- and integration-related costs for pending and completed acquisitions, restructuring costs, settlement and impairment costs incurred outside our ordinary course of business and loss on debt extinguishment, as well as amortization of acquired intangible assets and other related costs, and then subtracting an assumed provision for income taxes. We may disclose adjusted EBITDA, adjusted EBITDA margin, non-GAAP net income and non-GAAP net income per diluted share on a consolidated basis in our earnings releases, investor conference calls and filings with the Securities and Exchange Commission. The non-GAAP financial measures that we use may not be comparable to similarly titled measures reported by other companies. Also, in the future, we may disclose different non-GAAP financial measures in order to help our investors meaningfully evaluate and compare our results of operations to our previously reported results of operations or to those of other companies in our industry.
We view EBITDA, adjusted EBITDA, non-GAAP net income and non-GAAP net income per diluted share as operating performance measures and as such we believe that the most directly comparable GAAP financial measure to EBITDA, adjusted EBITDA and non-GAAP net income is net income. We believe the most directly comparable GAAP financial measures to non-GAAP net income per diluted share and adjusted EBITDA margin are net income per diluted share and net income divided by revenue, respectively. In calculating EBITDA, adjusted EBITDA, adjusted EBITDA margin, non-GAAP net income and non-
GAAP net income per diluted share, we exclude from net income the financial items that we believe should be separately identified to provide additional analysis of the financial components of the day-to-day operation of our business. We have outlined below the type and scope of these exclusions and the material limitations on the use of these non-GAAP financial measures as a result of these exclusions. EBITDA, adjusted EBITDA, adjusted EBITDA margin, non-GAAP net income and non-GAAP net income per diluted share are not measurements of financial performance under GAAP and should not be considered as a measure of liquidity, as an alternative to net income or as an indicator of any other measure of performance derived in accordance with GAAP. Investors and potential investors in our securities should not rely on EBITDA, adjusted EBITDA, adjusted EBITDA margin, non-GAAP net income and non-GAAP net income per diluted share as a substitute for any GAAP financial measure, including net income and net income per diluted share. In addition, we urge investors and potential investors in our securities to carefully review the GAAP financial information included as part of our Annual Reports on Form 10-K and Quarterly Reports on Form 10-Q that are filed with the Securities and Exchange Commission, as well as our quarterly earnings releases, and compare the GAAP financial information with our EBITDA, adjusted EBITDA, adjusted EBITDA margin, non-GAAP net income and non-GAAP net income per diluted share.
EBITDA, adjusted EBITDA, adjusted EBITDA margin, non-GAAP net income and non-GAAP net income per diluted share may be used by management to internally measure our operating and management performance and may be used by investors as supplemental financial measures to evaluate the performance of our business. We believe that these non-GAAP measures, when viewed with our GAAP results and accompanying reconciliations, provide additional information to investors that is useful to understand the factors and trends affecting our business. We have spent more than 30 years building our database of commercial real estate information and expanding our markets and services partially through acquisitions of complementary businesses. Due to the expansion of our information, analytics and online marketplace services, which has included acquisitions, our net income has included significant charges for amortization of acquired intangible assets, depreciation and other amortization, acquisition- and integration-related costs for pending and completed acquisitions, restructuring costs, and loss on debt extinguishment. Adjusted EBITDA, adjusted EBITDA margin, non-GAAP net income and non-GAAP net income per diluted share exclude these charges and provide meaningful information about the operating performance of our business, apart from charges for amortization of acquired intangible assets, depreciation and other amortization, acquisition- and integration-related costs for pending and completed acquisitions, restructuring costs; settlement and impairment costs incurred outside our ordinary course of business. We believe the disclosure of non-GAAP measures can help investors meaningfully evaluate and compare our performance from quarter to quarter and from year to year. We also believe the non-GAAP measures we disclose are measures of our ongoing operating performance because the isolation of non-cash charges, such as amortization and depreciation, and other items, such as interest, income taxes, stock-based compensation expenses, acquisition- and integration-related costs for pending and completed acquisitions, restructuring costs; loss on debt extinguishment and settlement and impairment costs incurred outside our ordinary course of business, provides additional information about our cost structure, and, over time, helps track our operating progress. In addition, investors, securities analysts and others have regularly relied on EBITDA and may rely on adjusted EBITDA, adjusted EBITDA margin, non-GAAP net income or non-GAAP net income per diluted share to provide a financial measure by which to compare our operating performance against that of other companies in our industry.
Set forth below are descriptions of financial items that have been excluded from net income to calculate EBITDA and the material limitations associated with using this non-GAAP financial measure as compared to net income:
| • | Amortization of acquired intangible assets in cost of revenues may be useful for investors to consider because it represents the diminishing value of any acquired trade names and other intangible assets and the use of our acquired technology, which is one of the sources of information for our database of commercial real estate information. We do not believe these charges necessarily reflect the current and ongoing cash charges related to our operating cost structure. |
| • | Amortization of acquired intangible assets in operating expenses may be useful for investors to consider because it represents the estimated attrition of our acquired customer base. We do not believe these charges necessarily reflect the current and ongoing cash charges related to our operating cost structure. |
| • | Depreciation and other amortization may be useful for investors to consider because they generally represent the wear and tear on our property and equipment used in our operations. We do not believe these charges necessarily reflect the current and ongoing cash charges related to our operating cost structure. |
| • | The amount of interest and other income and expense we generate and incur may be useful for investors to consider and may result in current cash inflows and outflows. However, we do not consider the amount of interest and other income and expense to be a representative component of the day-to-day operating performance of our business. |
| • | Income tax expense may be useful for investors to consider because it generally represents the taxes which may be payable for the period and the change in deferred income taxes during the period and may reduce the amount of funds otherwise available for use in our business. However, we do not consider the amount of income tax expense to be a representative component of the day-to-day operating performance of our business. |
| • | The amount of loss on our debt extinguishment may be useful for investors to consider because it generally represents losses from the early extinguishment of debt. However, we do not consider the amount of the loss on debt extinguishment to be a representative component of the day-to-day operating performance of our business. |
Set forth below are descriptions of additional financial items that have been excluded from EBITDA to calculate adjusted EBITDA and the material limitations associated with using this non-GAAP financial measure as compared to net income:
| • | Stock-based compensation expense may be useful for investors to consider because it represents a portion of the compensation of our employees and executives. Determining the fair value of the stock-based instruments involves a high degree of judgment and estimation and the expenses recorded may bear little resemblance to the actual value realized upon the future exercise or termination of the related stock-based awards. Therefore, we believe it is useful to exclude stock-based compensation in order to better understand the long-term performance of our core business. |
| • | The amount of acquisition- and integration- related costs for pending and completed acquisitions incurred may be useful for investors to consider because such costs generally represent professional service fees and direct expenses related to acquisitions. Because we do not acquire businesses on a predictable cycle, we do not consider the amount of acquisition- and integration- related costs for pending and completed acquisitions to be a representative component of the day-to-day operating performance of our business. |
| • | The amount of settlement and impairment costs incurred outside of our ordinary course of business may be useful for investors to consider because they generally represent gains or losses from the settlement of litigation matters or impairments on acquired intangible assets. We do not believe these charges necessarily reflect the current and ongoing cash charges related to our operating cost structure. |
| • | The amount of restructuring costs incurred may be useful for investors to consider because they generally represent costs incurred in connection with a change in a contract or a change in the makeup of our properties or personnel. We do not consider the amount of restructuring related costs to be a representative component of the day-to-day operating performance of our business. |
The financial items that have been excluded from our net income to calculate non-GAAP net income and non-GAAP net income per diluted share are amortization of acquired intangible assets and other related costs, stock-based compensation, acquisition- and integration- related costs for pending and completed acquisitions, restructuring and related costs and settlement and impairment costs incurred outside our ordinary course of business. These items are discussed above with respect to the calculation of adjusted EBITDA together with the material limitations associated with using this non-GAAP financial measure as compared to net income. In addition to these exclusions from net income, we subtract an assumed provision for income taxes to calculate non-GAAP net income. In 2019 and 2018, we assumed a 25% tax rate which approximated our historical long-term statutory corporate tax rate, excluding the impact of discrete items.
Adjusted EBITDA margin represents adjusted EBITDA divided by revenues for the period.
Non-GAAP net income per diluted share is a non-GAAP financial measure that represents non-GAAP net income divided by the number of diluted shares outstanding for the period used in the calculation of GAAP net income per diluted share.
Management compensates for the above-described limitations of using non-GAAP measures by using a non-GAAP measure only to supplement our GAAP results and to provide additional information that is useful to understand the factors and trends affecting our business.
The following table shows our net income reconciled to our EBITDA and our net cash flows from operating, investing and financing activities for the indicated periods (in thousands):
| Year Ended December 31, | |||||||||||
| 2019 | 2018 | 2017 | |||||||||
| Net income | $ | 314,963 | $ | 238,334 | $ | 122,695 | |||||
| Amortization of acquired intangible assets in cost of revenues | 21,357 | 20,586 | 19,707 | ||||||||
| Amortization of acquired intangible assets in operating expenses | 33,995 | 30,881 | 17,684 | ||||||||
| Depreciation and other amortization | 25,813 | 26,276 | 26,252 | ||||||||
| Interest and other income | (30,017 | ) | (13,281 | ) | (4,044 | ) | |||||
| Interest and other expense | 2,615 | 2,830 | 9,014 | ||||||||
| Loss on debt extinguishment | — | — | 3,788 | ||||||||
| Income tax expense | 75,986 | 45,681 | 42,363 | ||||||||
| EBITDA | $ | 444,712 | $ | 351,307 | $ | 237,459 | |||||
| Net cash flows provided by (used in) | |||||||||||
| Operating activities | $ | 457,780 | $ | 335,458 | $ | 234,703 | |||||
| Investing activities | $ | (483,753 | ) | $ | (448,001 | ) | $ | (72,267 | ) | ||
| Financing activities | $ | (4,154 | ) | $ | 2,744 | $ | 480,430 |
Consolidated Results of Operations
The following table provides our selected consolidated results of operations for the indicated periods (in thousands of dollars and as a percentage of total revenue):
| Year Ended December 31, | ||||||||||||||||||||
| 2019 | 2018 | 2017 | ||||||||||||||||||
| Revenues | $ | 1,399,719 | 100 | % | $ | 1,191,832 | 100 | % | $ | 965,230 | 100 | % | ||||||||
| Cost of revenues | 289,239 | 21 | 269,933 | 23 | 220,403 | 23 | ||||||||||||||
| Gross profit | 1,110,480 | 79 | 921,899 | 77 | 744,827 | 77 | ||||||||||||||
| Operating expenses: | ||||||||||||||||||||
| Selling and marketing (excluding customer base amortization) | 408,596 | 29 | 359,858 | 30 | 318,362 | 33 | ||||||||||||||
| Software development | 125,602 | 9 | 100,937 | 8 | 88,850 | 9 | ||||||||||||||
| General and administrative | 178,740 | 13 | 156,659 | 13 | 146,128 | 15 | ||||||||||||||
| Customer base amortization | 33,995 | 2 | 30,881 | 3 | 17,671 | 2 | ||||||||||||||
| Total operating expenses | 746,933 | 53 | 648,335 | 54 | 571,011 | 59 | ||||||||||||||
| Income from operations | 363,547 | 26 | 273,564 | 23 | 173,816 | 18 | ||||||||||||||
| Interest and other income | 30,017 | 2 | 13,281 | 1 | 4,044 | — | ||||||||||||||
| Interest and other expense | (2,615 | ) | — | (2,830 | ) | — | (9,014 | ) | (1 | ) | ||||||||||
| Loss on debt extinguishment | — | — | — | — | (3,788 | ) | — | |||||||||||||
| Income before income taxes | 390,949 | 28 | 284,015 | 24 | 165,058 | 17 | ||||||||||||||
| Income tax expense | 75,986 | 5 | 45,681 | 4 | 42,363 | 4 | ||||||||||||||
| Net income | $ | 314,963 | 23 | % | $ | 238,334 | 20 | % | $ | 122,695 | 13 | % |
The following table provides our revenues by type of service (in thousands of dollars and as a percentage of total revenue):
| Year Ended December 31, | ||||||||||||||||||||
| 2019 | 2018 | 2017 | ||||||||||||||||||
| Information and analytics | ||||||||||||||||||||
| CoStar Suite (1) | $617,798 | 44 | % | $545,195 | 46 | % | $ | 463,185 | 48 | % | ||||||||||
| Information services (1) | 88,446 | 6 | % | 67,624 | 6 | % | 72,618 | 8 | % | |||||||||||
| Online marketplaces | ||||||||||||||||||||
| Multifamily (1) | 490,631 | 35 | % | 405,795 | 34 | % | 279,855 | 29 | % | |||||||||||
| Commercial property and land (1) | 202,844 | 15 | % | 173,218 | 14 | % | 149,572 | 15 | % | |||||||||||
| Total revenues | $ | 1,399,719 | 100 | % | $ | 1,191,832 | 100 | % | $ | 965,230 | 100 | % | ||||||||
| __________________________ |
(1) For further discussion of our Company, strategy and products, see our business overview set forth in "Item 1. Business" in this Annual Report on Form 10-K.
Comparison of Year Ended December 31, 2019 and Year Ended December 31, 2018
The following table provides a comparison of our selected consolidated results of operations for the year ended December 31, 2019 and 2018 (in thousands of dollars):
| 2019 | 2018 | Increase (Decrease) ($) | Increase (Decrease) (%) | |||||||||||
| Revenues | ||||||||||||||
| CoStar Suite | $ | 617,798 | $545,195 | $ | 72,603 | 13 | % | |||||||
| Information services | 88,446 | 67,624 | 20,822 | 31 | ||||||||||
| Multifamily | 490,631 | 405,795 | 84,836 | 21 | ||||||||||
| Commercial property and land | 202,844 | 173,218 | 29,626 | 17 | ||||||||||
| Total revenues | 1,399,719 | 1,191,832 | 207,887 | 17 | ||||||||||
| Cost of revenues | 289,239 | 269,933 | 19,306 | 7 | ||||||||||
| Gross profit | 1,110,480 | 921,899 | 188,581 | 20 | ||||||||||
| Operating expenses: | ||||||||||||||
| Selling and marketing (excluding customer base amortization) | 408,596 | 359,858 | 48,738 | 14 | ||||||||||
| Software development | 125,602 | 100,937 | 24,665 | 24 | ||||||||||
| General and administrative | 178,740 | 156,659 | 22,081 | 14 | ||||||||||
| Customer base amortization | 33,995 | 30,881 | 3,114 | 10 | ||||||||||
| Total operating expenses | 746,933 | 648,335 | 98,598 | 15 | ||||||||||
| Income from operations | 363,547 | 273,564 | 89,983 | 33 | ||||||||||
| Interest and other income | 30,017 | 13,281 | 16,736 | NM | ||||||||||
| Interest and other expense | (2,615 | ) | (2,830 | ) | (215 | ) | (8 | ) | ||||||
| Income before income taxes | 390,949 | 284,015 | 106,934 | 38 | ||||||||||
| Income tax expense | 75,986 | 45,681 | 30,305 | 66 | ||||||||||
| Net income | $ | 314,963 | $ | 238,334 | $ | 76,629 | 32 | % | ||||||
| __________________________ | ||||||||||||||
| NM - Not meaningful |
Revenues. Revenues increased to $1.4 billion in 2019, from $1.2 billion in 2018. The $208 million increase was primarily attributable to an $85 million, or 21%, increase in multifamily revenue. The multifamily increase was due to upgrades of existing customer packages to higher value advertising packages, higher volume as a result of recent investments in marketing, and to a lesser extent, growth from the acquisitions of Cozy and OCP. CoStar Suite revenues increased $73 million, or 13%, primarily due to further increases in pricing and, to a lesser extent, further market penetration and cross-selling of our services. Commercial property and land revenue increased $30 million, or 17%, primarily due to growth in our LoopNet online marketplace services of $23 million, as well as, growth in our land and businesses for-sale services of $6 million. Information services revenue increased $21 million, or 31%, primarily due to increased revenue of $13 million from our CoStar Real Estate Manager service offerings and $9 million due to the acquisition of STR.
Gross Profit. Gross profit increased to $1.1 billion in 2019, from $922 million in 2018. The gross profit percentage was 79% for 2019 compared to 77% for 2018 as revenues increased at a higher rate than cost of revenues. The increase in cost of revenues of $19 million, or 7%, was primarily due to additional merchant fees and data and content costs of $9 million, primarily attributable to the acquisition of Cozy, additional personnel costs of $8 million and additional costs for research equipment of $3 million. The increase from the prior year was partially offset by nonrecurring research personnel restructuring costs incurred in the prior year of $3 million.
Selling and Marketing Expenses. Selling and marketing expenses increased to $409 million in 2019, from $360 million in 2018. The increase was primarily attributable to $41 million in additional marketing spend, including $23 million in search engine marketing, $7 million in co-branding and $11 million in other forms of marketing, primarily for Apartments.com. The increase was also due to a $5 million increase in personnel costs driven by increased headcount, partially offset by higher severance and retention costs incurred in 2018 related to the acquisition of ForRent.
Software Development Expenses. Software development expenses increased to $126 million in 2019, from $101 million in 2018, and increased as a percentage of revenues to 9% in 2019, compared to 8% in 2018. The increase in the amount of software development expense was primarily due to a $22 million increase in personnel costs as a result of increased headcount to enhance our product offerings, including $2 million due to the acquisition of STR.
General and Administrative Expenses. General and administrative expenses increased to $179 million in 2019, from $157 million in 2018, and remained consistent as a percentage of revenues at 13% in 2019 and 2018. The increase in general and administrative expenses was primarily due to personnel costs of $12 million due to increased headcount, $4 million as a result of the acquisition of STR, bad debt expense of $4 million, additional software and equipment of $4 million, depreciation expense of $2 million and travel and conference expenses of $1 million each, partially offset by a $5 million decrease in professional services.
Customer Base Amortization Expense. Customer base amortization expense increased to $34 million in 2019, from $31 million in 2018, and decreased as a percentage of revenues to 2% in 2019, compared to 3% in 2018. The increase in customer base amortization expense was primarily due to the STR acquisition.
Interest and Other Income. Interest and other income increased to $30 million in 2019, from $13 million in 2018. The increase was primarily due to $11 million in legal settlement proceeds received during 2019, as well as, higher rates of return and average cash and cash equivalent balances during 2019 compared to 2018.
Interest and Other Expense. Interest and other expense remained consistent for 2019 and 2018, and primarily consists of commitment fees and amortization of debt issuance costs.
Income Tax Expense. Income tax expense increased to $76 million in 2019, from $46 million in 2018. The increase was primarily due to higher income before income taxes for 2019, and to a lesser extent, discrete items for higher state research and development tax credits recognized for 2018. The effective tax rate for 2019 was 19%, compared to 16% in 2018 and lower than the statutory rates due to discrete items including research and development credits as well as excess tax benefits.
For a comparison of the Company’s results of operations for the fiscal year ended December 31, 2018 to the year ended December 31, 2017, see Item 7, Management’s Discussion and Analysis of Financial Condition and Results of Operations in the Company’s Annual Report on Form 10-K for the year ended December 31, 2018, which was filed with the U.S. Securities and Exchange Commission on February 28, 2019.
Comparison of Business Segment Results for Year Ended December 31, 2019 and Year Ended December 31, 2018
We manage our business geographically in two operating segments, with the primary areas of measurement and decision-making being North America, which includes the U.S. and Canada, and International, which primarily includes Europe, Asia-Pacific and Latin America. Management relies on an internal management reporting process that provides revenue and operating segment net income before interest and other income (expense), loss on debt extinguishment, income taxes, depreciation and amortization (“EBITDA”). Management believes that operating segment EBITDA is an appropriate measure for evaluating the operational performance of our operating segments. EBITDA is used by management to internally measure operating and management performance and to evaluate the performance of the business. However, this measure should be considered in addition to, not as a substitute for or superior to, income from operations or other measures of financial performance prepared in accordance with GAAP.
Segment Revenues. North America revenues increased to $1.4 billion for the year ended December 31, 2019, from $1.2 billion for the year ended December 31, 2018. The increase in North America revenues was primarily due to a $85 million increase in multifamily revenues driven by the sale of higher value advertising packages and volume, and to a lesser extent, the acquisition of Cozy, and continued organic growth in CoStar Suite revenues of $71 million. There were also increases of $29 million and $18 million in commercial property and land and information services, respectively, primarily due to growth in our LoopNet and CoStar Real Estate Manager service offerings, and to a lesser extent, the acquisition of STR. International revenues increased to $40 million for the year ended December 31, 2019, from $35 million for the year ended December 31, 2018. The increase in International revenues was primarily due the acquisition of STR and further growth of our subscription-based services.
Segment EBITDA. North America EBITDA increased to $452 million for the year ended December 31, 2019, from $358 million for the year ended December 31, 2018. The increase in North America EBITDA was due primarily to an increase in revenues, partially offset by increases in personnel and marketing costs. International EBITDA remained consistent at a loss of $7 million for the years ended December 31, 2019 and December 31, 2018.
For a comparison of the Company’s business segment results of operations for the fiscal year ended December 31, 2018 to the year ended December 31, 2017, see Item 7, Management’s Discussion and Analysis of Financial Condition and Results of
Operations in the Company’s Annual Report on Form 10-K for the year ended December 31, 2018, which was filed with the U.S. Securities and Exchange Commission on February 28, 2019.
Consolidated Quarterly Results of Operations
The following tables present our unaudited consolidated results of operations on a quarterly basis for the indicated periods (in thousands, except per share amounts, and as a percentage of total revenues). These tables should be read in conjunction with the consolidated financial statements and related notes included in this Annual Report on Form 10-K. The quarterly results of historical periods are not necessarily indicative of quarterly results for any future period.
| 2019 | 2018 | ||||||||||||||||||||||||||||||
| Mar. 31 | Jun. 30 | Sep. 30 | Dec. 31 | Mar. 31 | Jun. 30 | Sep. 30 | Dec. 31 | ||||||||||||||||||||||||
| Revenues | $ | 328,425 | $ | 343,760 | $ | 352,808 | $ | 374,726 | $ | 273,718 | $ | 297,018 | $ | 305,525 | $ | 315,571 | |||||||||||||||
| Cost of revenues | 71,153 | 71,918 | 71,172 | 74,996 | 62,477 | 67,136 | 72,072 | 68,248 | |||||||||||||||||||||||
| Gross profit | 257,272 | 271,842 | 281,636 | 299,730 | 211,241 | 229,882 | 233,453 | 247,323 | |||||||||||||||||||||||
| Operating expenses | 163,780 | 197,042 | 187,367 | 198,744 | 157,796 | 186,108 | 162,765 | 141,666 | |||||||||||||||||||||||
| Income from operations | 93,492 | 74,800 | 94,269 | 100,986 | 53,445 | 43,774 | 70,688 | 105,657 | |||||||||||||||||||||||
| Interest and other income | 4,945 | 5,913 | 5,358 | 13,801 | 2,987 | 2,652 | 3,035 | 4,607 | |||||||||||||||||||||||
| Interest and other expense | (732 | ) | (697 | ) | (704 | ) | (482 | ) | (690 | ) | (728 | ) | (717 | ) | (695 | ) | |||||||||||||||
| Income before income taxes | 97,705 | 80,016 | 98,923 | 114,305 | 55,742 | 45,698 | 73,006 | 109,569 | |||||||||||||||||||||||
| Income tax expense | 12,536 | 16,768 | 20,304 | 26,378 | 3,511 | 1,863 | 14,247 | 26,060 | |||||||||||||||||||||||
| Net income | $ | 85,169 | $ | 63,248 | $ | 78,619 | $ | 87,927 | $ | 52,231 | $ | 43,835 | $ | 58,759 | $ | 83,509 | |||||||||||||||
| Net income per share — basic | $ | 2.35 | $ | 1.74 | $ | 2.16 | $ | 2.42 | $ | 1.46 | $ | 1.22 | $ | 1.63 | $ | 2.31 | |||||||||||||||
| Net income per share — diluted | $ | 2.33 | $ | 1.73 | $ | 2.15 | $ | 2.39 | $ | 1.44 | $ | 1.20 | $ | 1.61 | $ | 2.29 |
| 2019 | 2018 | ||||||||||||||||||||||
| Mar. 31 | Jun. 30 | Sep. 30 | Dec. 31 | Mar. 31 | Jun. 30 | Sep. 30 | Dec. 31 | ||||||||||||||||
| Revenues | 100 | % | 100 | % | 100 | % | 100 | % | 100 | % | 100 | % | 100 | % | 100 | % | |||||||
| Cost of revenues | 22 | 21 | 20 | 20 | 23 | 23 | 24 | 22 | |||||||||||||||
| Gross profit | 78 | 79 | 80 | 80 | 77 | 77 | 76 | 78 | |||||||||||||||
| Operating expenses | 50 | 57 | 53 | 53 | 58 | 63 | 54 | 45 | |||||||||||||||
| Income from operations | 28 | 22 | 27 | 27 | 20 | 14 | 22 | 32 | |||||||||||||||
| Interest and other income | 2 | 2 | 2 | 4 | 1 | 1 | 1 | 1 | |||||||||||||||
| Income before income taxes | 30 | 24 | 29 | 31 | 21 | 15 | 23 | 33 | |||||||||||||||
| Income tax expense | 4 | 5 | 6 | 7 | 1 | 1 | 5 | 8 | |||||||||||||||
| Net income | 26 | % | 19 | % | 23 | % | 24 | % | 20 | % | 14 | % | 18 | % | 25 | % |
Liquidity and Capital Resources
Our principal sources of liquidity are cash and cash equivalents and cash from operations. We also have access to $750 million from our revolving credit facility. In total, cash and cash equivalents decreased by $30 million at December 31, 2019 compared to December 31, 2018, primarily due to the cash paid in connection with the acquisitions of STR and OCP for an aggregate amount of $438 million, cash paid for purchases of property and equipment of $46 million and repurchases of restricted stock to satisfy employee tax withholding obligations upon vesting of restricted stock awards valued at approximately $28 million. These decreases were partially offset by net cash generated from operations of $458 million and proceeds from the exercise of employee stock options of approximately $25 million.
Net cash provided by operating activities for the year ended December 31, 2019 was $458 million compared to $335 million for the year ended December 31, 2018. The approximately $123 million increase from December 31, 2018 to December 31, 2019 was primarily due to an increase in net income of $77 million including an increase in other non-cash expenses such as stock-based compensation expense and the timing of collections for accounts receivable, partially offset by $15 million placed into an escrow account for deferred compensation for certain STR employees.
Net cash used in investing activities for the year ended December 31, 2019 was $484 million compared to $448 million for the year ended December 31, 2018. The $36 million increase in cash used in investing activities was primarily due to approximately $418 million of net cash paid to acquire ForRent, Cozy and Realla during 2018, compared to $438 million net cash paid during 2019 for the STR and OCP acquisitions. During 2019, we made capital expenditures of approximately $46 million compared to approximately $30 million during 2018. The increase in capital expenditures during the year ended December 31, 2019 was partially driven by the purchase of a corporate aircraft, which is principally used for business travel by our executives.
Net cash used in financing activities for the year ended December 31, 2019 was $4 million compared to net cash provided by financing activities of $3 million for the year ended December 31, 2018. This $7 million increase in cash used in financing activities in 2019 compared to 2018 was primarily due to higher repurchases of restricted stock to satisfy employee tax withholding obligations upon vesting of restricted stock awards of $3 million, as well as a decrease in proceeds from the exercise of employee stock options of $2 million.
Our future capital requirements will depend on many factors, including, among others, our operating results, expansion and integration efforts, and our level of acquisition activity or other strategic transactions. To date, we have grown in part by acquiring other companies, and we expect to continue to make acquisitions. On February 11, 2020, our wholly owned subsidiary entered into a purchase agreement to acquire all of the equity interests of reorganized RentPath, following an internal restructuring pursuant to a chapter 11 plan of reorganization, for $588 million in cash. The purchase agreement requires us to pay a $59 million fee in the event the purchase agreement is terminated prior to closing under specified circumstances. The acquisition will be funded using cash on hand. See Note 19 to the accompanying Notes to the Consolidated Financial Statements included in Part IV of this Annual Report on Form 10-K for further discussion. Based on current plans, we believe that our available cash combined with positive cash flow provided by operating activities should be sufficient to fund our operations for at least the next twelve months.
Contractual Obligations. The following table summarizes our principal contractual obligations at December 31, 2019 and the effect such obligations are expected to have on our liquidity and cash flows in future periods (in thousands):
| Total | 2020 | 2021-2022 | 2023-2024 | Thereafter | |||||||||||||||
| Operating leases | $ | 165,542 | $ | 34,976 | $ | 64,698 | $ | 53,635 | $ | 12,233 | |||||||||
| Purchase obligations (1) | 41,284 | 20,798 | 18,762 | 1,152 | 572 | ||||||||||||||
| Total contractual principal cash obligations | $ | 206,826 | $ | 55,774 | $ | 83,460 | $ | 54,787 | $ | 12,805 | |||||||||
| __________________________ |
(1) Amounts do not include (i) contracts with terms of twelve months or less, (ii) multi-year contracts that may be terminated by a third-party or us, or (iii) employment agreements. Amounts do not include income taxes payable due to uncertainty regarding the timing of future cash payments.
Critical Accounting Policies
The preparation of financial statements and related disclosures in conformity with U.S. generally accepted accounting principles (“GAAP”) requires management to make estimates and assumptions that affect the reported amounts of assets and liabilities, the disclosure of contingent assets and liabilities at the date of the financial statements and revenues and expenses during the period reported. The following accounting policies involve a “critical accounting estimate” because they are particularly dependent on estimates and assumptions made by management about matters that are highly uncertain at the time the accounting estimates are made. In addition, while we have used our best estimates based on facts and circumstances available to us at the time, different acceptable assumptions would yield different results. Changes in the accounting estimates are reasonably likely to occur from period to period, which may have a material impact on the presentation of our financial condition and results of operations. We review these estimates and assumptions periodically and reflect the effects of revisions in the period that they are determined to be necessary. We consider policies relating to the following matters to be critical accounting policies:
| • | Long-lived assets, intangible assets and goodwill |
| • | Revenue recognition |
| • | Income taxes |
| • | Business combinations |
With respect to our accounting policy for long-lived assets, intangible assets and goodwill, we further supplement in Note 2 of the Notes to the Consolidated Financial Statements included in this Annual Report on Form 10-K with the following:
We assess the impairment of long-lived assets, identifiable intangibles and goodwill whenever events or changes in circumstances indicate that the carrying value may not be recoverable. Judgments made by management relate to the expected useful lives of long-lived assets and our ability to recover the carrying value of such assets. The accuracy of these judgments may be adversely affected by several factors, including the factors listed below:
| • | Significant underperformance relative to historical or projected future operating results; |
| • | Significant changes in the manner of our use of the acquired assets or the strategy for our overall business; |
| • | Significant negative industry or economic trends; or |
| • | Significant decline in our market capitalization relative to net book value for a sustained period. |
When we determine that the carrying value of long-lived and identifiable intangible assets may not be recovered based upon the existence of one or more of the above indicators, we test for impairment.
Goodwill and identifiable intangible assets that are not subject to amortization are tested annually for impairment by each reporting unit on October 1 of each year and are also tested for impairment more frequently based upon the existence of one or more of the above indicators.
Goodwill represents the excess of costs over the fair value of assets of acquired businesses. Goodwill is not amortized, but instead tested for impairment at least annually by each reporting unit. We may first assess qualitative factors to evaluate whether it is more likely than not that the fair value of a reporting unit is less than its carrying amount or elect to bypass such assessment. If it is determined that it is more likely than not that the fair value of a reporting unit is less than its carrying value, or we elect to bypass such assessment, we then determine the fair value of each reporting unit. We estimate the fair value of each reporting unit based on a projected discounted cash flow model that includes significant assumptions and estimates including our discount rate, growth rate and future financial performance. Assumptions about the discount rate are based on a weighted average cost of capital for comparable companies. Assumptions about the growth rate and future financial performance of a reporting unit are based on our forecasts, business plans, economic projections and anticipated future cash flows. These assumptions are subject to change from period to period and could be adversely impacted by the uncertainty surrounding global market conditions, commercial real estate conditions and the competitive environment in which we operate. Changes in these or other factors could negatively affect our reporting units' fair value and potentially result in impairment charges. Such impairment charges could have an adverse effect on our results of operations.
The fair value of each reporting unit is compared to the carrying amount of the reporting unit. If the carrying value of the reporting unit exceeds the fair value, then an impairment loss is recognized for the difference. We estimate the fair value of our reporting units based on a projected discounted cash flow method using a discount rate determined by our management to be commensurate with the risk in our current business model. As of October 1, 2019, we assessed the relevant qualitative factors and concluded that it was not more likely than not that the fair value of our reporting units was less than their respective carrying amounts. There have been no events or changes in circumstances as a result of our qualitative impairment analysis on October 1, 2019, that would indicate that the carrying value of each reporting unit may not be recoverable.
For an in-depth discussion of each of our significant accounting policies, including our critical accounting policies and further information regarding estimates and assumptions involved in their application, see Note 2 to the accompanying consolidated financial statements included in this Annual Report on Form 10-K.
Recent Accounting Pronouncements
See Note 2 of the Notes to Consolidated Financial Statements included in this Annual Report on Form 10-K for information on recent accounting pronouncements, including the expected dates of adoption.
Item 7A. Quantitative and Qualitative Disclosures About Market Risk
We provide information, analytics and online marketplace services to commercial real estate and related business communities within the regions where we operate which primarily include, North America, Europe, Asia-Pacific and Latin America. The functional currency for a majority of our operations is the local currency, with the exception of certain STR international locations for which the functional currency is the British Pound.
Fluctuations in the British Pound, Canadian dollar and Euro may have an impact on our business, results of operations and financial position. For the year ended December 31, 2019 and December 31, 2018, revenues denominated in foreign currencies were approximately 4% and 3%, respectively, of total revenue. For the year ended December 31, 2019 and December 31, 2018, our revenues would have decreased by approximately $6 million and $3 million if the U.S. dollar exchange rate used strengthened by 10%. For the year ended December 31, 2019 and December 31, 2018, our revenues would have increased by approximately $6 million and $3 million if the U.S. dollar exchange rate used weakened by 10%. Fluctuations in the exchange rates of revenues denominated in any other foreign currencies would have had an immaterial impact on our consolidated results. In addition, we have assets and liabilities denominated in foreign currencies. We currently do not use financial instruments to hedge our exposure to exchange rate fluctuations with respect to our foreign subsidiaries. We may seek to enter into hedging transactions in the future to reduce our exposure to exchange rate fluctuations, but we may be unable to enter into hedging transactions successfully, on acceptable terms or at all. As of December 31, 2019, accumulated other comprehensive loss included a loss from foreign currency translation adjustments of approximately $8 million.
We do not believe we have material exposure to market risks associated with changes in interest rates related to cash equivalent securities held as of December 31, 2019. As of December 31, 2019, we had $1.1 billion of cash and cash equivalents. If there is an increase or decrease in interest rates, there will be a corresponding increase or decrease in the amount of interest earned on our cash and cash equivalents.
Included within our short-term and long-term investments are investments in mostly AAA-rated student loan ARS. These securities are primarily securities supported by guarantees from the FFELP of the U.S. Department of Education. As of December 31, 2019, $11 million of our investments in ARS failed to settle at auction. As a result, we may not be able to sell these investments at par value until a future auction on these investments is successful. In the event we need to immediately liquidate these investments, we may have to locate a buyer outside the auction process, who may be unwilling to purchase the investments at par, resulting in a loss. If the issuers are unable to successfully close future auctions and/or their credit ratings deteriorate, we may be required to adjust the carrying value of these investments as a temporary impairment and recognize a greater unrealized loss in accumulated other comprehensive loss or as an other-than-temporary impairment charge to earnings. Based on our ability to access our cash and cash equivalents, and our expected operating cash flows, we do not anticipate having to sell these securities below par value in order to operate our business in the foreseeable future. See Notes 5 and 6 to the Notes to Consolidated Financial Statements included in this Annual Report on Form 10-K for further discussion.
We had approximately $2.3 billion of goodwill and intangible assets as of December 31, 2019. As of December 31, 2019, we believe our intangible assets will be recoverable; however, changes in the economy, the business in which we operate and our own relative performance could change the assumptions used to evaluate intangible asset recoverability. In the event that we determine that an asset has been impaired, we would recognize an impairment charge equal to the amount by which the carrying amount of the assets exceeds the fair value of the asset. We continue to monitor these assumptions and their effect on the estimated recoverability of our intangible assets.
Item 8. Financial Statements and Supplementary Data
Financial Statements meeting the requirements of Regulation S-X are set forth beginning at page F-1. Supplementary data is set forth in “Management’s Discussion and Analysis of Financial Condition and Results of Operations” under the caption “Consolidated Results of Operations” and “Consolidated Quarterly Results of Operations.”
Item 9. Changes in and Disagreements with Accountants on Accounting and Financial Disclosure
None.
Item 9A. Controls and Procedures
We maintain disclosure controls and procedures that are designed to ensure that information required to be disclosed in our reports filed or submitted under the Exchange Act is recorded, processed, summarized and reported, within the time periods specified in the Securities and Exchange Commission’s rules and forms, and that such information is accumulated and communicated to our management, including our Chief Executive Officer and Chief Financial Officer, as appropriate, to allow for timely decisions regarding required disclosure. In designing and evaluating the disclosure controls and procedures, management recognized that any controls and procedures, no matter how well designed and operated, can provide only reasonable assurance of achieving the desired control objectives, and management is required to apply its judgment in evaluating the cost-benefit relationship of possible controls and procedures.
We carried out an evaluation, under the supervision and with the participation of our management, including our Chief Executive Officer and our Chief Financial Officer, of the effectiveness of the design and operation of our disclosure controls and procedures as of the end of the fiscal year. Based on the foregoing, our Chief Executive Officer and Chief Financial Officer concluded that our disclosure controls and procedures were effective and were operating at a reasonable assurance level as of December 31, 2019.
During 2019, we continued to implement a financial system that is designed to improve the efficiency and effectiveness of our operational and financial accounting processes. This implementation is expected to continue beyond 2020. Consistent with any process change that we implement, the design of the internal controls has and will continue to be evaluated for effectiveness as part of our overall assessment of the effectiveness of our disclosure controls and procedures. We expect that the implementation of this system will improve our internal controls over financial reporting.
Other than the implementation of a new financial system noted above, there have been no changes in our internal control over financial reporting during our most recent fiscal year that have materially affected, or are reasonably likely to materially affect, our internal control over financial reporting.
Management’s Report on Internal Control over Financial Reporting
Management of CoStar is responsible for establishing and maintaining adequate internal control over financial reporting and for the assessment of the effectiveness of internal control over financial reporting. As defined by the Securities and Exchange Commission, internal control over financial reporting is a process designed by, or supervised by, the Company’s principal executive and principal financial officers, to provide reasonable assurance regarding the reliability of financial reporting and the preparation of financial statements in accordance with GAAP.
The Company’s internal control over financial reporting is supported by written policies and procedures, that (1) pertain to the maintenance of records that, in reasonable detail, accurately and fairly reflect the transactions and dispositions of the Company’s assets; (2) provide reasonable assurance that transactions are recorded as necessary to permit preparation of financial statements in accordance with GAAP, and that receipts and expenditures of the Company are being made only in accordance with authorizations of the Company’s management and directors; and (3) provide reasonable assurance regarding prevention or timely detection of unauthorized acquisition, use or disposition of the Company’s assets that could have a material effect on the financial statements.
Because of its inherent limitations, internal control over financial reporting may not prevent or detect misstatements. Projections of any evaluation of effectiveness to future periods are subject to the risk that controls may become inadequate because of changes in conditions, or that the degree of compliance with the policies or procedures may deteriorate.
In connection with the preparation of the Company's annual financial statements, management of the Company has undertaken an assessment of the effectiveness of the Company’s internal control over financial reporting as of December 31, 2019 based on criteria established in Internal Control – Integrated Framework (2013 framework) issued by the Committee of Sponsoring
Organizations of the Treadway Commission (“the COSO Framework”). Management's assessment included an evaluation of the design of the Company's internal control over financial reporting and testing of the operational effectiveness of the Company's internal control over financial reporting.
Based on this assessment, management has concluded that the Company's internal control over financial reporting was effective as of December 31, 2019.
Ernst & Young LLP, the independent registered public accounting firm that audited the Company's financial statements included in this report, has issued an attestation report on the effectiveness of internal control over financial reporting, a copy of which is included in this Annual Report on Form 10-K.
On June 12, 2019, we completed the acquisition of OCP and on October 22, 2019, we completed the acquisition of STR. As permitted by the Securities and Exchange Commission, we have elected to exclude the internal controls of these acquisitions that have not been integrated into our existing processes and controls from our assessment of the effectiveness of internal control over financial reporting as of December 31, 2019. The excluded aggregate financial position of OCP and STR represented less than 1% of our total assets as of December 31, 2019, and less than 1% and 2% of our revenues and net income, respectively, for the year then ended. We will include the internal controls of OCP and STR in our assessment of the effectiveness of our internal control over financial reporting as of December 31, 2020.
Item 9B. Other Information.
None.
PART III
Item 10. Directors, Executive Officers and Corporate Governance
CoStar has adopted a Code of Conduct for its directors. In addition, CoStar has adopted a separate Code of Conduct for its officers and employees, including its principal executive, financial and accounting officers, or persons performing similar functions. Copies of each of these codes may be found in the “Investors” section of the Company’s website at www.investors.costargroup.com/leadership. We intend to disclose future amendments to certain provisions of our Codes, or waivers of such provisions granted to executive officers and directors, as required by the Security of Exchange ("SEC') rules on the website within four business days following the date of such amendment or waiver.
The remaining information required by this Item is incorporated by reference to our Proxy Statement for our 2020 annual meeting of stockholders under the captions “Nominees for the Board of Directors,” “Nominees’ Business Experience, Qualifications and Directorships,” “Information about our Executive Officers and Key Employees,” and “Board Meetings and Committees.”
Item 11. Executive Compensation
The information required by this Item is incorporated by reference to our Proxy Statement for our 2020 annual meeting of stockholders under the captions “Compensation Discussion and Analysis,” “Executive Compensation Tables and Discussion,” “Narratives to Summary Compensation Table and Grants of Plan-Based Awards Table,” “Director Compensation,” “Compensation Committee Interlocks and Insider Participation,” and “Compensation Committee Report.”
Item 12. Security Ownership of Certain Beneficial Owners and Management and Related Stockholder Matters
The information required by this Item is incorporated by reference to our Proxy Statement for our 2020 annual meeting of stockholders under the captions “Equity Compensation Plan Information” and “Stock Ownership Information.”
Item 13. Certain Relationships and Related Transactions, and Director Independence
The information required by this Item is incorporated by reference to our Proxy Statement for our 2020 annual meeting of stockholders under the captions “Certain Relationships and Related Transactions” and “Corporate Governance Matters.”
Item 14. Principal Accountant Fees and Services
The information required by this Item is incorporated by reference to our Proxy Statement for our 2020 annual meeting of stockholders under the caption “Ratification of the Appointment of Independent Registered Public Accounting Firm.”
PART IV
Item 15. Exhibits and Financial Statement Schedules
(a)(1) The following financial statements are filed as a part of this report: CoStar Group, Inc. Consolidated Financial Statements.
(a)(2) Financial statement schedules:
Schedule II – Valuation and Qualifying Accounts
The table below details the activity of the allowance for doubtful accounts and sales credits (1) for the years ended December 31, 2019, 2018, and 2017 (in thousands):
| Balance at Beginning of Year | Charged to Expense | Reductions | Balance at End of Year | |||||||||||||
| Year ended December 31, 2017 | $ | 6,344 | $ | 5,690 | $ | 5,565 | $ | 6,469 | ||||||||
| Year ended December 31, 2018 | $ | 6,469 | $ | 6,542 | $ | 7,302 | $ | 5,709 | ||||||||
| Year ended December 31, 2019 | $ | 5,709 | $ | 10,978 | $ | 11,590 | $ | 5,097 | ||||||||
| __________________________ |
| (1) | Additions to the allowance for doubtful accounts are charged to bad debt expense. Additions to the allowance for sales credits are charged against revenues. |
Additional financial statement schedules are omitted because they are not applicable or not required or because the required information is incorporated herein by reference or included in the financial statements or related notes included elsewhere in this report.
(a)(3) The documents required to be filed as exhibits to this Report under Item 601 of Regulation S-K are listed as follows:
Exhibits
| Exhibit No. | Description | |
| 3.1 | Third Amended and Restated Certificate of Incorporation (Incorporated by reference to Exhibit 3.1 to the Registrant's Current Report on Form 8-K filed with the Commission on June 6, 2013). | |
| 3.2 | Third Amended and Restated By-Laws (Incorporated by reference to Exhibit 3.1 to the Registrant’s Current Report on Form 8-K filed with the Commission on September 24, 2013). | |
| 4.1 | Specimen Common Stock Certificate (Incorporated by reference to Exhibit 4.1 to the Registration Statement on Form S-4 of the Registrant (Reg. No. 333-174214) filed with the Commission on June 3, 2011). | |
| 4.2 | Description of the Registrant's Securities Registered Pursuant to Section 12 of the Securities Exchange Act of 1934 (filed herewith). | |
| *10.1 | CoStar Group, Inc. 2016 Stock Incentive Plan (Incorporated by reference to Exhibit 4.4 to the Registration Statement on Form S-8 of the Registrant (Reg. No. 333-212278) filed with the Commission on June 28, 2016). | |
| *10.2 | First Amendment to the CoStar Group, Inc. 2016 Stock Incentive Plan (Incorporated by reference to Exhibit 10.1 to the Registrant’s Quarterly Report on Form 10-Q filed April 25, 2018). | |
| *10.3 | CoStar Group, Inc. 2007 Stock Incentive Plan, as amended (Incorporated by reference to Exhibit 10.1 to the Registrant’s Current Report on Form 8-K filed June 8, 2012). | |
| *10.4 | CoStar Group, Inc. 2007 Stock Incentive Plan French Sub-Plan (Incorporated by reference to Exhibit 10.3 to the Registrant’s Report on Form 10-K filed February 29, 2008). | |
| *10.5 | Form of CoStar Group, Inc. 2016 Plan Restricted Stock Grant Agreement between the Registrant and certain of its officers, directors and employees (Incorporated by reference to Exhibit 10.3 to the Registrant’s Quarterly Report on Form 10-Q filed July 28, 2016). | |
| *10.6 | Form of CoStar Group, Inc. 2016 Plan Restricted Stock Grant Agreement for Service Awards between the Registrant and certain of its officers and employees (Incorporated by reference to Exhibit 10.4 to the Registrant’s Quarterly Report on Form 10-Q filed July 28, 2016). | |
| *10.7 | Form of CoStar Group, Inc. 2016 Plan Restricted Stock Unit Grant Agreement between the Registrant and certain of its officers and employees (Incorporated by reference to Exhibit 10.5 to the Registrant’s Quarterly Report on Form 10-Q filed July 28, 2016). |
| Exhibit No. | Description | |
| *10.8 | Form of CoStar Group, Inc. 2016 Plan Incentive Stock Option Grant Agreement between the Registrant and certain of its officers and employees (Incorporated by reference to Exhibit 10.6 to the Registrant’s Quarterly Report on Form 10-Q filed July 28, 2016). | |
| *10.9 | Form of CoStar Group, Inc. 2016 Plan Incentive Stock Option Grant Agreement between the Registrant and Andrew C. Florance (Incorporated by reference to Exhibit 10.7 to the Registrant’s Quarterly Report on Form 10-Q filed July 28, 2016). | |
| *10.10 | Form of CoStar Group, Inc. 2016 Plan Nonqualified Stock Option Grant Agreement between the Registrant and certain of its officers, directors and employees (Incorporated by reference to Exhibit 10.8 to the Registrant’s Quarterly Report on Form 10-Q filed July 28, 2016). | |
| *10.11 | Form of CoStar Group, Inc. 2016 Plan Nonqualified Stock Option Grant Agreement between the Registrant and Andrew C. Florance (Incorporated by reference to Exhibit 10.9 to the Registrant’s Quarterly Report on Form 10-Q filed July 28, 2016). | |
| *10.12 | Form of 2007 Plan Restricted Stock Grant Agreement between the Registrant and certain of its officers, directors and employees (Incorporated by reference to Exhibit 99.1 to the Registrant’s Report on Form 8-K filed June 22, 2007). | |
| *10.13 | Form of 2007 Plan Restricted Stock Unit Agreement between the Registrant and certain of its officers and employees (Incorporated by reference to Exhibit 10.8 to the Registrant's Report on Form 10-K filed February 20, 2014). | |
| *10.14 | Form of 2007 Plan Incentive Stock Option Grant Agreement between the Registrant and certain of its officers and employees (Incorporated by reference to Exhibit 10.8 to the Registrant’s Report on Form 10-K filed February 24, 2009). | |
| *10.15 | Form of 2007 Plan Incentive Stock Option Grant Agreement between the Registrant and Andrew C. Florance (Incorporated by reference to Exhibit 10.9 to the Registrant’s Report on Form 10-K filed February 24, 2009). | |
| *10.16 | Form of 2007 Plan Nonqualified Stock Option Grant Agreement between the Registrant and certain of its officers and employees (Incorporated by reference to Exhibit 10.10 to the Registrant’s Report on Form 10-K filed February 24, 2009). | |
| *10.17 | Form of 2007 Plan Nonqualified Stock Option Grant Agreement between the Registrant and certain of its directors (Incorporated by reference to Exhibit 10.11 to the Registrant’s Report on Form 10-K filed February 24, 2009). | |
| *10.18 | Form of 2007 Plan Nonqualified Stock Option Grant Agreement between the Registrant and Andrew C. Florance (Incorporated by reference to Exhibit 10.12 to the Registrant’s Report on Form 10-K filed February 24, 2009). | |
| *10.19 | Form of 2007 Plan French Sub-Plan Restricted Stock Agreement between the Registrant and certain of its employees (Incorporated by reference to Exhibit 10.10 to the Registrant’s Report on Form 10-K filed February 29, 2008). | |
| *10.20 | CoStar Group, Inc. 2016 Cash Incentive Plan (Incorporated by reference to Exhibit 10.2 to the Registrant’s Quarterly Report on Form 10-Q filed July 28, 2016). | |
| *10.21 | CoStar Group, Inc. Amended and Restated Employee Stock Purchase Plan (Incorporated by reference to Exhibit 4.4 to the Registrant’s Registration Statement on Form S-8 filed with the Commission on September 14, 2015). | |
| *10.22 | CoStar Group, Inc. Management Stock Purchase Plan (Incorporated by reference to Exhibit 10.21 to the Registrant’s Report on Form 10-K filed February 23, 2018). | |
| *10.23 | Summary of Non-Employee Director Compensation (Incorporated by reference to Exhibit 10.1 to the Registrant's Report on Form 10-Q filed on October 24, 2013). | |
| *10.24 | Employment Agreement for Andrew C. Florance (Incorporated by reference to Exhibit 10.2 to Amendment No. 1 to the Registration Statement on Form S-1 of the Registrant (Reg. No. 333-47953) filed with the Commission on April 27, 1998). | |
| *10.25 | First Amendment to Andrew C. Florance Employment Agreement, effective January 1, 2009 (Incorporated by reference to Exhibit 10.16 to the Registrant’s Report on Form 10-K filed February 24, 2009). | |
| 10.26 | Form of Indemnification Agreement between the Registrant and each of its officers and directors (Incorporated by reference to Exhibit 10.1 to the Registrant’s Report on Form 10-Q filed on May 7, 2004). | |
| 10.27 | Deed of Office Lease by and between GLL L-Street 1331, LLC and CoStar Realty Information, Inc., dated February 18, 2011, and made effective as of June 1, 2010 (Incorporated by reference to Exhibit 10.1 to the Registrant’s Report on form 10-Q filed on April 29, 2011). | |
| 10.30 | Securities Purchase Agreement, dated as of September 30, 2019, among CoStar Group, Inc., CoStar Realty Information, Inc., CoStar Portfolio Strategy, LLC, STR, Inc., STR Global, Ltd., the seller parties thereto, and Randell Smith, in his capacity as Sellers’ Representative (Incorporated by reference to Exhibit 10.1 to the Registrant's Current Report on Form 8-K filed with the Commission on October 2, 2019). |
| Exhibit No. | Description | |
| 10.31 | Asset Purchase Agreement, dated as of the Petition Date (on or about February 12, 2020), among CSGP Holdings, LLC, CoStar Group, Inc. (solely for the specified purposes), RentPath Holdings, Inc. and the other Sellers named therein (Incorporated by reference to Exhibit 10.1 to the Registrant’s Current Report on Form 8-K filed with the Commission on February 13, 2020). | |
| 21.1 | Subsidiaries of the Registrant (filed herewith). | |
| 23.1 | Consent of Ernst & Young LLP, Independent Registered Public Accounting Firm (filed herewith). | |
| 31.1 | Certification of Principal Executive Officer pursuant to Section 302 of the Sarbanes-Oxley Act of 2002 (filed herewith). | |
| 31.2 | Certification of Principal Financial Officer pursuant to Section 302 of the Sarbanes-Oxley Act of 2002 (filed herewith). | |
| 32.1 | Certification of Principal Executive Officer pursuant to 18 U.S.C. Sec. 1350, as adopted pursuant to Section 906 of the Sarbanes-Oxley Act of 2002 (filed herewith). | |
| 32.2 | Certification of Principal Financial Officer pursuant to 18 U.S.C. Sec. 1350, as adopted pursuant to Section 906 of the Sarbanes-Oxley Act of 2002 (filed herewith). | |
| 101.INS | The following financial statements from the Company’s Annual Report on Form 10-K for the year ended December 31, 2019, formatted in Inline XBRL: (i) Consolidated Statements of Operations; (ii) Consolidated Statements of Comprehensive Income; (iii) Consolidated Balance Sheets; (iv) Consolidated Statements of Cash Flows; and (v) Notes to Consolidated Financial Statements, tagged as blocks of text and including detailed tags. | |
| 101.SCH | XBRL Taxonomy Extension Schema Document. | |
| 101.CAL | XBRL Taxonomy Extension Calculation Linkbase Document. | |
| 101.DEF | XBRL Taxonomy Extension Definition Linkbase Document. | |
| 101.LAB | XBRL Taxonomy Extension Label Linkbase Document. | |
| 101.PRE | XBRL Taxonomy Extension Presentation Linkbase Document. | |
| 104 | The cover page from the Registrant's Annual Report on Form 10-K for the year ended December 31, 2019, formatted in Inline XBRL (included as Exhibit 101). |
- Management Contract or Compensatory Plan or Arrangement.
Item 16. Form 10-K Summary
None.
SIGNATURES
Pursuant to the requirements of Section 13 or 15(d) of the Securities Exchange Act of 1934, the Registrant has duly caused this report to be signed on its behalf by the undersigned, thereunto duly authorized.
| COSTAR GROUP, INC. | ||
| By: | /s/ Andrew C. Florance | |
| February 26, 2020 | Andrew C. Florance | |
| President and Chief Executive Officer |
KNOW ALL PERSONS BY THESE PRESENTS, that each individual whose signature appears below constitutes and appoints Andrew C. Florance and Scott T. Wheeler, and each of them individually, as their true and lawful attorneys-in-fact and agents, with full power of substitution, for him and in his name, place and stead, in any and all capacities, to sign any and all amendments to this report, and to file the same, with all exhibits thereto and to all documents in connection therewith, with the Securities and Exchange Commission, granting unto said attorneys-in-fact and agents, and each of them, full power and authority to do and perform each and every act and thing requisite and necessary to be done in connection therewith, as fully to all intents and purposes as he might or could do in person, herein by ratifying and confirming all that said attorneys-in-fact and agents or any of them, or his or their substitute or substitutes, may lawfully do or cause to be done by virtue hereof.
Pursuant to the requirements of the Securities Act of 1934, as amended, this report has been signed by the following persons on behalf of the registrant and in the capacities and on the dates indicated.
| Signature | Capacity | Date | ||
| /s/ Michael R. Klein | Chairman of the Board | February 26, 2020 | ||
| Michael R. Klein | ||||
| /s/ Andrew C. Florance | Chief Executive Officer and | February 26, 2020 | ||
| Andrew C. Florance | President and a Director | |||
| (Principal Executive Officer) | ||||
| /s/ Scott T. Wheeler | Chief Financial Officer | February 26, 2020 | ||
| Scott T. Wheeler | (Principal Financial and Accounting Officer) | |||
| /s/ Michael J. Glosserman | Director | February 26, 2020 | ||
| Michael J. Glosserman | ||||
| /s/ John W. Hill | Director | February 26, 2020 | ||
| John W. Hill | ||||
| /s/ Laura Cox Kaplan | Director | February 26, 2020 | ||
| Laura Cox Kaplan | ||||
| /s/ Christopher J. Nassetta | Director | February 26, 2020 | ||
| Christopher J. Nassetta | ||||
| /s/ David J. Steinberg | Director | February 26, 2020 | ||
| David J. Steinberg | ||||
| /s/ Louise S. Sams | Director | February 26, 2020 | ||
| Louise S. Sams | ||||
| /s/ Robert W. Musslewhite | Director | February 21, 2020 | ||
| Robert W. Musslewhite |
COSTAR GROUP, INC.
INDEX TO CONSOLIDATED FINANCIAL STATEMENTS
| Reports of Independent Registered Public Accounting Firm | F-2 |
| Consolidated Statements of Operations | F-6 |
| Consolidated Statements of Comprehensive Income | F-7 |
| Consolidated Balance Sheets | F-8 |
| Consolidated Statements of Changes in Stockholders’ Equity | F-9 |
| Consolidated Statements of Cash Flows | F-10 |
| Notes to Consolidated Financial Statements | F-12 |
F-1
Report of Independent Registered Public Accounting Firm
The Board of Directors and Stockholders of CoStar Group, Inc.
Opinion on the Financial Statements
We have audited the accompanying consolidated balance sheets of CoStar Group, Inc. (the Company) as of December 31, 2019 and 2018, the related consolidated statements of operations, comprehensive income, stockholders' equity and cash flows for each of the three years in the period ended December 31, 2019, and the related notes and the financial statement schedule listed in the Index at Item 15(a)(2) (collectively referred to as the “financial statements”). In our opinion, the financial statements present fairly, in all material respects, the consolidated financial position of the Company at December 31, 2019 and 2018, and the consolidated results of its operations and its cash flows for each of the three years in the period ended December 31, 2019, in conformity with U.S. generally accepted accounting principles.
We also have audited, in accordance with the standards of the Public Company Accounting Oversight Board (United States) (PCAOB), the Company's internal control over financial reporting as of December 31, 2019, based on criteria established in Internal Control-Integrated Framework issued by the Committee of Sponsoring Organizations of the Treadway Commission (2013 framework), and our report dated February 26, 2020 expressed an unqualified opinion thereon.
Adoption of ASU No. 2014-09
As discussed in Note 2 to the consolidated financial statements, the Company changed its method for recognizing revenue in 2018 due to the adoption of Accounting Standards Update (ASU) No. 2014-09, Revenue from Contracts with Customers (Topic 606), and the related amendments.
Adoption of ASU No. 2016-02
As discussed in Note 2 to the consolidated financial statements, the Company changed its method for accounting for leases in 2019 due to the adoption of Accounting Standards Update (ASU) No. 2016-02, Leases (Topic 842), and the related amendments.
Basis for Opinion
These financial statements are the responsibility of the Company's management. Our responsibility is to express an opinion on the Company’s financial statements based on our audits. We are a public accounting firm registered with the PCAOB and are required to be independent with respect to the Company in accordance with the U.S. federal securities laws and the applicable rules and regulations of the Securities and Exchange Commission and the PCAOB.
We conducted our audits in accordance with the standards of the PCAOB. Those standards require that we plan and perform the audit to obtain reasonable assurance about whether the financial statements are free of material misstatement, whether due to error or fraud. Our audits included performing procedures to assess the risks of material misstatement of the financial statements, whether due to error or fraud, and performing procedures that respond to those risks. Such procedures included examining, on a test basis, evidence regarding the amounts and disclosures in the financial statements. Our audits also included evaluating the accounting principles used and significant estimates made by management, as well as evaluating the overall presentation of the financial statements. We believe that our audits provide a reasonable basis for our opinion.
Critical Audit Matter
The critical audit matter communicated below is a matter arising from the current period audit of the financial statements that was communicated or required to be communicated to the audit committee and that: (1) relates to accounts or disclosures that are material to the financial statements and (2) involved our especially challenging, subjective or complex judgments. The communication of the critical audit matter does not alter in any way our opinion on the consolidated financial statements, taken as a whole, and we are not, by communicating the critical audit matter below, providing a separate opinion on the critical audit matter or on the accounts or disclosures to which it relates.
F-2
Showing the first 8K of 160K characters. Open the full section