 filings.tools
CSX 10-Q 2023-06-30
Filed 2023-07-20. 8 sections, 131K characters. Original on sec.gov · Markdown · JSON
Cover and table of contents
UNITED STATES
SECURITIES AND EXCHANGE COMMISSION
WASHINGTON, D.C. 20549
FORM 10-Q
(☒) QUARTERLY REPORT PURSUANT TO SECTION 13 OR 15(d) OF THE SECURITIES EXCHANGE ACT OF 1934
For the quarterly period ended June 30, 2023
OR
(☐) TRANSITION REPORT PURSUANT TO SECTION 13 OR 15(d) OF THE SECURITIES EXCHANGE ACT OF 1934
For the transition period from __________ to __________
Commission File Number 1-8022

CSX CORPORATION
| (Exact name of registrant as specified in its charter) | ||||||||||||||||||||||||||||||||
| Virginia | 62-1051971 | |||||||||||||||||||||||||||||||
| (State or other jurisdiction of incorporation or organization) | (I.R.S. Employer Identification No.) | |||||||||||||||||||||||||||||||
| 500 Water Street | 15th Floor | Jacksonville | FL | 32202 | 904 | 359-3200 | ||||||||||||||||||||||||||
| (Address of principal executive offices) | (Zip Code) | (Telephone number, including area code) | ||||||||||||||||||||||||||||||
| No Change | ||||||||||||||||||||||||||||||||
| (Former name, former address and former fiscal year, if changed since last report.) | ||||||||||||||||||||||||||||||||
| Securities registered pursuant to Section 12(b) of the Act: | ||||||||||||||||||||||||||||||||
| Title of each class | Trading Symbol(s) | Name of exchange on which registered | ||||||||||||||||||||||||||||||
| Common Stock, $1 Par Value | CSX | Nasdaq Global Select Market |
Indicate by check mark whether the registrant (1) has filed all reports required to be filed by Section 13 or 15(d) of the Securities Exchange Act of 1934 during the preceding 12 months (or for such shorter period that the registrant was required to file such reports), and (2) has been subject to such filing requirements for the past 90 days.
Yes (X) No ( )
Indicate by check mark whether the registrant has submitted electronically every Interactive Data File required to be submitted and posted pursuant to Rule 405 of Regulation S-T (§232.405 of this chapter) during the preceding 12 months (or for such shorter period that the registrant was required to submit such files).
Yes (X) No ( )
Indicate by check mark whether the registrant is a large accelerated filer, an accelerated filer, a non-accelerated filer, a smaller reporting company, or an emerging growth company (as defined in Exchange Act Rule 12b-2).
Large Accelerated Filer (X) Accelerated Filer ( ) Non-accelerated Filer ( ) Smaller Reporting Company (☐) Emerging growth company (☐)
If an emerging growth company, indicate by check mark if the registrant has elected not to use the extended transition period for complying with any new or revised financial accounting standards provided pursuant to Section 13(a) of the Exchange Act. ( )
Indicate by a check mark whether the registrant is a shell company (as defined in Rule 12b-2 of the Exchange Act).
Yes (☐) No (X)
There were 2,006,330,057 shares of common stock outstanding on June 30, 2023 (the latest practicable date that is closest to the filing date).
CSX Q2 2023 Form 10-Q p.1
CSX CORPORATION
FORM 10-Q
FOR THE QUARTERLY PERIOD ENDED JUNE 30, 2023
INDEX
CSX Q2 2023 Form 10-Q p.2
CSX CORPORATION
PART I - FINANCIAL INFORMATION
ITEM 1. FINANCIAL STATEMENTS
CONSOLIDATED INCOME STATEMENTS (Unaudited)
(Dollars in millions, except per share amounts)
| Second Quarters | Six Months | ||||||||||||||||
| 2023 | 2022 | 2023 | 2022 | ||||||||||||||
| Revenue | $ | 3,699 | $ | 3,815 | $ | 7,405 | $ | 7,228 | |||||||||
| Expense | |||||||||||||||||
| Labor and Fringe | 741 | 684 | 1,464 | 1,376 | |||||||||||||
| Purchased Services and Other | 684 | 647 | 1,372 | 1,322 | |||||||||||||
| Depreciation and Amortization | 402 | 369 | 795 | 729 | |||||||||||||
| Fuel | 312 | 446 | 676 | 777 | |||||||||||||
| Equipment and Other Rents | 90 | 95 | 172 | 195 | |||||||||||||
| Gains on Property Dispositions | (12) | (129) | (20) | (156) | |||||||||||||
| Total Expense | 2,217 | 2,112 | 4,459 | 4,243 | |||||||||||||
| Operating Income | 1,482 | 1,703 | 2,946 | 2,985 | |||||||||||||
| Interest Expense | (201) | (171) | (402) | (350) | |||||||||||||
| Other Income - Net | 31 | 26 | 72 | 52 | |||||||||||||
| Earnings Before Income Taxes | 1,312 | 1,558 | 2,616 | 2,687 | |||||||||||||
| Income Tax Expense | (316) | (380) | (633) | (650) | |||||||||||||
| Net Earnings | $ | 996 | $ | 1,178 | $ | 1,983 | $ | 2,037 | |||||||||
| Per Common Share (Note 2) | |||||||||||||||||
| Net Earnings Per Share, Basic | $ | 0.49 | $ | 0.55 | $ | 0.97 | $ | 0.94 | |||||||||
| Net Earnings Per Share, Assuming Dilution | $ | 0.49 | $ | 0.54 | $ | 0.97 | $ | 0.94 | |||||||||
| Average Shares Outstanding (In millions) | 2,020 | 2,158 | 2,037 | 2,173 | |||||||||||||
| Average Shares Outstanding, Assuming Dilution (In millions) | 2,025 | 2,163 | 2,042 | 2,178 |
CONDENSED CONSOLIDATED COMPREHENSIVE INCOME STATEMENTS (Unaudited)
(Dollars in millions)
| Second Quarters | Six Months | ||||||||||||||||
| 2023 | 2022 | 2023 | 2022 | ||||||||||||||
| Total Comprehensive Earnings (Note 10) | $ | 992 | $ | 1,217 | $ | 1,981 | $ | 2,107 |
See accompanying notes to consolidated financial statements.
CSX Q2 2023 Form 10-Q p.3
CSX CORPORATION
ITEM 1. FINANCIAL STATEMENTS
CONSOLIDATED BALANCE SHEETS
(Dollars in millions)
| (Unaudited) | ||||||||
| June 30, 2023 | December 31, 2022 | |||||||
| ASSETS | ||||||||
| Current Assets: | ||||||||
| Cash and Cash Equivalents | $ | 956 | $ | 1,958 | ||||
| Short-term Investments | 78 | 129 | ||||||
| Accounts Receivable - Net (Note 8) | 1,327 | 1,313 | ||||||
| Materials and Supplies | 427 | 341 | ||||||
| Other Current Assets | 123 | 108 | ||||||
| Total Current Assets | 2,911 | 3,849 | ||||||
| Properties | 48,970 | 48,105 | ||||||
| Accumulated Depreciation | (14,493) | (13,863) | ||||||
| Properties - Net | 34,477 | 34,242 | ||||||
| Investment in Affiliates and Other Companies | 2,338 | 2,292 | ||||||
| Right-of-Use Lease Asset | 495 | 505 | ||||||
| Goodwill and Other Intangible Assets - Net | 511 | 502 | ||||||
| Other Long-term Assets | 485 | 522 | ||||||
| Total Assets | $ | 41,217 | $ | 41,912 | ||||
| LIABILITIES AND SHAREHOLDERS' EQUITY | ||||||||
| Current Liabilities: | ||||||||
| Accounts Payable | $ | 1,120 | $ | 1,130 | ||||
| Labor and Fringe Benefits Payable | 444 | 707 | ||||||
| Casualty, Environmental and Other Reserves (Note 4) | 138 | 144 | ||||||
| Current Maturities of Long-term Debt (Note 7) | 10 | 151 | ||||||
| Income and Other Taxes Payable | 136 | 111 | ||||||
| Other Current Liabilities | 207 | 228 | ||||||
| Total Current Liabilities | 2,055 | 2,471 | ||||||
| Casualty, Environmental and Other Reserves (Note 4) | 299 | 292 | ||||||
| Long-term Debt (Note 7) | 17,898 | 17,896 | ||||||
| Deferred Income Taxes - Net | 7,662 | 7,569 | ||||||
| Long-term Lease Liability | 485 | 488 | ||||||
| Other Long-term Liabilities | 544 | 571 | ||||||
| Total Liabilities | 28,943 | 29,287 | ||||||
| Shareholders' Equity: | ||||||||
| Common Stock, $1 Par Value | 2,006 | 2,066 | ||||||
| Other Capital | 624 | 574 | ||||||
| Retained Earnings | 10,030 | 10,363 | ||||||
| Accumulated Other Comprehensive Loss (Note 10) | (390) | (388) | ||||||
| Non-controlling Minority Interest | 4 | 10 | ||||||
| Total Shareholders' Equity | 12,274 | 12,625 | ||||||
| Total Liabilities and Shareholders' Equity | $ | 41,217 | $ | 41,912 |
See accompanying notes to consolidated financial statements.
CSX Q2 2023 Form 10-Q p.4
CSX CORPORATION
ITEM 1. FINANCIAL STATEMENTS
CONSOLIDATED CASH FLOW STATEMENTS (Unaudited)
(Dollars in millions)
| Six Months | ||||||||
| 2023 | 2022 | |||||||
| OPERATING ACTIVITIES | ||||||||
| Net Earnings | $ | 1,983 | $ | 2,037 | ||||
| Adjustments to Reconcile Net Earnings to Net Cash Provided by Operating Activities: | ||||||||
| Depreciation and Amortization | 795 | 729 | ||||||
| Deferred Income Taxes | 78 | 106 | ||||||
| Gains on Property Dispositions | (20) | (156) | ||||||
| Other Operating Activities | 23 | (14) | ||||||
| Changes in Operating Assets and Liabilities: | ||||||||
| Accounts Receivable | 8 | (198) | ||||||
| Other Current Assets | (105) | (71) | ||||||
| Accounts Payable | (20) | 61 | ||||||
| Income and Other Taxes Payable | 33 | 43 | ||||||
| Other Current Liabilities | (292) | (7) | ||||||
| Net Cash Provided by Operating Activities | 2,483 | 2,530 | ||||||
| INVESTING ACTIVITIES | ||||||||
| Property Additions | (1,015) | (811) | ||||||
| Purchases of Short-term Investments | (102) | (19) | ||||||
| Proceeds from Sales of Short-term Investments | 153 | 9 | ||||||
| Proceeds and Advances from Property Dispositions | 35 | 29 | ||||||
| Business Acquisition, Net of Cash Acquired | (31) | (208) | ||||||
| Other Investing Activities | (20) | (19) | ||||||
| Net Cash Used In Investing Activities | (980) | (1,019) | ||||||
| FINANCING ACTIVITIES | ||||||||
| Long-term Debt Repaid (Note 7) | (146) | (93) | ||||||
| Dividends Paid | (448) | (433) | ||||||
| Shares Repurchased | (1,930) | (2,515) | ||||||
| Other Financing Activities | 19 | 15 | ||||||
| Net Cash Used in Financing Activities | (2,505) | (3,026) | ||||||
| Net Decrease in Cash and Cash Equivalents | (1,002) | (1,515) | ||||||
| CASH AND CASH EQUIVALENTS | ||||||||
| Cash and Cash Equivalents at Beginning of Period | 1,958 | 2,239 | ||||||
| Cash and Cash Equivalents at End of Period | $ | 956 | $ | 724 | ||||
| SUPPLEMENTAL CASH FLOW INFORMATION | ||||||||
| Issuance of Common Stock as Consideration for Acquisition | $ | — | $ | 422 |
See accompanying notes to consolidated financial statements.
CSX Q2 2023 Form 10-Q p.5
CSX CORPORATION
ITEM 1. FINANCIAL STATEMENTS
CONSOLIDATED STATEMENTS OF CHANGES
IN SHAREHOLDERS' EQUITY (Unaudited)
(Dollars in millions)
| Six Months 2023 | Common Shares Outstanding (Thousands) | Common Stock and Other Capital | Retained Earnings | Accumulated Other Comprehensive Income (Loss)****(a) | Non-controlling Minority Interest | Total Shareholders' Equity | ||||||||||||||
| Balance December 31, 2022 | 2,066,367 | $ | 2,640 | $ | 10,363 | $ | (388) | $ | 10 | $ | 12,625 | |||||||||
| Comprehensive Earnings: | ||||||||||||||||||||
| Net Earnings | — | — | 987 | — | — | 987 | ||||||||||||||
| Other Comprehensive Income | — | — | — | 2 | — | 2 | ||||||||||||||
| Total Comprehensive Earnings | 989 | |||||||||||||||||||
| Common stock dividends, $0.11 per share | — | — | (226) | — | — | (226) | ||||||||||||||
| Share Repurchases | (35,157) | (35) | (1,032) | — | — | (1,067) | ||||||||||||||
| Stock Option Exercises and Other | 1,865 | 15 | — | — | (2) | 13 | ||||||||||||||
| Balance March 31, 2023 | 2,033,075 | $ | 2,620 | $ | 10,092 | $ | (386) | $ | 8 | $ | 12,334 | |||||||||
| Comprehensive Earnings: | ||||||||||||||||||||
| Net Earnings | — | — | 996 | — | — | 996 | ||||||||||||||
| Other Comprehensive Income | — | — | — | (4) | — | (4) | ||||||||||||||
| Total Comprehensive Earnings | 992 | |||||||||||||||||||
| Common stock dividends, $0.11 per share | — | — | (222) | — | — | (222) | ||||||||||||||
| Share Repurchases | (27,434) | (28) | (835) | — | — | (863) | ||||||||||||||
| Stock Option Exercises and Other | 712 | 38 | (1) | — | (4) | 33 | ||||||||||||||
| Balance June 30, 2023 | 2,006,353 | $ | 2,630 | $ | 10,030 | $ | (390) | $ | 4 | $ | 12,274 | |||||||||
(a) Accumulated Other Comprehensive Loss balances shown above are net of tax. The associated taxes were $121 million and $107 million as of first and second quarters 2023, respectively. For additional information, see Note 10, Other Comprehensive Income.
See accompanying notes to consolidated financial statements.
CSX Q2 2023 Form 10-Q p.6
CSX CORPORATION
Item 1. FINANCIAL STATEMENTS
CONSOLIDATED STATEMENTS OF CHANGES
IN SHAREHOLDERS' EQUITY (Unaudited)
(Dollars in millions)
| Six Months 2022 | Common Shares Outstanding (Thousands) | Common Stock and Other Capital | Retained Earnings | Accumulated Other Comprehensive Income (Loss)****(a) | Non-controlling Minority Interest | Total Shareholders' Equity | |||||||||||||||||||||||
| Balance December 31, 2021 | 2,201,787 | $ | 2,268 | $ | 11,630 | $ | (408) | $ | 10 | 13,500 | |||||||||||||||||||
| Comprehensive Earnings: | |||||||||||||||||||||||||||||
| Net Earnings | — | — | 859 | — | — | 859 | |||||||||||||||||||||||
| Other Comprehensive Income | — | — | — | 31 | — | 31 | |||||||||||||||||||||||
| Total Comprehensive Earnings | 890 | ||||||||||||||||||||||||||||
| Common stock dividends, $0.10 per share | — | — | (218) | — | — | (218) | |||||||||||||||||||||||
| Share Repurchases | (29,365) | (29) | (987) | — | — | (1,016) | |||||||||||||||||||||||
| Stock Option Exercises and Other | 1,831 | 38 | — | — | 1 | 39 | |||||||||||||||||||||||
| Balance March 31, 2022 | 2,174,253 | $ | 2,277 | $ | 11,284 | $ | (377) | $ | 11 | $ | 13,195 | ||||||||||||||||||
| Comprehensive Earnings: | |||||||||||||||||||||||||||||
| Net Earnings | — | — | 1,178 | — | — | 1,178 | |||||||||||||||||||||||
| Other Comprehensive Income | — | — | — | 39 | — | 39 | |||||||||||||||||||||||
| Total Comprehensive Earnings | 1,217 | ||||||||||||||||||||||||||||
| Common stock dividends, $0.10 per share | — | — | (215) | — | — | (215) | |||||||||||||||||||||||
| Share Repurchases | (46,508) | (47) | (1,452) | — | — | (1,499) | |||||||||||||||||||||||
| Issuance of common stock for acquisition of Pan Am Systems, Inc. | 13,173 | 422 | — | — | — | 422 | |||||||||||||||||||||||
| Stock Option Exercises and Other | 314 | 23 | (1) | — | (1) | 21 | |||||||||||||||||||||||
| Balance June 30, 2022 | 2,141,232 | $ | 2,675 | $ | 10,794 | $ | (338) | $ | 10 | $ | 13,141 | ||||||||||||||||||
(a) Accumulated Other Comprehensive Loss balances shown above are net of tax. The associated taxes were $99 million and $88 million as of first and second quarters 2022, respectively. For additional information, see Note 10, Other Comprehensive Income.
See accompanying notes to consolidated financial statements.
CSX Q2 2023 Form 10-Q p.7
CSX CORPORATION
NOTES TO CONSOLIDATED FINANCIAL STATEMENTS
(Unaudited)
NOTE 1. Nature of Operations and Significant Accounting Policies
Background
CSX Corporation together with its subsidiaries ("CSX" or the “Company”), based in Jacksonville, Florida, is one of the nation's leading transportation companies. The Company provides rail-based transportation services including traditional rail service, the transport of intermodal containers and trailers, as well as other transportation services such as rail-to-truck transfers and bulk commodity operations.
CSX's principal operating subsidiary, CSX Transportation, Inc. (“CSXT”), provides an important link to the transportation supply chain through its approximately 20,000 route mile rail network and serves major population centers in 26 states east of the Mississippi River, the District of Columbia and the Canadian provinces of Ontario and Quebec. The Company's intermodal business links customers to railroads via trucks and terminals. On June 1, 2022, CSX completed its acquisition of Pan Am Systems, Inc. (“Pan Am”), which is the parent company of Pan Am Railways, Inc. This acquisition expanded CSXT’s reach in the Northeastern United States. CSXT is also responsible for the Company's real estate sales, leasing, acquisition and management and development activities, substantially all of which are focused on supporting railroad operations.
Other entities
In addition to CSXT, the Company’s subsidiaries include Quality Carriers, Inc. ("Quality Carriers"), CSX Intermodal Terminals, Inc. (“CSX Intermodal Terminals”), Total Distribution Services, Inc. (“TDSI”), Transflo Terminal Services, Inc. (“Transflo”), CSX Technology, Inc. (“CSX Technology”) and other subsidiaries. Quality Carriers is the largest provider of bulk liquid chemicals truck transportation in North America. CSX Intermodal Terminals owns and operates a system of intermodal terminals, predominantly in the eastern United States and also performs drayage services (the pickup and delivery of intermodal shipments) for certain customers. TDSI serves the automotive industry with distribution centers and storage locations. Transflo connects non-rail served customers to the many benefits of rail by transferring products from rail to trucks. The biggest Transflo markets are chemicals and agriculture, which includes shipments of plastics and ethanol. CSX Technology and other subsidiaries provide support services for the Company.
Sale of Property Rights to the Commonwealth of Virginia
On March 26, 2021, the Company entered into a comprehensive agreement to sell certain property rights in three CSX-owned line segments to the Commonwealth of Virginia (“Commonwealth”) over three phases. The timing and amount of gains recognized were based on the allocation of fair value to each conveyance, the timing of conveyances and collectability. Over the course of this transaction, which was completed in 2022, total proceeds of $525 million were collected and total gains of $493 million were recognized. A gain of $20 million was recognized in first quarter 2022 related to the closing of the second phase. During second quarter 2022, the final $
Showing the first 8K of 61K characters. Open the full section
Item 2. MANAGEMENT'S DISCUSSION AND ANALYSIS OF FINANCIAL CONDITION AND RESULTS OF OPERATIONS
| Volume and Revenue (Unaudited) | |||||||||||||||||||||||||||||||||||||||||||||||||||||
| Volume (Thousands of units); Revenue (Dollars in Millions); Revenue Per Unit (Dollars) | |||||||||||||||||||||||||||||||||||||||||||||||||||||
| Second Quarters | |||||||||||||||||||||||||||||||||||||||||||||||||||||
| Volume | Revenue | Revenue Per Unit | |||||||||||||||||||||||||||||||||||||||||||||||||||
| 2023 | 2022 | % Change | 2023 | 2022 | % Change | 2023 | 2022 | % Change | |||||||||||||||||||||||||||||||||||||||||||||
| Chemicals | 160 | 165 | (3) | % | $ | 642 | $ | 666 | (4) | % | $ | 4,013 | $ | 4,036 | (1) | % | |||||||||||||||||||||||||||||||||||||
| Agricultural and Food Products | 118 | 120 | (2) | 415 | 412 | 1 | 3,517 | 3,433 | 2 | ||||||||||||||||||||||||||||||||||||||||||||
| Automotive | 103 | 85 | 21 | 323 | 268 | 21 | 3,136 | 3,153 | (1) | ||||||||||||||||||||||||||||||||||||||||||||
| Minerals | 95 | 90 | 6 | 191 | 170 | 12 | 2,011 | 1,889 | 6 | ||||||||||||||||||||||||||||||||||||||||||||
| Metals and Equipment | 74 | 69 | 7 | 240 | 216 | 11 | 3,243 | 3,130 | 4 | ||||||||||||||||||||||||||||||||||||||||||||
| Forest Products | 72 | 74 | (3) | 257 | 251 | 2 | 3,569 | 3,392 | 5 | ||||||||||||||||||||||||||||||||||||||||||||
| Fertilizers | 55 | 54 | 2 | 128 | 118 | 8 | 2,327 | 2,185 | 6 | ||||||||||||||||||||||||||||||||||||||||||||
| Total Merchandise | 677 | 657 | 3 | 2,196 | 2,101 | 5 | 3,244 | 3,198 | 1 | ||||||||||||||||||||||||||||||||||||||||||||
| Intermodal | 684 | 759 | (10) | 492 | 602 | (18) | 719 | 793 | (9) | ||||||||||||||||||||||||||||||||||||||||||||
| Coal | 185 | 178 | 4 | 637 | 651 | (2) | 3,443 | 3,657 | (6) | ||||||||||||||||||||||||||||||||||||||||||||
| Trucking | — | — | — | 227 | 259 | (12) | — | — | — | ||||||||||||||||||||||||||||||||||||||||||||
| Other | — | — | — | 147 | 202 | (27) | — | — | — | ||||||||||||||||||||||||||||||||||||||||||||
| Total | 1,546 | 1,594 | (3) | % | $ | 3,699 | $ | 3,815 | (3) | % | $ | 2,393 | $ | 2,393 | — | % | |||||||||||||||||||||||||||||||||||||
| Six Months | |||||||||||||||||||||||||||||||||||||||||||||||||||||
| Volume | Revenue | Revenue Per Unit | |||||||||||||||||||||||||||||||||||||||||||||||||||
| 2023 | 2022 | % Change | 2023 | 2022 | % Change | 2023 | 2022 | % Change | |||||||||||||||||||||||||||||||||||||||||||||
| Chemicals | 320 | 326 | (2) | % | $ | 1,292 | $ | 1,284 | 1 | % | $ | 4,038 | $ | 3,939 | 3 | % | |||||||||||||||||||||||||||||||||||||
| Agricultural and Food Products | 240 | 238 | 1 | 852 | 799 | 7 | 3,550 | 3,357 | 6 | ||||||||||||||||||||||||||||||||||||||||||||
| Automotive | 189 | 163 | 16 | 597 | 495 | 21 | 3,159 | 3,037 | 4 | ||||||||||||||||||||||||||||||||||||||||||||
| Minerals | 178 | 162 | 10 | 364 | 314 | 16 | 2,045 | 1,938 | 6 | ||||||||||||||||||||||||||||||||||||||||||||
| Metals and Equipment | 147 | 135 | 9 | 479 | 413 | 16 | 3,259 | 3,059 | 7 | ||||||||||||||||||||||||||||||||||||||||||||
| Forest Products | 145 | 144 | 1 | 518 | 479 | 8 | 3,572 | 3,326 | 7 | ||||||||||||||||||||||||||||||||||||||||||||
| Fertilizers | 105 | 110 | (5) | 257 | 238 | 8 | 2,448 | 2,164 | 13 | ||||||||||||||||||||||||||||||||||||||||||||
| Total Merchandise | 1,324 | 1,278 | 4 | 4,359 | 4,022 | 8 | 3,292 | 3,147 | 5 | ||||||||||||||||||||||||||||||||||||||||||||
| Intermodal | 1,338 | 1,481 | (10) | 991 | 1,129 | (12) | 741 | 762 | (3) | ||||||||||||||||||||||||||||||||||||||||||||
| Coal | 370 | 333 | 11 | 1,270 | 1,184 | 7 | 3,432 | 3,556 | (3) | ||||||||||||||||||||||||||||||||||||||||||||
| Trucking | — | — | — | 460 | 489 | (6) | — | — | — | ||||||||||||||||||||||||||||||||||||||||||||
| Other | — | — | — | 325 | 404 | (20) | — | — | — | ||||||||||||||||||||||||||||||||||||||||||||
| Total | 3,032 | 3,092 | (2) | % | $ | 7,405 | $ | 7,228 | 2 | % | $ | 2,442 | $ | 2,338 | 4 | % |
CSX Q2 2023 Form 10-Q p.25
CSX CORPORATION
ITEM 2. MANAGEMENT'S DISCUSSION AND ANALYSIS OF FINANCIAL CONDITION AND RESULTS OF OPERATIONS
Second Quarter 2023
Revenue
Total revenue decreased 3% in second quarter 2023 when compared to second quarter 2022 primarily due to lower fuel recovery, decreases in other revenue, pricing declines in export coal due to the impact of lower benchmark rates, and lower intermodal volume. These decreases were partially offset by pricing and volume gains in merchandise as well as higher coal volumes.
Merchandise Volume
Chemicals - Decreased primarily due to lower shipments of materials used in making plastics, partially offset by higher shipments of waste.
Agricultural and Food Products - Decreased due to lower shipments of export grain, partially offset by higher shipments of feed grain for the domestic market.
Automotive - Increased due to higher North American vehicle production as well as new business wins.
Minerals - Increased due to higher shipments of aggregates and cement driven by increased road construction and other infrastructure-related activities.
Metals and Equipment - Increased due to higher scrap and steel shipments, as well as stronger equipment shipments.
Forest Products - Decreased primarily due to lower shipments of pulpboard, partially offset by higher shipments of building products.
Fertilizers - Increased due to higher shipments of potash and nitrogen, partially offset by declines in short-haul phosphate shipments.
Intermodal Volume
Lower volume was primarily due to decreased international shipments driven by high inventory levels and lower imports. Domestic shipments also decreased primarily due to the impacts of a softening truck market.
Coal Volume
Export coal increased due to higher shipments of metallurgical and thermal coal. Domestic coal decreased due to lower shipments of coal to northern utility plants.
Trucking Revenue
Trucking revenue decreased $32 million versus the prior year due to lower fuel and capacity surcharges.
Other Revenue
Other revenue was $55 million lower, primarily resulting from lower intermodal storage and equipment usage, partially offset by adjustments to revenue reserves.
CSX Q2 2023 Form 10-Q p.26
CSX CORPORATION
ITEM 2. MANAGEMENT'S DISCUSSION AND ANALYSIS OF FINANCIAL CONDITION AND RESULTS OF OPERATIONS
Expenses
Expenses of $2.2 billion increased $105 million, or 5%, in second quarter 2023 when compared to the second quarter 2022.
Labor and Fringe expense increased $57 million due to the following:
-
An increase of $44 million was driven by inflation.
-
Other costs increased $13 million, as the impact of increased headcount in 2023 was partially offset by prior year Pan Am acquisition-related costs of $7 million.
Purchased Services and Other expense increased $37 million due to the following:
-
Operating support costs increased $53 million primarily as a result of higher repair and maintenance costs as well as inflation. These increases were partially offset by lower intermodal expenses.
-
Other costs decreased $16 million due to several non-significant items, including the impact of prior year Pan Am acquisition-related costs of $11 million.
Depreciation and Amortization expense increased $33 million primarily as the result of a 2022 equipment depreciation study as well as a larger asset base.
Fuel costs decreased $134 million primarily resulting from a 32% decrease in locomotive fuel prices, partially offset by higher fuel consumption.
Equipment and Other Rents expense decreased $5 million driven by lower net car hire costs, as savings from improved days per load were partially offset by higher volume from automotive and other merchandise markets.
Gains on Property Dispositions decreased to $12 million from $129 million in the prior year. Second quarter 2022 included a gain of $122 million related to the sale of property rights to the Commonwealth of Virginia under a multi-phase agreement.
Interest Expense
Interest expense increased $30 million primarily due to higher average debt balances and higher interest rates.
Other Income - Net
Other income - net increased $5 million primarily due to higher interest income, partially offset by a decrease in net pension benefit credits.
Income Tax Expense
Income tax expense decreased $64 million mostly due to lower earnings before income taxes.
CSX Q2 2023 Form 10-Q p.27
CSX CORPORATION
ITEM 2. MANAGEMENT'S DISCUSSION AND ANALYSIS OF FINANCIAL CONDITION AND RESULTS OF OPERATIONS
Six Months Results of Operations
Revenue increased $177 million primarily due to volume and pricing gains in merchandise as well as higher coal volumes, partially offset by lower intermodal volumes, pricing declines in export coal and decreases in other revenue.
Total expense increased $216 million primarily due to lower gains on property dispositions, increased inflation and higher operating support costs, partially offset by lower fuel prices.
Interest expense increased $52 million primarily as a result of higher average debt balances and higher effective interest rates.
Other income - net increased $20 million largely due to higher interest income, partially offset by a decrease in net pension benefit credits.
Income tax expense decreased $17 million primarily due to lower earnings before income taxes.
CSX Q2 2023 Form 10-Q p.28
CSX CORPORATION
ITEM 2. MANAGEMENT'S DISCUSSION AND ANALYSIS OF FINANCIAL CONDITION AND RESULTS OF OPERATIONS
Non-GAAP Measures - Unaudited
CSX reports its financial results in accordance with accounting principles generally accepted in the United States of America (U.S. GAAP). CSX also uses certain non-GAAP measures that fall within the meaning of Securities and Exchange Commission Regulation G and Regulation S-K Item 10(e), which may provide users of the financial information with additional meaningful comparison to prior reported results. Non-GAAP measures do not have standardized definitions and are not defined by U.S. GAAP. Therefore, CSX’s non-GAAP measures are unlikely to be comparable to similar measures presented by other companies. The presentation of these non-GAAP measures should not be considered in isolation from, as a substitute for, or as superior to the financial information presented in accordance with GAAP. Reconciliations of non-GAAP measures to corresponding GAAP measures are below.
Free Cash Flow
Management believes that free cash flow is supplemental information useful to investors as it is important in evaluating the Company’s financial performance. More specifically, free cash flow measures cash generated by the business after reinvestment. This measure represents cash available for both equity and bond investors to be used for dividends, share repurchases or principal reduction on outstanding debt. Free cash flow is calculated by using net cash from operations and adjusting for property additions and proceeds and advances from property dispositions. Free cash flow should be considered in addition to, rather than a substitute for, cash provided by operating activities. The decrease in free cash flow before dividends from the prior year of $245 million is due to higher property additions and less cash from operating activities.
The following table reconciles cash provided by operating activities (GAAP measure) to free cash flow, before dividends (non-GAAP measure).
| Six Months | ||||||||
| (Dollars in millions) | 2023 | 2022 | ||||||
| Net cash provided by operating activities (a) | $ | 2,483 | $ | 2,530 | ||||
| Property Additions | (1,015) | (811) | ||||||
| Proceeds and Advances from Property Dispositions | 35 | 29 | ||||||
| Free Cash Flow (before payment of dividends) | $ | 1,503 | $ | 1,748 |
(a) Net Cash Provided by Operating Activities for six months ended June 30, 2023, includes the impact of $238 million in payments of retroactive wages and bonuses related to finalized labor agreements.
Operating Statistics (Estimated)
The Company is committed to continuous improvement in safety and service performance through training, innovation and investment. Training and safety programs are designed to prevent incidents that can adversely impact employees, customers and communities. Technological innovations that can detect and avoid many types of human factor incidents are designed to serve as an additional layer of protection for the Company's employees. Continued capital investment in the Company's assets, including track, bridges, signals, equipment and detection technology also supports safety performance.
In second quarter 2023, velocity increased by 16% and dwell improved by 21% versus prior year. Carload trip plan performance increased to 84% compared to 59% in the prior year while intermodal trip plan performance increased to 96% compared to 90% in the prior year.
CSX Q2 2023 Form 10-Q p.29
CSX CORPORATION
ITEM 2. MANAGEMENT'S DISCUSSION AND ANALYSIS OF FINANCIAL CONDITION AND RESULTS OF OPERATIONS
The FRA train accident rate of 3.25 in second quarter 2023 decreased by 16% compared to prior year. The personal injury frequency index of 0.81 decreased 24% compared to prior year. Safety is a guiding principle at CSX, and the Company remains focused on instilling safety culture, especially in new hires. CSX is committed to reducing risk and enhancing the overall safety of its employees, customers and communities in which the Company operates.
| Second Quarters | Six Months | ||||||||||||||||||||||
| 2023 | 2022 | Improvement/ (Deterioration) | 2023 | 2022 | Improvement/ (Deterioration) | ||||||||||||||||||
| Operations Performance (a) | |||||||||||||||||||||||
| Train Velocity (Miles per hour) | 17.7 | 15.3 | 16 | % | 18.1 | 15.6 | 16 | % | |||||||||||||||
| Dwell (Hours) | 9.3 | 11.8 | 21 | % | 9.2 | 11.5 | 20 | % | |||||||||||||||
| Cars Online | 126,984 | 140,967 | 10 | % | 126,640 | 139,724 | 9 | % | |||||||||||||||
| On-Time Originations | 78 | % | 62 | % | 26 | % | 81 | % | 63 | % | 29 | % | |||||||||||
| On-Time Arrivals | 71 | % | 50 | % | 42 | % | 74 | % | 53 | % | 40 | % | |||||||||||
| Carload Trip Plan Performance | 84 | % | 59 | % | 42 | % | 85 | % | 61 | % | 39 | % | |||||||||||
| Intermodal Trip Plan Performance | 96 | % | 90 | % | 7 | % | 96 | % | 88 | % | 9 | % | |||||||||||
| Fuel Efficiency | 1.00 | 0.97 | (3) | % | 1.01 | 0.99 | (2) | % | |||||||||||||||
| Revenue Ton-Miles (Billions) | |||||||||||||||||||||||
| Merchandise | 32.3 | 32.1 | 1 | % | 64.6 | 63.3 | 2 | % | |||||||||||||||
| Coal | 9.2 | 8.4 | 10 | % | 18.4 | 16.0 | 15 | % | |||||||||||||||
| Intermodal | 7.0 | 7.7 | (9) | % | 13.9 | 15.3 | (9) | % | |||||||||||||||
| Total Revenue Ton-Miles | 48.5 | 48.2 | 1 | % | 96.9 | 94.6 | 2 | % | |||||||||||||||
| Total Gross Ton-Miles (Billions) | 95.7 | 95.0 | 1 | % | 190.1 | 186.4 | 2 | % | |||||||||||||||
| Safety (b) | |||||||||||||||||||||||
| FRA Personal Injury Frequency Index | 0.81 | 1.07 | 24 | % | 0.94 | 0.94 | — | % | |||||||||||||||
| FRA Train Accident Rate | 3.25 | 3.87 | 16 | % | 3.48 | 3.34 | (4) | % |
(a) Beginning second quarter 2023, all operations performance metrics include results from the network acquired from Pan Am. The impact of including Pan Am data was insignificant.
(b) Safety metrics do not include results from the network acquired from Pan Am. These metrics will be updated to include the Pan Am network results as integration completes.
Certain operating statistics are estimated and can continue to be updated as actuals settle. The methodology for calculating train velocity, dwell, cars online and trip plan performance differs from that used by the Surface Transportation Board. The Company will continue to report these metrics to the Surface Transportation Board using the prescribed methodology.
Key Performance Measures Definitions
Train Velocity - Average train speed between origin and destination in miles per hour (does not include locals, yard jobs, work trains or passenger trains). Train velocity measures actual train miles and times of a train movement on CSX's network.
Dwell - Average amount of time in hours between car arrival to and departure from the yard.
Cars Online - Average number of active freight rail cars on lines operated by CSX, excluding rail cars that are being repaired, in storage, those that have been sold, or private cars dwelling at a customer location more than one day.
On-Time Originations - Percent of scheduled road trains that depart the origin yard on-time or ahead of schedule.
On-Time Arrivals - Percent of scheduled road trains that arrive at the destination yard on-time to within two hours of scheduled arrival.
Carload Trip Plan Performance - Percent of measured cars destined for a customer that arrive at or ahead of the original estimated time of arrival, notification or interchange (as applicable).
Intermodal Trip Plan Performance - Percent of measured containers destined for a customer that arrive at or ahead of the original estimated time of arrival, notification or interchange (as applicable).
Fuel Efficiency - Gallons of locomotive fuel per 1,000 gross ton-miles.
Revenue Ton-Miles (RTM's) - The movement of one revenue-producing ton of freight over a distance of one mile.
Gross Ton-Miles (GTM's) - The movement of one ton of train weight over one mile. GTM's are calculated by multiplying total train weight by distance the train moved. Total train weight is comprised of the weight of the freight cars and their contents.
FRA Personal Injury Frequency Index - Number of FRA-reportable injuries per 200,000 man-hours.
FRA Train Accident Rate - Number of FRA-reportable train accidents per million train-miles.
CSX Q2 2023 Form 10-Q p.30
CSX CORPORATION
ITEM 2. MANAGEMENT'S DISCUSSION AND ANALYSIS OF FINANCIAL CONDITION AND RESULTS OF OPERATIONS
LIQUIDITY AND CAPITAL RESOURCES
The following are material changes in the significant cash flows, sources of cash and liquidity, capital investments, consolidated balance sheets and working capital, which provide an update to the discussion included in CSX's most recent annual report on Form 10-K.
Material Changes in Significant Cash Flows
Significant Cash Flows
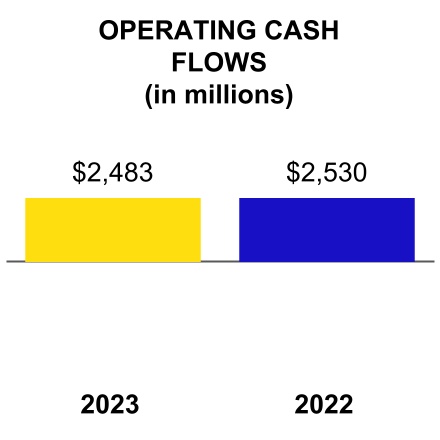
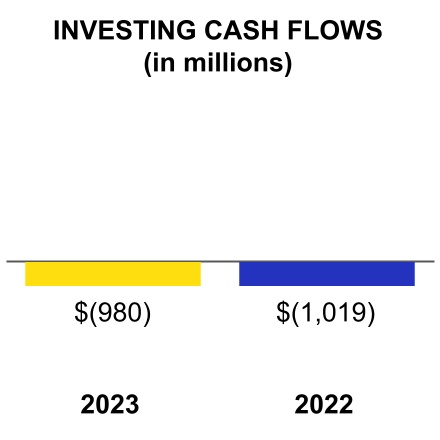
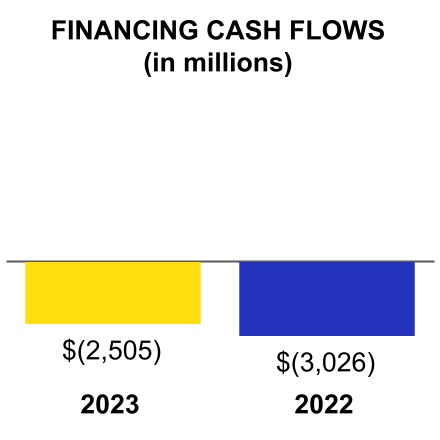
The following chart highlights the operating, investing and financing components of the net decreases of $1.0 billion and $1.5 billion in cash and cash equivalents for six months ended June 30, 2023 and June 30, 2022, respectively.
-
The Company generated $47 million less cash from operating activities primarily driven by unfavorable working capital activities, including the payments of $238 million for retroactive wages and bonuses related to finalized labor agreements. This decrease was partially offset by higher cash-generating income.
-
CSX used $39 million less cash for investing activities primarily as a result of decreased acquisition spending and higher net sales of short-term investments, partially offset by higher property additions.
-
The Company used $521 million less cash for financing activities, driven by lower share repurchases.
Sources of Cash and Liquidity and Uses of Cash
As of the end of second quarter 2023, CSX had $956 million of cash and cash equivalents. CSX uses current cash balances for general corporate purposes, which may include capital expenditures, working capital requirements, reduction or refinancing of outstanding indebtedness, redemptions and repurchases of CSX common stock, dividends to shareholders, acquisitions and other business opportunities, and contributions to the Company's qualified pension plan. See Note 7, Debt and Credit Agreements.
The Company has multiple sources of liquidity, including cash generated from operations and financing sources. The Company filed a shelf registration statement with the SEC on February 16, 2022, which may be used to issue debt or equity securities at CSX’s discretion, subject to market conditions and CSX Board authorization. While CSX seeks to give itself flexibility with respect to cash requirements, there can be no assurance that market conditions would permit CSX to sell such securities on acceptable terms at any given time, or at all. During the six months ended June 30, 2023, CSX did not issue any long-term debt.
CSX Q2 2023 Form 10-Q p.31
CSX CORPORATION
ITEM 2. MANAGEMENT'S DISCUSSION AND ANALYSIS OF FINANCIAL CONDITION AND RESULTS OF OPERATIONS
CSX has a $1.2 billion unsecured, revolving credit facility backed by a diverse syndicate of banks that expires in February 2028. At June 30, 2023, the Company had no outstanding balances under this facility. The Company also has a commercial paper program, backed by the revolving credit facility, under which the Company may issue unsecured commercial paper notes up to a maximum aggregate principal amount of $1.0 billion outstanding at any one time. At June 30, 2023, the Company had no outstanding debt under the commercial paper program.
Planned capital investments for 2023 are expected to be approximately $2.3 billion. Of the 2023 investment, approximately 75% is expected to be used to sustain the core infrastructure and operating equipment. The remaining amounts will be used to promote profitable growth, including projects supporting service enhancements and productivity. CSX intends to fund capital investments primarily through cash generated from operations.
Material Changes in the Consolidated Balance Sheets and Working Capital
Consolidated Balance Sheets
Total assets decreased $695 million from year end primarily due to the $1.0 billion decrease in cash as noted above. This decrease was partially offset by a $235 million increase in net property consistent with planned capital expenditures.
Total liabilities decreased $344 million from year end primarily due to a $263 million decrease in labor and fringe benefits payable and a $141 million decrease in current debt driven by the maturity of secured equipment notes in first quarter 2023. The decrease in labor and fringe benefits payable was driven by payouts of accrued retroactive wages and bonuses as well as incentive compensation. Total shareholders' equity decreased $351 million from year end primarily driven by share repurchases of $1.9 billion and dividends paid of $448 million, partially offset by net earnings of $2.0 billion.
Working capital is considered a measure of a company's ability to meet its short-term needs. CSX had a working capital surplus of $856 million as of June 30, 2023, and $1.4 billion as of December 31, 2022. This decrease of $522 million since year end is primarily due to cash paid for share repurchases of $1.9 billion and property additions of $1.0 billion, partially offset by cash earned from operations. The Company's working capital balance varies due to factors such as the timing of scheduled debt payments and changes in cash and cash equivalent balances as discussed above. The Company continues to maintain adequate liquidity to satisfy current liabilities and maturing obligations when they come due. CSX has sufficient financial capacity, including its revolving credit facility, commercial paper program and shelf registration statement to manage its day-to-day cash requirements and any anticipated obligations. The Company from time to time accesses the credit markets for additional liquidity.
CSX is committed to returning cash to shareholders and maintaining an investment-grade credit profile. Capital structure, capital investments and cash distributions, including dividends and share repurchases, are reviewed at least annually by the Board of Directors. Management's assessment of market conditions and other factors guides the timing and volume of repurchases. Future share repurchases are expected to be funded by cash on hand, cash generated from operations and debt issuances.
CSX Q2 2023 Form 10-Q p.32
CSX CORPORATION
ITEM 2. MANAGEMENT'S DISCUSSION AND ANALYSIS OF FINANCIAL CONDITION AND RESULTS OF OPERATIONS
Completed Transactions
Acquisition of Pan Am Systems, Inc.
On June 1, 2022, CSX acquired Pan Am for a purchase price of $600 million. The results of Pan Am's operations and its cash flows were consolidated prospectively.
Sale of Property Rights to the Commonwealth of Virginia
On March 26, 2021, the Company entered into a comprehensive agreement to sell certain property rights in three CSX-owned line segments to the Commonwealth of Virginia (“Commonwealth”) over three phases. Over the course of this transaction, which was completed in 2022, total proceeds of $525 million were collected and total gains of $493 million were recognized. A gain of $20 million was recognized in first quarter 2022 related to the closing of the second phase. During second quarter 2022, the final $125 million of proceeds was approved by the Commonwealth, which resulted in a $122 million gain related to property rights previously conveyed. These proceeds were collected during fourth quarter 2022 upon closing of the third phase.
Guaranteed Notes Issued By CSXT
In 2007, CSXT, a wholly-owned subsidiary of CSX Corporation, issued in a registered public offering $381 million of equipment notes, which were fully and unconditionally guaranteed by CSX Corporation. These notes matured on January 15, 2023.
LABOR AGREEMENTS
Approximately 17,400 of the Company's approximately 22,700 employees are members of a rail labor union. As of December 2, 2022, all 12 rail unions at CSX that participated in national bargaining were covered by national agreements with the Class I railroads and CSX-specific agreements that will remain in effect through December 31, 2024.
CSX Q2 2023 Form 10-Q p.33
CSX CORPORATION
ITEM 2. MANAGEMENT'S DISCUSSION AND ANALYSIS OF FINANCIAL CONDITION AND RESULTS OF OPERATIONS
CRITICAL ACCOUNTING ESTIMATES
The preparation of financial statements in conformity with accounting principles generally accepted in the United States requires that management make estimates in reporting the amounts of certain assets and liabilities, the disclosure of contingent assets and liabilities at the date of the financial statements and certain revenues and expenses during the reporting period. Actual results may differ from those estimates. These estimates and assumptions are discussed with the Audit Committee of the Board of Directors on a regular basis. Consistent with the prior year, significant estimates using management judgment are made for the areas below. For further discussion of CSX's critical accounting estimates, see the Company's most recent annual report on Form 10-K.
-
personal injury and environmental reserves;
-
pension plan accounting;
-
depreciation policies for assets under the group-life method; and
-
goodwill and other intangible assets.
FORWARD-LOOKING STATEMENTS
Certain statements in this report and in other materials filed with the Securities and Exchange Commission, as well as information included in oral statements or other written statements made by the Company, are forward-looking statements. The Company intends for all such forward-looking statements to be covered by the safe harbor provisions for forward-looking statements within the meaning of the Private Securities Litigation Reform Act of 1995 and the provisions of Section 27A of the Securities Act of 1933 and Section 21E of the Securities Exchange Act of 1934. These forward-looking statements within the meaning of the Private Securities Litigation Reform Act may contain, among others, statements regarding:
-
projections and estimates of earnings, revenues, margins, volumes, rates, cost-savings, expenses, taxes or other financial items;
-
expectations as to results of operations and operational initiatives;
-
expectations as to the effect of claims, lawsuits, environmental costs, commitments, contingent liabilities, labor negotiations or agreements on the Company's financial condition, results of operations or liquidity;
-
management's plans, strategies and objectives for future operations, capital expenditures, workforce levels, dividends, share repurchases, safety and service performance, proposed new services and other matters that are not historical facts, and management's expectations as to future performance and operations and the time by which objectives will be achieved; and
-
future economic, industry or market conditions or performance and their effect on the Company's financial condition, results of operations or liquidity.
Forward-looking statements are typically identified by words or phrases such as "will," "should," “believe,” “expect,” “anticipate,” “project,” “estimate,” “preliminary” and similar expressions. The Company cautions against placing undue reliance on forward-looking statements, which reflect its good faith beliefs with respect to future events and are based on information currently available to it as of the date the forward-looking statement is made. Forward-looking statements should not be read as a guarantee of future performance or results and will not necessarily be accurate indications of the timing when, or by which, such performance or results will be achieved.
CSX Q2 2023 Form 10-Q p.34
CSX CORPORATION
ITEM 2. MANAGEMENT'S DISCUSSION AND ANALYSIS OF FINANCIAL CONDITION AND RESULTS OF OPERATIONS
Forward-looking statements are subject to a number of risks and uncertainties and actual performance or results could differ materially from those anticipated by any forward-looking statements. The Company undertakes no obligation to update or revise any forward-looking statement. If the Company does update any forward-looking statement, no inference should be drawn that the Company will make additional updates with respect to that statement or any other forward-looking statements. The following important factors, in addition to those discussed in Part I, Item 1A Risk Factors of CSX's most recent annual report on Form 10-K and elsewhere in this report, may cause actual results to differ materially from those contemplated by any forward-looking statements:
-
legislative, regulatory or legal developments involving transportation, including rail or intermodal transportation, the environment, hazardous materials, taxation, international trade and initiatives to further regulate the rail industry;
-
the outcome of litigation, claims and other contingent liabilities, including, but not limited to, those related to fuel surcharge, environmental matters, taxes, shipper and rate claims subject to adjudication, personal injuries and occupational illnesses;
-
changes in domestic or international economic, political or business conditions, including those affecting the transportation industry (such as the impact of industry competition, conditions, performance and consolidation) and the level of demand for products carried by CSXT;
-
natural events such as severe weather conditions, including floods, fire, hurricanes and earthquakes, a pandemic crisis affecting the health of the Company's employees, its shippers or the consumers of goods, or other unforeseen disruptions of the Company's operations, systems, property, equipment or supply chain;
-
competition from other modes of freight transportation, such as trucking and competition and consolidation or financial distress within the transportation industry generally;
-
the cost of compliance with laws and regulations that differ from expectations as well as costs, penalties and operational and liquidity impacts associated with noncompliance with applicable laws or regulations;
-
the impact of increased passenger activities in capacity-constrained areas, including potential effects of high speed rail initiatives, or regulatory changes affecting when CSXT can transport freight or service routes;
-
unanticipated conditions in the financial markets that may affect timely access to capital markets and the cost of capital, as well as management's decisions regarding share repurchases;
-
changes in fuel prices, surcharges for fuel and the availability of fuel;
-
the impact of natural gas prices on coal-fired electricity generation;
-
the impact of global supply and price of seaborne coal on CSXT's export coal market;
-
availability of insurance coverage at commercially reasonable rates or insufficient insurance coverage to cover claims or damages;
-
the inherent business risks associated with safety and security, including the transportation of hazardous materials or a cybersecurity attack which would threaten the availability and vulnerability of information technology;
-
adverse economic or operational effects from actual or threatened war or terrorist activities and any governmental response;
-
loss of key personnel or the inability to hire and retain qualified employees;
-
labor and benefit costs and labor difficulties, including stoppages affecting either the Company's operations or customers' ability to deliver goods to the Company for shipment;
CSX Q2 2023 Form 10-Q p.35
CSX CORPORATION
ITEM 2. MANAGEMENT'S DISCUSSION AND ANALYSIS OF FINANCIAL CONDITION AND RESULTS OF OPERATIONS
-
the Company's success in implementing its strategic, financial and operational initiatives, including acquisitions;
-
the impact of conditions in the real estate market on the Company's ability to sell assets;
-
changes in operating conditions and costs, including the impacts of inflation, or commodity concentrations;
-
the impacts of a public health crisis and any policies or initiatives instituted in response; and
-
the inherent uncertainty associated with projecting economic and business conditions.
Other important assumptions and factors that could cause actual results to differ materially from those in the forward-looking statements are specified elsewhere in this report and in CSX's other SEC reports, which are accessible on the SEC's website at www.sec.gov and the Company's website at www.csx.com. The information on the CSX website is not part of this quarterly report on Form 10-Q.
CSX Q2 2023 Form 10-Q p.36
CSX CORPORATION
ITEM 3. QUANTITATIVE AND QUALITATIVE DISCLOSURES ABOUT MARKET RISK
Item 3. QUANTITATIVE AND QUALITATIVE DISCLOSURES ABOUT MARKET RISK
There have been no material changes in market risk from the information provided under Part II, Item 7A (Quantitative and Qualitative Disclosures about Market Risk) of CSX's most recent annual report on Form 10-K, except as provided below.
Changes in interest rates may impact the cost of future long-term debt issued by the Company, and as a result, represent interest rate risk to the Company. In an effort to manage this risk, CSX may use certain financial instruments such as interest rate forward contracts. The following information together with information included in Note 7, Debt and Credit Agreements, describes changes to those contracts since CSX's most recent annual report on Form 10-K and the related market risk to CSX.
In second quarter 2023, CSX settled a portion of its forward starting interest rate swaps equal to $113 million notional value and received a cash payment of $44 million. The gain associated with the settled portion of these cash flow hedges will continue to be classified in AOCI until the associated debt instrument is issued in the future. As of June 30, 2023, these cash flow hedges had an aggregate notional value of $227 million and an asset value of $86 million.
Changes in interest rates could impact the fair value of the Company's forward starting interest rate swaps. As of June 30, 2023, the potential change in fair value resulting from a hypothetical 10% change in interest rates would not be material.
Item 4. CONTROLS AND PROCEDURES
As of June 30, 2023, under the supervision and with the participation of CSX's Chief Executive Officer (“CEO”) and Chief Financial Officer (“CFO”), management has evaluated the effectiveness of the design and operation of the Company's disclosure controls and procedures. Based on that evaluation, the CEO and CFO concluded that, as of June 30, 2023, the Company's disclosure controls and procedures were effective at the reasonable assurance level in timely alerting them to material information required to be included in CSX's periodic SEC reports. There were no changes in the Company's internal controls over financial reporting during the second quarter of 2023 that have materially affected or are reasonably likely to materially affect the Company's internal control over financial reporting.
CSX Q2 2023 Form 10-Q p.37
CSX CORPORATION
PART II - OTHER INFORMATION
Item 1. Legal Proceedings
Item 103 of SEC Regulation S-K requires disclosure of certain environmental matters when a governmental authority is a party to the proceedings and such proceedings involve potential monetary sanctions that the Company reasonably believes will exceed a specified threshold. Pursuant to SEC amendments to this Item, the Company will be using a threshold of $1 million for such proceedings. For further details, refer to Note 5, Commitments and Contingencies, of this quarterly report on Form 10-Q. Also refer to Part I, Item 3, Legal Proceedings in CSX's most recent annual report on Form 10-K.
Item 1A. Risk Factors
For information regarding factors that could affect the Company's results of operations, financial condition and liquidity, see the risk factors discussed under Part I, Item 1A (Risk Factors) of CSX's most recent annual report on Form 10-K. See also Part I, Item 2 (Forward-Looking Statements) of this quarterly report on Form 10-Q.
Item 2. CSX Purchases of Equity Securities
The Company continues to repurchase shares under the $5 billion program announced in July 2022. Total repurchase authority remaining as of June 30, 2023 was $1.3 billion. For more information about share repurchases, see Note 2, Earnings Per Share. Share repurchase activity for the second quarter 2023 was as follows:
| CSX Purchases of Equity Securities for the Quarter | ||||||||||||||
| Second Quarter | Total Number of Shares Purchased | Average Price Paid per Share | Total Number of Shares Purchased as Part of Publicly Announced Plans or Programs | Approximate Dollar Value of Shares that May Yet Be Purchased Under the Plans or Programs | ||||||||||
| Beginning Balance | $ | 2,204,587,299 | ||||||||||||
| April 1 - April 30, 2023 | 6,309,910 | $ | 30.10 | 6,309,910 | 2,014,674,156 | |||||||||
| May 1 - May 31, 2023 | 10,730,613 | 31.43 | 10,730,613 | 1,677,387,037 | ||||||||||
| June 1 - June 30, 2023 | 10,393,389 | 32.30 | 10,393,389 | 1,341,649,845 | ||||||||||
| Ending Balance | 27,433,912 | $ | 31.46 | 27,433,912 | $ | 1,341,649,845 |
Item 3. Defaults Upon Senior Securities
None
Item 4. Mine Safety Disclosures
Not Applicable
Item 5. Other Information
During the second quarter of 2023, none of the Company's directors or officers adopted or terminated any "Rule 10b5-1 trading arrangement" or any "non-Rule 10b5-1 trading arrangement," as each term is defined in Item 408 of Regulation S-K.
CSX Q2 2023 Form 10-Q p.38
CSX CORPORATION
PART II
Item 6. Exhibits
| Exhibit designation | Nature of exhibit | Previously filed as exhibit to | ||||||
| Officer certifications: | ||||||||
| 31* | Rule 13a-14(a) Certifications | |||||||
| 32* | Section 1350 Certifications | |||||||
| Interactive data files: | ||||||||
| 101* | The following financial information from CSX Corporation's Quarterly Report on Form 10-Q for the quarter ended June 30, 2023 filed with the SEC on July 20, 2023, formatted in inline XBRL includes: (i) consolidated income statements for the quarters ended June 30, 2023, and June 30, 2022, (ii) condensed consolidated comprehensive income statements for the quarters ended June 30, 2023, and June 30, 2022, (iii) consolidated balance sheets at June 30, 2023, and December 31, 2022, (iv) consolidated cash flow statements for the six months ended June 30, 2023, and June 30, 2022, (v) consolidated statement of changes in shareholders' equity for the quarters ended June 30, 2023, and June 30, 2022, and (vi) the notes to consolidated financial statements. | |||||||
| 104 | Cover Page Interactive Data File (embedded within the Inline XBRL document contained in Exhibit 101) | |||||||
| * Filed herewith | ||||||||
CSX Q2 2023 Form 10-Q p.39
CSX CORPORATION
PART II
SIGNATURE
Pursuant to the requirements of the Securities Exchange Act of 1934, the registrant has duly caused this report to be signed on its behalf by the undersigned thereunto duly authorized.
CSX CORPORATION
(Registrant)
By: /s/ ANGELA C. WILLIAMS
Angela C. Williams
Vice President and
Chief Accounting Officer
(Principal Accounting Officer)
Dated: July 20, 2023
CSX Q2 2023 Form 10-Q p.40