 filings.tools
Item 5. Market for Registrant's Common Equity,
4K characters. Original on sec.gov · Markdown
Item 5. Market for Registrant's Common Equity,
Related Stockholder Matters and Issuer Purchases of Equity Securities
Market Information
Cintas' common stock is traded on the NASDAQ Global Select Market under the symbol "CTAS." The following table shows the high and low sales prices of shares of Cintas' common stock by quarter during the last two fiscal years:
| Fiscal 2012 | |||||||
| Quarter Ended | High | Low | |||||
| May 2012 | $ | 40.61 | $ | 36.40 | |||
| February 2012 | 39.34 | 29.31 | |||||
| November 2011 | 32.48 | 26.39 | |||||
| August 2011 | 34.54 | 26.59 | |||||
| Fiscal 2011 | |||||||
| Quarter Ended | High | Low | |||||
| May 2011 | $ | 32.90 | $ | 27.22 | |||
| February 2011 | 30.19 | 27.18 | |||||
| November 2010 | 28.47 | 25.70 | |||||
| August 2010 | 27.26 | 23.50 |
At May 31, 2012, there were approximately 2,000 shareholders on record of Cintas' common stock. Cintas believes that this represents approximately 30,000 beneficial owners.
Dividends
Dividends on Cintas' outstanding common stock have been paid annually and amounted to $0.54 per share, $0.49 per share and $0.48 per share in fiscal 2012, 2011 and 2010, respectively.
Stock Performance Graph
The following graph summarizes the cumulative return on $100 invested in Cintas' common stock, the S&P 500 Stock Index and the common stocks of a selected peer group of companies. Because our products and services are diverse, Cintas does not believe that any single published industry index is appropriate for comparing shareholder return. Therefore, the peer group used in the performance graph combines four publicly traded companies in the business services industry that have similar characteristics as Cintas, such as route-based delivery of products and services. The companies included in the peer group are G & K Services, Inc., UniFirst Corporation, ABM Industries and Ecolab, Inc.
Total shareholder return was based on the increase in the price of the common stock and assumed reinvestment of all dividends. Further, total return was weighted according to market capitalization of each company. The companies in the peer group are not the same as those considered by the Compensation Committee of the Board of Directors.
Total Shareholder Returns
Comparison of Five-Year Cumulative Total Return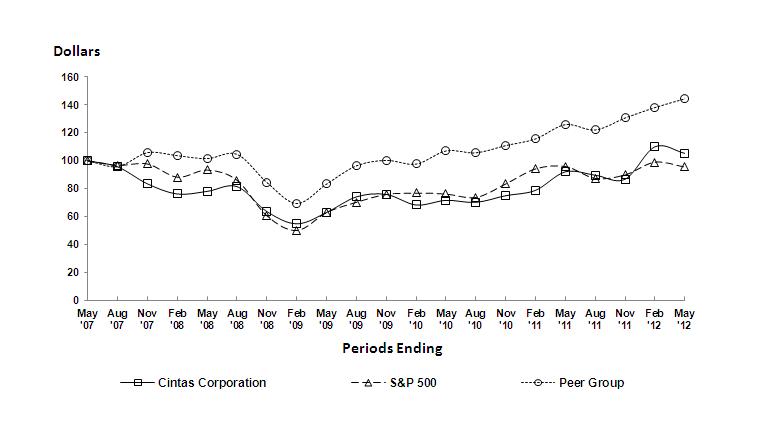
Purchases of Equity Securities by the Issuer and Affiliated Purchases
| Period | Total number of shares purchased | Average price paid per share | Total number of shares purchased as part of the publicly announced plan (1) | Maximum approximate dollar value of shares that may yet be purchased under the plan (1) | |||||||||
| March 1 - 31, 2012 | — | $ | — | — | $ | 500,000,000 | |||||||
| April 1 - 30, 2012 | 1,299,469 | 39.18 | 1,299,469 | 449,089,096 | |||||||||
| May 1 - 31, 2012 (2) | 2,016,386 | 39.05 | 2,015,373 | 370,391,845 | |||||||||
| Total | 3,315,855 | $ | 39.10 | 3,314,842 | $ | 370,391,845 |
(1) On October 18, 2011, Cintas announced that the Board of Directors authorized a $500.0 million share buyback program at market prices. Beginning in April 2012, under the October 18, 2011 program, through May 31, 2012, Cintas has purchased a total of approximately 3.3 million shares of Cintas stock at an average price of $39.10 per share for a total purchase price of $129.6 million.
(2) During May 2012, Cintas purchased 1,013 shares of Cintas common stock in trade for employee payroll taxes due on restricted stock options that vested during the fiscal year. These shares were purchased at an average price of $37.61 per share for a total purchase price of less than $0.1 million.
Previous: Item 4. Mine Safety Disclosures · Next: Item 6. Selected Financial Data