 filings.tools
Item 5. Market for Registrant’s Common Equity, Related Stockholder Matters and Issuer Purchases of Equity Securities
6K characters. Original on sec.gov · Markdown
Item 5. Market for Registrant’s Common Equity, Related Stockholder Matters and Issuer Purchases of Equity Securities
Our Class A common stock trades on the Nasdaq Stock Market under the symbol “CTSH”. As of December 31, 2021, the approximate number of holders of record of our Class A common stock was 111 and the approximate number of beneficial holders of our Class A common stock was 451,800.
Cash Dividends
During 2021, we paid quarterly cash dividends of $0.24 per share, or $0.96 per share in total for the year. In January 2022, our Board of Directors approved a cash dividend of $0.27 per share with a record date of February 18, 2022 and a payment date of March 1, 2022. We intend to continue to pay quarterly cash dividends in accordance with our capital allocation framework. However, future dividend payments depend on a variety of factors, including our cash flow generated from operations, cash and investment balances, net income, overall liquidity position, potential alternative uses of cash, such as acquisitions, and anticipated future economic conditions and financial results.
Issuer Purchases of Equity Securities
Our stock repurchase program, allows for the repurchase of up to $9.5 billion, excluding fees and expenses, of our Class A common stock through open market purchases, including under a 10b5-1 Plan or in private transactions, including through ASR agreements entered into with financial institutions, in accordance with applicable federal securities laws. The repurchase program does not have an expiration date. The timing of repurchases and the exact number of shares to be purchased are determined by management, in its discretion, or pursuant to 10b5-1 Plan, and will depend upon market conditions and other factors.
During the three months ended December 31, 2021, we repurchased $66 million of our Class A common stock under our stock repurchase program. The following table sets out the stock repurchase activity under our stock repurchase program during the fourth quarter of 2021 and the approximate dollar value of shares that may yet be purchased under the program as of December 31, 2021.
| Month | Total Number of Shares Purchased | Average Price Paid per Share | Total Number of Shares Purchased as Part of Publicly Announced Plans or Programs | Approximate Dollar Value of Shares that May Yet Be Purchased under the Plans or Programs (in millions) | ||||||||||||||||||||||
| October 1, 2021 - October 31, 2021 | — | $ | — | — | $ | 2,185 | ||||||||||||||||||||
| November 1, 2021 - November 30, 2021 | 179,882 | 79.56 | 179,882 | 2,171 | ||||||||||||||||||||||
| December 1, 2021 - December 31, 2021 | 619,075 | 82.91 | 619,075 | 2,119 | ||||||||||||||||||||||
| Total | 798,957 | $ | 82.16 | 798,957 |
We regularly purchase shares in connection with our stock-based compensation plans as shares of our Class A common stock are tendered by employees for payment of applicable statutory tax withholdings. For the three months ended December 31, 2021, we purchased 0.3 shares at an aggregate cost of $20 million in connection with employee tax withholding obligations.
| Cognizant | 20 | December 31, 2021 Form 10-K |
Performance Graph
The following graph compares the cumulative total stockholder return on our Class A common stock with the cumulative total return on the S&P 500 Index and the S&P 500 Information Technology Index for the period beginning December 31, 2016 and ending on the last day of our last completed fiscal year. The stock performance shown on the graph below is not indicative of future price performance.
COMPARISON OF CUMULATIVE TOTAL RETURN**(1)(2)**
Among Cognizant, the S&P 500 Index and the S&P 500 Information Technology Index
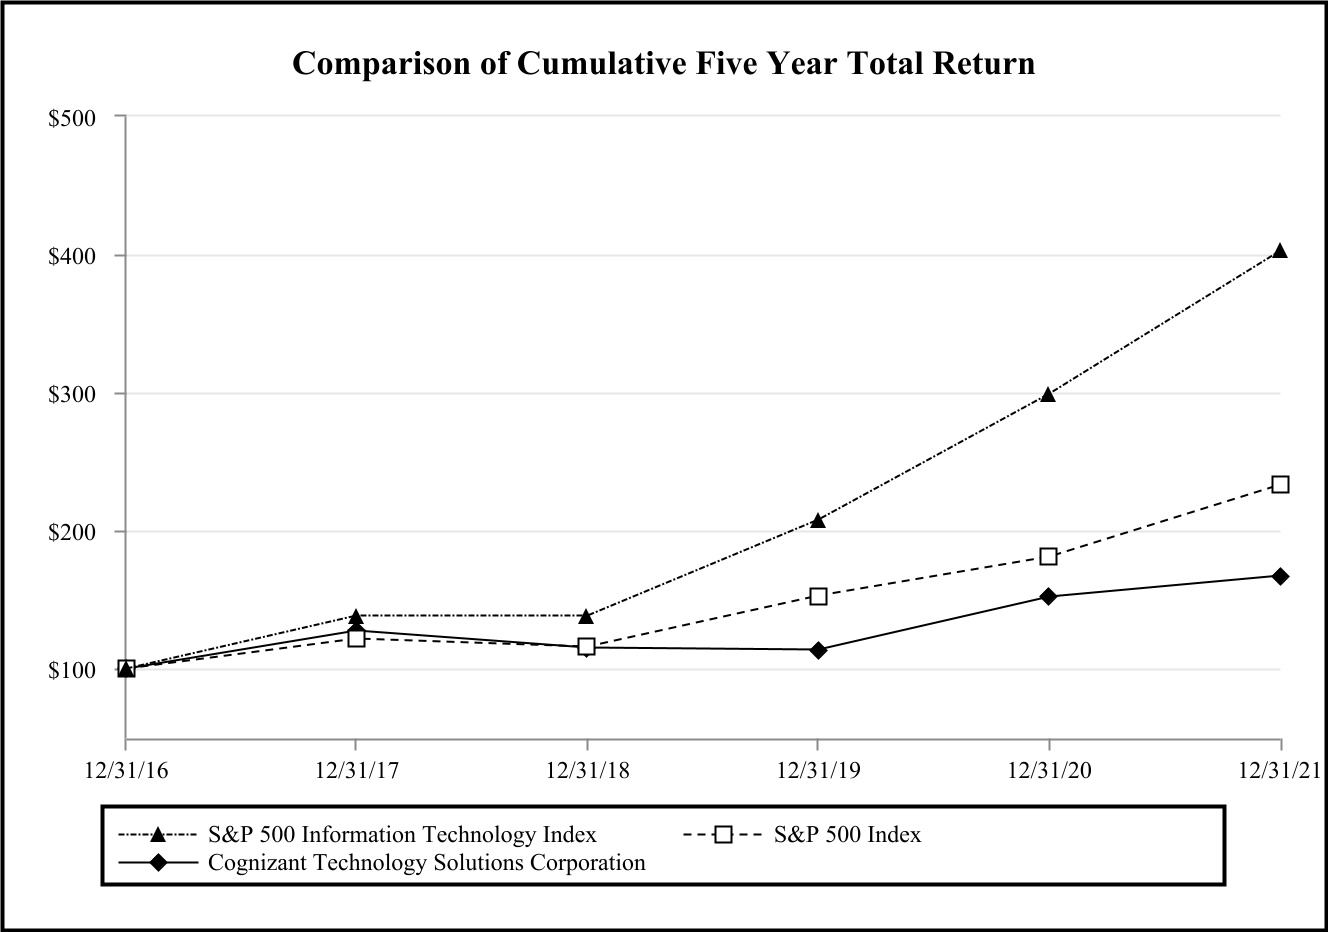
| Company / Index | Base Period 12/31/16 | 12/31/17 | 12/31/18 | 12/31/19 | 12/31/20 | 12/31/21 | ||||||||||||||||||||||||||||||||
| Cognizant Technology Solutions Corp | $ | 100 | $ | 127.57 | $ | 115.25 | $ | 114.01 | $ | 152.69 | $ | 167.41 | ||||||||||||||||||||||||||
| S&P 500 Index | 100 | 121.83 | 116.49 | 153.17 | 181.35 | 233.41 | ||||||||||||||||||||||||||||||||
| S&P 500 Information Technology Index | 100 | 138.83 | 138.43 | 208.05 | 299.37 | 402.73 |
(1)Graph assumes $100 invested on December 31, 2016 in our Class A common stock, the S&P 500 Index and the S&P 500 Information Technology Index.
(2)Cumulative total return assumes reinvestment of dividends.
Previous: Item 4. Mine Safety Disclosures · Next: Item 6. [Reserved]