 filings.tools
Item 1. Consolidated Financial Statements (Unaudited).
222K characters. Original on sec.gov · Markdown
Item 1. Consolidated Financial Statements (Unaudited).
COGNIZANT TECHNOLOGY SOLUTIONS CORPORATION
CONSOLIDATED STATEMENTS OF FINANCIAL POSITION
(Unaudited)
| (in millions, except par values) | June 30, 2022 | December 31, 2021 | |||||||||
| Assets | |||||||||||
| Current assets: | |||||||||||
| Cash and cash equivalents | $ | 1,768 | $ | 1,792 | |||||||
| Short-term investments | 552 | 927 | |||||||||
| Trade accounts receivable, net | 3,785 | 3,557 | |||||||||
| Other current assets | 918 | 1,066 | |||||||||
| Total current assets | 7,023 | 7,342 | |||||||||
| Property and equipment, net | 1,121 | 1,171 | |||||||||
| Operating lease assets, net | 907 | 933 | |||||||||
| Goodwill | 5,517 | 5,620 | |||||||||
| Intangible assets, net | 1,101 | 1,218 | |||||||||
| Deferred income tax assets, net | 473 | 404 | |||||||||
| Long-term investments | 443 | 463 | |||||||||
| Other noncurrent assets | 673 | 701 | |||||||||
| Total assets | $ | 17,258 | $ | 17,852 | |||||||
| Liabilities and Stockholders’ Equity | |||||||||||
| Current liabilities: | |||||||||||
| Accounts payable | $ | 357 | $ | 361 | |||||||
| Deferred revenue | 408 | 403 | |||||||||
| Short-term debt | 38 | 38 | |||||||||
| Operating lease liabilities | 178 | 195 | |||||||||
| Accrued expenses and other current liabilities | 2,172 | 2,532 | |||||||||
| Total current liabilities | 3,153 | 3,529 | |||||||||
| Deferred revenue, noncurrent | 24 | 40 | |||||||||
| Operating lease liabilities, noncurrent | 747 | 783 | |||||||||
| Deferred income tax liabilities, net | 207 | 218 | |||||||||
| Long-term debt | 608 | 626 | |||||||||
| Long-term income taxes payable | 283 | 378 | |||||||||
| Other noncurrent liabilities | 286 | 287 | |||||||||
| Total liabilities | 5,308 | 5,861 | |||||||||
| Commitments and contingencies (See Note 10) | |||||||||||
| Stockholders’ equity: | |||||||||||
| Preferred stock, $0.10 par value, 15 shares authorized, none issued | — | — | |||||||||
| Class A common stock, $0.01 par value, 1,000 shares authorized, 518 and 525 shares issued and outstanding as of June 30, 2022 and December 31, 2021, respectively | 5 | 5 | |||||||||
| Additional paid-in capital | 21 | 27 | |||||||||
| Retained earnings | 12,193 | 11,922 | |||||||||
| Accumulated other comprehensive income (loss) | (269) | 37 | |||||||||
| Total stockholders’ equity | 11,950 | 11,991 | |||||||||
| Total liabilities and stockholders’ equity | $ | 17,258 | $ | 17,852 |
The accompanying notes are an integral part of the unaudited consolidated financial statements.
| Cognizant Technology Solutions | 2 | June 30, 2022 Form 10-Q |
COGNIZANT TECHNOLOGY SOLUTIONS CORPORATION
CONSOLIDATED STATEMENTS OF OPERATIONS
(Unaudited)
| (in millions, except per share data) | Three Months Ended June 30, | Six Months Ended June 30, | |||||||||||||||||||||
| 2022 | 2021 | 2022 | 2021 | ||||||||||||||||||||
| Revenues | $ | 4,906 | $ | 4,585 | $ | 9,732 | $ | 8,986 | |||||||||||||||
| Operating expenses: | |||||||||||||||||||||||
| Cost of revenues (exclusive of depreciation and amortization expense shown separately below) | 3,119 | 2,863 | 6,216 | 5,627 | |||||||||||||||||||
| Selling, general and administrative expenses | 883 | 881 | 1,745 | 1,708 | |||||||||||||||||||
| Depreciation and amortization expense | 144 | 145 | 287 | 286 | |||||||||||||||||||
| Income from operations | 760 | 696 | 1,484 | 1,365 | |||||||||||||||||||
| Other income (expense), net: | |||||||||||||||||||||||
| Interest income | 9 | 7 | 15 | 16 | |||||||||||||||||||
| Interest expense | (3) | (2) | (5) | (4) | |||||||||||||||||||
| Foreign currency exchange gains (losses), net | (4) | (7) | (4) | (16) | |||||||||||||||||||
| Other, net | (1) | — | — | (2) | |||||||||||||||||||
| Total other income (expense), net | 1 | (2) | 6 | (6) | |||||||||||||||||||
| Income before provision for income taxes | 761 | 694 | 1,490 | 1,359 | |||||||||||||||||||
| Provision for income taxes | (184) | (184) | (354) | (344) | |||||||||||||||||||
| Income (loss) from equity method investments | — | 2 | 4 | 2 | |||||||||||||||||||
| Net income | $ | 577 | $ | 512 | $ | 1,140 | $ | 1,017 | |||||||||||||||
| Basic earnings per share | $ | 1.11 | $ | 0.97 | $ | 2.18 | $ | 1.93 | |||||||||||||||
| Diluted earnings per share | $ | 1.11 | $ | 0.97 | $ | 2.18 | $ | 1.92 | |||||||||||||||
| Weighted average number of common shares outstanding - Basic | 520 | 527 | 522 | 528 | |||||||||||||||||||
| Dilutive effect of shares issuable under stock-based compensation plans | 1 | 1 | 1 | 1 | |||||||||||||||||||
| Weighted average number of common shares outstanding - Diluted | 521 | 528 | 523 | 529 |
The accompanying notes are an integral part of the unaudited consolidated financial statements.
| Cognizant Technology Solutions | 3 | June 30, 2022 Form 10-Q |
COGNIZANT TECHNOLOGY SOLUTIONS CORPORATION
CONSOLIDATED STATEMENTS OF COMPREHENSIVE INCOME
(Unaudited)
| (in millions) | Three Months Ended June 30, | Six Months Ended June 30, | |||||||||||||||||||||
| 2022 | 2021 | 2022 | 2021 | ||||||||||||||||||||
| Net income | $ | 577 | $ | 512 | $ | 1,140 | $ | 1,017 | |||||||||||||||
| Change in Accumulated other comprehensive income (loss), net of tax: | |||||||||||||||||||||||
| Foreign currency translation adjustments | (193) | 14 | (230) | (11) | |||||||||||||||||||
| Unrealized gains and losses on cash flow hedges | (57) | (13) | (76) | (17) | |||||||||||||||||||
| Other comprehensive income (loss) | (250) | 1 | (306) | (28) | |||||||||||||||||||
| Comprehensive income | $ | 327 | $ | 513 | $ | 834 | $ | 989 |
The accompanying notes are an integral part of the unaudited consolidated financial statements.
| Cognizant Technology Solutions | 4 | June 30, 2022 Form 10-Q |
COGNIZANT TECHNOLOGY SOLUTIONS CORPORATION
CONSOLIDATED STATEMENTS OF STOCKHOLDERS’ EQUITY
(Unaudited)
| (in millions) | Class A Common Stock | Additional Paid-in Capital | Retained Earnings | Accumulated Other Comprehensive Income (Loss) | Total | |||||||||||||||||||||||||||||||||
| Shares | Amount | |||||||||||||||||||||||||||||||||||||
| Balance, December 31, 2021 | 525 | $ | 5 | $ | 27 | $ | 11,922 | $ | 37 | $ | 11,991 | |||||||||||||||||||||||||||
| Net income | — | — | — | 563 | — | 563 | ||||||||||||||||||||||||||||||||
| Other comprehensive income (loss) | — | — | — | — | (56) | (56) | ||||||||||||||||||||||||||||||||
| Common stock issued, stock-based compensation plans | 1 | — | 31 | — | — | 31 | ||||||||||||||||||||||||||||||||
| Stock-based compensation expense | — | — | 56 | — | — | 56 | ||||||||||||||||||||||||||||||||
| Repurchases of common stock | (5) | — | (83) | (387) | — | (470) | ||||||||||||||||||||||||||||||||
| Dividends declared, $0.27 per share | — | — | — | (142) | — | (142) | ||||||||||||||||||||||||||||||||
| Balance, March 31, 2022 | 521 | 5 | 31 | 11,956 | (19) | 11,973 | ||||||||||||||||||||||||||||||||
| Net income | — | — | — | 577 | — | 577 | ||||||||||||||||||||||||||||||||
| Other comprehensive income (loss) | — | — | — | — | (250) | (250) | ||||||||||||||||||||||||||||||||
| Common stock issued, stock-based compensation plans | 1 | — | 21 | — | — | 21 | ||||||||||||||||||||||||||||||||
| Stock-based compensation expense | — | — | 89 | — | — | 89 | ||||||||||||||||||||||||||||||||
| Repurchases of common stock | (4) | — | (120) | (198) | — | (318) | ||||||||||||||||||||||||||||||||
| Dividends declared, $0.27 per share | — | — | — | (142) | — | (142) | ||||||||||||||||||||||||||||||||
| Balance, June 30, 2022 | 518 | $ | 5 | $ | 21 | $ | 12,193 | $ | (269) | $ | 11,950 | |||||||||||||||||||||||||||
| (in millions) | Class A Common Stock | Additional Paid-in Capital | Retained Earnings | Accumulated Other Comprehensive Income (Loss) | Total | |||||||||||||||||||||||||||||||||
| Shares | Amount | |||||||||||||||||||||||||||||||||||||
| Balance, December 31, 2020 | 530 | $ | 5 | $ | 32 | $ | 10,689 | $ | 110 | $ | 10,836 | |||||||||||||||||||||||||||
| Net income | — | — | — | 505 | — | 505 | ||||||||||||||||||||||||||||||||
| Other comprehensive income (loss) | — | — | — | — | (29) | (29) | ||||||||||||||||||||||||||||||||
| Common stock issued, stock-based compensation plans | 1 | — | 43 | — | — | 43 | ||||||||||||||||||||||||||||||||
| Stock-based compensation expense | — | — | 62 | — | — | 62 | ||||||||||||||||||||||||||||||||
| Repurchases of common stock | (3) | — | (93) | (159) | — | (252) | ||||||||||||||||||||||||||||||||
| Dividends declared, $0.24 per share | — | — | — | (128) | — | (128) | ||||||||||||||||||||||||||||||||
| Balance, March 31, 2021 | 528 | 5 | 44 | 10,907 | 81 | 11,037 | ||||||||||||||||||||||||||||||||
| Net income | — | — | — | 512 | — | 512 | ||||||||||||||||||||||||||||||||
| Other comprehensive income (loss) | — | — | — | — | 1 | 1 | ||||||||||||||||||||||||||||||||
| Common stock issued, stock-based compensation plans | 1 | — | 32 | — | — | 32 | ||||||||||||||||||||||||||||||||
| Stock-based compensation expense | — | — | 67 | — | — | 67 | ||||||||||||||||||||||||||||||||
| Repurchases of common stock | (4) | — | (111) | (205) | — | (316) | ||||||||||||||||||||||||||||||||
| Dividends declared, $0.24 per share | — | — | — | (128) | — | (128) | ||||||||||||||||||||||||||||||||
| Balance, June 30, 2021 | 525 | $ | 5 | $ | 32 | $ | 11,086 | $ | 82 | $ | 11,205 | |||||||||||||||||||||||||||
The accompanying notes are an integral part of the unaudited consolidated financial statements.
| Cognizant Technology Solutions | 5 | June 30, 2022 Form 10-Q |
COGNIZANT TECHNOLOGY SOLUTIONS CORPORATION
CONSOLIDATED STATEMENTS OF CASH FLOWS
(Unaudited)
| (in millions) | For the Six Months Ended June 30, | ||||||||||
| 2022 | 2021 | ||||||||||
| Cash flows from operating activities: | |||||||||||
| Net income | $ | 1,140 | $ | 1,017 | |||||||
| Adjustments to reconcile net income to net cash provided by operating activities: | |||||||||||
| Depreciation and amortization | 287 | 286 | |||||||||
| Deferred income taxes | (74) | 119 | |||||||||
| Stock-based compensation expense | 145 | 129 | |||||||||
| Other | 51 | (2) | |||||||||
| Changes in assets and liabilities: | |||||||||||
| Trade accounts receivable | (251) | (279) | |||||||||
| Other current and noncurrent assets | 131 | 60 | |||||||||
| Accounts payable | (9) | 17 | |||||||||
| Deferred revenues, current and noncurrent | (8) | (34) | |||||||||
| Other current and noncurrent liabilities | (578) | (591) | |||||||||
| Net cash provided by operating activities | 834 | 722 | |||||||||
| Cash flows from investing activities: | |||||||||||
| Purchases of property and equipment | (163) | (163) | |||||||||
| Purchases of available-for-sale investment securities | (513) | (105) | |||||||||
| Proceeds from maturity or sale of available-for-sale investment securities | 375 | — | |||||||||
| Purchases of held-to-maturity investment securities | (32) | (89) | |||||||||
| Proceeds from maturity of held-to-maturity investment securities | 30 | 76 | |||||||||
| Purchases of other investments | (256) | (642) | |||||||||
| Proceeds from maturity or sale of other investments | 769 | 322 | |||||||||
| Proceeds from sales of businesses | 19 | — | |||||||||
| Payments for business combinations, net of cash acquired | — | (658) | |||||||||
| Net cash provided by (used in) investing activities | 229 | (1,259) | |||||||||
| Cash flows from financing activities: | |||||||||||
| Issuance of common stock under stock-based compensation plans | 52 | 75 | |||||||||
| Repurchases of common stock | (792) | (560) | |||||||||
| Repayment of Term Loan borrowings and finance lease and earnout obligations | (26) | (28) | |||||||||
| Dividends paid | (284) | (255) | |||||||||
| Net cash (used in) financing activities | (1,050) | (768) | |||||||||
| Effect of exchange rate changes on cash and cash equivalents | (37) | (7) | |||||||||
| (Decrease) in cash and cash equivalents | (24) | (1,312) | |||||||||
| Cash and cash equivalents, beginning of year | 1,792 | 2,680 | |||||||||
| Cash and cash equivalents, end of period | $ | 1,768 | $ | 1,368 |
The accompanying notes are an integral part of the unaudited consolidated financial statements.
| Cognizant Technology Solutions | 6 | June 30, 2022 Form 10-Q |
COGNIZANT TECHNOLOGY SOLUTIONS CORPORATION
NOTES TO CONSOLIDATED FINANCIAL STATEMENTS
(Unaudited)
| Note 1 — Interim Consolidated Financial Statements |
The terms “Cognizant,” “we,” “our,” “us” and “the Company” refer to Cognizant Technology Solutions Corporation and its subsidiaries unless the context indicates otherwise. We have prepared the accompanying unaudited consolidated financial statements included herein in accordance with GAAP and the Exchange Act. The accompanying unaudited consolidated financial statements should be read in conjunction with our audited consolidated financial statements (and notes thereto) included in our Annual Report on Form 10-K for the year ended December 31, 2021. In our opinion, all adjustments considered necessary for a fair statement of the accompanying unaudited consolidated financial statements have been included and all adjustments are of a normal and recurring nature. Operating results for the interim periods are not necessarily indicative of results that may be expected to occur for the entire year.
| Note 2 — Revenues and Trade Accounts Receivable |
Disaggregation of Revenues
The tables below present disaggregated revenues from contracts with clients by client location, service line and contract type for each of the business segments. We believe this disaggregation best depicts how the nature, amount, timing and uncertainty of revenues and cash flows are affected by industry, market and other economic factors. Our consulting and technology services include consulting, application development, systems integration, and application testing services as well as software solutions and related services while our outsourcing services include application maintenance, infrastructure and business process services. Revenues are attributed to geographic regions based upon client location, which is the client's billing address. Substantially all revenues in the North America region relate to clients in the United States.
We have defined our Financial Services, Health Sciences (previously referred to as Healthcare), Products and Resources and Communications, Media and Technology segments as ("FS"), ("HS"), ("P&R"), and ("CMT"), respectively, in our disaggregation of revenues tables.
| Three Months Ended June 30, 2022 | Six Months Ended June 30, 2022 | |||||||||||||||||||||||||||||||||||||||||||||||||||||||||||||
| (in millions) | FS | HS | P&R | CMT | Total | FS | HS | P&R | CMT | Total | ||||||||||||||||||||||||||||||||||||||||||||||||||||
| Revenues | ||||||||||||||||||||||||||||||||||||||||||||||||||||||||||||||
| Geography: | ||||||||||||||||||||||||||||||||||||||||||||||||||||||||||||||
| North America | $ | 1,104 | $ | 1,210 | $ | 770 | $ | 572 | $ | 3,656 | $ | 2,184 | $ | 2,405 | $ | 1,531 | $ | 1,105 | $ | 7,225 | ||||||||||||||||||||||||||||||||||||||||||
| United Kingdom | 147 | 44 | 134 | 133 | 458 | 298 | 88 | 266 | 259 | 911 | ||||||||||||||||||||||||||||||||||||||||||||||||||||
| Continental Europe | 143 | 126 | 143 | 33 | 445 | 300 | 246 | 288 | 70 | 904 | ||||||||||||||||||||||||||||||||||||||||||||||||||||
| Europe - Total | 290 | 170 | 277 | 166 | 903 | 598 | 334 | 554 | 329 | 1,815 | ||||||||||||||||||||||||||||||||||||||||||||||||||||
| Rest of World | 148 | 28 | 93 | 78 | 347 | 288 | 61 | 185 | 158 | 692 | ||||||||||||||||||||||||||||||||||||||||||||||||||||
| Total | $ | 1,542 | $ | 1,408 | $ | 1,140 | $ | 816 | $ | 4,906 | $ | 3,070 | $ | 2,800 | $ | 2,270 | $ | 1,592 | $ | 9,732 | ||||||||||||||||||||||||||||||||||||||||||
| Service line: | ||||||||||||||||||||||||||||||||||||||||||||||||||||||||||||||
| Consulting and technology services | $ | 1,078 | $ | 805 | $ | 753 | $ | 465 | $ | 3,101 | $ | 2,135 | $ | 1,609 | $ | 1,507 | $ | 913 | $ | 6,164 | ||||||||||||||||||||||||||||||||||||||||||
| Outsourcing services | 464 | 603 | 387 | 351 | 1,805 | 935 | 1,191 | 763 | 679 | 3,568 | ||||||||||||||||||||||||||||||||||||||||||||||||||||
| Total | $ | 1,542 | $ | 1,408 | $ | 1,140 | $ | 816 | $ | 4,906 | $ | 3,070 | $ | 2,800 | $ | 2,270 | $ | 1,592 | $ | 9,732 | ||||||||||||||||||||||||||||||||||||||||||
| Type of contract: | ||||||||||||||||||||||||||||||||||||||||||||||||||||||||||||||
| Time and materials | $ | 894 | $ | 505 | $ | 471 | $ | 471 | $ | 2,341 | $ | 1,784 | $ | 999 | $ | 938 | $ | 919 | $ | 4,640 | ||||||||||||||||||||||||||||||||||||||||||
| Fixed-price | 578 | 617 | 581 | 309 | 2,085 | 1,135 | 1,235 | 1,153 | 601 | 4,124 | ||||||||||||||||||||||||||||||||||||||||||||||||||||
| Transaction or volume-based | 70 | 286 | 88 | 36 | 480 | 151 | 566 | 179 | 72 | 968 | ||||||||||||||||||||||||||||||||||||||||||||||||||||
| Total | $ | 1,542 | $ | 1,408 | $ | 1,140 | $ | 816 | $ | 4,906 | $ | 3,070 | $ | 2,800 | $ | 2,270 | $ | 1,592 | $ | 9,732 |
| Cognizant Technology Solutions | 7 | June 30, 2022 Form 10-Q |
| Three Months Ended June 30, 2021 | Six Months Ended June 30, 2021 | |||||||||||||||||||||||||||||||||||||||||||||||||||||||||||||
| (in millions) | FS | HS | P&R | CMT | Total | FS | HS | P&R | CMT | Total | ||||||||||||||||||||||||||||||||||||||||||||||||||||
| Revenues | ||||||||||||||||||||||||||||||||||||||||||||||||||||||||||||||
| Geography: | ||||||||||||||||||||||||||||||||||||||||||||||||||||||||||||||
| North America | $ | 1,049 | $ | 1,131 | $ | 723 | $ | 469 | $ | 3,372 | $ | 2,062 | $ | 2,232 | $ | 1,441 | $ | 920 | $ | 6,655 | ||||||||||||||||||||||||||||||||||||||||||
| United Kingdom | 130 | 45 | 116 | 112 | 403 | 255 | 85 | 222 | 211 | 773 | ||||||||||||||||||||||||||||||||||||||||||||||||||||
| Continental Europe | 186 | 120 | 132 | 44 | 482 | 378 | 238 | 235 | 87 | 938 | ||||||||||||||||||||||||||||||||||||||||||||||||||||
| Europe - Total | 316 | 165 | 248 | 156 | 885 | 633 | 323 | 457 | 298 | 1,711 | ||||||||||||||||||||||||||||||||||||||||||||||||||||
| Rest of World | 137 | 29 | 84 | 78 | 328 | 265 | 58 | 155 | 142 | 620 | ||||||||||||||||||||||||||||||||||||||||||||||||||||
| Total | $ | 1,502 | $ | 1,325 | $ | 1,055 | $ | 703 | $ | 4,585 | $ | 2,960 | $ | 2,613 | $ | 2,053 | $ | 1,360 | $ | 8,986 | ||||||||||||||||||||||||||||||||||||||||||
| Service line: | ||||||||||||||||||||||||||||||||||||||||||||||||||||||||||||||
| Consulting and technology services | $ | 1,012 | $ | 769 | $ | 668 | $ | 422 | $ | 2,871 | $ | 1,979 | $ | 1,514 | $ | 1,284 | $ | 818 | $ | 5,595 | ||||||||||||||||||||||||||||||||||||||||||
| Outsourcing services | 490 | 556 | 387 | 281 | 1,714 | 981 | 1,099 | 769 | 542 | 3,391 | ||||||||||||||||||||||||||||||||||||||||||||||||||||
| Total | $ | 1,502 | $ | 1,325 | $ | 1,055 | $ | 703 | $ | 4,585 | $ | 2,960 | $ | 2,613 | $ | 2,053 | $ | 1,360 | $ | 8,986 | ||||||||||||||||||||||||||||||||||||||||||
| Type of contract: | ||||||||||||||||||||||||||||||||||||||||||||||||||||||||||||||
| Time and materials | $ | 908 | $ | 514 | $ | 446 | $ | 422 | $ | 2,290 | $ | 1,807 | $ | 1,033 | $ | 864 | $ | 819 | $ | 4,523 | ||||||||||||||||||||||||||||||||||||||||||
| Fixed-price | 500 | 529 | 506 | 249 | 1,784 | 971 | 1,028 | 987 | 479 | 3,465 | ||||||||||||||||||||||||||||||||||||||||||||||||||||
| Transaction or volume-based | 94 | 282 | 103 | 32 | 511 | 182 | 552 | 202 | 62 | 998 | ||||||||||||||||||||||||||||||||||||||||||||||||||||
| Total | $ | 1,502 | $ | 1,325 | $ | 1,055 | $ | 703 | $ | 4,585 | $ | 2,960 | $ | 2,613 | $ | 2,053 | $ | 1,360 | $ | 8,986 | ||||||||||||||||||||||||||||||||||||||||||
Costs to Fulfill
Costs to fulfill, such as setup or transition activities, are recorded in "Other noncurrent assets" in our unaudited consolidated statements of financial position and the amortization expense of costs to fulfill is included in "Cost of revenues" in our unaudited consolidated statements of operations. Costs to obtain contracts were immaterial for the periods disclosed. The following table presents information related to the capitalized costs to fulfill for the six months ended June 30:
| (in millions) | 2022 | 2021 | ||||||||||||
| Beginning balance | $ | 394 | $ | 467 | ||||||||||
| Costs capitalized | 19 | 25 | ||||||||||||
| Amortization expense | (55) | (58) | ||||||||||||
| Impairment charge | — | (9) | ||||||||||||
| Ending balance | $ | 358 | $ | 425 |
Contract Balances
A contract asset is a right to consideration that is conditional upon factors other than the passage of time. Contract assets are presented in "Other current assets" in our unaudited consolidated statements of financial position and primarily relate to unbilled amounts on fixed-price contracts utilizing the cost-to-cost method of revenue recognition. The table below shows movements in contract assets for the six months ended June 30:
| (in millions) | 2022 | 2021 | ||||||||||||
| Beginning balance | $ | 310 | $ | 315 | ||||||||||
| Revenues recognized during the period but not billed | 318 | 266 | ||||||||||||
| Amounts reclassified to trade accounts receivable | (243) | (229) | ||||||||||||
| Effect of foreign currency exchange movements | (7) | — | ||||||||||||
| Ending balance | $ | 378 | $ | 352 |
| Cognizant Technology Solutions | 8 | June 30, 2022 Form 10-Q |
Contract liabilities, or deferred revenue, consist of advance payments and billings in excess of revenues recognized. The table below shows movements in the deferred revenue balances (current and noncurrent) for the six months ended June 30:
| (in millions) | 2022 | 2021 | ||||||||||||
| Beginning balance | $ | 443 | $ | 419 | ||||||||||
| Amounts billed but not recognized as revenues | 385 | 327 | ||||||||||||
| Revenues recognized related to the beginning balance of deferred revenue | (388) | (357) | ||||||||||||
| Effect of foreign currency exchange movements | (8) | — | ||||||||||||
| Ending balance | $ | 432 | $ | 389 |
Revenues recognized during the six months ended June 30, 2022 for performance obligations satisfied or partially satisfied in previous periods were immaterial.
Remaining Performance Obligations
As of June 30, 2022, the aggregate amount of transaction price allocated to remaining performance obligations was $1,605 million, of which approximately 85% is expected to be recognized as revenues within 2 years. Disclosure is not required for performance obligations that meet any of the following criteria:
(1)contracts with a duration of one year or less as determined under ASC Topic 606: "Revenue from Contracts with Customers",
(2)contracts for which we recognize revenues based on the right to invoice for services performed,
(3)variable consideration allocated entirely to a wholly unsatisfied performance obligation or to a wholly unsatisfied promise to transfer a distinct good or service that forms part of a single performance obligation in accordance with ASC 606-10-25-14(b), for which the criteria in ASC 606-10-32-40 have been met, or
(4)variable consideration in the form of a sales-based or usage-based royalty promised in exchange for a license of intellectual property.
Many of our performance obligations meet one or more of these exemptions and therefore are not included in the remaining performance obligation amount disclosed above.
Trade Accounts Receivable and Allowance for Credit Losses
We calculate expected credit losses for trade accounts receivable based on historical credit loss rates for each aging category as adjusted for the current market conditions and forecasts about future economic conditions. The following table presents the activity in the allowance for credit losses for trade accounts receivable for the six months ended June 30:
| (in millions) | 2022 | 2021 | ||||||||||||
| Beginning balance | $ | 50 | $ | 57 | ||||||||||
| Credit loss expense (income) | — | 1 | ||||||||||||
| Write-offs charged against the allowance | (7) | (9) | ||||||||||||
| Ending balance | $ | 43 | $ | 49 |
| Cognizant Technology Solutions | 9 | June 30, 2022 Form 10-Q |
| Note 3 — Investments |
Our investments were as follows:
| (in millions) | June 30, 2022 | December 31, 2021 | |||||||||
| Short-term investments: | |||||||||||
| Equity investment security | $ | 26 | $ | 26 | |||||||
| Available-for-sale investment securities | 448 | 310 | |||||||||
| Held-to-maturity investment securities | 38 | 37 | |||||||||
| Time deposits | 40 | 554 | |||||||||
| Total short-term investments | $ | 552 | $ | 927 |
| Long-term investments: | |||||||||||
| Other investments | $ | 68 | $ | 66 | |||||||
| Restricted time deposits(1) | 375 | 397 | |||||||||
| Total long-term investments | $ | 443 | $ | 463 |
(1)See Note 6.
Equity Investment Security
Our equity investment security is a U.S. dollar denominated investment in a fixed income mutual fund. Realized and unrealized gains and losses were immaterial for the three and six months ended June 30, 2022 and 2021.
Available-for-Sale Investment Securities
Our available-for-sale investment securities consist of highly rated U.S. dollar denominated investments in certificates of deposit and commercial paper maturing within one year. As of June 30, 2022, the amortized cost and fair value of the available-for-sale investments were $448 million. As of December 31, 2021, the amortized cost and fair value of the available-for-sale investments were $310 million. Unrealized losses were immaterial as of June 30, 2022 and December 31, 2021. There were no realized gains or losses related to the available-for-sale investment securities during the six months ended June 30, 2022 and 2021. There were no sales of available-for sale investment securities during the six months ended June 30, 2022 and 2021.
Held-to-Maturity Investment Securities
Our held-to-maturity investment securities consist of Indian rupee denominated investments in commercial paper and international corporate bonds. The basis for the measurement of fair value of the held-to-maturity investment securities is Level 2 in the fair value hierarchy.
The amortized cost and fair value of held-to-maturity investment securities were as follows:
| June 30, 2022 | December 31, 2021 | ||||||||||||||||||||||||||||||||||
| (in millions) | Amortized Cost | Fair Value | Amortized Cost | Fair Value | |||||||||||||||||||||||||||||||
| Short-term investments, maturing within one year: | |||||||||||||||||||||||||||||||||||
| Corporate debt securities | $ | 19 | $ | 19 | $ | 17 | $ | 17 | |||||||||||||||||||||||||||
| Commercial paper | 19 | 19 | 20 | 20 | |||||||||||||||||||||||||||||||
| Total held-to-maturity investments | $ | 38 | $ | 38 | $ | 37 | $ | 37 |
As of June 30, 2022, $12 million of corporate debt securities and $16 million of commercial paper were in an unrealized loss position. The total unrealized loss was less than $1 million and none of the securities had been in an unrealized loss position for longer than 12 months. As of December 31, 2021, $17 million of corporate debt securities and $10 million of commercial paper were in an unrealized loss position. The total unrealized loss was less than $1 million and none of the securities had been in an unrealized loss position for longer than 12 months.
The securities in our portfolio are highly rated and short-term in nature. As of June 30, 2022, the corporate debt securities were rated AA+ or better and the commercial paper securities were rated A-1+ by CRISIL, an Indian subsidiary of S&P Global.
| Cognizant Technology Solutions | 10 | June 30, 2022 Form 10-Q |
Other Investments
As of June 30, 2022 and December 31, 2021, we had equity method investments of $66 million and $63 million, respectively, primarily related to an investment in the technology sector. As of June 30, 2022 and December 31, 2021, we had equity securities without a readily determinable fair value of $2 million and $3 million, respectively.
| Note 4 — Accrued Expenses and Other Current Liabilities |
Accrued expenses and other current liabilities were as follows:
| (in millions) | June 30, 2022 | December 31, 2021 | |||||||||
| Compensation and benefits | $ | 1,277 | $ | 1,601 | |||||||
| Customer volume and other incentives | 279 | 242 | |||||||||
| Income taxes | 126 | 74 | |||||||||
| Professional fees | 175 | 220 | |||||||||
| Other | 315 | 395 | |||||||||
| Total accrued expenses and other current liabilities | $ | 2,172 | $ | 2,532 |
| Note 5 — Debt |
In 2018, we entered into the Credit Agreement providing for the $750 million Term Loan and a $1,750 million unsecured revolving credit facility, which are due to mature in November 2023. We are required under the Credit Agreement to make scheduled quarterly principal payments on the Term Loan.
The Credit Agreement requires interest to be paid, at our option, at either the ABR, the Eurocurrency Rate or the Daily Simple RFR (each as defined in the Credit Agreement), plus, in each case, an Applicable Margin (as defined in the Credit Agreement). Initially, the Applicable Margin is 0.875% with respect to Eurocurrency Rate and Daily Simple RFR and 0.00% with respect to ABR loans. Subsequently, the Applicable Margin with respect to Eurocurrency Rate and Daily Simple RFR may range from 0.75% to 1.125%, depending on our public debt ratings (or, if we have not received public debt ratings, from 0.875% to 1.125%, depending on our Leverage Ratio, which is the ratio of indebtedness for borrowed money to Consolidated EBITDA, as defined in the Credit Agreement). The Term Loan is a Eurocurrency Rate Loan.
The Credit Agreement contains customary affirmative and negative covenants as well as a financial covenant. We were in compliance with all debt covenants and representations of the Credit Agreement as of June 30, 2022.
In March 2022, our India subsidiary renewed its 13 billion Indian rupee ($165 million at the June 30, 2022 exchange rate) working capital facility, which requires us to repay any balances within 90 days from the date of disbursement. There is a 1.0% prepayment penalty applicable to payments made within 30 days of disbursement. This working capital facility contains affirmative and negative covenants and may be renewed annually. As of June 30, 2022, we have not borrowed funds under this facility.
Short-term Debt
As of both June 30, 2022 and December 31, 2021, we had $38 million of short-term debt related to current maturities of the Term Loan.
Long-term Debt
The following table summarizes the long-term debt balances as of:
| (in millions) | June 30, 2022 | December 31, 2021 | |||||||||
| Term Loan | $ | 647 | $ | 666 | |||||||
| Less: | |||||||||||
| Current maturities | (38) | (38) | |||||||||
| Deferred financing costs | (1) | (2) | |||||||||
| Long-term debt, net of current maturities | $ | 608 | $ | 626 |
The carrying value of our debt approximated its fair value as of June 30, 2022 and December 31, 2021.
| Cognizant Technology Solutions | 11 | June 30, 2022 Form 10-Q |
| Note 6 — Income Taxes |
Our effective income tax rates were as follows:
| Three Months Ended June 30, | Six Months Ended June 30, | ||||||||||||||||||||||
| 2022 | 2021 | 2022 | 2021 | ||||||||||||||||||||
| Effective income tax rate | 24.2 | % | 26.5 | % | 23.8 | % | 25.3 | % |
We are involved in two separate ongoing disputes with the ITD in connection with previously disclosed share repurchase transactions undertaken by CTS India in 2013 and 2016 to repurchase shares from its shareholders (non-Indian Cognizant entities) valued at $523 million and $2.8 billion, respectively.
The 2016 transaction was undertaken pursuant to a plan approved by the High Court in Chennai, India, and resulted in the payment of $135 million in Indian income taxes - an amount we believe includes all the applicable taxes owed for this transaction under Indian law. In March 2018, the ITD asserted that it is owed an additional 33 billion Indian rupees ($418 million at the June 30, 2022 exchange rate) on the 2016 transaction. We deposited 5 billion Indian rupees, representing 15% of the disputed tax amount related to the 2016 transaction, with the ITD. As of June 30, 2022 and December 31, 2021, the deposit with the ITD was $63 million and $67 million, respectively, presented in "Other noncurrent assets". Additionally, certain time deposits of CTS India were placed under lien in favor of the ITD, representing the remainder of the disputed tax amount. As of June 30, 2022 and December 31, 2021, the balance of deposits under lien was 30 billion Indian rupees, including previously earned interest, or $375 million and $397 million, respectively, as presented in "Long-term investments". The dispute in relation to the 2013 share repurchase transaction is also in litigation. At this time, the ITD has not made specific demands with regards to this transaction.
In April 2020, we received a formal assessment from the ITD on the 2016 transaction, which is consistent with its previous assertions. In June 2020, we filed an appeal against this assessment to the CITA. In March 2022, we received a negative decision from the CITA.
We continue to believe we have paid all applicable taxes owed on both the 2016 and the 2013 transactions and we continue to defend our positions with respect to both matters. Accordingly, we have not recorded any reserves for these matters as of June 30, 2022.
| Note 7 — Derivative Financial Instruments |
In the normal course of business, we use foreign exchange forward and option contracts to manage foreign currency exchange rate risk. Derivatives may give rise to credit risk from the possible non-performance by counterparties. Credit risk is limited to the fair value of those contracts that are favorable to us. We have limited our credit risk by limiting the amount of credit exposure with any one financial institution and conducting ongoing evaluation of the creditworthiness of the financial institutions with which we do business. In addition, all the assets and liabilities related to the foreign exchange derivative contracts set forth in the below table are subject to master netting arrangements, such as the International Swaps and Derivatives Association Master Agreement, with each individual counterparty. These master netting arrangements generally provide for net settlement of all outstanding contracts with the counterparty in the case of an event of default or a termination event. We have presented all the assets and liabilities related to the foreign exchange derivative contracts, as applicable, on a gross basis, with no offsets, in our unaudited consolidated statements of financial position. There is no financial collateral (including cash collateral) posted or received by us related to the foreign exchange derivative contracts.
| Cognizant Technology Solutions | 12 | June 30, 2022 Form 10-Q |
The following table provides information on the location and fair values of derivative financial instruments included in our unaudited consolidated statements of financial position as of:
| (in millions) | June 30, 2022 | December 31, 2021 | ||||||||||||||||||||||||||||||
| Designation of Derivatives | Location on Statement of Financial Position | Assets | Liabilities | Assets | Liabilities | |||||||||||||||||||||||||||
| Foreign exchange forward and option contracts – Designated as cash flow hedging instruments | Other current assets | $ | 6 | $ | — | $ | 51 | $ | — | |||||||||||||||||||||||
| Other noncurrent assets | — | — | 15 | — | ||||||||||||||||||||||||||||
| Accrued expenses and other current liabilities | — | 21 | — | — | ||||||||||||||||||||||||||||
| Other noncurrent liabilities | — | 10 | — | — | ||||||||||||||||||||||||||||
| Total | 6 | 31 | 66 | — | ||||||||||||||||||||||||||||
| Foreign exchange forward contracts – Not designated as hedging instruments | Other current assets | 3 | — | 3 | — | |||||||||||||||||||||||||||
| Accrued expenses and other current liabilities | — | — | — | 7 | ||||||||||||||||||||||||||||
| Total | 3 | — | 3 | 7 | ||||||||||||||||||||||||||||
| Total | $ | 9 | $ | 31 | $ | 69 | $ | 7 |
Cash Flow Hedges
We have entered into a series of foreign exchange derivative contracts that are designated as cash flow hedges of Indian rupee denominated payments in India. These contracts are intended to partially offset the impact of movement of the Indian rupee against the U.S. dollar on future operating costs and are scheduled to mature each month during the remainder of 2022, 2023 and the first six months of 2024. The changes in fair value of these contracts are initially reported in "Accumulated other comprehensive income (loss)" in our unaudited consolidated statements of financial position and are subsequently reclassified to earnings within "Cost of revenues" and "Selling, general and administrative expenses" in our unaudited consolidated statements of operations in the same period that the forecasted Indian rupee denominated payments are recorded in earnings. As of June 30, 2022, we estimate that $11 million, net of tax, of net losses related to derivatives designated as cash flow hedges reported in "Accumulated other comprehensive income (loss)" in our unaudited consolidated statements of financial position is expected to be reclassified into earnings within the next 12 months.
The notional value of the outstanding contracts by year of maturity was as follows:
| (in millions) | June 30, 2022 | December 31, 2021 | |||||||||
| 2022 | $ | 1,038 | $ | 1,643 | |||||||
| 2023 | 1,380 | 880 | |||||||||
| 2024 | 395 | — | |||||||||
| Total notional value of contracts outstanding (1) | $ | 2,813 | $ | 2,523 | |||||||
(1)Includes $8 million and $78 million notional value of option contracts as of June 30, 2022 and December 31, 2021, respectively, with the remaining notional value related to forward contracts.
| Cognizant Technology Solutions | 13 | June 30, 2022 Form 10-Q |
The following table provides information on the location and amounts of pre-tax gains and losses on our cash flow hedges for the three months ended June 30:
| (in millions) | Change in Derivative Gains and Losses Recognized in Accumulated Other Comprehensive Income (Loss) (effective portion) | Location of Net Gains Reclassified from Accumulated Other Comprehensive Income (Loss) into Income (effective portion) | Net Gains Reclassified from Accumulated Other Comprehensive Income (Loss) into Income (effective portion) | ||||||||||||||||||||||||||
| 2022 | 2021 | 2022 | 2021 | ||||||||||||||||||||||||||
| Foreign exchange forward and option contracts – Designated as cash flow hedging instruments | $ | (66) | $ | (3) | Cost of revenues | $ | 5 | $ | 12 | ||||||||||||||||||||
| SG&A expenses | 1 | 2 | |||||||||||||||||||||||||||
| Total | $ | 6 | $ | 14 |
The following table provides information on the location and amounts of pre-tax gains and losses on our cash flow hedges for the six months ended June 30:
| (in millions) | Change in Derivative Gains and Losses Recognized in Accumulated Other Comprehensive Income (Loss) (effective portion) | Location of Net Gains Reclassified from Accumulated Other Comprehensive Income (Loss) into Income (effective portion) | Net Gains Reclassified from Accumulated Other Comprehensive Income (Loss) into Income (effective portion) | ||||||||||||||||||||||||||
| 2022 | 2021 | 2022 | 2021 | ||||||||||||||||||||||||||
| Foreign exchange forward and option contracts – Designated as cash flow hedging instruments | $ | (76) | $ | 14 | Cost of revenues | $ | 17 | $ | 30 | ||||||||||||||||||||
| SG&A expenses | 2 | 5 | |||||||||||||||||||||||||||
| Total | $ | 19 | $ | 35 |
The activity related to the change in net unrealized gains and losses on the cash flow hedges included in "Accumulated other comprehensive income (loss)" in our unaudited consolidated statements of stockholders' equity is presented in Note 9.
Other Derivatives
We use foreign exchange forward contracts to provide an economic hedge against balance sheet exposures to certain monetary assets and liabilities denominated in currencies other than the functional currency of our foreign subsidiaries. We entered into foreign exchange forward contracts that are scheduled to mature in the third quarter of 2022. Realized gains or losses and changes in the estimated fair value of these derivative financial instruments are recorded in the caption "Foreign currency exchange gains (losses), net" in our unaudited consolidated statements of operations.
Additional information related to the outstanding foreign exchange forward contracts not designated as hedging instruments was as follows:
| (in millions) | June 30, 2022 | December 31, 2021 | |||||||||||||||||||||
| Notional | Fair Value | Notional | Fair Value | ||||||||||||||||||||
| Contracts outstanding | $ | 1,072 | $ | 3 | $ | 847 | $ | (4) |
| Cognizant Technology Solutions | 14 | June 30, 2022 Form 10-Q |
The following table provides information on the location and amounts of realized and unrealized pre-tax gains on the other derivative financial instruments for the three and six months ended June 30:
| Location of Net Gains on Derivative Instruments | Amount of Net Gains on Derivative Instruments | ||||||||||||||||||||||||||||
| Three Months Ended June 30, | Six Months Ended June 30, | ||||||||||||||||||||||||||||
| (in millions) | 2022 | 2021 | 2022 | 2021 | |||||||||||||||||||||||||
| Foreign exchange forward contracts – Not designated as hedging instruments | Foreign currency exchange gains (losses), net | $ | 32 | $ | 3 | $ | 45 | $ | 6 |
The related cash flow impacts of all the derivative activities are reflected as cash flows from operating activities.
| Note 8 — Fair Value Measurements |
We measure our cash equivalents, certain investments, contingent consideration liabilities and foreign exchange forward and option contracts at fair value. Fair value is the exit price, or the amount that would be received to sell an asset or paid to transfer a liability in an orderly transaction between market participants as of the measurement date. The fair value hierarchy is based on inputs to valuation techniques that are used to measure fair value that are either observable or unobservable. Observable inputs reflect assumptions market participants would use in pricing an asset or liability based on market data obtained from independent sources while unobservable inputs reflect a reporting entity’s pricing based upon their own market assumptions.
The fair value hierarchy consists of the following three levels:
-
Level 1 – Inputs are quoted prices in active markets for identical assets or liabilities.
-
Level 2 – Inputs are quoted prices for similar assets or liabilities in an active market, quoted prices for identical or similar assets or liabilities in markets that are not active, inputs other than quoted prices that are observable and market-corroborated inputs which are derived principally from or corroborated by observable market data.
-
Level 3 – Inputs are derived from valuation techniques in which one or more significant inputs or value drivers are unobservable.
The following table summarizes the financial assets and (liabilities) measured at fair value on a recurring basis as of June 30, 2022:
| (in millions) | Level 1 | Level 2 | Level 3 | Total | |||||||||||||||||||
| Cash equivalents: | |||||||||||||||||||||||
| Money market funds | $ | 360 | $ | — | $ | — | $ | 360 | |||||||||||||||
| Time deposits | — | 229 | — | 229 | |||||||||||||||||||
| Commercial paper | — | 205 | — | 205 | |||||||||||||||||||
| Short-term investments: | |||||||||||||||||||||||
| Time deposits | — | 40 | — | 40 | |||||||||||||||||||
| Equity investment security | 26 | — | — | 26 | |||||||||||||||||||
| Available-for-sale investment securities: | |||||||||||||||||||||||
| Certificates of deposit and commercial paper | — | 448 | — | 448 | |||||||||||||||||||
| Other current assets: | |||||||||||||||||||||||
| Foreign exchange forward contracts | — | 9 | — | 9 | |||||||||||||||||||
| Long-term investments: | |||||||||||||||||||||||
| Restricted time deposits(1) | — | 375 | — | 375 | |||||||||||||||||||
| Accrued expenses and other current liabilities: | |||||||||||||||||||||||
| Foreign exchange forward and option contracts | — | (21) | — | (21) | |||||||||||||||||||
| Contingent consideration liabilities | — | — | (21) | (21) | |||||||||||||||||||
| Other noncurrent liabilities: | |||||||||||||||||||||||
| Foreign exchange forward contracts | — | (10) | — | (10) | |||||||||||||||||||
| Contingent consideration liabilities | — | — | (16) | (16) |
(1)See Note 6.
| Cognizant Technology Solutions | 15 | June 30, 2022 Form 10-Q |
The following table summarizes the financial assets and (liabilities) measured at fair value on a recurring basis as of December 31, 2021:
| (in millions) | Level 1 | Level 2 | Level 3 | Total | |||||||||||||||||||
| Cash equivalents: | |||||||||||||||||||||||
| Money market funds | $ | 507 | $ | — | $ | — | $ | 507 | |||||||||||||||
| Time deposits | — | 4 | — | 4 | |||||||||||||||||||
| Commercial paper | — | 266 | — | 266 | |||||||||||||||||||
| Short-term investments: | |||||||||||||||||||||||
| Time deposits | — | 554 | — | 554 | |||||||||||||||||||
| Equity investment security | 26 | — | — | 26 | |||||||||||||||||||
| Available-for-sale investment securities: | |||||||||||||||||||||||
| Commercial paper | — | 310 | — | 310 | |||||||||||||||||||
| Other current assets: | |||||||||||||||||||||||
| Foreign exchange forward and option contracts | — | 54 | — | 54 | |||||||||||||||||||
| Long-term investments: | |||||||||||||||||||||||
| Restricted time deposits(1) | — | 397 | — | 397 | |||||||||||||||||||
| Other noncurrent assets: | |||||||||||||||||||||||
| Foreign exchange forward and option contracts | — | 15 | — | 15 | |||||||||||||||||||
| Accrued expenses and other current liabilities: | |||||||||||||||||||||||
| Foreign exchange forward and option contracts | — | (7) | — | (7) | |||||||||||||||||||
| Contingent consideration liabilities | — | — | (14) | (14) | |||||||||||||||||||
| Other noncurrent liabilities: | |||||||||||||||||||||||
| Contingent consideration liabilities | — | — | (21) | (21) |
(1)See Note 6.
The following table summarizes the changes in Level 3 contingent consideration liabilities for the six months ended June 30:
| (in millions) | 2022 | 2021 | ||||||||||||
| Beginning balance | $ | 35 | $ | 54 | ||||||||||
| Initial measurement recognized at acquisition | 1 | 8 | ||||||||||||
| Change in fair value recognized in SG&A expenses | 5 | (19) | ||||||||||||
| Payments | (4) | (3) | ||||||||||||
| Ending balance | $ | 37 | $ | 40 |
We measure the fair value of money market funds based on quoted prices in active markets for identical assets and measure the fair value of our equity investment security based on the published daily net asset value at which investors can freely subscribe to or redeem from the fund. The fair value of certificates of deposit and commercial paper is measured based on relevant trade data, dealer quotes, or model-driven valuations using significant inputs derived from or corroborated by observable market data, such as yield curves and credit spreads. The carrying value of the time deposits approximated fair value as of June 30, 2022 and December 31, 2021.
We estimate the fair value of each foreign exchange forward contract by using a present value of expected cash flows model. This model calculates the difference between the current market forward price and the contracted forward price for each foreign exchange forward contract and applies the difference in the rates to each outstanding contract. The market forward rates include a discount and credit risk factor. We estimate the fair value of each foreign exchange option contract by using a variant of the Black-Scholes model. This model uses present value techniques and reflects the time value and intrinsic value based on observable market rates.
We estimate the fair value of contingent consideration liabilities associated with acquisitions using a variation of the income approach, which utilizes one or more significant inputs that are unobservable. This approach calculates the fair value of such liabilities based on the probability-weighted expected performance of the acquired entity against the target performance metric, discounted to present value when appropriate.
During the six months ended June 30, 2022 and the year ended December 31, 2021, there were no transfers among Level 1, Level 2 or Level 3 financial assets and liabilities.
| Cognizant Technology Solutions | 16 | June 30, 2022 Form 10-Q |
| Note 9 — Accumulated Other Comprehensive Income (Loss) |
Changes in "Accumulated other comprehensive income (loss)" by component were as follows for the three and six months ended June 30, 2022:
| Three Months | Six Months | |||||||||||||||||||||||||||||||||||||
| (in millions) | Before Tax Amount | Tax Effect | Net of Tax Amount | Before Tax Amount | Tax Effect | Net of Tax Amount | ||||||||||||||||||||||||||||||||
| Foreign currency translation adjustments: | ||||||||||||||||||||||||||||||||||||||
| Beginning balance | $ | (60) | $ | 3 | $ | (57) | $ | (22) | $ | 2 | $ | (20) | ||||||||||||||||||||||||||
| Change in foreign currency translation adjustments | (197) | 4 | (193) | (235) | 5 | (230) | ||||||||||||||||||||||||||||||||
| Ending balance | $ | (257) | $ | 7 | $ | (250) | $ | (257) | $ | 7 | $ | (250) | ||||||||||||||||||||||||||
| Unrealized gains and losses on cash flow hedges: | ||||||||||||||||||||||||||||||||||||||
| Beginning balance | $ | 48 | $ | (10) | $ | 38 | $ | 71 | $ | (14) | $ | 57 | ||||||||||||||||||||||||||
| Unrealized (losses) arising during the period | (66) | 14 | (52) | (76) | 16 | (60) | ||||||||||||||||||||||||||||||||
| Reclassifications of net (gains) to: | ||||||||||||||||||||||||||||||||||||||
| Cost of revenues | (5) | 1 | (4) | (17) | 3 | (14) | ||||||||||||||||||||||||||||||||
| SG&A expenses | (1) | — | (1) | (2) | — | (2) | ||||||||||||||||||||||||||||||||
| Net change | (72) | 15 | (57) | (95) | 19 | (76) | ||||||||||||||||||||||||||||||||
| Ending balance | $ | (24) | $ | 5 | $ | (19) | $ | (24) | $ | 5 | $ | (19) | ||||||||||||||||||||||||||
| Accumulated other comprehensive income (loss): | ||||||||||||||||||||||||||||||||||||||
| Beginning balance | $ | (12) | $ | (7) | $ | (19) | $ | 49 | $ | (12) | $ | 37 | ||||||||||||||||||||||||||
| Other comprehensive income (loss) | (269) | 19 | (250) | (330) | 24 | (306) | ||||||||||||||||||||||||||||||||
| Ending balance | $ | (281) | $ | 12 | $ | (269) | $ | (281) | $ | 12 | $ | (269) |
Changes in "Accumulated other comprehensive income (loss)" by component were as follows for the three and six months ended June 30, 2021:
| Three Months | Six Months | |||||||||||||||||||||||||||||||||||||
| (in millions) | Before Tax Amount | Tax Effect | Net of Tax Amount | Before Tax Amount | Tax Effect | Net of Tax Amount | ||||||||||||||||||||||||||||||||
| Foreign currency translation adjustments: | ||||||||||||||||||||||||||||||||||||||
| Beginning balance | $ | 29 | $ | 1 | $ | 30 | $ | 56 | $ | (1) | $ | 55 | ||||||||||||||||||||||||||
| Change in foreign currency translation adjustments | 15 | (1) | 14 | (12) | 1 | (11) | ||||||||||||||||||||||||||||||||
| Ending balance | $ | 44 | $ | — | $ | 44 | $ | 44 | $ | — | $ | 44 | ||||||||||||||||||||||||||
| Unrealized gains on cash flow hedges: | ||||||||||||||||||||||||||||||||||||||
| Beginning balance | $ | 63 | $ | (12) | $ | 51 | $ | 67 | $ | (12) | $ | 55 | ||||||||||||||||||||||||||
| Unrealized (losses) gains arising during the period | (3) | — | (3) | 14 | (3) | 11 | ||||||||||||||||||||||||||||||||
| Reclassifications of net (gains) to: | ||||||||||||||||||||||||||||||||||||||
| Cost of revenues | (12) | 3 | (9) | (30) | 6 | (24) | ||||||||||||||||||||||||||||||||
| SG&A expenses | (2) | 1 | (1) | (5) | 1 | (4) | ||||||||||||||||||||||||||||||||
| Net change | (17) | 4 | (13) | (21) | 4 | (17) | ||||||||||||||||||||||||||||||||
| Ending balance | $ | 46 | $ | (8) | $ | 38 | $ | 46 | $ | (8) | $ | 38 | ||||||||||||||||||||||||||
| Accumulated other comprehensive income (loss): | ||||||||||||||||||||||||||||||||||||||
| Beginning balance | $ | 92 | $ | (11) | $ | 81 | $ | 123 | $ | (13) | $ | 110 | ||||||||||||||||||||||||||
| Other comprehensive income (loss) | (2) | 3 | 1 | (33) | 5 | (28) | ||||||||||||||||||||||||||||||||
| Ending balance | $ | 90 | $ | (8) | $ | 82 | $ | 90 | $ | (8) | $ | 82 |
| Cognizant Technology Solutions | 17 | June 30, 2022 Form 10-Q |
| Note 10— Commitments and Contingencies |
We are involved in various claims and legal proceedings arising in the ordinary course of business. We accrue a liability when a loss is considered probable and the amount can be reasonably estimated. When a material loss contingency is reasonably possible but not probable, we do not record a liability, but instead disclose the nature and the amount of the claim, and an estimate of the loss or range of loss, if such an estimate can be made. Legal fees are expensed as incurred. While we do not expect that the ultimate resolution of any existing claims and proceedings (other than the specific matters described below, if decided adversely), individually or in the aggregate, will have a material adverse effect on our financial position, an unfavorable outcome in some or all of these proceedings could have a material adverse impact on results of operations or cash flows for a particular period. This assessment is based on our current understanding of relevant facts and circumstances. As such, our view of these matters is subject to inherent uncertainties and may change in the future.
On January 15, 2015, Syntel sued TriZetto and Cognizant in the USDC-SDNY. Syntel’s complaint alleged breach of contract against TriZetto, and tortious interference and misappropriation of trade secrets against Cognizant and TriZetto, stemming from Cognizant’s hiring of certain former Syntel employees. Cognizant and TriZetto countersued on March 23, 2015, for breach of contract, misappropriation of trade secrets and tortious interference, based on Syntel’s misuse of TriZetto confidential information and abandonment of contractual obligations. Cognizant and TriZetto subsequently added federal Defend Trade Secrets Act and copyright infringement claims for Syntel’s misuse of TriZetto’s proprietary technology. The parties’ claims were narrowed by the court and the case was tried before a jury, which on October 27, 2020 returned a verdict in favor of Cognizant in the amount of $855 million, including $570 million in punitive damages. On April 20, 2021, the USDC-SDNY issued a post-trial order that, among other things, affirmed the jury’s award of $285 million in actual damages, but reduced the award of punitive damages from $570 million to $285 million, thereby reducing the overall damages award from $855 million to $570 million. The USDC-SDNY subsequently issued a final judgment consistent with the April 20th order. On May 26, 2021, Syntel filed a notice of appeal to the Second Circuit, and on June 3, 2021 the USDC-SDNY stayed execution of judgment pending appeal. We will not record the gain in our financial statements until it becomes realizable.
On February 28, 2019, a ruling of the SCI interpreting the India Defined Contribution Obligation altered historical understandings of the obligation, extending it to cover additional portions of the employee’s income. As a result, the ongoing contributions of our affected employees and the Company were required to be increased. In the first quarter of 2019, we accrued $117 million with respect to prior periods, assuming retroactive application of the SCI’s ruling, in "Selling, general and administrative expenses" in our unaudited consolidated statement of operations. There is significant uncertainty as to how the liability should be calculated as it is impacted by multiple variables, including the period of assessment, the application with respect to certain current and former employees and whether interest and penalties may be assessed. Since the ruling, a variety of trade associations and industry groups have advocated to the Indian government, highlighting the harm to the information technology sector, other industries and job growth in India that would result from a retroactive application of the ruling. It is possible the Indian government will review the matter and there is a substantial question as to whether the Indian government will apply the SCI’s ruling on a retroactive basis. As such, the ultimate amount of our obligation may be materially different from the amount accrued.
On October 31, 2016, November 15, 2016 and November 18, 2016, three putative shareholder derivative complaints were filed in New Jersey Superior Court, Bergen County, naming us, all of our then current directors and certain of our current and former officers at that time as defendants. These actions were consolidated in an order dated January 24, 2017. The complaints assert claims for breach of fiduciary duty, corporate waste, unjust enrichment, abuse of control, mismanagement, and/or insider selling by defendants. On April 26, 2017, the New Jersey Superior Court deferred further proceedings by dismissing the consolidated putative shareholder derivative litigation without prejudice but permitting the parties to file a motion to vacate the dismissal in the future.
On February 22, 2017, April 7, 2017 and May 10, 2017, three additional putative shareholder derivative complaints alleging similar claims were filed in the USDC-NJ, naming us and certain of our current and former directors and officers at that time as defendants. These complaints asserted claims similar to those in the previously-filed putative shareholder derivative actions. In an order dated June 20, 2017, the USDC-NJ consolidated these actions into a single action, appointed lead plaintiff and lead counsel, and stayed all further proceedings pending a final, non-appealable ruling on the motions to dismiss a consolidated putative securities class action that was resolved on December 21, 2021, when the USDC-NJ granted final approval of the settlement of the consolidated putative securities class action and entered a judgment dismissing the consolidated putative securities class action with prejudice. On October 30, 2018, lead plaintiff filed a consolidated verified derivative complaint.
On March 11, 2019, a seventh putative shareholder derivative complaint was filed in the USDC-NJ, naming us and certain of our current and former directors and officers at that time as defendants. The complaint in that action asserts claims similar to
| Cognizant Technology Solutions | 18 | June 30, 2022 Form 10-Q |
those in the previously-filed putative shareholder derivative actions. On May 14, 2019, the USDC-NJ approved a stipulation that (i) consolidated this action with the putative shareholder derivative suits that were previously filed in the USDC-NJ; and (ii) stayed all of these suits pending an order on the motion to dismiss the second amended complaint in the above-referenced consolidated putative securities class action that was resolved on December 21, 2021. On August 3, 2020, lead plaintiffs filed an amended complaint. The USDC-NJ extended the stay through February 14, 2022. On February 14, 2022, we and certain of our current and former directors and officers moved to dismiss the amended complaint. Those motions are now fully briefed and pending before the USDC-NJ.
On June 1, 2021, an eighth putative shareholder derivative complaint was filed in the USDC-NJ, naming us and certain of our current and former directors and officers at that time as defendants. The complaint asserts claims similar to those in the previously-filed putative shareholder derivative actions. On August 2, 2021, the USDC-NJ approved a stipulation that stayed this action. The stay ended on February 14, 2022. On March 31, 2022, we and certain of our current and former directors and officers moved to dismiss the complaint. Those motions are now fully briefed and pending before the USDC-NJ.
We are presently unable to predict the duration, scope or result of the putative shareholder derivative actions. Although the Company continues to defend the putative shareholder derivative actions vigorously, these lawsuits are subject to inherent uncertainties, the actual cost of such litigation will depend upon many unknown factors and the outcome of the litigation is necessarily uncertain.
We have indemnification and expense advancement obligations pursuant to our bylaws and indemnification agreements with respect to certain current and former members of senior management and the Company’s board of directors. In connection with the matters that were the subject of our previously disclosed internal investigation, the DOJ and SEC investigations and the related litigation, we have received and expect to continue to receive requests under such indemnification agreements and our bylaws to provide funds for legal fees and other expenses. There are no amounts remaining available to us under applicable insurance policies for our ongoing indemnification and advancement obligations with respect to certain of our current and former officers and directors or incremental legal fees and other expenses related to the above matters.
See Note 6 for information relating to the ITD Dispute.
Many of our engagements involve projects that are critical to the operations of our clients’ business and provide benefits that are difficult to quantify. Any failure in a client’s systems or our failure to meet our contractual obligations to our clients, including any breach involving a client’s confidential information or sensitive data, or our obligations under applicable laws or regulations could result in a claim for substantial damages against us, regardless of our responsibility for such failure. Although we attempt to contractually limit our liability for damages arising from negligent acts, errors, mistakes, or omissions in rendering our services, there can be no assurance that the limitations of liability set forth in our contracts will be enforceable in all instances or will otherwise protect us from liability for damages. Although we have general liability insurance coverage, including coverage for errors or omissions, we retain a significant portion of risk through our insurance deductibles and there can be no assurance that such coverage will cover all types of claims, continue to be available on reasonable terms or will be available in sufficient amounts to cover one or more large claims, or that the insurer will not disclaim coverage as to any future claim. The successful assertion of one or more large claims against us that exceed or are not covered by our insurance coverage or changes in our insurance policies, including premium increases or the imposition of large deductible or co-insurance requirements, could have a material adverse effect on our business, results of operations, financial position and cash flows for a particular period.
In the normal course of business and in conjunction with certain client engagements, we have entered into contractual arrangements through which we may be obligated to indemnify clients or other parties with whom we conduct business with respect to certain matters. These arrangements can include provisions whereby we agree to hold the indemnified party and certain of their affiliated entities harmless with respect to third-party claims related to such matters as our breach of certain representations or covenants, our intellectual property infringement, our gross negligence or willful misconduct or certain other claims made against certain parties. Payments by us under any of these arrangements are generally conditioned on the client making a claim and providing us with full control over the defense and settlement of such claim. It is not possible to determine the maximum potential liability under these indemnification agreements due to the unique facts and circumstances involved in each particular agreement. Historically, we have not made material payments under these indemnification agreements and therefore they have not had a material impact on our operating results, financial position, or cash flows. However, if events arise requiring us to make payment for indemnification claims under our indemnification obligations in contracts we have entered, such payments could have a material adverse effect on our business, results of operations, financial position and cash flows for a particular period.
| Cognizant Technology Solutions | 19 | June 30, 2022 Form 10-Q |
| Note 11 — Segment Information |
Our reportable segments are:
-
Financial Services, which consists of the banking and insurance operating segments;
-
Health Sciences (previously referred to as Healthcare);
-
Products and Resources, which consists of the retail and consumer goods; manufacturing, logistics, energy, and utilities; and travel and hospitality operating segments; and
-
Communications, Media and Technology
Our segments are industry-based, and as such, we report revenue from clients in the segment with which our clients are most closely aligned. Our client partners, account executives and client relationship managers are aligned in accordance with the specific industries they serve. Our chief operating decision maker evaluates the Company's performance and allocates resources based on segment revenues and operating profit. Segment operating profit is defined as income from operations before unallocated costs. Generally, operating expenses for each operating segment have similar characteristics and are subject to the same factors, pressures and challenges. However, the economic environment and its effects on industries served by the operating segments may affect revenues and operating expenses to differing degrees.
In 2022, we made certain changes to the internal measurement of segment operating profits for the purpose of evaluating
segment performance and resource allocation. The primary reason for the change was to charge costs to the business segments that are directly managed and controlled by them. Specifically, segment operating profit now includes costs related to non-delivery personnel that support consulting services, which were previously included in "unallocated costs." We have reported 2022 segment operating profits using the new allocation methodology and have recast the 2021 results to conform to the new methodology.
Additionally, we made the following changes:
-
We renamed the Healthcare reportable segment as Health Sciences. This segment, which was previously comprised of two operating segments, (i) healthcare and (ii) life sciences, is now comprised of one operating segment - health sciences.
-
The Communications, Media and Technology segment, which was previously comprised of two operating segments, (i) communications and media and (ii) technology, is now comprised of one operating segment - communications, media and technology.
These changes reflect how these operating segments are currently managed and reported to the chief operating decision maker but did not affect the reportable segments' financial results.
Expenses included in segment operating profit consist principally of direct selling and delivery costs as well as a per employee charge for use of our global delivery centers and infrastructure. Certain SG&A expenses, the excess or shortfall of incentive-based compensation for commercial and delivery employees as compared to target, a portion of depreciation and amortization and the impact of the settlements of the cash flow hedges are not allocated to individual segments in internal management reports used by the chief operating decision maker. Accordingly, such expenses are excluded from segment operating profit and are included below as “unallocated costs” and adjusted against our total income from operations. Additionally, management has determined that it is not practical to allocate identifiable assets by segment, since such assets are used interchangeably among the segments.
For revenues by reportable segment and geographic area, see Note 2.
| Cognizant Technology Solutions | 20 | June 30, 2022 Form 10-Q |
Segment operating profits by reportable segment were as follows for the three and six months ended June 30:
| Three Months Ended June 30, | Six Months Ended June 30, | ||||||||||||||||||||||
| (in millions) | 2022 | 2021 | 2022 | 2021 | |||||||||||||||||||
| Financial Services | $ | 454 | $ | 430 | $ | 875 | $ | 828 | |||||||||||||||
| Health Sciences | 388 | 382 | 756 | 787 | |||||||||||||||||||
| Products and Resources | 359 | 323 | 691 | 625 | |||||||||||||||||||
| Communications, Media and Technology | 271 | 231 | 516 | 443 | |||||||||||||||||||
| Total segment operating profit | 1,472 | 1,366 | 2,838 | 2,683 | |||||||||||||||||||
| Less: unallocated costs | 712 | 670 | 1,354 | 1,318 | |||||||||||||||||||
| Income from operations | $ | 760 | $ | 696 | $ | 1,484 | $ | 1,365 |
Geographic Area Information
Long-lived assets by geographic area are as follows:
| As of | |||||||||||
| (in millions) | June 30, 2022 | December 31, 2021 | |||||||||
| Long-lived Assets: (1) | |||||||||||
| North America(2) | $ | 366 | $ | 377 | |||||||
| Europe | 65 | 75 | |||||||||
| Rest of World (3) | 690 | 719 | |||||||||
| Total | $ | 1,121 | $ | 1,171 |
(1)Long-lived assets include property and equipment, net of accumulated depreciation and amortization.
(2)Substantially all relates to the United States.
(3)Substantially all relates to India.
| Note 12 — Subsequent Events |
Dividend
On July 26, 2022, the Board of Directors approved the Company's declaration of a $0.27 per share dividend with a record date of August 19, 2022 and a payment date of August 30, 2022.
| Cognizant Technology Solutions | 21 | June 30, 2022 Form 10-Q |
| Item 2. Management’s Discussion and Analysis of Financial Condition and Results of Operations. |
| Executive Summary |
Cognizant is one of the world’s leading professional services companies, engineering modern business for the digital era. Our services include digital services and solutions, consulting, application development, systems integration, application testing, application maintenance, infrastructure services and business process services. Digital services are an important part of our portfolio, aligning with our clients' focus on becoming data-enabled, customer-centric and differentiated businesses. We are continuing to invest in digital services with a focus on four key areas: IoT, digital engineering, data and cloud. We tailor our services and solutions to specific industries with an integrated global delivery model that employs client service and delivery teams based at client locations and dedicated global and regional delivery centers. We help clients modernize technology, reimagine processes and transform experiences so they can stay ahead in a fast-changing world.
On July 6, 2022, we announced that we will be simplifying our internal operating structure around practice areas and delivery operations by merging our Digital Business & Technology and Digital Business Operations practice areas with their respective delivery organizations to create four new integrated practices: Software & Platform Engineering, Core Technologies & Insights, Enterprise Platform Services, and Intuitive Operations & Automation. This change will not impact our reportable business segments.
Q2 2022 Financial Results
| Revenue |
| Income from Operations |
| Operating Margin |
| Diluted EPS |
| GAAP | Adjusted1 |
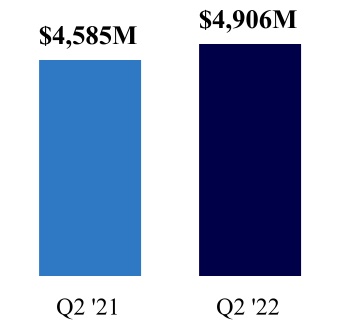
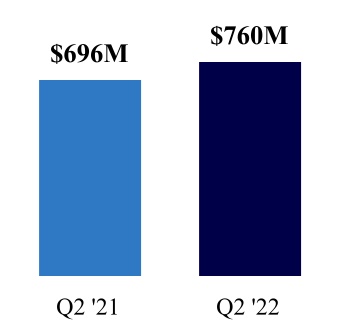
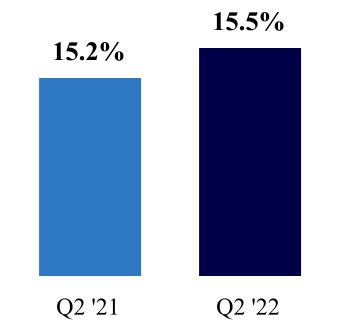
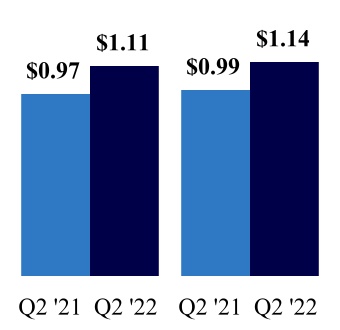
| Revenue up $321 million or 7.0% from Q2 2021; 9.5% in constant currency1 | Income from Operations up $64 million or 9.2% from Q2 2021 | Operating margin up 30 bps from Q2 2021 | GAAP | Adjusted1 | ||||||||||||||||||||||||||||||||||
| Diluted EPS up $0.14 or 14.4% from Q2 2021 | Diluted EPS up $0.15 or 15.2% from Q2 2021 | |||||||||||||||||||||||||||||||||||||
During the quarter ended June 30, 2022, revenues increased by $321 million as compared to the quarter ended June 30, 2021, representing growth of 7.0%, or 9.5% on a constant currency basis1. Our recently completed acquisitions contributed 110 basis points to revenue growth. Revenue growth also reflected our clients' continued adoption and integration of digital technologies. Revenues in the Communications, Media and Technology segment benefited from our technology clients' growing demand for services related to digital content. Products and Resources revenue growth was driven by increasing client interest in delivering cloud-based, data-driven enhanced customer experiences, the automotive industry’s shift toward electric and connected vehicles, and client investment in supply chain modernization and smart factory solutions. Revenue growth in the Health Sciences (previously referred to as Healthcare) segment was driven by increased demand for digital services among pharmaceutical companies. Financial services revenue growth reflects the growing demand for digital services, partially offset by the negative impact of the previously disclosed sale of the Samlink subsidiary, which was completed on February 1, 2022. We continue to experience pricing pressure on our non-digital services as our clients optimize the cost of supporting their legacy systems and operations.
1 Adjusted Diluted EPS and constant currency revenue growth are not measures of financial performance prepared in accordance with GAAP. See “Non-GAAP Financial Measures” for more information and reconciliations to the most directly comparable GAAP financial measures, as applicable.
| Cognizant Technology Solutions | 22 | June 30, 2022 Form 10-Q |
Operating margin increased to 15.5% for the quarter ended June 30, 2022, from 15.2% for the quarter ended June 30, 2021. Our 2022 operating margin was positively impacted by delivery efficiencies, economies of scale that allowed us to leverage our cost structure over a larger organization and the depreciation of the Indian rupee against the U.S. dollar, partially offset by increased compensation costs for our delivery personnel (including employees and subcontractors).
Business Outlook
As we seek to increase our commercial momentum and accelerate growth, our four strategic priorities are:
-
Accelerating digital - growing our digital business organically and inorganically;
-
Globalizing Cognizant - accelerating the growth of our business in key international markets and diversifying our leadership, capabilities and delivery footprint;
-
Increasing our relevance to our clients - ensuring industry-aligned thought leadership and capabilities to address clients' business needs; and
-
Repositioning our brand - improving our global brand recognition and becoming better known as a global digital partner to the entire C-suite.
We continue to expect the long-term focus of our clients to be on their digital transformation into software-driven, data-enabled, customer-centric and differentiated businesses. The COVID-19 pandemic accelerated our clients' need to modernize their business, which has led to increased demand for digital capabilities.
As our clients seek to optimize the cost of supporting their legacy systems and operations, our non-digital services have been, and may continue to be, subject to pricing pressure. In addition, clients will likely continue to contend with industry-specific changes driven by evolving digital technologies, uncertainty in the regulatory environment, industry consolidation and convergence as well as international trade policies and other macroeconomic factors, which could affect their demand for our services.
As a global professional services company, we compete on the basis of the knowledge, experience, insights, skills and talent of our employees and the value they can provide to our clients. Our success is dependent, in large part, on our ability to keep our supply of skilled employees, in particular those with experience in key digital areas, in balance with client demand. Competition for skilled employees in the current labor market is intense, and we continue to experience significantly elevated voluntary attrition. For the three months ended June 30, 2022, our annualized attrition, including both voluntary and involuntary, was 35.6% as compared to 31.4% for the three months ended June 30, 2021. Challenges attracting and retaining highly qualified personnel have resulted in increased cost of delivery and have negatively impacted our ability to satisfy client demand and achieve our full revenue potential. We expect these impacts to continue for at least the remainder of 2022. Further, our ongoing and anticipated future efforts with respect to recruitment, talent management and employee engagement may not be successful and are likely to continue to result in increased compensation costs. While we strive to adjust pricing to reduce the impact of compensation increases on our operating margin, we may not be successful in fully recovering these increases, which could adversely affect our profitability.
The invasion of Ukraine by Russia and the sanctions and other measures being imposed in response to this conflict have increased the level of economic and political uncertainty worldwide. We do not have employees, facilities or significant operations in either Russia or Ukraine and revenues generated from clients in both countries were immaterial in both 2021 and the first half of 2022. However, the continuation of the hostilities or the expansion of the current conflict’s scope into surrounding geographic areas could directly impact us, our clients, vendors or subcontractors, which could impact our operations and financial performance. We continue to monitor the situation closely to ensure business continuity plans are in place for neighboring countries where we have a presence.
Our future results may be affected by potential tax law changes and other potential regulatory changes, including possible U.S. corporate income tax reform and potentially increased costs for employment and post-employment benefits in India as a result of the Code on Social Security, 2020.
| Cognizant Technology Solutions | 23 | June 30, 2022 Form 10-Q |
| Results of Operations |
Three Months Ended June 30, 2022 Compared to Three Months Ended June 30, 2021
The following table sets forth, for the periods indicated, certain financial data for the three months ended June 30:
| % of | % of | Increase | |||||||||||||||||||||||||||||||||||||||||||||
| (Dollars in millions, except per share data) | 2022 | Revenues | 2021 | Revenues | $ | % | |||||||||||||||||||||||||||||||||||||||||
| Revenues | $ | 4,906 | 100.0 | $ | 4,585 | 100.0 | $ | 321 | 7.0 | ||||||||||||||||||||||||||||||||||||||
| Cost of revenues(a) | 3,119 | 63.6 | 2,863 | 62.4 | 256 | 8.9 | |||||||||||||||||||||||||||||||||||||||||
| Selling, general and administrative expenses(a) | 883 | 18.0 | 881 | 19.2 | 2 | 0.2 | |||||||||||||||||||||||||||||||||||||||||
| Depreciation and amortization expense | 144 | 2.9 | 145 | 3.2 | (1) | (0.7) | |||||||||||||||||||||||||||||||||||||||||
| Income from operations | 760 | 15.5 | 696 | 15.2 | 64 | 9.2 | |||||||||||||||||||||||||||||||||||||||||
| Other income (expense), net | 1 | (2) | 3 | * | |||||||||||||||||||||||||||||||||||||||||||
| Income before provision for income taxes | 761 | 15.5 | 694 | 15.1 | 67 | 9.7 | |||||||||||||||||||||||||||||||||||||||||
| Provision for income taxes | (184) | (184) | — | — | |||||||||||||||||||||||||||||||||||||||||||
| Income (loss) from equity method investments | — | 2 | (2) | (100.0) | |||||||||||||||||||||||||||||||||||||||||||
| Net income | $ | 577 | 11.8 | $ | 512 | 11.2 | $ | 65 | 12.7 | ||||||||||||||||||||||||||||||||||||||
| Diluted earnings per share | $ | 1.11 | $ | 0.97 | $ | 0.14 | 14.4 | ||||||||||||||||||||||||||||||||||||||||
| Other Financial Information**2 | |||||||||||||||||||||||||||||||||||||||||||||||
| Adjusted Diluted EPS | $ | 1.14 | $ | 0.99 | $ | 0.15 | 15.2 |
(a)Exclusive of depreciation and amortization expense
*Not meaningful
| Revenues - Overall |
During the quarter ended June 30, 2022, revenues increased by $321 million as compared to the quarter ended June 30, 2021, representing growth of 7.0%, or 9.5% on a constant currency basis2. Our recently completed acquisitions contributed 110 basis points to revenue growth. Revenue growth also reflected our clients' continued adoption and integration of digital technologies. We continue to experience pricing pressure on non-digital services as clients optimize the cost of supporting their legacy systems and operations. Revenues from clients added since June 30, 2021, including those related to acquisitions, were $107 million.
2 Adjusted Diluted EPS and constant currency revenue growth are not measures of financial performance prepared in accordance with GAAP. See “Non-GAAP Financial Measures” for more information and reconciliations to the most directly comparable GAAP financial measures, as applicable.
| Cognizant Technology Solutions | 24 | June 30, 2022 Form 10-Q |
| Revenues - Reportable Business Segments |
The following charts set forth revenues and change in revenues by business segment and geography for the three months ended June 30, 2022 as compared to the three months ended June 30, 2021:
| Financial Services | Health Sciences | |||||||||||||||||||||||||||||||||||||||||||||||||||||||||||||||||||||||||
| Increase / (Decrease) | Increase / (Decrease) | |||||||||||||||||||||||||||||||||||||||||||||||||||||||||||||||||||||||||
| Dollars in millions | Revenues | $ | % | CC 3 | Revenues | $ | % | **CC %**3 | ||||||||||||||||||||||||||||||||||||||||||||||||||||||||||||||||||
| North America | $ | 1,104 | 55 | 5.2 | 5.5 | $ | 1,210 | 79 | 7.0 | 7.0 | ||||||||||||||||||||||||||||||||||||||||||||||||||||||||||||||||
| United Kingdom | 147 | 17 | 13.1 | 22.3 | 44 | (1) | (2.2) | 6.1 | ||||||||||||||||||||||||||||||||||||||||||||||||||||||||||||||||||
| Continental Europe | 143 | (43) | (23.1) | (15.1) | 126 | 6 | 5.0 | 14.6 | ||||||||||||||||||||||||||||||||||||||||||||||||||||||||||||||||||
| Europe - Total | 290 | (26) | (8.2) | 0.3 | 170 | 5 | 3.0 | 12.3 | ||||||||||||||||||||||||||||||||||||||||||||||||||||||||||||||||||
| Rest of World | 148 | 11 | 8.0 | 13.5 | 28 | (1) | (3.4) | 4.8 | ||||||||||||||||||||||||||||||||||||||||||||||||||||||||||||||||||
| Total | $ | 1,542 | 40 | 2.7 | 5.1 | $ | 1,408 | 83 | 6.3 | 7.6 | ||||||||||||||||||||||||||||||||||||||||||||||||||||||||||||||||
| Products and Resources | Communications, Media and Technology | |||||||||||||||||||||||||||||||||||||||||||||||||||||||||||||||||||||||||
| Increase / (Decrease) | Increase / (Decrease) | |||||||||||||||||||||||||||||||||||||||||||||||||||||||||||||||||||||||||
| Dollars in millions | Revenues | $ | % | **CC %**3 | Revenues | $ | % | **CC %**3 | ||||||||||||||||||||||||||||||||||||||||||||||||||||||||||||||||||
| North America | $ | 770 | 47 | 6.5 | 6.8 | $ | 572 | 103 | 22.0 | 22.1 | ||||||||||||||||||||||||||||||||||||||||||||||||||||||||||||||||
| United Kingdom | 134 | 18 | 15.5 | 28.0 | 133 | 21 | 18.8 | 31.4 | ||||||||||||||||||||||||||||||||||||||||||||||||||||||||||||||||||
| Continental Europe | 143 | 11 | 8.3 | 21.7 | 33 | (11) | (25.0) | (14.0) | ||||||||||||||||||||||||||||||||||||||||||||||||||||||||||||||||||
| Europe - Total | 277 | 29 | 11.7 | 24.6 | 166 | 10 | 6.4 | 18.6 | ||||||||||||||||||||||||||||||||||||||||||||||||||||||||||||||||||
| Rest of World | 93 | 9 | 10.7 | 14.5 | 78 | — | — | 6.0 | ||||||||||||||||||||||||||||||||||||||||||||||||||||||||||||||||||
| Total | $ | 1,140 | 85 | 8.1 | 11.6 | $ | 816 | 113 | 16.1 | 19.5 |
| Financial Services - revenues increased 2.7%, or 5.1% on a constant currency basis**3 |
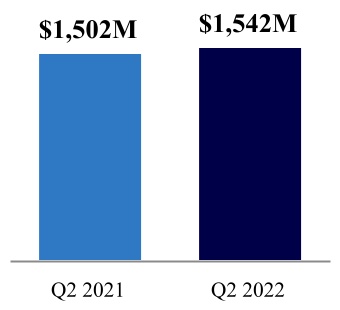
| Banking | é | $8M | |||||||||
| Insurance | é | $32M | |||||||||
Revenue growth reflects the growing demand for digital services among U.S. regional banks, public sector clients in the United Kingdom and insurance companies. The previously disclosed sale of the Samlink subsidiary, which was completed on February 1, 2022, negatively impacted revenue growth in this segment by 190 basis points. Revenues from clients added since June 30, 2021 were $22 million.3
| Health Sciences - revenues increased 6.3%, or 7.6% on a constant currency basis**3 |
Effective in the second quarter of 2022, we combined the healthcare operating segment with the life sciences operating segment and renamed our Healthcare reportable segment as Health Sciences. See Note 11 to our unaudited consolidated financial statements for additional information.
Revenue growth was driven by increased demand for digital services among pharmaceutical companies. Revenues from clients added since June 30, 2021 were $11 million.
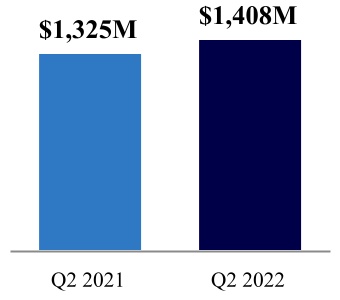
| é | $83M | ||||||||||
3 Constant currency revenue growth is not a measure of financial performance prepared in accordance with GAAP. See “Non-GAAP Financial Measures” for more information.
| Cognizant Technology Solutions | 25 | June 30, 2022 Form 10-Q |
| Products and Resources - revenues increased 8.1%, or 11.6% on a constant currency basis**4 |
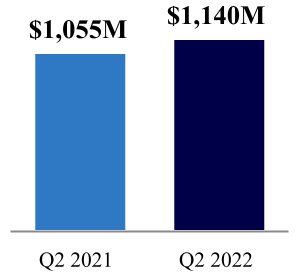
| Manufacturing, Logistics, Energy and Utilities | é | $40M | |||||||||||||||
| Retail and Consumer Goods | é | $30M | |||||||||||||||
| Travel and Hospitality | é | $15M | |||||||||||||||
Revenue growth in this segment was primarily driven by increased client interest in delivering cloud-based, data-driven enhanced customer experiences, the automotive industry’s shift toward electric and connected vehicles, and client investment in supply chain modernization and smart factory solutions. Revenue growth in this segment included approximately 260 basis points related to recently completed acquisitions. Revenues from clients added since June 30, 2021 were $36 million.4
| Communications, Media and Technology - revenues increased 16.1%, or 19.5% on a constant currency basis**4 |
In 2022, we combined the communications and media operating segment with the technology operating segment. See Note 11 to our unaudited consolidated financial statements for additional information.
Revenues in this segment reflected growing demand from our technology clients for services related to digital content, primarily driven by the largest clients in this segment, as well as demand for personalized user experiences and data modernization. Revenues from clients added since June 30, 2021 were $38 million.
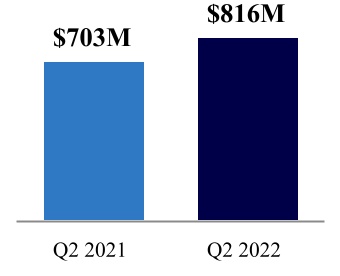
| é | $113M | ||||||||||||||||
| Revenues - Geographic Markets |
Revenues of $4,906 million by geographic market were as follows for the three months ended June 30, 2022:

| Q2 2022 as compared to Q2 2021 | Increase | ||||||||||||||||||||||||||||||||||
| (Dollars in millions) | $ | % | **CC %**4 | ||||||||||||||||||||||||||||||||
| North America | $ | 284 | 8.4 | 8.6 | |||||||||||||||||||||||||||||||
| United Kingdom | 55 | 13.6 | 24.7 | ||||||||||||||||||||||||||||||||
| Continental Europe | (37) | (7.7) | 2.5 | ||||||||||||||||||||||||||||||||
| Europe - Total | 18 | 2.0 | 12.6 | ||||||||||||||||||||||||||||||||
| Rest of World | 19 | 5.8 | 11.2 | ||||||||||||||||||||||||||||||||
| Total revenues | $ | 321 | 7.0 | 9.5 |
North America continues to be our largest market, representing 74.5% of total revenues. Outside of the North America region, revenues were negatively impacted by foreign currency exchange rate movements. Revenue growth in the United Kingdom was strong among Financial Services clients, including certain public sector clients, Products and Resources clients, and Communications, Media and Technology clients. Revenue decline in the Continental Europe region includes a negative 600 basis points impact from the previously disclosed sale of the Samlink subsidiary, which was completed on February 1, 2022, and was partially offset by growth in the German market, which benefited from recent acquisitions.
| Cost of Revenues (Exclusive of Depreciation and Amortization Expense) |
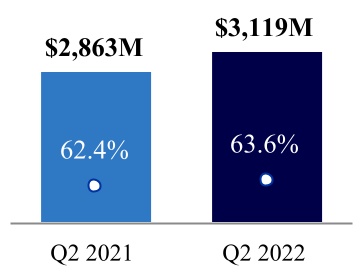
| é | $256M | |||||||||||||
| é | 1.2% as a % of revenues | |||||||||||||
| ¡ | % of Revenues | |||||||||||||
Our cost of revenues consists primarily of salaries, incentive-based compensation, stock-based compensation expense, employee benefits, project-related immigration and travel for technical personnel, subcontracting and equipment costs relating to revenues. The increase, as a percentage of revenues, was due to higher compensation costs for delivery personnel (including employees and subcontractors), partially offset by delivery efficiencies and the depreciation of the Indian rupee against the U.S. dollar. Challenges attracting and retaining highly qualified personnel have resulted and are likely to continue to result in higher compensation costs.
4 Constant currency revenue growth is not a measure of financial performance prepared in accordance with GAAP. See “Non-GAAP Financial Measures” for more information.
| Cognizant Technology Solutions | 26 | June 30, 2022 Form 10-Q |
| SG&A Expenses (Exclusive of Depreciation and Amortization Expense) |
SG&A expenses consist primarily of salaries, incentive-based compensation, stock-based compensation expense, employee benefits, immigration, travel, marketing, communications, management, finance, administrative and occupancy costs. The decrease, as a percentage of revenues, was primarily due to economies of scale that allowed us to leverage our cost structure over a larger organization, the beneficial impact of foreign currency exchange rate movements and the optimization of non-strategic SG&A expenses.

| é | $2M | |||||||||||||
| ê | 1.2% as a % of revenues | |||||||||||||
| ¡ | % of Revenues | |||||||||||||
| Depreciation and Amortization Expense |
Depreciation and amortization expense decreased by 0.7%, or 0.3% as a percentage of revenues, during the second quarter of 2022 as compared to the second quarter of 2021.
| Operating Margin - Overall |
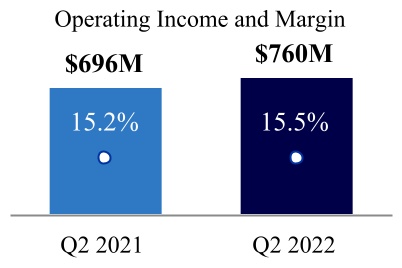
| é | $64M | |||||||||||||
| é | 0.3% as a % of revenues | |||||||||||||
| ¡ | % of Revenues | |||||||||||||
The 2022 operating margin was positively impacted by delivery efficiencies, economies of scale that allowed us to leverage our cost structure over a larger organization and the depreciation of the Indian rupee against the U.S. dollar partially offset by increased compensation costs for our delivery personnel (including employees and subcontractors).
Excluding the impact of applicable designated cash flow hedges, the depreciation of the Indian rupee against the U.S. dollar positively impacted our operating margin by approximately 80 basis points during the three months ended June 30, 2022. Each additional 1.0% change in exchange rate between the Indian rupee and the U.S. dollar will have the effect of moving our operating margin by 18 basis points.
We enter into foreign exchange derivative contracts to hedge certain Indian rupee denominated payments in India. These hedges are intended to mitigate the volatility of the changes in the exchange rate between the U.S. dollar and the Indian rupee. The settlement of our cash flow hedges positively impacted our operating margin by 12 basis points during the three months ended June 30, 2022 and by 31 basis points during the three months ended June 30, 2021.
We finished the second quarter of 2022 with approximately 341,300 employees. Annualized attrition, including both voluntary and involuntary, was approximately 35.6% for the three months ended June 30, 2022. In both 2021 and 2022, voluntary attrition constituted the vast majority of attrition for the period. Attrition in all periods presented is weighted towards our more junior employees.
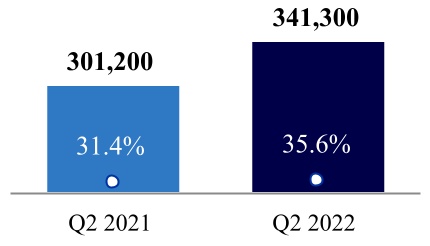
| ¡ Annualized attrition | |||||||||||
| Segment Operating Profit |
In 2022, we made certain changes to the internal measurement of segment operating profits for the purpose of evaluating segment performance and resource allocation. The primary reason for the change was to charge to the business segments costs that are directly managed and controlled by them. Specifically, segment operating profit now includes costs related to non-delivery personnel that support consulting services, which were previously included in "unallocated costs." We have reported 2022 segment operating profits using the new allocation methodology and have recast the 2021 results to conform to the new methodology.
| Cognizant Technology Solutions | 27 | June 30, 2022 Form 10-Q |
Segment operating profit and operating margin percentage were as follows:
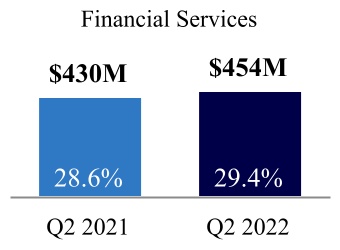

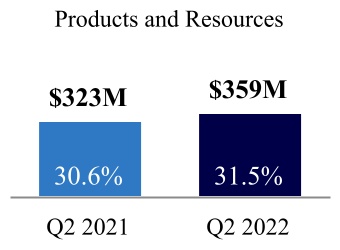
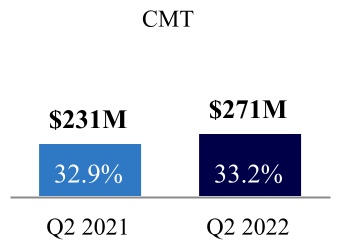
In 2022, segment operating margins benefited from delivery efficiencies and the depreciation of the Indian rupee against the U.S. dollar partially offset by increased compensation costs for delivery personnel (including employees and subcontractors). The 2022 Health Sciences segment operating margin was additionally negatively affected by investments to support revenue growth and elevated pricing pressure on non-digital services.
Total segment operating profit and operating margin were as follows for the three months ended June 30:
| (Dollars in millions) | 2022 | % of Revenues | 2021 | % of Revenues | Increase / (Decrease) | ||||||||||||||||||||||||
| Total segment operating profit | $ | 1,472 | 30.0 | $ | 1,366 | 29.8 | $ | 106 | |||||||||||||||||||||
| Less: unallocated costs | 712 | 670 | 42 | ||||||||||||||||||||||||||
| Income from operations | $ | 760 | 15.5 | $ | 696 | 15.2 | $ | 64 |
| Other Income (Expense), Net |
The following table sets forth total other income (expense), net for the three months ended June 30:
| (in millions) | 2022 | 2021 | Increase/ Decrease | ||||||||||||||||||||
| Foreign currency exchange (losses) | $ | (36) | $ | (10) | $ | (26) | |||||||||||||||||
| Gains on foreign exchange forward contracts not designated as hedging instruments | 32 | 3 | 29 | ||||||||||||||||||||
| Foreign currency exchange gains (losses), net | (4) | (7) | 3 | ||||||||||||||||||||
| Interest income | 9 | 7 | 2 | ||||||||||||||||||||
| Interest expense | (3) | (2) | (1) | ||||||||||||||||||||
| Other, net | (1) | — | (1) | ||||||||||||||||||||
| Total other income (expense), net | $ | 1 | $ | (2) | $ | 3 |
The foreign currency exchange losses were attributed to the remeasurement of net monetary assets and liabilities denominated in currencies other than the functional currencies of our subsidiaries. The gains on foreign exchange forward contracts not designated as hedging instruments related to the realized and unrealized gains and losses on contracts entered into to offset our foreign currency exposures. As of June 30, 2022, the notional value of our undesignated hedges was $1,072 million.
| Provision for Income Taxes |
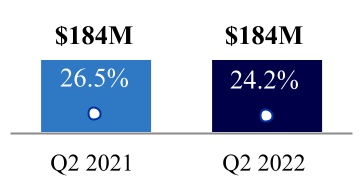
| ¡ Effective Income Tax Rate ê 2.3% | ||||||||||||||
The effective income tax rate decreased as a result of higher discrete income tax benefits, primarily related to our undistributed foreign earnings, in the second quarter of 2022 as compared to the second quarter of 2021.
| Net Income |
The increase in net income was driven by higher income from operations and a lower effective income tax rate.

| é | $65M | |||||||||||||
| ¡ é 0.6% of Revenues | ||||||||||||||
| Cognizant Technology Solutions | 28 | June 30, 2022 Form 10-Q |
Non-GAAP Financial Measures
Portions of our disclosure include non-GAAP financial measures. These non-GAAP financial measures are not based on any comprehensive set of accounting rules or principles and should not be considered a substitute for, or superior to, financial measures calculated in accordance with GAAP, and may be different from non-GAAP financial measures used by other companies. In addition, these non-GAAP financial measures should be read in conjunction with our financial statements prepared in accordance with GAAP. The reconciliations of non-GAAP financial measures to the corresponding GAAP measures, set forth below, should be carefully evaluated.
Adjusted Diluted EPS excludes unusual items, net non-operating foreign currency exchange gains or losses and the tax impact of all the applicable adjustments. The income tax impact of each item is calculated by applying the statutory rate and local tax regulations in the jurisdiction in which the item was incurred. Constant currency revenue growth is defined as revenues for a given period restated at the comparative period’s foreign currency exchange rates measured against the comparative period's reported revenues.
We believe providing investors with an operating view consistent with how we manage the Company provides enhanced transparency into our operating results. For internal management reporting and budgeting purposes, we use various GAAP and non-GAAP financial measures for financial and operational decision-making, to evaluate period-to-period comparisons, to determine portions of the compensation for executive officers and for making comparisons of our operating results to those of our competitors. We believe that the presentation of non-GAAP financial measures, which exclude certain costs, along with reconciliations to the most comparable GAAP measure, as applicable, can provide useful supplemental information to our management and investors regarding financial and business trends relating to our financial condition and results of operations.
A limitation of using non-GAAP financial measures versus financial measures calculated in accordance with GAAP is that non-GAAP financial measures may exclude costs that are recurring such as net non-operating foreign currency exchange gains or losses. In addition, other companies may calculate non-GAAP financial measures differently than us, thereby limiting the usefulness of these non-GAAP financial measures as a comparative tool. We compensate for these limitations by providing specific information regarding the GAAP amounts excluded from non-GAAP financial measures to allow investors to evaluate such non-GAAP financial measures.
The following table presents a reconciliation of each non-GAAP financial measure to the most comparable GAAP measure for the three months ended June 30:
| 2022 | 2021 | ||||||||||||||||||||||
| GAAP diluted EPS | $ | 1.11 | $ | 0.97 | |||||||||||||||||||
| Non-operating foreign currency exchange (gains) losses, pre-tax (1) | 0.01 | 0.01 | |||||||||||||||||||||
| Tax effect of non-operating foreign currency exchange (gains) losses (2) | 0.02 | 0.01 | |||||||||||||||||||||
| Adjusted Diluted EPS | $ | 1.14 | $ | 0.99 | |||||||||||||||||||
(1)Non-operating foreign currency exchange gains and losses, inclusive of gains and losses on related foreign exchange forward contracts not designated as hedging instruments for accounting purposes, are reported in "Foreign currency exchange gains (losses), net" in our unaudited consolidated statements of operations.
(2)Presented below are the tax impacts of each of our non-GAAP adjustments to pre-tax income:
| Three Months Ended June 30, | |||||||||||
| (in millions) | 2022 | 2021 | |||||||||
| Non-GAAP income tax (expense) related to: | |||||||||||
| Foreign currency exchange gains and losses | $ | (14) | $ | (6) |
The effective tax rate related to non-operating foreign currency exchange gains and losses varies depending on the jurisdictions in which such income and expenses are generated and the statutory rates applicable in those jurisdictions. As such, the income tax effect of non-operating foreign currency exchange gains and losses shown in the above table may not appear proportionate to the net pre-tax foreign currency exchange gains and losses reported in our unaudited consolidated statements of operations.
| Cognizant Technology Solutions | 29 | June 30, 2022 Form 10-Q |
Six Months Ended June 30, 2022 Compared to Six Months Ended June 30, 2021
The following table sets forth, for the periods indicated, certain financial data for the six months ended June 30:
| % of | % of | Increase / Decrease | |||||||||||||||||||||||||||||||||||||||
| (Dollars in millions, except per share data) | 2022 | Revenues | 2021 | Revenues | $ | % | |||||||||||||||||||||||||||||||||||
| Revenues | $ | 9,732 | 100.0 | $ | 8,986 | 100.0 | $ | 746 | 8.3 | ||||||||||||||||||||||||||||||||
| Cost of revenues(a) | 6,216 | 63.9 | 5,627 | 62.6 | 589 | 10.5 | |||||||||||||||||||||||||||||||||||
| Selling, general and administrative expenses(a) | 1,745 | 17.9 | 1,708 | 19.0 | 37 | 2.2 | |||||||||||||||||||||||||||||||||||
| Depreciation and amortization expense | 287 | 2.9 | 286 | 3.2 | 1 | 0.3 | |||||||||||||||||||||||||||||||||||
| Income from operations | 1,484 | 15.2 | 1,365 | 15.2 | 119 | 8.7 | |||||||||||||||||||||||||||||||||||
| Other income (expense), net | 6 | (6) | 12 | * | |||||||||||||||||||||||||||||||||||||
| Income before provision for income taxes | 1,490 | 15.3 | 1,359 | 15.1 | 131 | 9.6 | |||||||||||||||||||||||||||||||||||
| Provision for income taxes | (354) | (344) | (10) | 2.9 | |||||||||||||||||||||||||||||||||||||
| Income (loss) from equity method investments | 4 | 2 | 2 | 100.0 | |||||||||||||||||||||||||||||||||||||
| Net income | $ | 1,140 | 11.7 | $ | 1,017 | 11.3 | $ | 123 | 12.1 | ||||||||||||||||||||||||||||||||
| Diluted EPS | $ | 2.18 | $ | 1.92 | $ | 0.26 | 13.5 | ||||||||||||||||||||||||||||||||||
| Other Financial Information**5 | |||||||||||||||||||||||||||||||||||||||||
| Adjusted Diluted EPS | $ | 2.23 | $ | 1.96 | $ | 0.27 | 13.8 |
(a)Exclusive of depreciation and amortization expense.
*Not meaningful
| Revenues - Overall |
During the six months ended June 30, 2022, revenues increased by $746 million as compared to the six months ended June 30, 2021, representing growth of 8.3%, or 10.2% on a constant currency basis5. Our recently completed acquisitions contributed 160 basis points to revenue growth. Revenue growth also reflected our clients' continued adoption and integration of digital technologies. We continue to experience pricing pressure on non-digital services as clients optimize the cost of supporting their legacy systems and operations. In addition, our revenues from clients added since June 30, 2021, including those related to acquisitions, were $179 million.
5 Adjusted Diluted EPS and constant currency revenue growth are not measures of financial performance prepared in accordance with GAAP. See “Non-GAAP Financial Measures” for more information and reconciliations to the most directly comparable GAAP financial measures.
| Cognizant Technology Solutions | 30 | June 30, 2022 Form 10-Q |
Revenues - Reportable Business Segments
The following charts set forth revenues and change in revenues by business segment and geography for the six months ended June 30, 2022 as compared to the six months ended June 30, 2021:
| Financial Services | Health Sciences | |||||||||||||||||||||||||||||||||||||||||||||||||||||||||||||||||||||||||
| Increase / (Decrease) | Increase / (Decrease) | |||||||||||||||||||||||||||||||||||||||||||||||||||||||||||||||||||||||||
| Dollars in millions | Revenues | $ | % | **CC %**6 | Revenues | $ | % | **CC %**6 | ||||||||||||||||||||||||||||||||||||||||||||||||||||||||||||||||||
| North America | $ | 2,184 | 122 | 5.9 | 6.0 | $ | 2,405 | 173 | 7.8 | 7.8 | ||||||||||||||||||||||||||||||||||||||||||||||||||||||||||||||||
| United Kingdom | 298 | 43 | 16.9 | 22.9 | 88 | 3 | 3.5 | 9.8 | ||||||||||||||||||||||||||||||||||||||||||||||||||||||||||||||||||
| Continental Europe | 300 | (78) | (20.6) | (14.2) | 246 | 8 | 3.4 | 10.8 | ||||||||||||||||||||||||||||||||||||||||||||||||||||||||||||||||||
| Europe - Total | 598 | (35) | (5.5) | 0.7 | 334 | 11 | 3.4 | 10.6 | ||||||||||||||||||||||||||||||||||||||||||||||||||||||||||||||||||
| Rest of World | 288 | 23 | 8.7 | 13.4 | 61 | 3 | 5.2 | 11.5 | ||||||||||||||||||||||||||||||||||||||||||||||||||||||||||||||||||
| Total | $ | 3,070 | 110 | 3.7 | 5.5 | $ | 2,800 | 187 | 7.2 | 8.2 | ||||||||||||||||||||||||||||||||||||||||||||||||||||||||||||||||
| Products and Resources | Communications, Media and Technology | |||||||||||||||||||||||||||||||||||||||||||||||||||||||||||||||||||||||||
| Increase / (Decrease) | Increase / (Decrease) | |||||||||||||||||||||||||||||||||||||||||||||||||||||||||||||||||||||||||
| Dollars in millions | Revenues | $ | % | **CC %**6 | Revenues | $ | % | **CC %**6 | ||||||||||||||||||||||||||||||||||||||||||||||||||||||||||||||||||
| North America | $ | 1,531 | 90 | 6.2 | 6.4 | $ | 1,105 | 185 | 20.1 | 20.2 | ||||||||||||||||||||||||||||||||||||||||||||||||||||||||||||||||
| United Kingdom | 266 | 44 | 19.8 | 28.1 | 259 | 48 | 22.7 | 32.2 | ||||||||||||||||||||||||||||||||||||||||||||||||||||||||||||||||||
| Continental Europe | 288 | 53 | 22.6 | 34.2 | 70 | (17) | (19.5) | (10.8) | ||||||||||||||||||||||||||||||||||||||||||||||||||||||||||||||||||
| Europe - Total | 554 | 97 | 21.2 | 31.2 | 329 | 31 | 10.4 | 19.7 | ||||||||||||||||||||||||||||||||||||||||||||||||||||||||||||||||||
| Rest of World | 185 | 30 | 19.4 | 22.8 | 158 | 16 | 11.3 | 16.7 | ||||||||||||||||||||||||||||||||||||||||||||||||||||||||||||||||||
| Total | $ | 2,270 | 217 | 10.6 | 13.2 | $ | 1,592 | 232 | 17.1 | 19.7 |
| Financial Services - revenues increased 3.7%, or 5.5% on a constant currency basis**6 |

| Banking | é | $27M | |||||||||
| Insurance | é | $83M | |||||||||
Revenue growth reflects the growing demand for digital services among U.S. regional banks, public sector clients in the United Kingdom and insurance companies. The previously disclosed sale of the Samlink subsidiary, which was completed on February 1, 2022, negatively impacted revenue growth in this segment by 160 basis points.6Revenues from clients added since June 30, 2021 were $39 million.
| Health Sciences - revenues increased 7.2%, or 8.2% on a constant currency basis**6 |
Effective in the second quarter of 2022, we combined the healthcare operating segment with the life sciences operating segment and renamed our Healthcare reportable segment to Health Sciences. See Note 11 to our unaudited consolidated financial statements for additional information.
Revenue growth was driven by increased demand for digital services among pharmaceutical companies. Revenues from clients added since June 30, 2021 were $19 million.
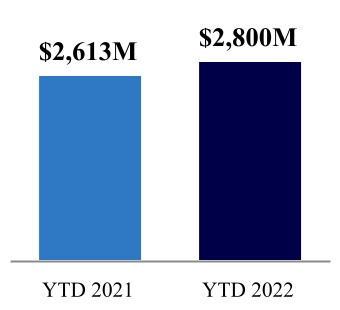
| é | $187M | ||||||||||
6 Constant currency revenue growth is not a measure of financial performance prepared in accordance with GAAP. See “Non-GAAP Financial Measures” for more information.
| Cognizant Technology Solutions | 31 | June 30, 2022 Form 10-Q |
| Products and Resources - revenues increased 10.6%, or 13.2% on a constant currency basis**7 |
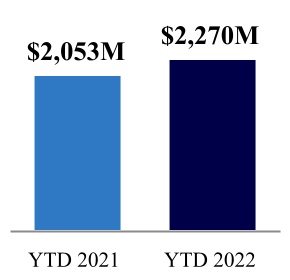
| Manufacturing, Logistics, Energy and Utilities | é | $113M | ||||||||||||
| Retail and Consumer Goods | é | $72M | ||||||||||||
| Travel and Hospitality | é | $32M | ||||||||||||
Revenue growth in this segment was primarily driven by increased client interest in delivering cloud-based, data-driven enhanced customer experiences, the automotive industry’s shift toward electric and connected vehicles, and client investment in supply chain modernization and smart factory solutions. Revenue growth in this segment included approximately 370 basis points related to recently completed acquisitions. Revenues from clients added since June 30, 2021 were $57 million.7
| Communications, Media and Technology - revenues increased 17.1%, or 19.7% on a constant currency basis**7 |
In 2022, we combined the communications and media operating segment with the technology operating segment. See Note 11 to our unaudited consolidated financial statements for additional information.
Revenues in this segment reflected growing demand from our technology clients for services related to digital content, primarily driven by the largest clients in this segment, as well as demand for personalized user experiences and data modernization. Revenues from clients added since June 30, 2021 were $64 million.
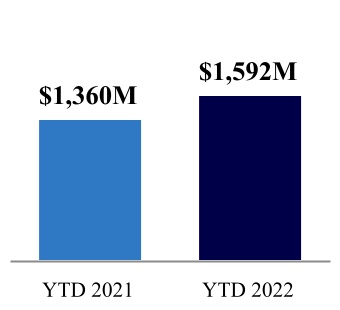
| é | $232M | ||||||||||||||||
| Revenues - Geographic Markets |
Revenues of $9,732 million by geographic market were as follows for the six months ended June 30, 2022:

| YTD 2022 as compared to YTD 2021 | Increase / (Decrease) | ||||||||||||||||||||||||||||||||||
| (Dollars in millions) | $ | % | **CC %**7 | ||||||||||||||||||||||||||||||||
| North America | $ | 570 | 8.6 | 8.7 | |||||||||||||||||||||||||||||||
| United Kingdom | 138 | 17.9 | 25.5 | ||||||||||||||||||||||||||||||||
| Continental Europe | (34) | (3.6) | 4.6 | ||||||||||||||||||||||||||||||||
| Europe - Total | 104 | 6.1 | 14.0 | ||||||||||||||||||||||||||||||||
| Rest of World | 72 | 11.6 | 16.3 | ||||||||||||||||||||||||||||||||
| Total revenues | $ | 746 | 8.3 | 10.2 |
North America continues to be our largest market, representing 74.2% of total revenues for the six months ended June 30, 2022. Outside of our North America region, revenues were negatively impacted by foreign currency exchange rate movements. Revenue growth in the United Kingdom was strong among Financial Services clients, including certain public sector clients, Products and Resources clients, and Communications, Media and Technology clients. Revenue decline in the Continental Europe region includes a negative 510 basis points impact from the previously disclosed sale of the Samlink subsidiary, which was completed on February 1, 2022, and was partially offset by growth in the German market, which benefited from recent acquisitions. Revenue growth in the Rest of World region was primarily driven by the Australian market, which benefited from an acquisition that closed in the first half of 2021.
7 Constant currency revenue growth is not a measure of financial performance prepared in accordance with GAAP. See “Non-GAAP Financial Measures” for more information.
| Cognizant Technology Solutions | 32 | June 30, 2022 Form 10-Q |
| Cost of Revenues (Exclusive of Depreciation and Amortization Expense) |
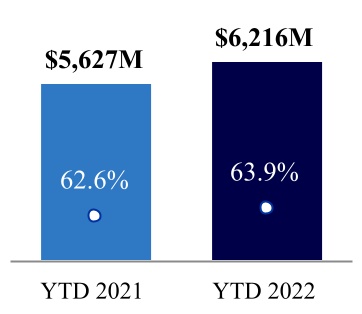
| é | $589M | |||||||||||||
| é | 1.3% as a % of revenues | |||||||||||||
| ¡ | % of Revenues | |||||||||||||
Our cost of revenues consists primarily of salaries, incentive-based compensation, stock-based compensation expense, employee benefits, project-related immigration and travel for technical personnel, subcontracting and equipment costs relating to revenues. The increase, as a percentage of revenues, was due to higher compensation costs for delivery personnel (including employees and subcontractors), partially offset by delivery efficiencies and the depreciation of the Indian rupee against the U.S. dollar. Challenges attracting and retaining highly qualified personnel have resulted and are likely to continue to result in higher compensation costs.
| SG&A Expenses (Exclusive of Depreciation and Amortization Expense) |
SG&A expenses consist primarily of salaries, incentive-based compensation, stock-based compensation expense, employee benefits, immigration, travel, marketing, communications, management, finance, administrative and occupancy costs. The decrease, as a percentage of revenues, was primarily due to economies of scale that allowed us to leverage our cost structure over a larger organization and the optimization of non-strategic SG&A expenses.
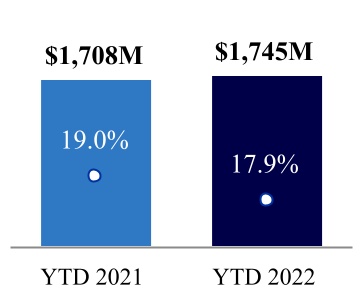
| é | $37M | |||||||||||||
| ê | 1.1% as a % of revenues | |||||||||||||
| ¡ | % of Revenues | |||||||||||||
| Depreciation and Amortization Expense |
Depreciation and amortization expense increased 0.3%, or decreased 0.3% as a percentage of revenues, during the six months ended June 30, 2022 as compared to the 2021 period.
| Operating Margin - Overall |
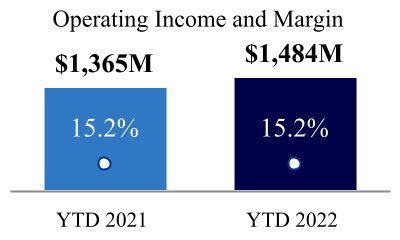
| é | $119 million | |||||||||||||
| Flat as a % of revenue | ||||||||||||||
| ¡ | % of Revenues | |||||||||||||
The 2022 operating margin was positively impacted by delivery efficiencies, economies of scale that allowed us to leverage our cost structure over a larger organization and the depreciation of the Indian rupee against the U.S. dollar, offset by increased compensation costs for our delivery personnel (including employees and subcontractors).
Excluding the impact of applicable designated cash flow hedges, the depreciation of the Indian rupee against the U.S. dollar positively impacted our operating margin by approximately 70 basis points during the six months ended June 30, 2022. Each additional 1.0% change in exchange rate between the Indian rupee and the U.S. dollar will have the effect of moving our operating margin by approximately 18 basis points.
We enter into foreign exchange derivative contracts to hedge certain Indian rupee denominated payments in India. These hedges are intended to mitigate the volatility of the changes in the exchange rate between the U.S. dollar and the Indian rupee. The settlement of our cash flow hedges positively impacted our operating margin by 20 basis points during the six months ended June 30, 2022 and by 39 basis points during the 2021 period.
| Cognizant Technology Solutions | 33 | June 30, 2022 Form 10-Q |
| Segment Operating Profit |
In 2022, we made certain changes to the internal measurement of segment operating profits for the purpose of evaluating segment performance and resource allocation. The primary reason for the change was to charge to the business segments costs that are directly managed and controlled by them. Specifically, segment operating profit now includes costs related to non-delivery personnel that support consulting services, which were previously included in "unallocated costs." We have reported 2022 segment operating profits using the new allocation methodology and have recast the 2021 results to conform to the new methodology. Segment operating profit and operating margin percentage were as follows:
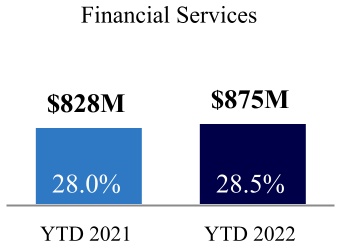
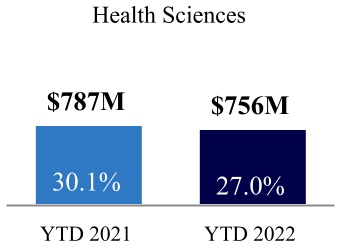
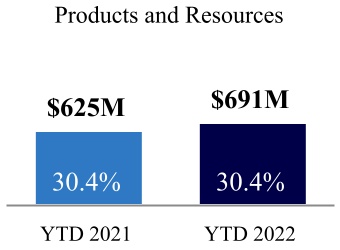
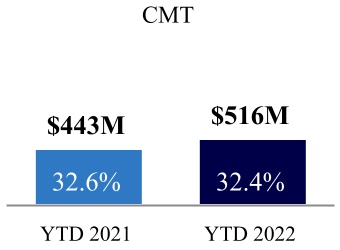
In 2022, segment operating margins were negatively impacted by increased compensation costs for delivery personnel (including employees and subcontractors), partially offset by delivery efficiencies and the depreciation of the Indian rupee against the U.S. dollar. The 2022 Financial Services segment operating margin reflects the gain on sale of the Samlink subsidiary while the 2022 Health Sciences segment operating margin was negatively affected by investments to support revenue growth and elevated pricing pressure on non-digital services.
Total segment operating profit and margin were as follows for the six months ended June 30:
| (Dollars in millions) | 2022 | % of Revenues | 2021 | % of Revenues | Increase / (Decrease) | ||||||||||||||||||||||||
| Total segment operating profit | $ | 2,838 | 29.2 | $ | 2,683 | 29.9 | $ | 155 | |||||||||||||||||||||
| Less: unallocated costs | 1,354 | 1,318 | 36 | ||||||||||||||||||||||||||
| Income from operations | $ | 1,484 | 15.2 | $ | 1,365 | 15.2 | $ | 119 |
| Other Income (Expense), Net |
The following table sets forth total other income (expense), net for the six months ended June 30:
| (in millions) | 2022 | 2021 | Increase/ Decrease | ||||||||||||||||||||
| Foreign currency exchange (losses) | $ | (49) | $ | (22) | $ | (27) | |||||||||||||||||
| Gains on foreign exchange forward contracts not designated as hedging instruments | 45 | 6 | 39 | ||||||||||||||||||||
| Foreign currency exchange gains (losses), net | (4) | (16) | 12 | ||||||||||||||||||||
| Interest income | 15 | 16 | (1) | ||||||||||||||||||||
| Interest expense | (5) | (4) | (1) | ||||||||||||||||||||
| Other, net | — | (2) | 2 | ||||||||||||||||||||
| Total other income (expense), net | $ | 6 | $ | (6) | $ | 12 |
The foreign currency exchange losses were attributed to the remeasurement of net monetary assets and liabilities denominated in currencies other than the functional currencies of our subsidiaries. The gains on foreign exchange forward contracts not designated as hedging instruments related to the realized and unrealized gains and losses on contracts entered into to offset our foreign currency exposures.
| Cognizant Technology Solutions | 34 | June 30, 2022 Form 10-Q |
| Provision for Income Taxes |
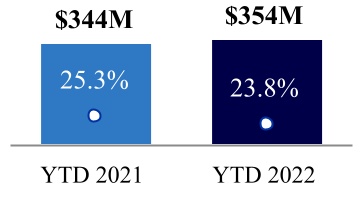
| é | $10M | |||||||||||||
| ¡ Effective Income Tax Rate ê 1.5% | ||||||||||||||
The effective income tax rate decreased as a result of higher discrete tax benefits, primarily related to our undistributed foreign earnings, in the six months ended June 30, 2022 as compared to the 2021 period.
| Net Income |
The increase in net income was driven by higher income from operations and a lower effective income tax rate.

| é | $123M | ||||||||||||||||
| ¡ é 0.4% of Revenues | |||||||||||||||||
Non-GAAP Financial Measures
See “Three Months Ended June 30, 2022 Compared to Three Months Ended June 30, 2021 – Non-GAAP Financial Measures” above for additional information about our use of non-GAAP financial measures.
The following table presents a reconciliation of each non-GAAP financial measure to the most comparable GAAP measure for the six months ended June 30:
| (Dollars in millions, except per share amounts) | 2022 | 2021 | |||||||||||||||||||||
| GAAP diluted EPS | $ | 2.18 | $ | 1.92 | |||||||||||||||||||
| Non-operating foreign currency exchange (gains) losses, pre-tax (1) | 0.01 | 0.03 | |||||||||||||||||||||
| Tax effect of non-operating foreign currency exchange (gains) losses (2) | 0.04 | 0.01 | |||||||||||||||||||||
| Adjusted Diluted EPS | $ | 2.23 | $ | 1.96 | |||||||||||||||||||
(1)Non-operating foreign currency exchange gains and losses, inclusive of gains and losses on related foreign exchange forward contracts not designated as hedging instruments for accounting purposes, are reported in "Foreign currency exchange gains (losses), net" in our unaudited consolidated statements of operations.
(2)Presented below are the tax impacts of each of our non-GAAP adjustments to pre-tax income:
| (in millions) | Six Months Ended June 30, | ||||||||||
| 2022 | 2021 | ||||||||||
| Non-GAAP income tax benefit (expense) related to: | |||||||||||
| Foreign currency exchange gains and losses | (20) | (6) |
The effective tax rate related to non-operating foreign currency exchange gains and losses varies depending on the jurisdictions in which such income and expenses are generated and the statutory rates applicable in those jurisdictions. As such, the income tax effect of non-operating foreign currency exchange gains and losses shown in the above table may not appear proportionate to the net pre-tax foreign currency exchange gains and losses reported in our unaudited consolidated statements of operations.
| Cognizant Technology Solutions | 35 | June 30, 2022 Form 10-Q |
| Liquidity and Capital Resources |
Our cash generated from operations has historically been the primary source of liquidity to fund operations and investments to grow our business. As of June 30, 2022, we had cash, cash equivalents and short-term investments of $2,320 million and available capacity under our credit facilities of approximately $1,915 million.
The following table provides a summary of cash flows for the six months ended June 30:
| (in millions) | 2022 | 2021 | Increase / Decrease | |||||||||||||||||||||||
| Net cash provided by (used in): | ||||||||||||||||||||||||||
| Operating activities | $ | 834 | $ | 722 | $ | 112 | ||||||||||||||||||||
| Investing activities | 229 | (1,259) | 1,488 | |||||||||||||||||||||||
| Financing activities | (1,050) | (768) | (282) | |||||||||||||||||||||||
Operating activities
The increase in cash provided by operating activities for the six months ended June 30, 2022 as compared to the six months ended June 30, 2021 was primarily driven by higher income from operations.
We monitor turnover, aging and the collection of accounts receivable by client. Our DSO calculation includes receivables, net of allowance for doubtful accounts, and contract assets, reduced by the uncollected portion of deferred revenue. Our DSO was 74 days as of June 30, 2022, 71 days as of June 30, 2021, and 69 days as of December 31, 2021, increasing as revenue growth outpaced collections.
Investing activities
The net cash provided by investing activities for the six months ended June 30, 2022 was primarily driven by net maturities of investments, partially offset by capital expenditures. Net cash used in investing activities for the six months ended June 30, 2021 was driven by cash used for acquisitions, net purchases of investments and capital expenditures.
Financing activities
The increase in cash used in financing activities for the six months ended June 30, 2022 as compared to the six months ended June 30, 2021 was primarily driven by higher repurchases of common stock.
The Credit Agreement provides for a $750 million Term Loan and a $1,750 million unsecured revolving credit facility, which are due to mature in November 2023. We are required under the Credit Agreement to make scheduled quarterly principal payments on the Term Loan. As of June 30, 2022, we had no outstanding balance on the revolving credit facility. See Note 5 to our unaudited consolidated financial statements.
In March 2022, our India subsidiary renewed its one-year 13 billion Indian rupee ($165 million at the June 30, 2022 exchange rate) working capital facility, which requires us to repay any balances drawn down within 90 days from the date of disbursement. There is a 1.0% prepayment penalty applicable to payments made within 30 days after disbursement. This working capital facility contains affirmative and negative covenants and may be renewed annually. As of June 30, 2022, we have not borrowed funds under this facility.
Capital Allocation

| Acquisitions | |||||
| Share Repurchases | |||||
| Dividend payments | |||||
We review our capital allocation framework on an ongoing basis, considering our financial performance and liquidity position, investments required to execute our strategic plans and initiatives, acquisition opportunities, the economic outlook, regulatory changes, the potential impacts of the COVID-19 pandemic and other relevant factors. As these factors may change over time, the actual amounts expended on stock repurchase activity, dividends, and acquisitions, if any, during any particular period cannot be predicted and may fluctuate from time to time. While we have not completed any acquisitions in 2022, our longer-term capital allocation framework is unchanged.
| Cognizant Technology Solutions | 36 | June 30, 2022 Form 10-Q |
Other Liquidity and Capital Resources Information
We seek to ensure that our worldwide cash is available in the locations in which it is needed. As part of ongoing liquidity assessments, we regularly monitor the mix of domestic and international cash flows and cash balances. We evaluate on an ongoing basis what portion of the non-U.S. cash, cash equivalents and short-term investments is needed locally to execute our strategic plans and what amount is available for repatriation back to the United States.
We expect operating cash flows, cash and short-term investment balances, together with the available capacity under our revolving credit facilities, to be sufficient to meet our operating requirements, including purchase commitments, make Tax Reform Act transition tax payments and service our debt for the next twelve months. The ability to expand and grow our business in accordance with current plans, make acquisitions, meet long-term capital requirements beyond a twelve-month period and execute our capital return plan will depend on many factors, including the rate, if any, at which cash flow increases, our ability and willingness to pay for acquisitions with capital stock and the availability of public and private debt, including the ability to extend the maturity or refinance our existing debt, and equity financing. We cannot be certain that additional financing, if required, will be available on terms and conditions acceptable to us, if at all.
| Commitments and Contingencies |
See Note 10 to our unaudited consolidated financial statements.
| Critical Accounting Estimates |
Management’s discussion and analysis of our financial condition and results of operations is based on our unaudited consolidated financial statements that have been prepared in accordance with GAAP. The preparation of these financial statements requires management to make estimates and assumptions that affect the amounts reported for assets and liabilities, including the recoverability of tangible and intangible assets, disclosure of contingent assets and liabilities as of the date of the financial statements, and the reported amounts of revenues and expenses during the reported period. On an ongoing basis, we evaluate our estimates. The most significant estimates relate to the recognition of revenue and profits, including the application of the cost-to-cost method of measuring progress to completion for certain fixed-price contracts, income taxes, business combinations and valuation of goodwill and other long-lived assets. We base our estimates on historical experience, current trends and various other assumptions that are believed to be reasonable under the circumstances, the results of which form the basis for making judgments about the carrying values of assets and liabilities that are not readily apparent from other sources. The actual amounts may differ from the estimates used in the preparation of the accompanying unaudited consolidated financial statements. For a discussion of our critical accounting estimates, see “Item 7. Management’s Discussion and Analysis of Financial Condition and Results of Operations” in our Annual Report on Form 10-K for the year ended December 31, 2021. Our significant accounting policies are described in Note 1 to the audited consolidated financial statements included in our Annual Report on Form 10-K for the year ended December 31, 2021.
| Recently Adopted and New Accounting Pronouncements |
There have been no changes in the information provided in our Annual Report on Form 10-K for the year ended December 31, 2021.
| Forward Looking Statements |
The statements contained in this Quarterly Report on Form 10-Q that are not historical facts are forward-looking statements (within the meaning of Section 21E of the Exchange Act) that involve risks and uncertainties. Such forward-looking statements may be identified by, among other things, the use of forward-looking terminology such as “believe,” “expect,” “may,” “could,” “would,” “plan,” “intend,” “estimate,” “predict,” “potential,” “continue,” “should” or “anticipate” or the negative thereof or other variations thereon or comparable terminology, or by discussions of strategy that involve risks and uncertainties. From time to time, we or our representatives have made or may make forward-looking statements, orally or in writing.
Such forward-looking statements may be included in various filings made by us with the SEC, in press releases or in oral statements made by or with the approval of one of our authorized executive officers. These forward-looking statements, such as statements regarding our anticipated future revenues or operating margin, earnings, capital expenditures, impacts to our business, financial results and financial condition as a result of the COVID-19 pandemic, the competitive marketplace for talent and future attrition trends, anticipated effective income tax rate and income tax expense, liquidity, financing strategy, access to capital, capital return strategy, investment strategies, cost management, plans and objectives, including those related to our digital practice areas, investment in our business, potential acquisitions, industry trends, client behaviors and trends, the outcome of and costs associated with regulatory and litigation matters, the appropriateness of the accrual related to the India Defined Contribution Obligation and other statements regarding matters that are not historical facts, are based on our current
| Cognizant Technology Solutions | 37 | June 30, 2022 Form 10-Q |
expectations, estimates and projections, management’s beliefs and certain assumptions made by management, many of which, by their nature, are inherently uncertain and beyond our control. Actual results, performance, achievements and outcomes could differ materially from the results expressed in, or anticipated or implied by, these forward-looking statements. There are a number of important factors that could cause our results to differ materially from those indicated by such forward-looking statements, including:
-
economic and political conditions globally, including the invasion of Ukraine by Russia, and in particular in the markets in which our clients and operations are concentrated;
-
the continuing impact of the COVID-19 pandemic, or other future pandemics, on our business, results of operations, liquidity and financial condition;
-
our ability to attract, train and retain skilled employees, including highly skilled technical personnel and personnel with experience in key digital areas and senior management to lead our business globally;
-
challenges related to growing our business organically as well as inorganically through acquisitions, and our ability to achieve our targeted growth rates;
-
our ability to achieve our profitability goals and maintain our capital return strategy;
-
our ability to meet specified service levels or milestones required by certain of our contracts;
-
intense and evolving competition and significant technological advances that our service offerings must keep pace with in the rapidly changing markets we compete in;
-
legal, reputation and financial risks if we fail to protect client and/or our data from security breaches and/or cyber attacks;
-
the effectiveness of our risk management, business continuity and disaster recovery plans and the potential that our global delivery capabilities could be impacted;
-
restrictions on visas, in particular in the United States, United Kingdom and EU, or immigration more generally or increased costs of such visas or the wages we are required to pay employees on visas, which may affect our ability to compete for and provide services to our clients;
-
risks related to anti-outsourcing legislation, if adopted, and negative perceptions associated with offshore outsourcing, both of which could impair our ability to serve our clients;
-
risks and costs related to complying with numerous and evolving legal and regulatory requirements and client expectations in the many jurisdictions in which we operate, including the increased stakeholder emphasis on ESG matters;
-
potential changes in tax laws, or in their interpretation or enforcement, failure by us to adapt our corporate structure and intercompany arrangements to achieve global tax efficiencies or adverse outcomes of tax audits, investigations or proceedings;
-
potential exposure to litigation and legal claims in the conduct of our business; and
-
the factors set forth in "Part I, Item 1A. Risk Factors” in our Annual Report on Form 10-K for the year ended December 31, 2021.
You are advised to consult any further disclosures we make on related subjects in the reports we file with the SEC, including this report in the section titled “Part I, Item 2. Management’s Discussion and Analysis of Financial Condition and Results of Operations” and “Part I, Item 1. Business” in our Annual Report on Form 10-K for the year ended December 31, 2021. We undertake no obligation to update or revise any forward-looking statements, whether as a result of new information, future events or otherwise, except as may be required under applicable securities laws.
| Item 3. Quantitative and Qualitative Disclosures about Market Risk. |
There have been no material changes in our quantitative and qualitative disclosures about market risk from those disclosed in Part II, Item 7A, Quantitative and Qualitative Disclosures about Market Risk, in our Annual Report on Form 10-K for the fiscal year ended December 31, 2021, filed with the SEC on February 16, 2022.
| Cognizant Technology Solutions | 38 | June 30, 2022 Form 10-Q |
| Item 4. Controls and Procedures. |
Evaluation of Disclosure Controls and Procedures
Our management, under the supervision and with the participation of our chief executive officer and our chief financial officer, evaluated the design and operating effectiveness of our disclosure controls and procedures (as defined in Rules 13a-15(e) and 15d-15(e) under the Exchange Act) as of June 30, 2022. Based on this evaluation, our chief executive officer and our chief financial officer concluded that, as of June 30, 2022, our disclosure controls and procedures were effective.
Changes in Internal Control over Financial Reporting
No changes in our internal control over financial reporting (as defined in Rules 13a-15(f) and 15d-15(f) under the Exchange Act) occurred during the fiscal quarter ended June 30, 2022 that have materially affected, or are reasonably likely to materially affect, our internal control over financial reporting.
| Cognizant Technology Solutions | 39 | June 30, 2022 Form 10-Q |
PART II. OTHER INFORMATION
| Item 1. Legal Proceedings |
See Note 10 to our unaudited consolidated financial statements.
| Item 1A. Risk Factors |
There have been no material changes in our risk factors from those disclosed in Part I, Item 1A, Risk Factors, in our Annual Report on Form 10-K for the fiscal year ended December 31, 2021 filed with the SEC on February 16, 2022**.**
| Item 2. Unregistered Sales of Equity Securities and Use of Proceeds |
Issuer Purchases of Equity Securities
Our stock repurchase program allows for the repurchase of up to $9.5 billion, excluding fees and expenses, of our Class A common stock through open market purchases, including under a 10b5-1 Plan or in private transactions, including through ASR agreements entered into with financial institutions, in accordance with applicable federal securities laws. The repurchase program does not have an expiration date and has a remaining authorized balance of $1,375 million as of June 30, 2022. The timing of repurchases and the exact number of shares to be purchased are determined by management, in its discretion, or pursuant to a 10b5-1 Plan, and will depend upon market conditions and other factors.
During the three months ended June 30, 2022, we repurchased $300 million of our Class A common stock under our stock repurchase program. The stock repurchase activity under our stock repurchase program during the three months ended June 30, 2022 was as follows:
| Month | Total Number of Shares Purchased | Average Price Paid per Share | Total Number of Shares Purchased as Part of Publicly Announced Plans or Programs | Approximate Dollar Value of Shares that May Yet Be Purchased under the Plans or Programs (in millions) | ||||||||||||||||||||||
| April 1, 2022 - April 30, 2022 | — | $ | — | — | $ | 1,675 | ||||||||||||||||||||
| May 1, 2022 - May 31, 2022 | 2,157,300 | 72.97 | 2,157,300 | 1,518 | ||||||||||||||||||||||
| June 1, 2022 - June 30, 2022 | 2,053,758 | 69.42 | 2,053,758 | 1,375 | ||||||||||||||||||||||
| Total | 4,211,058 | $ | 71.24 | 4,211,058 |
During the three months ended June 30, 2022, we also purchased shares in connection with our stock-based compensation plans, whereby shares of our common stock were tendered by employees for payment of applicable statutory tax withholdings. For the three months ended June 30, 2022, such repurchases totaled 0.2 million shares at an aggregate cost of $18 million.
| Cognizant Technology Solutions | 40 | June 30, 2022 Form 10-Q |
| Item 6. Exhibit Index |
EXHIBIT INDEX
| Cognizant Technology Solutions | 41 | June 30, 2022 Form 10-Q |
SIGNATURES
Pursuant to the requirements of the Securities Exchange Act of 1934, the Registrant has duly caused this report to be signed on its behalf by the undersigned thereunto duly authorized.
| Cognizant Technology Solutions Corporation | ||||||||||||||||||||
| Date: | July 27, 2022 | By: | /s/ BRIAN HUMPHRIES | |||||||||||||||||
| Brian Humphries, | ||||||||||||||||||||
| Chief Executive Officer | ||||||||||||||||||||
| (Principal Executive Officer) |
| Date: | July 27, 2022 | By: | /s/ JAN SIEGMUND | |||||||||||||||||
| Jan Siegmund, | ||||||||||||||||||||
| Chief Financial Officer | ||||||||||||||||||||
| (Principal Financial Officer) |
| Cognizant Technology Solutions | 42 | June 30, 2022 Form 10-Q |
Previous: Cover and table of contents