 filings.tools
Item 2. Management’s Discussion and Analysis of Financial Condition and Results of Operations.
78K characters. Original on sec.gov · Markdown
Item 2. Management’s Discussion and Analysis of Financial Condition and Results of Operations.
| Executive Summary |
Cognizant is one of the world’s leading professional services companies, engineering modern businesses and delivering strategic outcomes for our clients. We help clients modernize technology, reimagine processes and transform experiences so they can stay ahead in a fast-changing world. We tailor our services and solutions to specific industries with an integrated global delivery model that employs client service and delivery teams based at client locations and dedicated global and regional delivery centers. Our services include digital services and solutions, consulting, application development, systems integration, quality engineering and assurance, application maintenance, infrastructure and security as well as business process services and automation. Digital services continue to be an important part of our portfolio, aligning with our clients' focus on becoming data-enabled, customer-centric and differentiated businesses.
In the second quarter of 2023, we initiated the NextGen program aimed at simplifying our operating model, optimizing corporate functions and consolidating and realigning office space to reflect the post-pandemic hybrid work environment. Our drive for simplification includes operating with fewer layers in an effort to enhance agility and enable faster decision making. We expect the savings generated by the program to help fund continued investments in our people, revenue growth opportunities and the modernization of our office space.
In connection with the NextGen program, in the second quarter of 2023 we incurred $117 million of employee separation, facility exit and other costs. See Note 4 to our unaudited consolidated financial statements. We currently expect to incur total costs of approximately $350 million with approximately $250 million of such costs anticipated in 2023 and approximately $100 million in 2024. The total costs consist of approximately $150 million of employee severance and other costs primarily related to non-billable and corporate personnel, with approximately $100 million in 2023 and $50 million in 2024, and approximately $200 million of costs related to the consolidation of office space, with approximately $150 million in 2023 and $50 million in 2024. The estimates of the charges and expenditures that we expect to incur in connection with the NextGen program, and the timing thereof, are subject to a number of assumptions, including local law requirements in various jurisdictions, and actual amounts may differ materially from estimates. In addition, we may incur other charges or cash expenditures not currently contemplated due to unanticipated events that may occur in connection with the NextGen program.
Q2 2023 Financial Results****1
| Revenue |
| Income from Operations |
| Operating Margin |
| Diluted EPS |
| GAAP | Adjusted1 |
| GAAP | Adjusted1 |
| GAAP | Adjusted1 |
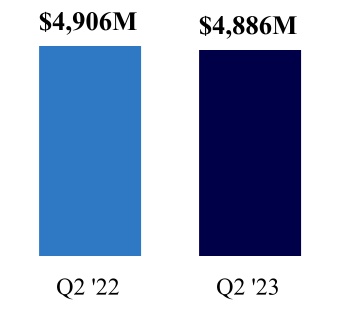
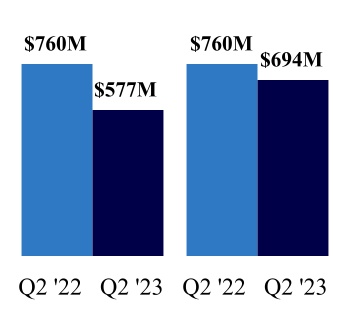
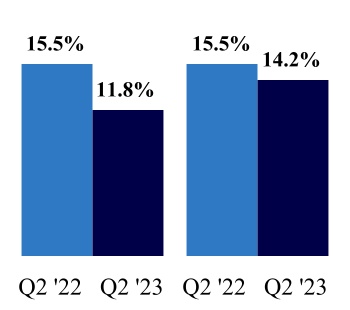

| Revenue down $20 million or 0.4% from Q2 2022; a decline of 0.1% in constant currency1 | Income from Operations down $183 million or 24.1% from Q2 2022 Adjusted Income from Operations1 down $66 million or 8.7% from Q2 2022 | Operating margin down 370 bps from Q2 2022 Adjusted Operating Margin1 down 130 bps from Q2 2022 | Diluted EPS down $0.20 or 18.0% from Q2 2022 Adjusted Diluted EPS1 down $0.04 or 3.5% from Q2 2022 | |||||||||||||||||||||||||||||||||||
1 Adjusted Income from Operations, Adjusted Operating Margin, Adjusted Diluted EPS and constant currency revenue growth are not measures of financial performance prepared in accordance with GAAP. See “Non-GAAP Financial Measures” for more information and reconciliations to the most directly comparable GAAP financial measures, as applicable.
| Cognizant Technology Solutions | 25 | June 30, 2023 Form 10-Q |
During the quarter ended June 30, 2023, revenues decreased by $20 million as compared to the quarter ended June 30, 2022, representing a decline of 0.4%, or a decline of 0.1% on a constant currency basis2. Revenues were negatively impacted by weakness in our Financial Services segment, driven primarily by the banking sector, and our Communications, Media and Technology segment, partially offset by revenue growth in our Products and Resources and Health Sciences segments. Our recently completed acquisitions contributed 130 basis points to revenue growth, primarily benefiting our Communications, Media and Technology and Products and Resources segment.
Our operating margin and Adjusted Operating Margin2 decreased to 11.8% and 14.2%, respectively for the quarter ended June 30, 2023 from operating margin and Adjusted Operating Margin of 15.5% each for the quarter ended June 30, 2022. Our 2023 GAAP and Adjusted Operating Margins were negatively impacted by increased compensation costs, primarily as a result of two merit increase cycles for the majority of our employees since October 2022, partially offset by the benefit of the depreciation of the Indian rupee against the U.S. dollar and an insurance recovery benefit of 60 basis points related to a previously disclosed 2020 cyber incident. In addition, our 2023 GAAP operating margin was negatively impacted by the NextGen charges, as discussed in Note 4 to our unaudited consolidated financial statements, which were excluded from our Adjusted Operating Margin.
As a global professional services company, we compete on the basis of the knowledge, experience, insights, skills and talent of our employees and the value they can provide to our clients. Our success is dependent, in large part, on our ability to keep our supply of skilled employees in balance with client demand. We closely monitor attrition trends focusing on the metric that we believe is most relevant to our business. This metric, which we refer to as Voluntary Attrition - Tech Services, includes all voluntary separations with the exception of employees in our Intuitive Operations and Automation practice. For the trailing twelve months ended June 30, 2023 our Voluntary Attrition - Tech Services was 19.9% as compared to 31.1% for the trailing twelve months ended June 30, 2022. We finished the second quarter of 2023 with approximately 345,600 employees as compared to 341,300 employees at the end of the second quarter of 2022.
Business Outlook
We continue to expect the long-term focus of our clients to be on their digital transformation into software-driven, data-enabled, customer-centric and differentiated businesses. We believe clients will continue to contend with industry-specific changes driven by evolving digital technologies, uncertainty in the regulatory environment, industry consolidation and convergence as well as international trade policies and other macroeconomic factors, including the increasing uncertainty related to the global economy, which could affect their demand for our services.
In 2023, we simplified our strategic priorities to the following:
-
Accelerate growth - achieve faster growth by shifting the mindset and operating rhythm of the company;
-
Become the employer of choice - steward and attract the best technology talent in the industry; and
-
Simplify operations - improve operational execution and efficiency to free up cash to fund people and growth investments.
Guided by these priorities, we initiated the NextGen program in the second quarter of 2023. We currently expect to incur total costs of approximately $350 million in connection with this program, with approximately $250 million of such costs anticipated in 2023 and approximately $100 million in 2024. See "Executive Summary." In addition to the NextGen program, potential tax law and other regulatory changes, including possible U.S. corporate income tax reform and potentially increased costs for employment and post-employment benefits in India as a result of the Code on Social Security, 2020, among other items, may impact our future results.
2 Adjusted Income from Operations, Adjusted Operating Margin, Adjusted Diluted EPS and constant currency revenue growth are not measures of financial performance prepared in accordance with GAAP. See “Non-GAAP Financial Measures” for more information and reconciliations to the most directly comparable GAAP financial measures, as applicable.
| Cognizant Technology Solutions | 26 | June 30, 2023 Form 10-Q |
| Results of Operations |
Three Months Ended June 30, 2023 Compared to Three Months Ended June 30, 2022
The following table sets forth, for the periods indicated, certain financial data for the three months ended June 30:
| % of | % of | Increase / Decrease | |||||||||||||||||||||||||||||||||||||||||||||
| (Dollars in millions, except per share data) | 2023 | Revenues | 2022 | Revenues | $ | % | |||||||||||||||||||||||||||||||||||||||||
| Revenues | $ | 4,886 | 100.0 | $ | 4,906 | 100.0 | $ | (20) | (0.4) | ||||||||||||||||||||||||||||||||||||||
| Cost of revenues(a) | 3,231 | 66.1 | 3,119 | 63.6 | 112 | 3.6 | |||||||||||||||||||||||||||||||||||||||||
| Selling, general and administrative expenses(a) | 830 | 17.0 | 883 | 18.0 | (53) | (6.0) | |||||||||||||||||||||||||||||||||||||||||
| Restructuring charges | 117 | 2.4 | — | — | 117 | NA | |||||||||||||||||||||||||||||||||||||||||
| Depreciation and amortization expense | 131 | 2.7 | 144 | 2.9 | (13) | (9.0) | |||||||||||||||||||||||||||||||||||||||||
| Income from operations | 577 | 11.8 | 760 | 15.5 | (183) | (24.1) | |||||||||||||||||||||||||||||||||||||||||
| Other income (expense), net | 10 | 1 | 9 | * | |||||||||||||||||||||||||||||||||||||||||||
| Income before provision for income taxes | 587 | 12.0 | 761 | 15.5 | (174) | (22.9) | |||||||||||||||||||||||||||||||||||||||||
| Provision for income taxes | (124) | (184) | 60 | (32.6) | |||||||||||||||||||||||||||||||||||||||||||
| Net income | $ | 463 | 9.5 | $ | 577 | 11.8 | $ | (114) | (19.8) | ||||||||||||||||||||||||||||||||||||||
| Diluted earnings per share | $ | 0.91 | $ | 1.11 | $ | (0.20) | (18.0) | ||||||||||||||||||||||||||||||||||||||||
| Other Financial Information**3 | |||||||||||||||||||||||||||||||||||||||||||||||
| Adjusted Income from Operations and Adjusted Operating Margin | $ | 694 | 14.2 | $ | 760 | 15.5 | $ | (66) | (8.7) | ||||||||||||||||||||||||||||||||||||||
| Adjusted Diluted EPS | $ | 1.10 | $ | 1.14 | $ | (0.04) | (3.5) |
(a)Exclusive of depreciation and amortization expense.
NA Not applicable
*Not meaningful
| Revenues |
During the quarter ended June 30, 2023, revenues decreased by $20 million as compared to the quarter ended June 30, 2022, representing a decline of 0.4%, or a decline of 0.1% on a constant currency basis3. Our recently completed acquisitions contributed 130 basis points to revenue growth.
3Adjusted Income from Operations, Adjusted Operating Margin, Adjusted Diluted EPS and constant currency revenue growth are not measures of financial performance prepared in accordance with GAAP. See “Non-GAAP Financial Measures” for more information and reconciliations to the most directly comparable GAAP financial measures, as applicable.
| Cognizant Technology Solutions | 27 | June 30, 2023 Form 10-Q |
| Revenues - Reportable Business Segments and Geographic Markets |
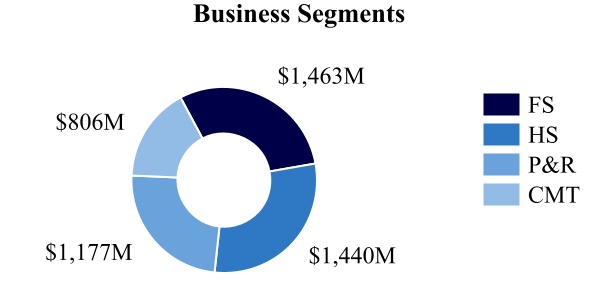
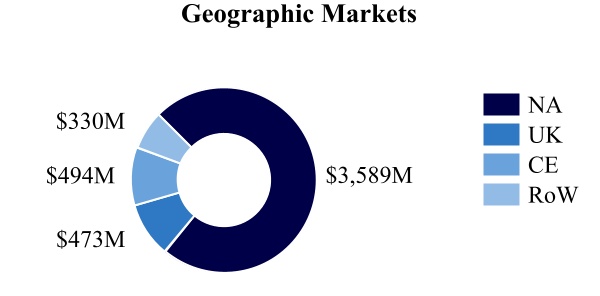
Revenues of $4,886 million were as follows for the three months ended June 30, 2023:
| Q2 2023 as compared to Q2 2022 | Increase / (Decrease) | ||||||||||||||||||||||||||||||||||
| (Dollars in millions) | $ | % | **CC %**4 | ||||||||||||||||||||||||||||||||
| Financial Services | $ | (79) | (5.1) | (4.8) | |||||||||||||||||||||||||||||||
| Health Sciences | 32 | 2.3 | 2.1 | ||||||||||||||||||||||||||||||||
| Products and Resources | 37 | 3.2 | 3.7 | ||||||||||||||||||||||||||||||||
| CMT | (10) | (1.2) | (0.4) | ||||||||||||||||||||||||||||||||
| Total revenues | $ | (20) | (0.4) | (0.1) |
| Q2 2023 as compared to Q2 2022 | Increase / (Decrease) | ||||||||||||||||||||||||||||||||||
| (Dollars in millions) | $ | % | **CC %**4 | ||||||||||||||||||||||||||||||||
| North America | $ | (67) | (1.8) | (1.7) | |||||||||||||||||||||||||||||||
| United Kingdom | 15 | 3.3 | 3.3 | ||||||||||||||||||||||||||||||||
| Continental Europe | 49 | 11.0 | 9.5 | ||||||||||||||||||||||||||||||||
| Europe - Total | 64 | 7.1 | 6.3 | ||||||||||||||||||||||||||||||||
| Rest of World | (17) | (4.9) | — | ||||||||||||||||||||||||||||||||
| Total revenues | $ | (20) | (0.4) | (0.1) |
Recently completed acquisitions contributed 130 basis points to overall revenue growth, including 260 basis points of growth to our Products and Resources segment (primarily in North America) and 380 basis points of growth to our Communications, Media and Technology segment (primarily in Continental Europe).4
In addition:
-
Reduced demand for discretionary work negatively impacted revenues, primarily in North America. Banking clients in our Financial Services segment, retail and consumer goods clients in our Products and Resources segment and clients in our Communications, Media and Technology segment were particularly affected;
-
North America revenues in the Communications, Media and Technology segment included growing demand for services related to digital content, primarily driven by the largest client in this segment, while growth in our Health Sciences segment benefited from increased demand from North America healthcare payer clients for our integrated software solutions;
-
Revenue growth in the United Kingdom was driven by expansion of work with clients in the Financial Services and Communications Media and Technology segments;
-
Revenues in the Continental Europe region grew across all segments, led by increased demand from automotive clients within the Products and Resources segment. Revenue growth in this region was positively impacted by foreign currency exchange rate movements; and
-
Revenues in our Rest of World region increased in our Products and Resources, Communications, Media and Technology and Health Sciences segments but were offset by weakness in the Financial Services segment and the negative impact of foreign currency exchange rate movements.
4 Constant currency revenue growth is not a measure of financial performance prepared in accordance with GAAP. See “Non-GAAP Financial Measures” for more information.
| Cognizant Technology Solutions | 28 | June 30, 2023 Form 10-Q |
| Cost of Revenues (Exclusive of Depreciation and Amortization Expense) |
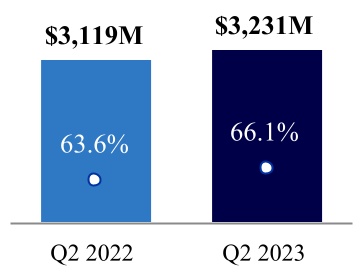
| é | $112M | |||||||||||||
| é | 2.5% as a % of revenues | |||||||||||||
| ¡ | % of Revenues | |||||||||||||
Our cost of revenues consists primarily of salaries, incentive-based compensation, stock-based compensation expense, employee benefits, project-related immigration and travel for technical personnel, subcontracting and equipment costs relating to revenues. The increase, as a percentage of revenues, was due to higher compensation costs for delivery personnel, primarily as a result of two merit increase cycles for the majority of our employees since October 2022, partially offset by the benefit of the depreciation of the Indian rupee against the U.S. dollar.
| SG&A Expenses (Exclusive of Depreciation and Amortization Expense) |
SG&A expenses consist primarily of salaries, incentive-based compensation, stock-based compensation expense, employee benefits, immigration, travel, marketing, communications, management, finance, administrative and occupancy costs. The decrease, as a percentage of revenues, was primarily due to an insurance recovery benefit of 60 basis points related to a previously disclosed 2020 cyber incident and the beneficial impact of foreign currency exchange rate movements, partially offset by higher compensation costs, primarily as a result of two merit increase cycles for the majority of our employees since October 2022.

| ê | $53M | |||||||||||||
| ê | 1.0% as a % of revenues | |||||||||||||
| ¡ | % of Revenues | |||||||||||||
| Restructuring Charges |
Restructuring charges consist of costs related to the NextGen program. Restructuring charges were $117 million or 2.4%, as a percentage of revenue for the three months ended June 30, 2023. For further detail on our restructuring charges see Note 4 to our unaudited consolidated financial statements.
| Depreciation and Amortization Expense |
Depreciation and amortization expense decreased by 9.0%, or 0.2% as a percentage of revenues, during the second quarter of 2023 as compared to the second quarter of 2022, primarily driven by a reduction in amortization expense due to certain intangible assets reaching the end of their useful lives.
| Operating Margin and Adjusted Operating Margin****5 - Overall |
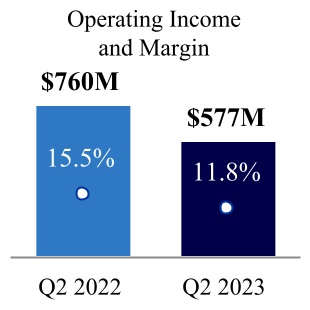

Our 2023 second quarter GAAP operating margin and Adjusted Operating Margin5 were negatively impacted by increased compensation costs, primarily as a result of two merit increase cycles for the majority of our employees since October 2022, partially offset by the benefit of the depreciation of the Indian rupee against the U.S. dollar and an insurance recovery benefit of 60 basis points related to a previously disclosed 2020 cyber incident. In addition, our 2023 GAAP operating margin was negatively impacted by the NextGen charges, as discussed in Note 4 to our unaudited consolidated financial statements, which were excluded from our Adjusted Operating Margin.
5 Adjusted Income from Operations and Adjusted Operating Margin are not measures of financial performance prepared in accordance with GAAP. See “Non-GAAP Financial Measures” for more information and reconciliations to the most directly comparable GAAP financial measures, as applicable.
| Cognizant Technology Solutions | 29 | June 30, 2023 Form 10-Q |
A predominant portion of our costs in India are denominated in the Indian rupee, representing approximately 24% of our global operating costs during the three months ended June 30, 2023. These costs are subject to foreign currency exchange rate fluctuations, which have an impact on our results of operations. We enter into foreign exchange derivative contracts to hedge certain Indian rupee denominated payments in India. These hedges are intended to mitigate the volatility of the changes in the exchange rate between the U.S. dollar and the Indian rupee. Net of the impact of the hedges, the depreciation of the Indian rupee benefited our operating margin for the three months ended June 30, 2023 by 104 basis points as compared to the three months ended June 30, 2022.
Excluding the impact of applicable designated cash flow hedges, the depreciation of the Indian rupee against the U.S. dollar positively impacted our operating margin by 126 basis points during the three months ended June 30, 2023. Each additional 1.0% change in exchange rate between the Indian rupee and the U.S. dollar will have the effect of moving our operating margin by 20 basis points (excluding the impact of the hedges). The settlement of our cash flow hedges negatively impacted our operating margin by 10 basis points during the three months ended June 30, 2023, compared to a positive impact of 12 basis points during the three months ended June 30, 2022.
| Segment Operating Profit |
In the first quarter of 2023, we made certain changes to the internal measurement of segment operating profit for the purpose of evaluating segment performance and resource allocation. The primary reason for the change was to reflect a more complete cost of delivery. Specifically, segment operating profit now includes an allocation of both SG&A costs related to our integrated practices and the excess or shortfall of incentive-based compensation for commercial and delivery employees as compared to target, which were previously included in "unallocated costs." We have reported 2023 segment operating profits using the new allocation methodology and have recast the 2022 results to conform to the new methodology.
Segment operating profit and operating margin percentage were as follows:
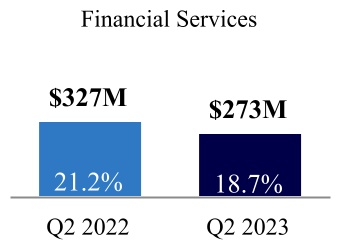
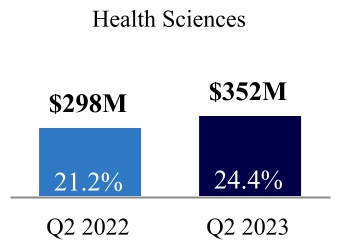
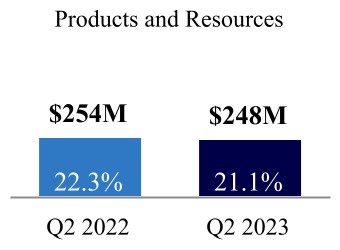
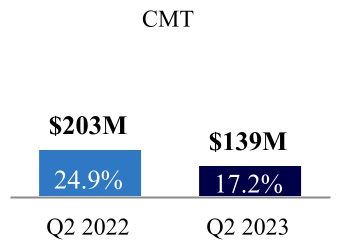
| Segment operating profit | % | Segment operating margin |
In the second quarter of 2023, segment operating margins across all our segments were negatively impacted by increased compensation costs, primarily as a result of two merit increase cycles for the majority of our employees since October 2022, partially offset by the benefits of the depreciation of the Indian rupee against the U.S. dollar. In addition, segment operating margin in Health Sciences benefited in the second quarter of 2023 from higher margin integrated software solutions for healthcare payer clients, while segment operating margin in Communications, Media and Technology was negatively affected by a decrease in utilization due to a slowdown in revenue growth.
Total segment operating profit and operating margin were as follows for the three months ended June 30:
| (Dollars in millions) | 2023 | % of Revenues | 2022 | % of Revenues | Increase | ||||||||||||||||||||||||
| Total segment operating profit | $ | 1,012 | 20.7 | $ | 1,082 | 22.1 | $ | (70) | |||||||||||||||||||||
| Less: unallocated costs | 435 | 8.9 | 322 | 6.6 | 113 | ||||||||||||||||||||||||
| Income from operations | $ | 577 | 11.8 | $ | 760 | 15.5 | $ | (183) | |||||||||||||||||||||
The increase in unallocated costs for three months ended June 30, 2023 as compared to June 30, 2022 was primarily driven by the NextGen charges. See Note 4 to our unaudited consolidated financial statements.
| Cognizant Technology Solutions | 30 | June 30, 2023 Form 10-Q |
| Other Income (Expense), Net |
The following table sets forth total other income (expense), net for the three months ended June 30:
| (in millions) | 2023 | 2022 | Increase/ Decrease | ||||||||||||||||||||
| Foreign currency exchange gains (losses) | $ | 5 | $ | (36) | $ | 41 | |||||||||||||||||
| (Losses) gains on foreign exchange forward contracts not designated as hedging instruments | (14) | 32 | (46) | ||||||||||||||||||||
| Foreign currency exchange gains (losses), net | (9) | (4) | (5) | ||||||||||||||||||||
| Interest income | 30 | 9 | 21 | ||||||||||||||||||||
| Interest expense | (10) | (3) | (7) | ||||||||||||||||||||
| Other, net | (1) | (1) | — | ||||||||||||||||||||
| Total other income (expense), net | $ | 10 | $ | 1 | $ | 9 |
The foreign currency exchange losses were attributed to the remeasurement of net monetary assets and liabilities denominated in currencies other than the functional currencies of our subsidiaries. The (losses) gains on foreign exchange forward contracts not designated as hedging instruments related to the realized and unrealized gains and losses on contracts entered into to offset our foreign currency exposures. As of June 30, 2023, the notional value of our undesignated hedges was $1,511 million. The increase in interest income and interest expense was primarily attributable to higher interest rates in the current period.
| Provision for Income Taxes |
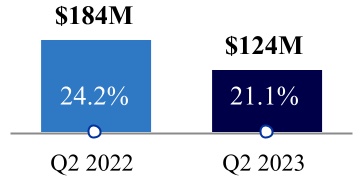
| ê | $60M | |||||||||||||
| ¡ Effective Income Tax Rate ê 3.1% | ||||||||||||||
The effective income tax rate decreased primarily due to a 2023 discrete benefit resulting from a settlement related to U.S. state income taxes.
| Net Income |
The decrease in net income was primarily driven by lower income from operations, partially offset by higher interest income and a lower effective tax rate.

| ê | $114M | |||||||||||||
| ¡ ê 2.3% of Revenues | ||||||||||||||
Non-GAAP Financial Measures
Portions of our disclosure include non-GAAP financial measures. These non-GAAP financial measures are not based on any comprehensive set of accounting rules or principles and should not be considered a substitute for, or superior to, financial measures calculated in accordance with GAAP, and may be different from non-GAAP financial measures used by other companies. In addition, these non-GAAP financial measures should be read in conjunction with our financial statements prepared in accordance with GAAP. The reconciliations of non-GAAP financial measures to the corresponding GAAP measures set forth below should be carefully evaluated.
Our non-GAAP financial measures Adjusted Operating Margin and Adjusted Income from Operations excludes unusual items, such as NextGen charges. Our non-GAAP financial measure Adjusted Diluted EPS excludes unusual items, such as NextGen charges, net non-operating foreign currency exchange gains or losses and the tax impact of all the applicable adjustments. For further detail on the NextGen charges, see Note 4 to our unaudited consolidated financial statements. The income tax impact of each item excluded from Adjusted Diluted EPS is calculated by applying the statutory rate and local tax regulations in the jurisdiction in which the item was incurred. Constant currency revenue growth is defined as revenues for a given period restated at the comparative period’s foreign currency exchange rates measured against the comparative period's reported revenues.
We believe providing investors with an operating view consistent with how we manage the Company provides enhanced transparency into our operating results. For internal management reporting and budgeting purposes, we use various GAAP and non-GAAP financial measures for financial and operational decision-making, to evaluate period-to-period comparisons, to determine portions of the compensation for executive officers and for making comparisons of our operating results to those of
| Cognizant Technology Solutions | 31 | June 30, 2023 Form 10-Q |
our competitors. We believe that the presentation of non-GAAP financial measures, which exclude certain costs, read in conjunction with our reported GAAP results and reconciliations to the most comparable GAAP measure, as applicable, can provide useful supplemental information to our management and investors regarding financial and business trends relating to our financial condition and results of operations.
A limitation of using non-GAAP financial measures versus financial measures calculated in accordance with GAAP is that non-GAAP financial measures may exclude costs that are recurring such as net non-operating foreign currency exchange gains or losses. In addition, other companies may calculate non-GAAP financial measures differently than us, thereby limiting the usefulness of these non-GAAP financial measures as a comparative tool. We compensate for these limitations by providing specific information regarding the GAAP amounts excluded from non-GAAP financial measures to allow investors to evaluate such non-GAAP financial measures.
The following table presents a reconciliation of each non-GAAP financial measure to the most comparable GAAP measure for the three months ended June 30:
| 2023 | % of Revenues | 2022 | % of Revenues | ||||||||||||||||||||
| GAAP income from operations and operating margin | $ | 577 | 11.8 | $ | 760 | 15.5 | |||||||||||||||||
| NextGen charges(1) | 117 | 2.4 | — | — | |||||||||||||||||||
| Adjusted Income from Operations and Adjusted Operating Margin | $ | 694 | 14.2 | $ | 760 | 15.5 | |||||||||||||||||
| GAAP diluted EPS | $ | 0.91 | $ | 1.11 | |||||||||||||||||||
| Effect of NextGen charges, pre-tax | 0.23 | — | |||||||||||||||||||||
| Non-operating foreign currency exchange (gains) losses, pre-tax (2) | 0.02 | 0.01 | |||||||||||||||||||||
| Tax effect of above adjustments(3) | (0.06) | 0.02 | |||||||||||||||||||||
| Adjusted Diluted EPS | $ | 1.10 | $ | 1.14 | |||||||||||||||||||
(1)As part of the NextGen program, during the three months ended June 30, 2023, we incurred employee separation, facility exit and other costs. See Note 4 to our unaudited consolidated financial statements for additional information.
(2)Non-operating foreign currency exchange gains and losses, inclusive of gains and losses on related foreign exchange forward contracts not designated as hedging instruments for accounting purposes, are reported in "Foreign currency exchange gains (losses), net" in our unaudited consolidated statements of operations.
(3)Presented below are the tax impacts of our non-GAAP adjustment to pre-tax income:
| Three Months Ended June 30, | |||||||||||
| (in millions) | 2023 | 2022 | |||||||||
| Non-GAAP income tax benefit (expense) related to: | |||||||||||
| NextGen charges | 31 | — | |||||||||
| Foreign currency exchange gains and losses | — | (14) |
The effective tax rate related to non-operating foreign currency exchange gains and losses varies depending on the jurisdictions in which such income and expenses are generated and the statutory rates applicable in those jurisdictions. As such, the income tax effect of non-operating foreign currency exchange gains and losses shown in the above table may not appear proportionate to the net pre-tax foreign currency exchange gains and losses reported in our unaudited consolidated statements of operations.
| Cognizant Technology Solutions | 32 | June 30, 2023 Form 10-Q |
Six Months Ended June 30, 2023 Compared to Six Months Ended June 30, 2022
The following table sets forth, for the periods indicated, certain financial data for the six months ended June 30:
| % of | % of | Increase / Decrease | |||||||||||||||||||||||||||||||||||||||
| (Dollars in millions, except per share data) | 2023 | Revenues | 2022 | Revenues | $ | % | |||||||||||||||||||||||||||||||||||
| Revenues | $ | 9,698 | 100.0 | $ | 9,732 | 100.0 | $ | (34) | (0.3) | ||||||||||||||||||||||||||||||||
| Cost of revenues(a) | 6,374 | 65.7 | 6,216 | 63.9 | 158 | 2.5 | |||||||||||||||||||||||||||||||||||
| Selling, general and administrative expenses(a) | 1,665 | 17.2 | 1,745 | 17.9 | (80) | (4.6) | |||||||||||||||||||||||||||||||||||
| Restructuring charges | 117 | 1.2 | — | — | 117 | NA | |||||||||||||||||||||||||||||||||||
| Depreciation and amortization expense | 263 | 2.7 | 287 | 2.9 | (24) | (8.4) | |||||||||||||||||||||||||||||||||||
| Income from operations | 1,279 | 13.2 | 1,484 | 15.2 | (205) | (13.8) | |||||||||||||||||||||||||||||||||||
| Other income (expense), net | 46 | 6 | 40 | * | |||||||||||||||||||||||||||||||||||||
| Income before provision for income taxes | 1,325 | 13.7 | 1,490 | 15.3 | (165) | (11.1) | |||||||||||||||||||||||||||||||||||
| Provision for income taxes | (282) | (354) | 72 | (20.3) | |||||||||||||||||||||||||||||||||||||
| Income (loss) from equity method investments | — | 4 | (4) | (100.0) | |||||||||||||||||||||||||||||||||||||
| Net income | $ | 1,043 | 10.8 | $ | 1,140 | 11.7 | $ | (97) | (8.5) | ||||||||||||||||||||||||||||||||
| Diluted EPS | $ | 2.05 | $ | 2.18 | $ | (0.13) | (6.0) | ||||||||||||||||||||||||||||||||||
| Other Financial Information**6 | |||||||||||||||||||||||||||||||||||||||||
| Adjusted Income From Operations and Adjusted Operating Margin | $ | 1,396 | 14.4 | $ | 1,484 | 15.2 | $ | (88) | (5.9) | ||||||||||||||||||||||||||||||||
| Adjusted Diluted EPS | $ | 2.21 | $ | 2.23 | $ | (0.02) | (0.9) |
(a)Exclusive of depreciation and amortization expense.
NA Not applicable
*Not meaningful
| Revenues |
During the six months ended June 30, 2023, revenues decreased by $34 million as compared to the six months ended June 30, 2022, representing a decline of 0.3%, or growth of 0.7% on a constant currency basis6. Our recently completed acquisitions contributed 120 basis points to revenue growth.
6 Adjusted Income from Operations, Adjusted Operating Margin, Adjusted Diluted EPS and constant currency revenue growth are not measures of financial performance prepared in accordance with GAAP. See “Non-GAAP Financial Measures” for more information and reconciliations to the most directly comparable GAAP financial measures.
| Cognizant Technology Solutions | 33 | June 30, 2023 Form 10-Q |
| Revenues - Reportable Business Segments and Geographic Markets |
Revenues of $9,698 million were as follows for the six months ended June 30, 2023:
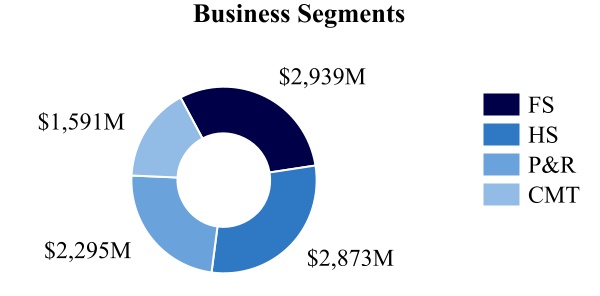
| YTD 2023 as compared to YTD 2022 | Increase / (Decrease) | |||||||||||||||||||||||||||||||
| (Dollars in millions) | $ | % | **CC %**7 | |||||||||||||||||||||||||||||
| Financial Services | $ | (131) | (4.3) | (3.1) | ||||||||||||||||||||||||||||
| Health Sciences | 73 | 2.6 | 2.8 | |||||||||||||||||||||||||||||
| Products and Resources | 25 | 1.1 | 2.5 | |||||||||||||||||||||||||||||
| CMT | (1) | (0.1) | 1.7 | |||||||||||||||||||||||||||||
| Total revenues | $ | (34) | (0.3) | 0.7 |
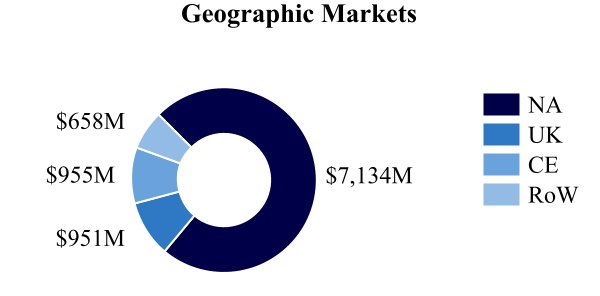
| YTD 2023 as compared to YTD 2022 | Increase / (Decrease) | |||||||||||||||||||||||||||||||
| (Dollars in millions) | $ | % | **CC %**7 | |||||||||||||||||||||||||||||
| North America | $ | (91) | (1.3) | (1.1) | ||||||||||||||||||||||||||||
| United Kingdom | 40 | 4.4 | 8.8 | |||||||||||||||||||||||||||||
| Continental Europe | 51 | 5.6 | 7.3 | |||||||||||||||||||||||||||||
| Europe - Total | 91 | 5.0 | 8.0 | |||||||||||||||||||||||||||||
| Rest of World | (34) | (4.9) | 0.5 | |||||||||||||||||||||||||||||
| Total revenues | $ | (34) | (0.3) | 0.7 |
Across all of our segments and geographic markets, revenues for the six months ended June 30, 2023 were negatively impacted by foreign currency exchange rate movements.7Our recently completed acquisitions contributed 120 basis points to revenue growth, including 260 basis points of growth to our Products and Resources segment (primarily in North America) and 290 basis points of growth to our Communications, Media and Technology segment (primarily in the United Kingdom and Continental Europe).
In addition:
*•*Reduced demand for discretionary work negatively impacted revenues, primarily in North America. Banking clients in our Financial Services segment, retail and consumer goods clients in our Products and Resources segment and clients in our Communications, Media and Technology segment were particularly affected;
-
North America revenues in the Communications, Media and Technology segment included growing demand for services related to digital content, primarily driven by the largest client in this segment, while growth in our Health Sciences segment in the region benefited from increased demand from healthcare payer clients for our integrated software solutions;
-
Revenue growth in the United Kingdom was driven by expansion of work with clients in the Financial Services and Communications Media and Technology segments;
-
Revenues in the Continental Europe region grew across all segments, led by increased demand from automotive clients within the Products and Resources segment; and
*•*Constant currency revenue growth in the Rest of World region was driven by increased demand from clients in our Products and Resources and Communications, Media and Technology segments, partially offset by weakness in the Financial Services and Health Sciences segments.
7 Constant currency revenue growth is not a measure of financial performance prepared in accordance with GAAP. See “Non-GAAP Financial Measures” for more information.
| Cognizant Technology Solutions | 34 | June 30, 2023 Form 10-Q |
| Cost of Revenues (Exclusive of Depreciation and Amortization Expense) |
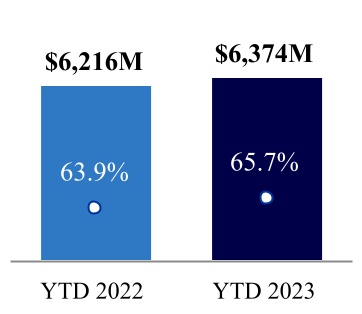
| é | $158M | |||||||||||||
| é | 1.8% as a % of revenues | |||||||||||||
| ¡ | % of Revenues | |||||||||||||
Our cost of revenues consists primarily of salaries, incentive-based compensation, stock-based compensation expense, employee benefits, project-related immigration and travel for technical personnel, subcontracting and equipment costs relating to revenues. The increase, as a percentage of revenues, was due to higher compensation costs for delivery personnel, primarily as a result of two merit increase cycles for the majority of our employees since October 2022, partially offset by the benefit of the depreciation of the Indian rupee against the U.S. dollar.
| SG&A Expenses (Exclusive of Depreciation and Amortization Expense) |
SG&A expenses consist primarily of salaries, incentive-based compensation, stock-based compensation expense, employee benefits, immigration, travel, marketing, communications, management, finance, administrative and occupancy costs. The decrease, as a percentage of revenues, was primarily due to the beneficial impact of foreign currency exchange rate movements and an insurance recovery benefit related to a previously disclosed 2020 cyber incident, partially offset by higher compensation costs, primarily as a result of two merit increase cycles for the majority of our employees since October 2022.
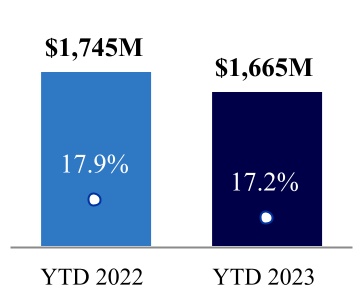
| ê | $80M | |||||||||||||
| ê | 0.7% as a % of revenues | |||||||||||||
| ¡ | % of Revenues | |||||||||||||
| Restructuring Charges |
Restructuring charges consist of costs related to the NextGen program. Restructuring charges were $117 million or 1.2%, as a percentage of revenue for the six months ended June 30, 2022. For further detail on our restructuring charges see Note 4 to our unaudited consolidated financial statements.
| Depreciation and Amortization Expense |
Depreciation and amortization expense decreased 8.4%, and by 0.2% as a percentage of revenues, during the six months ended June 30, 2023 as compared to the 2022 period, primarily driven by a reduction in amortization expense due to certain intangible assets reaching the end of their useful lives.
| Operating Margin and Adjusted Operating Margin8- Overall |
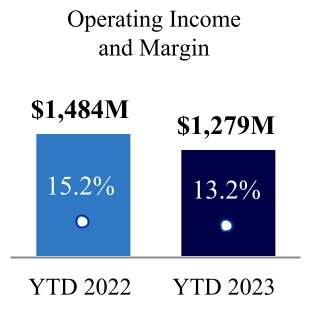

Our 2023 GAAP operating margin and Adjusted Operating Margin8 were negatively impacted by increased compensation costs, primarily as a result of two merit increase cycles for the majority of our employees since October 2022, partially offset by the benefit of the depreciation of the Indian rupee against the U.S. dollar, pricing actions taken in 2022 and an insurance recovery benefit in the second quarter of 2023 related to a previously disclosed 2020 cyber incident. In addition, our 2023 GAAP operating margin was negatively impacted by the NextGen charges, as discussed in Note 4 to our unaudited consolidated financial statements, which were excluded from our Adjusted Operating Margin.
Net of the impact of applicable designated cash flow hedges, the depreciation of the Indian rupee benefited our operating margin for the six months ended June 30, 2023 by 112 basis points as compared to the six months ended June 30, 2022. Excluding the impact of the hedges, the depreciation of the Indian rupee against the U.S. dollar positively impacted our operating margin by approximately 150 basis points during the six months ended June 30, 2023. The settlement of our cash flow hedges negatively impacted our operating margin by 18 basis points during the six months ended June 30, 2023, compared to a positive impact of 20 basis points during the 2022 period.
8 Adjusted Income from Operations and Adjusted Operating Margin are not measures of financial performance prepared in accordance with GAAP. See “Non-GAAP Financial Measures” for more information and reconciliations to the most directly comparable GAAP financial measures, as applicable.
| Cognizant Technology Solutions | 35 | June 30, 2023 Form 10-Q |
| Segment Operating Profit |
In the first quarter of 2023, we made certain changes to the internal measurement of segment operating profit for the purpose of evaluating segment performance and resource allocation. The primary reason for the change was to reflect a more complete cost of delivery. Specifically, segment operating profit now includes an allocation of both SG&A costs related to our integrated practices and the excess or shortfall of incentive-based compensation for commercial and delivery employees as compared to target, which were previously included in "unallocated costs." We have reported 2023 segment operating profits using the new allocation methodology and have recast the 2022 results to conform to the new methodology.
Segment operating profit and operating margin percentage were as follows:
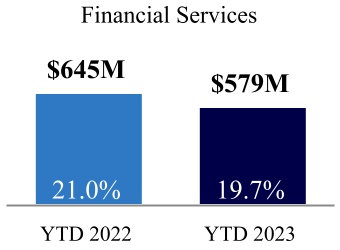
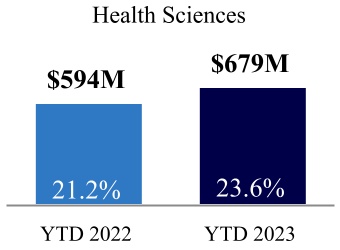

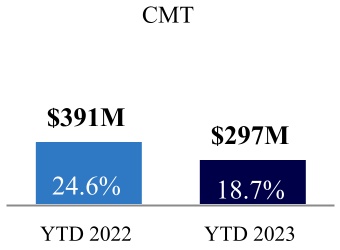
In the first half of 2023, segment operating margins across all our segments were negatively impacted by increased compensation costs, primarily as a result of two merit increase cycles for the majority of our employees since October 2022, partially offset by the benefits of both the depreciation of the Indian rupee against the U.S. dollar and pricing actions taken in 2022. In addition, segment operating margin in Health Sciences benefited in the first half of 2023 from higher margin integrated software solutions for healthcare payer clients, while segment operating margin in Communications, Media and Technology was negatively affected by a decrease in utilization due to a slowdown in revenue growth.
Total segment operating profit and margin were as follows for the six months ended June 30:
| (Dollars in millions) | 2023 | % of Revenues | 2022 | % of Revenues | Increase | ||||||||||||||||||||||||
| Total segment operating profit | $ | 2,018 | 20.8 | $ | 2,129 | 21.9 | $ | (111) | |||||||||||||||||||||
| Less: unallocated costs | 739 | 7.6 | 645 | 6.7 | 94 | ||||||||||||||||||||||||
| Income from operations | $ | 1,279 | 13.2 | $ | 1,484 | 15.2 | $ | (205) | |||||||||||||||||||||
The increase in unallocated costs for six months ended June 30, 2023 as compared to June 30, 2022 was primarily driven by the NextGen charges. See Note 4 to our unaudited consolidated financial statements.
| Other Income (Expense), Net |
The following table sets forth total other income (expense), net for the six months ended June 30:
| (in millions) | 2023 | 2022 | Increase/ Decrease | ||||||||||||||||||||
| Foreign currency exchange gains (losses) | $ | 27 | $ | (49) | $ | 76 | |||||||||||||||||
| (Losses) gains on foreign exchange forward contracts not designated as hedging instruments | (24) | 45 | (69) | ||||||||||||||||||||
| Foreign currency exchange gains (losses), net | 3 | (4) | 7 | ||||||||||||||||||||
| Interest income | 60 | 15 | 45 | ||||||||||||||||||||
| Interest expense | (19) | (5) | (14) | ||||||||||||||||||||
| Other, net | 2 | — | 2 | ||||||||||||||||||||
| Total other income (expense), net | $ | 46 | $ | 6 | $ | 40 |
The foreign currency exchange losses were attributed to the remeasurement of net monetary assets and liabilities denominated in currencies other than the functional currencies of our subsidiaries. The gains on foreign exchange forward contracts not designated as hedging instruments related to the realized and unrealized gains and losses on contracts entered into to offset our foreign currency exposures. The increase in interest income and interest expense was primarily attributable to higher interest rates in the current period.
| Cognizant Technology Solutions | 36 | June 30, 2023 Form 10-Q |
| Provision for Income Taxes |

| ê | $72M | |||||||||||||
| ¡ Effective Income Tax Rate ê 2.5% | ||||||||||||||
The effective income tax rate decreased primarily due to 2023 discrete benefits resulting from a settlement related to U.S. state income taxes and the settlement of the IRS examination for tax years 2017 and 2018 as described in Note 8 to our unaudited consolidated financial statements.
| Net Income |
The decrease in net income was driven by lower income from operations, partially offset by higher interest income and a lower effective tax rate.
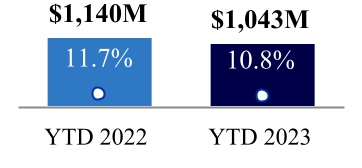
| ê | $97M | ||||||||||||||||
| ¡ ê 0.9% of Revenues | |||||||||||||||||
Non-GAAP Financial Measures
See “Three Months Ended June 30, 2023 Compared to Three Months Ended June 30, 2022 – Non-GAAP Financial Measures” above for additional information about our use of non-GAAP financial measures.
The following table presents a reconciliation of each non-GAAP financial measure to the most comparable GAAP measure for the six months ended June 30:
| (Dollars in millions, except per share amounts) | 2023 | % of Revenues | 2022 | % of Revenues | |||||||||||||||||||
| GAAP income from operations and operating margin | $ | 1,279 | 13.2 | $ | 1,484 | 15.2 | |||||||||||||||||
| NextGen charges (1) | 117 | 1.2 | — | — | |||||||||||||||||||
| Adjusted Income from Operations and Adjusted Operating Margin | $ | 1,396 | 14.4 | $ | 1,484 | 15.2 | |||||||||||||||||
| GAAP diluted EPS | $ | 2.05 | $ | 2.18 | |||||||||||||||||||
| Effect of NextGen charges, pre-tax | 0.23 | — | |||||||||||||||||||||
| Non-operating foreign currency exchange (gains) losses, pre-tax (2) | (0.01) | 0.01 | |||||||||||||||||||||
| Tax effect of above adjustments (3) | (0.06) | 0.04 | |||||||||||||||||||||
| Adjusted Diluted EPS | $ | 2.21 | $ | 2.23 | |||||||||||||||||||
(1)As part of the NextGen program, during the six months ended June 30, 2023, we incurred employee separation, facility exit and other costs. See Note 4 to our unaudited consolidated financial statements for additional information.
(2)Non-operating foreign currency exchange gains and losses, inclusive of gains and losses on related foreign exchange forward contracts not designated as hedging instruments for accounting purposes, are reported in "Foreign currency exchange gains (losses), net" in our unaudited consolidated statements of operations.
(3)Presented below are the tax impacts of each of our non-GAAP adjustments to pre-tax income:
| (in millions) | Six Months Ended June 30, | ||||||||||
| 2023 | 2022 | ||||||||||
| Non-GAAP income tax benefit (expense) related to: | |||||||||||
| NextGen charges | 31 | — | |||||||||
| Foreign currency exchange gains and losses | 5 | (20) |
The effective tax rate related to non-operating foreign currency exchange gains and losses varies depending on the jurisdictions in which such income and expenses are generated and the statutory rates applicable in those jurisdictions. As such, the income tax effect of non-operating foreign currency exchange gains and losses shown in the above table may not appear proportionate to the net pre-tax foreign currency exchange gains and losses reported in our unaudited consolidated statements of operations.
| Cognizant Technology Solutions | 37 | June 30, 2023 Form 10-Q |
| Liquidity and Capital Resources |
Our cash generated from operations has historically been the primary source of liquidity to fund operations and investments to grow our business. As of June 30, 2023, we had cash, cash equivalents and short-term investments of $2,095 million and available capacity under our credit facilities of approximately $2,000 million.
The following table provides a summary of cash flows for the six months ended June 30:
| (in millions) | 2023 | 2022 | Increase / Decrease | |||||||||||||||||||||||
| Net cash provided by (used in): | ||||||||||||||||||||||||||
| Operating activities | $ | 765 | $ | 834 | $ | (69) | ||||||||||||||||||||
| Investing activities | (300) | 229 | (529) | |||||||||||||||||||||||
| Financing activities | (704) | (1,050) | 346 | |||||||||||||||||||||||
Operating activities
The decrease in cash provided by operating activities for the six months ended June 30, 2023 as compared to the six months ended June 30, 2022 was primarily driven by an increase in income tax payments. In the second quarter of 2023, we made tax payments related to the mandatory capitalization of research and experimental expenditures for the 2022 tax year as well as the estimated tax payment for the six months ended June 30, 2023. Cash provided by operating activities for the six months ended June 30, 2023 benefited from improved collections of our trade accounts receivable.
We monitor turnover, aging and the collection of accounts receivable by client. Our DSO calculation includes receivables, net of allowance for doubtful accounts, and contract assets, reduced by the uncollected portion of deferred revenue. Our DSO was 75 days as of June 30, 2023, an increase of 1 day from 74 days as of December 31, 2022. Our DSO was 74 days as of June 30, 2022, an increase of 5 days from 69 days as of December 31, 2021.
Investing activities
Cash used in investing activities for the six months ended June 30, 2023 was driven by payments for business combinations and capital expenditures, partially offset by net maturities of investments. Cash provided by investing activities for the six months ended June 30, 2022 was primarily driven by net maturities of investments, partially offset by capital expenditures.
Financing activities
The decrease in cash used in financing activities for the six months ended June 30, 2023 as compared to the six months ended June 30, 2022 was primarily driven by lower repurchases of common stock.
The Credit Agreement provides for a $650 million Term Loan and a $1,850 million unsecured revolving credit facility, which are each due to mature in October 2027. We are required under the Credit Agreement to make scheduled quarterly principal payments on the Term Loan beginning in December 2023. As of June 30, 2023, we had no outstanding balance on the revolving credit facility. See Note 7 to our unaudited consolidated financial statements.
In March 2023, our India subsidiary renewed its working capital facility at 15 billion Indian rupee ($183 million at the June 30, 2023 exchange rate). This facility requires us to repay any balances drawn down within 90 days from the date of disbursement. There is a 1.0% prepayment penalty applicable to payments made within 30 days after disbursement. This working capital facility contains affirmative and negative covenants and may be renewed annually. As of June 30, 2023, we have not borrowed funds under this facility or any of its predecessor facilities.
| Cognizant Technology Solutions | 38 | June 30, 2023 Form 10-Q |
Capital Allocation
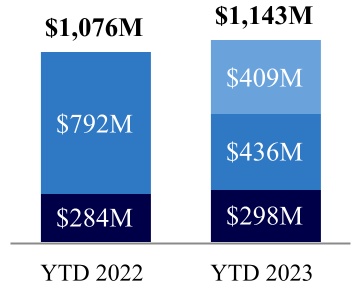
| Acquisitions | |||||
| Share Repurchases | |||||
| Dividend payments | |||||
We review our capital allocation on an ongoing basis, considering our financial performance and liquidity position, investments required to execute our strategic plans and initiatives, acquisition opportunities, the economic outlook, regulatory changes and other relevant factors. As these factors may change over time, the actual amounts expended on stock repurchase activity, dividends, and acquisitions, if any, during any particular period cannot be predicted and may fluctuate from time to time.
Other Liquidity and Capital Resources Information
We seek to ensure that our worldwide cash is available in the locations in which it is needed. As part of ongoing liquidity assessments, we regularly monitor the mix of domestic and international cash flows and cash balances. We evaluate on an ongoing basis what portion of the non-U.S. cash, cash equivalents and short-term investments is needed locally to execute our strategic plans and what amount is available for repatriation back to the United States.
We expect operating cash flows, cash and short-term investment balances, together with the available capacity under our revolving credit facilities, to be sufficient to meet our operating requirements, including purchase commitments, making Tax Reform Act transition tax payments and servicing our debt for the next twelve months. The ability to expand and grow our business in accordance with current plans, make acquisitions, meet long-term capital requirements beyond a twelve-month period and execute our capital return plan will depend on many factors, including the rate, if any, at which cash flow increases, our ability and willingness to pay for acquisitions with capital stock and the availability of public and private debt, including the ability to extend the maturity or refinance our existing debt, and equity financing. We cannot be certain that additional financing, if required, will be available on terms and conditions acceptable to us, if at all.
| Commitments and Contingencies |
See Note 12 to our unaudited consolidated financial statements.
| Critical Accounting Estimates |
Management’s discussion and analysis of our financial condition and results of operations is based on our unaudited consolidated financial statements that have been prepared in accordance with GAAP. The preparation of these financial statements requires management to make estimates and assumptions that affect the amounts reported for assets and liabilities, including the recoverability of tangible and intangible assets, disclosure of contingent assets and liabilities as of the date of the financial statements, and the reported amounts of revenues and expenses during the reported period. On an ongoing basis, we evaluate our estimates. The most significant estimates relate to the recognition of revenue and profits, including the application of the cost-to-cost method of measuring progress to completion for certain fixed-price contracts, income taxes, business combinations and valuation of goodwill and other long-lived assets. We base our estimates on historical experience, current trends and various other assumptions that are believed to be reasonable under the circumstances, the results of which form the basis for making judgments about the carrying values of assets and liabilities that are not readily apparent from other sources. The actual amounts may differ from the estimates used in the preparation of the accompanying unaudited consolidated financial statements. For a discussion of our critical accounting estimates, see “Item 7. Management’s Discussion and Analysis of Financial Condition and Results of Operations” in our Annual Report on Form 10-K for the year ended December 31, 2022. Our significant accounting policies are described in Note 1 to the audited consolidated financial statements included in our Annual Report on Form 10-K for the year ended December 31, 2022.
| Recently Adopted and New Accounting Pronouncements |
There have been no changes in the information provided regarding recently adopted and new accounting pronouncements in our Annual Report on Form 10-K for the year ended December 31, 2022.
Previous: Item 1. Consolidated Financial Statements (Unaudited). · Next: Item 3. Quantitative and Qualitative Disclosures about Market Risk.