 filings.tools
CVS Health 10-K 2019-12-31
Filed 2020-02-18. 22 sections, 831K characters. Original on sec.gov · Markdown · JSON
Cover and table of contents
UNITED STATES
SECURITIES AND EXCHANGE COMMISSION
Washington, D.C. 20549
FORM 10-K
(Mark One)
☑ ANNUAL REPORT PURSUANT TO SECTION 13 OR 15(d) OF THE SECURITIES EXCHANGE ACT OF 1934
For the fiscal year ended December 31, 2019
or
☐ TRANSITION REPORT PURSUANT TO SECTION 13 OR 15(d) OF THE SECURITIES EXCHANGE ACT OF 1934
For the transition period from _________ to_________
Commission file number: 001-01011

CVS HEALTH CORPORATION
(Exact name of registrant as specified in its charter)
| Delaware | 05-0494040 |
| (State or other jurisdiction of incorporation or organization) | (I.R.S. Employer Identification No.) |
| One CVS Drive, | Woonsocket, | Rhode Island | 02895 |
| (Address of principal executive offices) | (Zip Code) |
| Registrant’s telephone number, including area code: | (401) | 765-1500 |
| Securities registered pursuant to Section 12(b) of the Act: | ||
| Title of each class | Trading Symbol(s) | Name of each exchange on which registered |
| Common Stock, par value $0.01 per share | CVS | New York Stock Exchange |
| Securities registered pursuant to Section 12(g) of the Act: | None |
| Indicate by check mark if the registrant is a well-known seasoned issuer, as defined in Rule 405 of the Securities Act. | ☑ | Yes | ☐ | No | |||
| Indicate by check mark if the registrant is not required to file reports pursuant to Section 13 or Section 15(d) of the Act. | ☐ | Yes | ☑ | No | |||
| Indicate by check mark whether the registrant (1) has filed all reports required to be filed by Section 13 or 15(d) of the Securities Exchange Act of 1934 during the preceding 12 months (or for such shorter period that the registrant was required to file such reports), and (2) has been subject to such filing requirements for the past 90 days. | ☑ | Yes | ☐ | No | |||
| Indicate by check mark whether the registrant has submitted electronically every Interactive Data File required to be submitted pursuant to Rule 405 of Regulation S-T (§232.405 of this chapter) during the preceding 12 months (or for such shorter period that the registrant was required to submit such files). | ☑ | Yes | ☐ | No | |||
| Indicate by check mark whether the registrant is a large accelerated filer, an accelerated filer, a non-accelerated filer, a smaller reporting company, or an emerging growth company. See the definitions of “large accelerated filer,” “accelerated filer,” “smaller reporting company,” and “emerging growth company” in Rule 12b-2 of the Exchange Act. | |||||||
| Large accelerated filer | ☑ | Accelerated filer | ☐ | ||||
| Non-accelerated filer | ☐ | Smaller reporting company | ☐ | ||||
| Emerging growth company | ☐ | ||||||
| If an emerging growth company, indicate by check mark if the registrant has elected not to use the extended transition period for complying with any new or revised financial accounting standards provided pursuant to Section 13(a) of the Exchange Act. | ☐ | ||||||
| Indicate by check mark whether the registrant is a shell company (as defined in Rule 12b-2 of the Act). | ☐ | Yes | ☑ | No |
The aggregate market value of the registrant’s common stock held by non-affiliates was approximately $70,617,679,934 as of June 28, 2019, based on the closing price of the common stock on the New York Stock Exchange. For purposes of this calculation, only executive officers and directors are deemed to be affiliates of the registrant.
As of February 12, 2020, the registrant had 1,304,159,680 shares of common stock outstanding.
DOCUMENTS INCORPORATED BY REFERENCE
The following materials are incorporated by reference into this Form 10-K:
Information contained in the definitive proxy statement for CVS Health Corporation’s 2020 Annual Meeting of Stockholders, to be filed with the Securities and Exchange Commission within 120 days after the end of the fiscal year ended December 31, 2019 (the “Proxy Statement”), is incorporated by reference in Parts III and IV to the extent described therein.
TABLE OF CONTENTS
Unless the context otherwise requires, references to the terms “we,” “our” or “us” used throughout this Annual Report on Form 10-K (this “10-K”) refer to CVS Health Corporation (a Delaware corporation) (“CVS Health”) and its subsidiaries (collectively, the “Company”). References to competitors and other companies throughout this 10-K, including the information incorporated herein by reference, are for illustrative or comparison purposes only and do not indicate that these companies are the Company’s or any segment’s only competitors or closest competitors.
CAUTIONARY STATEMENT CONCERNING FORWARD-LOOKING STATEMENTS
The Private Securities Litigation Reform Act of 1995 (the “Reform Act”) provides a “safe harbor” for forward-looking statements, so long as (1) those statements are identified as forward-looking, and (2) the statements are accompanied by meaningful cautionary statements that identify important factors that could cause actual results to differ materially from those discussed in the statement. We want to take advantage of these safe harbor provisions.
Certain information contained in this 10-K is forward-looking within the meaning of the Reform Act or SEC rules. This information includes, but is not limited to: “Outlook for 2020” of Management’s Discussion and Analysis of Financial Condition and Results of Operations (“MD&A”) included in Item 7, “Quantitative and Qualitative Disclosures About Market Risk” included in Item 7A, “Government Regulation” included in Item 1, and “Risk Factors” included in Item 1A. In addition, throughout this 10-K and our other reports and communications, we use the following words or variations or negatives of these words and similar expressions when we intend to identify forward-looking statements:
| · | Anticipates | · | Believes | · | Can | · | Continue | · | Could |
| · | Estimates | · | Evaluate | · | Expects | · | Explore | · | Forecast |
| · | Guidance | · | Intends | · | Likely | · | May | · | Might |
| · | Outlook | · | Plans | · | Potential | · | Predict | · | Probable |
| · | Projects | · | Seeks | · | Should | · | View | · | Will |
All statements addressing the future operating performance of CVS Health or any segment or any subsidiary and/or future events or developments, including statements relating to corporate strategy; revenue or adjusted revenue; operating income or adjusted operating income; earnings per share or adjusted earnings per share; Pharmacy Services segment business, sales results and/or trends and/or operations; Retail/LTC segment business, sales results and/or trends and/or operations; Health Care Benefits segment business, sales results and/or trends, medical cost trends, medical membership, Medicare Part D membership, medical benefit ratios and/or operations; incremental investment spending; interest expense; effective tax rate; weighted-average share count; cash flow from operations; net capital expenditures; cash available for debt repayment; integration synergies; net synergies; integration costs; enterprise modernization; transformation; leverage ratio; cash available for enhancing shareholder value; inventory reduction, turn rate and/or loss rate; debt ratings; the Company’s ability to attract or retain customers and clients; store development and/or relocations; new product development; and the impact of industry and regulatory developments, as well as statements expressing optimism or pessimism about future operating results or events, are forward-looking statements within the meaning of the Reform Act.
Forward-looking statements rely on a number of estimates, assumptions and projections concerning future events, and are subject to a number of significant risks and uncertainties and other factors that could cause actual results to differ materially from those statements. Many of these risks and uncertainties and other factors are outside our control. Certain of these risks and uncertainties and other factors are described under “Risk Factors” included in Item 1A of this 10-K; these are not the only risks and uncertainties we face. There can be no assurance that the Company has identified all the risks that affect it. Additional risks and uncertainties not presently known to the Company or that the Company currently believes to be immaterial also may adversely affect the Company’s businesses. If any of those risks or uncertainties develops into actual events, these events or circumstances could have a material adverse effect on the Company’s businesses, operating results, cash flows, financial condition and/or stock price, among other effects.
You should not put undue reliance on forward-looking statements. Any forward-looking statement speaks only as of the date of this 10-K, and we disclaim any intention or obligation to update or revise forward-looking statements, whether as a result of new information, future events, uncertainties or otherwise.
PART I
Item 1. Business.
Overview
CVS Health Corporation (“CVS Health”), together with its subsidiaries (collectively, the “Company,” “we,” “our” or “us”), is the nation’s premier health innovation company helping people on their path to better health. Whether in one of its pharmacies or through its health services and plans, CVS Health is pioneering a bold new approach to total health by making quality care more affordable, accessible, simple and seamless. CVS Health is community-based and locally focused, engaging consumers with the care they need when and where they need it. The Company has approximately 9,900 retail locations, approximately 1,100 walk-in medical clinics, a leading pharmacy benefits manager with approximately 105 million plan members, a dedicated senior pharmacy care business serving more than one million patients per year and expanding specialty pharmacy services. CVS Health also serves an estimated 37 million people through traditional, voluntary and consumer-directed health insurance products and related services, including expanding Medicare Advantage offerings and a leading standalone Medicare Part D prescription drug plan (“PDP”). The Company believes its innovative health care model increases access to quality care, delivers better health outcomes and lowers overall health care costs.
On November 28, 2018 (the “Aetna Acquisition Date”), the Company acquired Aetna Inc. (“Aetna”) for a combination of cash and CVS Health stock (the “Aetna Acquisition”). The Company acquired Aetna to help improve the consumer health care experience by combining Aetna’s health care benefits products and services with CVS Health’s retail locations, walk-in medical clinics and integrated pharmacy capabilities with the goal of becoming the new, trusted front door to health care. Under the terms of the merger agreement, Aetna shareholders received $145.00 in cash and 0.8378 CVS Health shares for each Aetna share. The transaction valued Aetna at approximately $212 per share or approximately $70 billion. Including the assumption of Aetna’s debt, the total value of the transaction was approximately $78 billion. The Company financed the cash portion of the purchase price through a combination of cash on hand and by issuing approximately $45 billion of new debt, including senior notes and term loans. For additional information, see Note 2 ‘‘Acquisitions and Divestitures’’ included in Item 8 of this 10-K.
On October 10, 2018, the Company and Aetna entered into a consent decree with the U.S. Department of Justice (the “DOJ”) that allowed the Company’s proposed acquisition of Aetna to proceed, provided Aetna agreed to sell its individual standalone PDPs. As part of the agreement reached with the DOJ, Aetna entered into a purchase agreement with a subsidiary of WellCare Health Plans, Inc. (“WellCare”) for the divestiture of Aetna’s standalone PDPs effective December 31, 2018. On November 30, 2018, the Company completed the sale of Aetna’s standalone PDPs. The Company provided administrative services to, and retained the financial results of, the divested plans through 2019. Subsequent to 2019, the Company will no longer retain the financial results of the divested plans. Aetna’s standalone PDPs had an aggregate of 2.5 million members as of December 31, 2019.
As a result of the Aetna Acquisition, the Company added the Health Care Benefits segment. Certain aspects of Aetna’s operations, including products for which the Company no longer solicits or accepts new customers, such as large case pensions and long-term care insurance products, are included in the Company’s Corporate/Other segment.
Effective for the first quarter of 2019, the Company realigned the composition of its segments to correspond with changes to its operating model and reflect how its Chief Operating Decision Maker reviews information and manages the business. As a result of this realignment, the Company’s SilverScript® PDP moved from the Pharmacy Services segment to the Health Care Benefits segment. In addition, the Company moved Aetna’s mail order and specialty pharmacy operations from the Health Care Benefits segment to the Pharmacy Services segment. Segment financial information has been retrospectively adjusted to reflect these changes. See Note 17 ‘‘Segment Reporting’’ included in Item 8 of this 10-K for segment financial information.
The Company has four reportable segments: Pharmacy Services, Retail/LTC, Health Care Benefits and Corporate/Other.
Business Strategy
CVS Health’s purpose of helping people on their path to better health guides the Company’s approach to transforming the consumer health experience. The Company is working to create the most consumer-centric health company by being consumer obsessed and pursuing its three strategic goals: be local, make it simple and improve health. These goals are embedded in the Company’s four Enterprise priorities: growing and differentiating our businesses, delivering transformational products and services, creating a consumer-centric technology infrastructure and modernizing Enterprise functions and capabilities. The
Company believes its strategy of putting the consumer at the center of care will drive long-term sustainable value and place the Company at the forefront of the evolution of health care.
Pharmacy Services Segment
The Pharmacy Services segment provides a full range of pharmacy benefit management (“PBM”) solutions, including plan design offerings and administration, formulary management, retail pharmacy network management services, mail order pharmacy, specialty pharmacy and infusion services, clinical services, disease management services and medical spend management. The Pharmacy Services segment’s clients are primarily employers, insurance companies, unions, government employee groups, health plans, PDPs, Medicaid managed care (“Managed Medicaid”) plans, plans offered on public health insurance exchanges (“Public Exchanges”) and private health insurance exchanges (“Private Exchanges” and together with Public Exchanges, “Insurance Exchanges”), other sponsors of health benefit plans and individuals throughout the U.S. The Pharmacy Services segment includes retail specialty pharmacy stores, specialty mail order pharmacies, mail order dispensing pharmacies, compounding pharmacies and branches for infusion and enteral nutrition services. During the year ended December 31, 2019, the Company’s PBM filled or managed 2.0 billion prescriptions on a 30-day equivalent basis.
PBM Services
The Company dispenses prescription drugs directly through its mail order dispensing and specialty mail order pharmacies and through pharmacies in its retail network. All prescriptions processed by the Company are analyzed, processed and documented by the Company’s proprietary prescription management systems. These systems provide essential features and functionality to allow plan members to utilize their prescription drug benefits. These systems also streamline the process by which prescriptions are processed by staff and network pharmacists by enhancing review of various items through automation, including plan eligibility, early refills, duplicate dispensing, appropriateness of dosage, drug interactions or allergies, over-utilization and potential fraud.
Plan Design Offerings and Administration
The Company administers pharmacy benefit plans for clients who contract with it to facilitate prescription drug coverage and claims processing for their eligible plan members. The Company assists its PBM clients in designing pharmacy benefit plans that help improve health outcomes while minimizing the costs to the client. The Company also assists PBM clients in monitoring the effectiveness of their plans through frequent, informal communications, the use of proprietary software, as well as through formal annual, quarterly and sometimes monthly performance reviews.
The Company makes recommendations to help PBM clients design benefit plans that promote
Showing the first 8K of 149K characters. Open the full section
Item 1A. Risk Factors.
You should carefully consider each of the following risks and uncertainties and all of the other information set forth in this Form 10-K. These risks and uncertainties and other factors may affect forward-looking statements, including those we make in this Form 10-K or elsewhere, such as in news releases or investor or analyst calls, meetings or presentations, on our websites or through our social media channels. The risks and uncertainties described below are not the only ones we face. There can be no assurance that we have identified all the risks that affect us. Additional risks and uncertainties not presently known to us or that we currently believe to be immaterial also may adversely affect our businesses. Any of these risks or uncertainties could cause our actual results to differ materially from our expectations and the expected results discussed in our forward-looking statements. You should not consider past results to be an indication of future performance.
If any of the following risks or uncertainties develops into actual events or if the circumstances described in the risks or uncertainties occur or continue to occur, those events or circumstances could have a material adverse effect on our businesses, operating results, cash flows, financial condition and/or stock price, among other effects on us. You should read the following section in conjunction with the MD&A, included in Item 7 of this Form 10-K, our consolidated financial statements and the related notes, included in Item 8 of this 10-K, and our “Cautionary Statement Concerning Forward-Looking Statements” in this 10-K.
Risks Relating to Our Businesses
Each of our segments operates in a highly competitive and evolving business environment; and gross margins in the industries in which we compete may decline.
Each of our segments, Pharmacy Services, which includes our pharmacy benefit management (“PBM”) business, Retail/LTC, and Health Care Benefits, operates in a highly competitive and evolving business environment. Specifically:
| • | As competition increases in the geographies in which we operate, including competition from new entrants, a significant increase in price compression and/or reimbursement pressures could occur, and this could require us to reevaluate our pricing structures to remain competitive. |
| • | The competitive success of our Pharmacy Services segment is dependent on our ability to establish and maintain contractual relationships with network pharmacies as PBM clients evaluate adopting narrow or restricted retail pharmacy networks. |
| • | The competitive success of our Retail/LTC segment and our specialty pharmacy operations is dependent on our ability to establish and maintain contractual relationships with PBMs and other payors on acceptable terms as the payors’ clients evaluate adopting narrow or restricted retail pharmacy networks. |
| • | In our PBM business, we maintain contractual relationships with brand name drug manufacturers that provide for purchase discounts and/or rebates on drugs dispensed by pharmacies in our retail network and by our specialty and mail order pharmacies (all or a portion of which may be passed on to clients). Manufacturer’s rebates often depend on a PBM’s ability to meet contractual requirements, including the placement of a manufacturer’s products on the PBM’s formularies. If we lose our relationship with one or more drug manufacturers, or if the discounts or rebates provided by drug manufacturers decline, our operating results, cash flows and/or prospects could be adversely affected. |
| • | The PBM industry has been experiencing price compression as a result of competitive pressures and increased client demands for lower prices, increased revenue sharing, including sharing in a larger portion of rebates received from drug manufacturers, enhanced service offerings and/or higher service levels. Marketplace dynamics and regulatory changes also have adversely affected our ability to offer plan sponsors pricing that includes the use of retail “differential” or “spread,” which could adversely affect our future profitability, and we expect these trends to continue. |
| • | Our retail pharmacy, specialty pharmacy and LTC pharmacy operations have been affected by reimbursement pressure caused by competition, including client demands for lower prices, generic drug pricing, earlier than expected generic drug introductions and network reimbursement pressure. If we are unable to increase our prices to reflect, or otherwise mitigate the impact of, increasing costs, our profitability will be adversely affected. If we are unable to limit our price increases, we may lose customers to competitors with more favorable pricing, adversely affecting our revenues and operating results. |
| • | A shift in the mix of our pharmacy prescription volume towards programs offering lower reimbursement rates as a result of competition or otherwise could adversely affect our margins, including the ongoing shift in pharmacy mix towards 90-day prescriptions at retail and the ongoing shift in pharmacy mix towards Medicare Part D prescriptions. |
| • | PBM client contracts often are for a period of approximately three years. However, PBM clients may require early or periodic re-negotiation of pricing prior to contract expiration. PBM clients are generally well informed, can move between us and our competitors and often seek competing bids prior to expiration of their contracts. We are therefore under pressure |
to contain price increases despite being faced with increasing drug costs and increasing operating costs. If we are unable to increase our prices to reflect, or otherwise mitigate the impact of, increasing costs, our profitability will be adversely affected. If we are unable to limit our price increases, we may lose customers to competitors with more favorable pricing, adversely affecting our revenues and operating results.
| • | The operating results and margins of our LTC business are further affected by the increased efforts of health care payors to negotiate reduced or capitated pricing arrangements and by the financial health of, and purchases and sales of, our LTC customers. |
| • | In our Health Care Benefits segment we are seeking to substantially grow our Medicaid, dual eligible and dual eligible special needs plan membership over the next several years. In many instances, to acquire and retain our government customers’ business, we must bid against our competitors in a highly competitive environment. Winning bids often are challenged successfully by unsuccessful bidders. |
| • | Customer contracts in our Health Care Benefits segment are generally for a period of one year, and our customers have considerable flexibility in moving between us and our competitors. One of the key factors on which we compete for customers, especially in uncertain economic environments, is overall cost. We are therefore under pressure to contain premium price increases despite being faced with increasing health care and other benefit costs and increasing operating costs. If we are unable to increase our prices to reflect, or otherwise mitigate the impact of, increasing costs, our profitability will be adversely affected. If we are unable to limit our price increases, we may lose members to competitors with more favorable pricing, adversely affecting our revenues and operating results. In response to rising prices, our customers may elect to self-insure or to reduce benefits in order to limit increases in their benefit costs. Alternatively, our customers may purchase different types of products from us that are less profitable. Such elections may result in reduced membership in our more profitable Insured pr |
Showing the first 8K of 129K characters. Open the full section
Item 1B. Unresolved Staff Comments.
There are no unresolved SEC Staff Comments.
Item 2. Properties.
The Company’s principal office is an owned building complex located in Woonsocket, Rhode Island, which totals approximately one million square feet. The Company also leases office space in other locations in the United States.
Pharmacy Services Segment
The Pharmacy Services segment includes owned or leased mail service dispensing pharmacies, call centers, on-site pharmacy stores, retail specialty pharmacy stores, specialty mail service pharmacies and branches for infusion and enteral services throughout the United States.
Retail/LTC Segment
As of December 31, 2019, the Retail/LTC segment operated the following properties:
| • | Approximately 8,170 retail stores, of which approximately 5% were owned. Net selling space for retail stores was approximately 80.3 million square feet as of December 31, 2019. Approximately 45% of the store base was opened or significantly remodeled within the last five years; |
| • | Approximately 1,725 retail pharmacies and approximately 80 clinics in Target stores; |
| • | Owned distribution centers and leased distribution facilities throughout the U.S. totaling approximately 10.5 million square feet; and |
| • | Owned and leased LTC pharmacies throughout the U.S. and an owned LTC repackaging facility. |
In connection with certain business dispositions completed between 1995 and 1997, the Company continues to guarantee lease obligations for 79 former stores. The Company is indemnified for these guarantee obligations by the respective initial purchasers. These guarantees generally remain in effect for the initial lease term and any extension thereof pursuant to a renewal option provided for in the lease prior to the time of the disposition. For additional information on these guarantees, see “Lease Guarantees” in Note 16 ‘‘Commitments and Contingencies’’ included in Item 8 of this 10-K.
Health Care Benefits Segment
The Health Care Benefits segment’s principal office is an owned building complex located in Hartford, Connecticut, which totals approximately 1.7 million square feet. The Health Care Benefits segment also owns or leases office space in other locations in the United States and several other countries.
Management believes that the Company’s owned and leased facilities are suitable and adequate to meet the Company’s anticipated needs. At the end of the existing lease terms, management believes the leases can be renewed or replaced by alternative space. For additional information on the amount of right-of-use assets and lease liabilities for the Company’s leases, see Note 6 ‘‘Leases’’ included in Item 8 of this 10-K.
Item 3. Legal Proceedings.
I. Legal Proceedings
The information contained in Note 16 ‘‘Commitments and Contingencies’’ included in Item 8 of this 10-K is incorporated herein by reference.
II. Environmental Matters
Item 103 of SEC Regulation S-K requires disclosure of environmental legal proceedings with a governmental authority if management reasonably believes that the proceedings involve potential monetary sanctions of $100,000 or more. The Company is in the process of negotiating with the New York State Department of Environmental Conservation to resolve claims of
alleged historical noncompliance with hazardous waste regulations in connection with LTC pharmacies in the State of New York. These proceedings are not material to the Company’s business or financial condition.
Item 4. Mine Safety Disclosures.
Not applicable.
Information about our Executive Officers
The following sets forth the name, age and biographical information for each of the Registrant’s executive officers as of February 18, 2020. In each case the officer’s term of office extends to the date of the meeting of the CVS Health Board of Directors (the “Board”) following the next annual meeting of stockholders of CVS Health. Previous positions and responsibilities held by each of the executive officers over the past five years or more are indicated below:
Lisa G. Bisaccia, age 63, Executive Vice President of CVS Health Corporation since March 2016 and Chief Human Resources Officer of CVS Health Corporation since January 2010; Senior Vice President of CVS Health Corporation from January 2010 through February 2016. Ms. Bisaccia is also a member of the board of directors of Aramark, a leading global provider of food, facilities and uniform services.
Eva C. Boratto, age 53, Executive Vice President and Chief Financial Officer of CVS Health Corporation since November 2018; Executive Vice President - Controller and Chief Accounting Officer of CVS Health Corporation from March 2017 through November 2018; Senior Vice President - Controller and Chief Accounting Officer of CVS Health Corporation from July 2013 through February 2017.
Troyen A. Brennan, M.D., age 65, Executive Vice President and Chief Medical Officer of CVS Health Corporation since November 2008; Executive Vice President and Chief Medical Officer of Aetna Inc. from February 2006 through November 2008.
James D. Clark, age 55, Senior Vice President - Controller and Chief Accounting Officer of CVS Health Corporation since November 2018; Vice President - Finance and Accounting of CVS Pharmacy, Inc. from September 2009 through October 2018.
Joshua M. Flum, age 50, Executive Vice President, Enterprise Strategy and Digital of CVS Health Corporation since November 2018; Executive Vice President, Corporate Strategy and Business Development of CVS Pharmacy, Inc. from June 2016 through October 2018; Executive Vice President - Pharmacy Services of CVS Pharmacy, Inc. from March 2015 through May 2016; Senior Vice President of Retail Pharmacy of CVS Pharmacy, Inc. from December 2010 through February 2015. Mr. Flum is a member of the board of directors of CreditRiskMonitor.com, Inc., a company that facilitates the analysis of corporate financial risk, mostly in the context of the extension of trade credit from one business to another.
Alan M. Lotvin, M.D., age 58, served as Executive Vice President - Transformation of CVS Health Corporation from June 2018 through February 2020, and will serve as Executive Vice President of CVS Health Corporation and President of CVS Caremark following the departure of Mr. Rice. Dr. Lotvin served as Executive Vice President - Specialty Pharmacy, CVS Caremark from November 2012 through May 2018.
Karen S. Lynch, age 57, Executive Vice President of CVS Health Corporation since November 2018; President of Aetna since January 2015; Executive Vice President, Local and Regional Businesses of Aetna from February 2013 through December 2014. Ms. Lynch is a member of the board of directors of U.S. Bancorp, a banking and financial services company.
Larry J. Merlo, age 64, President and Chief Executive Officer of CVS Health Corporation since March 2011; and a director of CVS Health Corporation since May 2010.
Thomas M. Moriarty, age 56, Executive Vice President and General Counsel of CVS Health Corporation since October 2012; Chief Policy and External Affairs Officer since March 2017; Chief Strategy Officer from March 2014 through February 2017.
Derica W. Rice, age 54, Executive Vice President of CVS Health Corporation and President of CVS Caremark since March 2018; Executive Vice President of Global Services and Chief Financial Officer of Eli Lilly & Company from May 2006 through December 2017. Mr. Rice is a director of The Walt Disney Company since March 2019 and was a director of Target Corporation from September 2007 until January 2018. Mr. Rice will be leaving the Company effective March 1, 2020.
Jonathan C. Roberts, age 64, Executive Vice President and Chief Operating Officer of CVS Health Corporation since March 2017 and Interim President of CVS Pharmacy since January 2020; Executive Vice President of CVS Health Corporation and President of CVS Caremark from September 2012 through February 2017.
PART II
Item 5. Market for Registrant’s Common Equity, Related Stockholder Matters and Issuer Purchases of Equity Securities.
On February 3, 2020, the Company announced that Richard J. Swift, Richard M. Bracken and Mark T. Bertolini would not stand for re-election at the Company’s upcoming Annual Meeting of Stockholders (the “2020 Annual Meeting”). On February 7, 2020, Mr. Bertolini informed the Company of his decision to resign from the Board, effective immediately. On February 10, 2020, the Board reduced the size of the Board from 16 to 15 members effective immediately and further reduced the size of the Board to 13 members effective at the time of the 2020 Annual Meeting.
Market information
CVS Health’s common stock is listed on the New York Stock Exchange under the symbol “CVS.”
Dividends
CVS Health has paid cash dividends every quarter since becoming a public company. Future dividends will depend on the Company’s earnings, capital requirements, financial condition and other factors considered relevant by CVS Health’s Board of Directors.
See Note 12 ‘‘Shareholders’ Equity’’ included in Item 8 of this 10-K for information regarding CVS Health’s dividends.
Holders of common stock
As of February 12, 2020, there were 26,656 registered holders of the registrant’s common stock according to the records maintained by the registrant’s transfer agent.
Issuer purchases of equity securities
The following share repurchase programs have been authorized by the Board:
| In billions | Remaining as of | ||||||
| Authorization Date | Authorized | December 31, 2019 | |||||
| November 2, 2016 (“2016 Repurchase Program”) | $ | 15.0 | $ | 13.9 | |||
| December 15, 2014 (“2014 Repurchase Program”) | 10.0 | — |
Each of the share Repurchase Programs was effective immediately. The 2014 Repurchase Program has been completed. The 2016 Repurchase Program permits the Company to effect repurchases from time to time through a combination of open market repurchases, privately negotiated transactions, accelerated share repurchase transactions, and/or other derivative transactions. The 2016 Repurchase Program can be modified or terminated by the Board at any time. During the three months ended December 31, 2019, the Company did not repurchase any shares of common stock.
See Note 12 ‘‘Shareholders’ Equity’’ included in Item 8 of this 10-K for additional information regarding the Company’s share repurchases.
Stock Performance Graph
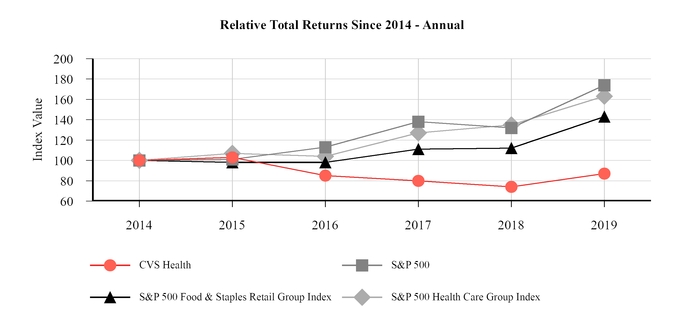
The following graph compares the cumulative total shareholder return on CVS Health’s common stock (assuming reinvestment of dividends) with the cumulative total return on the S&P 500 Index, the S&P 500 Food and Staples Retailing Industry Group Index and the S&P 500 Healthcare Sector Group Index from December 31, 2014 through December 31, 2019. The graph assumes a $100 investment in shares of CVS Health’s common stock on December 31, 2014.
| December 31, | |||||||||||||||||||||||
| 2014 | 2015 | 2016 | 2017 | 2018 | 2019 | ||||||||||||||||||
| CVS Health Corporation | $ | 100 | $ | 103 | $ | 85 | $ | 80 | $ | 74 | $ | 87 | |||||||||||
| S&P 500 (1) | 100 | 101 | 113 | 138 | 132 | 174 | |||||||||||||||||
| S&P 500 Food & Staples Retail Group Index (2) | 100 | 98 | 98 | 111 | 112 | 143 | |||||||||||||||||
| S&P 500 Health Care Group Index (1) (3) | 100 | 107 | 104 | 127 | 135 | 163 |
| (1) | Includes CVS Health. |
| (2) | Includes 5 companies (COST, KR, SYY, WBA, WMT). |
| (3) | Includes 61 companies. |
The year-ended values of each investment shown in the preceding graph are based on share price appreciation plus dividends, with the dividends reinvested as of the last business day of the month during which such dividends were ex-dividend. The calculations exclude trading commissions and taxes. Total shareholder returns from each investment can be calculated from the year-end investment values shown beneath the graph.
Item 6. Selected Financial Data.
The selected consolidated financial data of CVS Health Corporation as of and for the periods indicated in the five-year period ended December 31, 2019, has been derived from the consolidated financial statements of CVS Health Corporation. The selected consolidated financial data should be read in conjunction with the MD&A included in Item 7 of this 10-K and the audited consolidated financial statements and related notes included in Item 8 of this 10-K.
| In millions, except per share amounts | 2019 | 2018 (1) | 2017 | 2016 | 2015 | ||||||||||||||
| Statement of operations data: | |||||||||||||||||||
| Total revenues | $ | 256,776 | $ | 194,579 | $ | 184,786 | $ | 177,546 | $ | 153,311 | |||||||||
| Operating income | 11,987 | 4,021 | 9,538 | 10,386 | 9,496 | ||||||||||||||
| Income (loss) from continuing operations | 6,631 | (596 | ) | 6,631 | 5,320 | 5,230 | |||||||||||||
| Net income (loss) attributable to CVS Health | 6,634 | (594 | ) | 6,622 | 5,317 | 5,237 | |||||||||||||
| Per common share data: | |||||||||||||||||||
| Basic earnings (loss) per common share: | |||||||||||||||||||
| Income (loss) from continuing operations attributable to CVS Health | $ | 5.10 | $ | (0.57 | ) | $ | 6.48 | $ | 4.93 | $ | 4.65 | ||||||||
| Income (loss) from discontinued operations attributable to CVS Health | $ | — | $ | — | $ | (0.01 | ) | $ | — | $ | 0.01 | ||||||||
| Net income (loss) attributable to CVS Health | $ | 5.10 | $ | (0.57 | ) | $ | 6.47 | $ | 4.93 | $ | 4.66 | ||||||||
| Diluted earnings (loss) per common share: | |||||||||||||||||||
| Income (loss) from continuing operations attributable to CVS Health | $ | 5.08 | $ | (0.57 | ) | $ | 6.45 | $ | 4.91 | $ | 4.62 | ||||||||
| Income (loss) from discontinued operations attributable to CVS Health | $ | — | $ | — | $ | (0.01 | ) | $ | — | $ | 0.01 | ||||||||
| Net income (loss) attributable to CVS Health | $ | 5.08 | $ | (0.57 | ) | $ | 6.44 | $ | 4.90 | $ | 4.63 | ||||||||
| Dividends per common share | $ | 2.00 | $ | 2.00 | $ | 2.00 | $ | 1.70 | $ | 1.40 | |||||||||
| Balance sheet and other data: | |||||||||||||||||||
| Total assets | $ | 222,449 | $ | 196,456 | $ | 95,131 | $ | 94,462 | $ | 92,437 | |||||||||
| Long-term debt, less current portion | $ | 64,699 | $ | 71,444 | $ | 22,181 | $ | 25,615 | $ | 26,267 | |||||||||
| Total shareholders’ equity | $ | 64,170 | $ | 58,543 | $ | 37,695 | $ | 36,834 | $ | 37,203 | |||||||||
| Number of stores (at end of year) | 9,941 | 9,967 | 9,846 | 9,750 | 9,681 |
| (1) | On November 28, 2018, the Company acquired Aetna. Aetna’s operations are included in the Company’s consolidated financial statements subsequent to the Aetna Acquisition Date. See Note 2 ‘‘Acquisitions and Divestitures’’ included in Item 8 of this 10-K for additional information. |
Item 7. Management’s Discussion and Analysis of Financial Condition and Results of Operations. (“MD&A”)
The following discussion and analysis should be read in conjunction with the audited consolidated financial statements and related notes included in Item 8 of this 10-K, “Risk Factors” included in Item 1A of this 10-K and the “Cautionary Statement Concerning Forward Looking Statements” in this 10-K.
Overview of Business
CVS Health Corporation (“CVS Health”), together with its subsidiaries (collectively, the “Company,” “we,” “our” or “us”), is the nation’s premier health innovation company helping people on their path to better health. Whether in one of its pharmacies or through its health services and plans, CVS Health is pioneering a bold new approach to total health by making quality care more affordable, accessible, simple and seamless. CVS Health is community-based and locally focused, engaging consumers with the care they need when and where they need it. The Company has approximately 9,900 retail locations, approximately 1,100 walk-in medical clinics, a leading pharmacy benefits manager with approximately 105 million plan members, a dedicated senior pharmacy care business serving more than one million patients per year and expanding specialty pharmacy services. CVS Health also serves an estimated 37 million people through traditional, voluntary and consumer-directed health insurance products and related services, including expanding Medicare Advantage offerings and a leading standalone Medicare Part D prescription drug plan (“PDP”). The Company believes its innovative health care model increases access to quality care, delivers better health outcomes and lowers overall health care costs.
On November 28, 2018 (the “Aetna Acquisition Date”), the Company acquired Aetna Inc. (“Aetna”) for a combination of cash and CVS Health stock (the “Aetna Acquisition”). The Company acquired Aetna to help improve the consumer health care experience by combining Aetna’s health care benefits products and services with CVS Health’s retail locations, walk-in medical clinics and integrated pharmacy capabilities with the goal of becoming the new, trusted front door to health care. Under the terms of the merger agreement, Aetna shareholders received $145.00 in cash and 0.8378 CVS Health shares for each Aetna share. The transaction valued Aetna at approximately $212 per share or approximately $70 billion. Including the assumption of Aetna’s debt, the total value of the transaction was approximately $78 billion. The Company financed the cash portion of the purchase price through a combination of cash on hand and by issuing approximately $45 billion of new debt, including senior notes and term loans (see “Liquidity and Capital Resources” later in this MD&A). The consolidated financial statements reflect Aetna’s results subsequent to the Aetna Acquisition Date.
On October 10, 2018, the Company and Aetna entered into a consent decree with the U.S. Department of Justice (the “DOJ”) that allowed the Company’s proposed acquisition of Aetna to proceed, provided Aetna agreed to sell its individual standalone PDPs. As part of the agreement reached with the DOJ, Aetna entered into a purchase agreement with a subsidiary of WellCare Health Plans, Inc. (“WellCare”) for the divestiture of Aetna’s standalone PDPs effective December 31, 2018. On November 30, 2018, the Company completed the sale of Aetna’s standalone PDPs. The Company provided administrative services to, and retained the financial results of, the divested plans through 2019. Subsequent to 2019, the Company will no longer retain the financial results of the divested plans. Aetna’s standalone PDPs had an aggregate of 2.5 million members as of December 31, 2019.
As a result of the Aetna Acquisition, the Company added the Health Care Benefits segment. Certain aspects of Aetna’s operations, including products for which the Company no longer solicits or accepts new customers, such as large case pensions and long-term care insurance products, are included in the Company’s Corporate/Other segment.
Effective for the first quarter of 2019, the Company realigned the composition of its segments to correspond with changes to its operating model and reflect how its Chief Operating Decision Maker (the “CODM”) reviews information and manages the business. As a result of this realignment, the Company’s SilverScript® PDP moved from the Pharmacy Services segment to the Health Care Benefits segment. In addition, the Company moved Aetna’s mail order and specialty pharmacy operations from the Health Care Benefits segment to the Pharmacy Services segment. Segment financial information has been retrospectively adjusted to reflect these changes. See Note 17 ‘‘Segment Reporting’’ included in Item 8 of this 10-K for segment financial information.
The Company has four reportable segments: Pharmacy Services, Retail/LTC, Health Care Benefits and Corporate/Other, which are described below.
Overview of the Pharmacy Services Segment
The Pharmacy Services segment provides a full range of pharmacy benefit management (“PBM”) solutions, including plan design offerings and administration, formulary management, retail pharmacy network management services, mail order pharmacy, specialty pharmacy and infusion services, clinical services, disease management services and medical spend management. The Pharmacy Services segment’s clients are primarily employers, insurance companies, unions, government employee groups, health plans, PDPs, Medicaid managed care plans, plans offered on public health insurance exchanges and private health insurance exchanges, other sponsors of health benefit plans and individuals throughout the United States. The Pharmacy Services segment operates retail specialty pharmacy stores, specialty mail order pharmacies, mail order dispensing pharmacies, compounding pharmacies and branches for infusion and enteral nutrition services. During the year ended December 31, 2019, the Company’s PBM filled or managed 2.0 billion prescriptions on a 30-day equivalent basis.
Overview of the Retail/LTC Segment
The Retail/LTC segment sells prescription drugs and a wide assortment of general merchandise, including over-the-counter drugs, beauty products, cosmetics and personal care products, provides health care services through its MinuteClinic® walk-in medical clinics and conducts long-term care pharmacy (“LTC”) operations, which distribute prescription drugs and provide related pharmacy consulting and other ancillary services to chronic care facilities and other care settings. As of December 31, 2019, the Retail/LTC segment operated approximately 9,900 retail locations, approximately 1,100 MinuteClinic® locations as well as online retail pharmacy websites, LTC pharmacies and onsite pharmacies. During the year ended December 31, 2019, the Retail/LTC segment filled 1.4 billion prescriptions on a 30-day equivalent basis. For the year ended December 31, 2019, the Company dispensed approximately 26.6% of the total retail pharmacy prescriptions in the United States.
Overview of the Health Care Benefits Segment
The Health Care Benefits segment is one of the nation’s leading diversified health care benefits providers, serving an estimated 37 million people as of December 31, 2019. The Health Care Benefits segment has the information and resources to help members, in consultation with their health care professionals, make more informed decisions about their health care. The Health Care Benefits segment offers a broad range of traditional, voluntary and consumer-directed health insurance products and related services, including medical, pharmacy, dental and behavioral health plans, medical management capabilities, Medicare Advantage and Medicare Supplement plans, PDPs, Medicaid health care management services, workers’ compensation administrative services and health information technology products and services. The Health Care Benefits segment’s customers include employer groups, individuals, college students, part-time and hourly
Showing the first 8K of 140K characters. Open the full section
Item 7A. Quantitative and Qualitative Disclosures About Market Risk.
The Company’s earnings and financial condition are exposed to interest rate risk, credit quality risk, market valuation risk, foreign currency risk, commodity risk and operational risk.
Evaluation of Interest Rate and Credit Quality Risk
The Company manages interest rate risk by seeking to maintain a tight match between the durations of assets and liabilities when appropriate. The Company manages credit quality risk by seeking to maintain high average credit quality ratings and diversified sector exposure within its debt securities portfolio. In connection with its investment and risk management objectives, the Company also uses derivative financial instruments whose market value is at least partially determined by, among other things, levels of or changes in interest rates (short-term or long-term), duration, prepayment rates, equity markets or credit ratings/spreads. The Company’s use of these derivatives is generally limited to hedging risk and has principally consisted of using interest rate swaps, treasury rate locks, forward contracts, futures contracts, warrants, put options and credit default swaps. These instruments, viewed separately, subject the Company to varying degrees of interest rate, equity price and credit risk. However, when used for hedging, the Company expects these instruments to reduce overall risk.
Investments
The Company’s investment portfolio supported the following products at December 31, 2019 and 2018:
| In millions | 2019 | 2018 | |||||
| Experience-rated products | $ | 1,100 | $ | 1,063 | |||
| Remaining products | 18,587 | 17,191 | |||||
| Total investments | $ | 19,687 | $ | 18,254 |
Investment risks associated with experience-rated products generally do not impact the Company’s operating results. The risks associated with investments supporting experience-rated pension and annuity products in the large case pensions business in the Company’s Corporate/Other segment are assumed by the contract holders and not by the Company (subject to, among other things, certain minimum guarantees). Assets supporting experience-rated products may be subject to contract holder or participant withdrawals.
The debt securities in the Company’s investment portfolio had an average credit quality rating of A at both December 31, 2019 and 2018 with approximately $4.4 billion and $3.9 billion rated AAA at December 31, 2019 and 2018, respectively. The debt securities that were rated below investment grade (that is, having a credit quality rating below BBB-/Baa3) were $1.2 billion and $1.1 billion at December 31, 2019 and 2018, respectively (of which 4% and 6% at December 31, 2019 and 2018, respectively, supported experience-rated products).
At December 31, 2019 and 2018, the Company held $333 million and $373 million, respectively, of municipal debt securities that were guaranteed by third parties, representing 2% of total investments at both December 31, 2019 and 2018. These securities had an average credit quality rating of AA and AA- at December 31, 2019 and 2018, respectively, with the guarantee. These securities had an average credit quality rating of A+ and A- at December 31, 2019 and 2018, respectively, without the guarantee. The Company does not have any significant concentration of investments with third party guarantors (either direct or indirect).
The Company generally classifies debt securities as available for sale, and carries them at fair value on the consolidated balance sheets. At both December 31, 2019 and 2018, less than 1% of debt securities were valued using inputs that reflect the Company’s assumptions (categorized as Level 3 inputs in accordance with accounting principles generally accepted in the United States of America). See Note 4 ‘‘Fair Value’’ included in Item 8 of this 10-K, for additional information on the methodologies and key assumptions used to determine the fair value of investments. For additional information related to investments, see Note 3 ‘‘Investments’’ included in Item 8 of this 10-K.
The Company regularly reviews debt securities in its portfolio to determine whether a decline in fair value below the cost basis or carrying value is other-than-temporary. When a debt security is in an unrealized capital loss position, the Company monitors the duration and severity of the loss to determine if sufficient market recovery can occur within a reasonable period of time. If a decline in fair value is considered other-than-temporary, the cost basis or carrying value of the debt security is written down. The write down is then bifurcated into its credit and non-credit related components. The amount of the credit-related component
is included in net income, and the amount of the non-credit related component is included in other comprehensive income (loss), unless the Company intends to sell the debt security or it is more likely than not that the Company will be required to sell the debt security prior to its anticipated recovery of the debt security’s amortized cost basis. Accounting for other-than-temporary impairment (“OTTI”) of debt securities is considered a critical accounting policy. See “Critical Accounting Policies - Other-Than-Temporary Impairment of Debt Securities” in the MD&A included in Item 7 of this 10-K for additional information.
Evaluation of Market Valuation Risks
The Company regularly evaluates its risk from market-sensitive instruments by examining, among other things, levels of or changes in interest rates (short-term or long-term), duration, prepayment rates, equity markets and/or credit ratings/spreads. The Company also regularly evaluates the appropriateness of investments relative to management-approved investment guidelines (and operates within those guidelines) and the business objectives of its portfolios.
On a quarterly basis, the Company reviews the impact of hypothetical net losses in its investment portfolio on the Company’s consolidated near-term financial condition, operating results and cash flows assuming the occurrence of certain reasonably possible changes in near-term market rates and prices. Interest rate changes (whether resulting from changes in treasury yields or credit spreads or other factors) represent the most material risk exposure category for the Company. The Company has estimated the impact on the fair value of market sensitive instruments based on the net present value of cash flows using a representative set of likely future interest rate scenarios. The assumptions used were as follows: an immediate increase of 100 basis points in interest rates (which the Company believes represents a moderately adverse scenario and is approximately equal to the historical annual volatility of interest rate movements for intermediate-term available-for-sale debt securities) and an immediate decrease of 15% in prices for domestic equity securities.
Assuming an immediate increase of 100 basis points in interest rates and an immediate decrease of 15% in the prices for domestic equity securities, the theoretical decline in the fair values of market sensitive instruments at December 31, 2019 is as follows:
| • | The fair value of long-term debt would decline by approximately $4.5 billion ($5.7 billion pretax). Changes in the fair value of long-term debt do not impact the Company’s operating results or financial condition. |
| • | The theoretical reduction in the fair value of investment securities partially offset by the theoretical reduction in the fair value of interest rate sensitive liabilities would result in a net decline in fair value of approximately $420 million ($530 million pretax) related to continuing non-experience-rated products. Reductions in the fair value of investment securities would be reflected as an unrealized loss in equity, as the Company classifies these securities as available for sale. The Company does not record liabilities at fair value. |
Based on overall exposure to interest rate risk and equity price risk, the Company believes that these changes in market rates and prices would not materially affect consolidated near-term financial condition, operating results or cash flows as of December 31, 2019.
Evaluation of Foreign Currency and Commodity Risk
As of each of December 31, 2019 and 2018, the Company did not have any material foreign currency exchange rate or commodity derivative instruments in place and believes its exposure to foreign currency exchange rate risk and commodity price risk is not material.
Evaluation of Operational Risks
The Company also faces certain operational risks, including risks related to information security, including cybersecurity. The Company and its vendors have experienced and continue to experience a variety of cyber attacks, and the Company and its vendors expect to continue to experience cyber attacks going forward. Among other things, the Company and its vendors have experienced automated attempts to gain access to public facing networks, brute force, SYN flood and distributed denial of service attacks, attempted malware infections, vulnerability scanning, ransomware attacks, spear-phishing campaigns, mass reconnaissance attempts, injection attempts, phishing, PHP injection and cross-site scripting. The Company also has seen an increase in attacks designed to obtain access to consumers’ accounts using illegally obtained demographic information. The Company is dedicating and will continue to dedicate significant resources and incur significant expenses to maintain and update on an ongoing basis the systems and processes that are designed to mitigate the information security risks it faces and protect the security of its computer systems, software, networks and other technology assets against attempts by unauthorized parties to obtain access to confidential information, destroy data, disrupt or degrade service, sabotage systems or cause other damage. The impact of cyber attacks has not been material to the Company’s operations or operating results through December 31, 2019. The Board and its Audit Committee (the “Audit Committee”) and Nominating and Corporate Governance Committee are regularly informed regarding the Company’s information security policies, practices and status.
Item 8. Financial Statements and Supplementary Data.
Index to Consolidated Financial Statements
Index to Consolidated Financial Statements
Consolidated Statements of Operations
| For the Years Ended December 31, | |||||||||||
| In millions, except per share amounts | 2019 | 2018 | 2017 | ||||||||
| Revenues: | |||||||||||
| Products | $ | 185,236 | $ | 183,910 | $ | 180,063 | |||||
| Premiums | 63,122 | 8,184 | 3,558 | ||||||||
| Services | 7,407 | 1,825 | 1,144 | ||||||||
| Net investment income | 1,011 | 660 | 21 | ||||||||
| Total revenues | 256,776 | 194,579 | 184,786 | ||||||||
| Operating costs: | |||||||||||
| Cost of products sold | 158,719 | 156,447 | 153,448 | ||||||||
| Benefit costs | 52,529 | 6,594 | 2,810 | ||||||||
| Goodwill impairments | — | 6,149 | 181 | ||||||||
| Operating expenses | 33,541 | 21,368 | 18,809 | ||||||||
| Total operating costs | 244,789 | 190,558 | 175,248 | ||||||||
| Operating income | 11,987 | 4,021 | 9,538 | ||||||||
| Interest expense | 3,035 | 2,619 | 1,062 | ||||||||
| Loss on early extinguishment of debt | 79 | — | — | ||||||||
| Other expense (income) | (124 | ) | (4 | ) | 208 | ||||||
| Income before income tax provision | 8,997 | 1,406 | 8,268 | ||||||||
| Income tax provision | 2,366 | 2,002 | 1,637 | ||||||||
| Income (loss) from continuing operations | 6,631 | (596 | ) | 6,631 | |||||||
| Loss from discontinued operations, net of tax | — | — | (8 | ) | |||||||
| Net income (loss) | 6,631 | (596 | ) | 6,623 | |||||||
| Net (income) loss attributable to noncontrolling interests | 3 | 2 | (1 | ) | |||||||
| Net income (loss) attributable to CVS Health | $ | 6,634 | $ | (594 | ) | $ | 6,622 | ||||
| Basic earnings (loss) per share: | |||||||||||
| Income (loss) from continuing operations attributable to CVS Health | $ | 5.10 | $ | (0.57 | ) | $ | 6.48 | ||||
| Loss from discontinued operations attributable to CVS Health | $ | — | $ | — | $ | (0.01 | ) | ||||
| Net income (loss) attributable to CVS Health | $ | 5.10 | $ | (0.57 | ) | $ | 6.47 | ||||
| Weighted average basic shares outstanding | 1,301 | 1,044 | 1,020 | ||||||||
| Diluted earnings (loss) per share: | |||||||||||
| Income (loss) from continuing operations attributable to CVS Health | $ | 5.08 | $ | (0.57 | ) | $ | 6.45 | ||||
| Loss from discontinued operations attributable to CVS Health | $ | — | $ | — | $ | (0.01 | ) | ||||
| Net income (loss) attributable to CVS Health | $ | 5.08 | $ | (0.57 | ) | $ | 6.44 | ||||
| Weighted average diluted shares outstanding | 1,305 | 1,044 | 1,024 | ||||||||
| Dividends declared per share | $ | 2.00 | $ | 2.00 | $ | 2.00 |
See accompanying notes to consolidated financial statements.
Index to Consolidated Financial Statements
Consolidated Statements of Comprehensive Income (Loss)
| For the Years Ended December 31, | |||||||||||
| In millions | 2019 | 2018 | 2017 | ||||||||
| Net income (loss) | $ | 6,631 | $ | (596 | ) | $ | 6,623 | ||||
| Other comprehensive income (loss), net of tax: | |||||||||||
| Net unrealized investment gains | 677 | 97 | — | ||||||||
| Foreign currency translation adjustments | 162 | (29 | ) | (2 | ) | ||||||
| Net cash flow hedges | (33 | ) | 330 | (10 | ) | ||||||
| Pension and other postretirement benefits | 111 | (124 | ) | 152 | |||||||
| Other comprehensive income | 917 | 274 | 140 | ||||||||
| Comprehensive income (loss) | 7,548 | (322 | ) | 6,763 | |||||||
| Comprehensive (income) loss attributable to noncontrolling interests | 3 | 2 | (1 | ) | |||||||
| Comprehensive income (loss) attributable to CVS Health | $ | 7,551 | $ | (320 | ) | $ | 6,762 |
See accompanying notes to consolidated financial statements.
Index to Consolidated Financial Statements
Consolidated Balance Sheets
| At December 31, | |||||||
| In millions, except per share amounts | 2019 | 2018 | |||||
| Assets: | |||||||
| Cash and cash equivalents | $ | 5,683 | $ | 4,059 | |||
| Investments | 2,373 | 2,522 | |||||
| Accounts receivable, net | 19,617 | 17,631 | |||||
| Inventories | 17,516 | 16,450 | |||||
| Other current assets | 5,113 | 4,581 | |||||
| Total current assets | 50,302 | 45,243 | |||||
| Long-term investments | 17,314 | 15,732 | |||||
| Property and equipment, net | 12,044 | 11,349 | |||||
| Operating lease right-of-use assets | 20,860 | — | |||||
| Goodwill | 79,749 | 78,678 | |||||
| Intangible assets, net | 33,121 | 36,524 | |||||
| Separate accounts assets | 4,459 | 3,884 | |||||
| Other assets | 4,600 | 5,046 | |||||
| Total assets | $ | 222,449 | $ | 196,456 | |||
| Liabilities: | |||||||
| Accounts payable | $ | 10,492 | $ | 8,925 | |||
| Pharmacy claims and discounts payable | 13,601 | 11,365 | |||||
| Health care costs payable | 6,879 | 6,147 | |||||
| Policyholders’ funds | 2,991 | 2,939 | |||||
| Accrued expenses | 12,133 | 10,711 | |||||
| Other insurance liabilities | 1,830 | 1,937 | |||||
| Current portion of operating lease liabilities | 1,596 | — | |||||
| Short-term debt | — | 720 | |||||
| Current portion of long-term debt | 3,781 | 1,265 | |||||
| Total current liabilities | 53,303 | 44,009 | |||||
| Long-term operating leas |
Showing the first 8K of 332K characters. Open the full section
Item 9. Changes in and Disagreements With Accountants on Accounting and Financial Disclosure.
None.
Item 9A. Controls and Procedures.
Evaluation of disclosure controls and procedures
The Company’s Chief Executive Officer and Chief Financial Officer, after evaluating the effectiveness of the design and operation of the Company’s disclosure controls and procedures (as defined in Rules 13a-15 (f) and 15d-15(f) under the Securities Exchange Act of 1934) as of December 31, 2019, have concluded that as of such date the Company’s disclosure controls and procedures were adequate and effective at a reasonable assurance level and designed to ensure that material information relating to the Company and its consolidated subsidiaries would be made known to such officers on a timely basis.
Management’s report on internal control over financial reporting
Management is responsible for establishing and maintaining adequate internal control over financial reporting. The Company’s internal control over financial reporting includes those policies and procedures that (1) pertain to the maintenance of records that, in reasonable detail, accurately and fairly reflect the transactions and dispositions of the assets of the Company; (2) provide reasonable assurance that transactions are recorded as necessary to permit preparation of the Company’s consolidated financial statements in accordance with generally accepted accounting principles, and that receipts and expenditures of the Company are being made only in accordance with authorizations of management and directors of the Company; and (3) provide reasonable assurance regarding prevention or timely detection of unauthorized acquisition, use, or disposition of the Company’s assets that could have a material effect on the Company’s consolidated financial statements. In order to ensure the Company’s internal control over financial reporting is effective, management regularly assesses such control and did so most recently for its financial reporting as of December 31, 2019.
Management conducted an assessment of the effectiveness of the Company’s internal control over financial reporting based on the criteria established in Internal Control-Integrated Framework issued by the Committee of Sponsoring Organizations of the Treadway Commission (2013 Framework). This evaluation included review of the documentation, evaluation of the design effectiveness and testing of the operating effectiveness of controls. The Company’s system of internal control over financial reporting is enhanced by periodic reviews by the Company’s internal auditors, written policies and procedures and a written Code of Conduct adopted by CVS Health’s Board of Directors, applicable to all employees of the Company. In addition, the Company has an internal Disclosure Committee, comprised of management from each functional area within the Company, which performs a separate review of disclosure controls and procedures. There are inherent limitations in the effectiveness of any system of internal control over financial reporting.
Based on management’s assessment, management concluded that the Company’s internal control over financial reporting is effective and provides reasonable assurance that assets are safeguarded and that the financial records are reliable for preparing financial statements as of December 31, 2019.
Ernst & Young LLP, the Company’s independent registered public accounting firm, is appointed by CVS Health’s Board of Directors and ratified by CVS Health’s stockholders. They were engaged to render an opinion regarding the fair presentation of the Company’s consolidated financial statements as well as conducting an audit of internal control over financial reporting. Their reports included in Item 8 of this Form 10-K are based upon audits conducted in accordance with the standards of the Public Company Accounting Oversight Board (United States).
Changes in internal control over financial reporting
On November 28, 2018, the Company completed its acquisition of Aetna. During the fourth quarter ended December 31, 2019, the Company completed the process of integrating the internal control over financial reporting of Aetna with the rest of the Company.
Other than the foregoing, there has been no change in the Company’s internal control over financial reporting identified in connection with the evaluation required by paragraph (d) of Rule 13a-15 or Rule 15d-15 that occurred during the fourth quarter ended December 31, 2019 that has materially affected, or is reasonably likely to materially affect, the Company’s internal control over financial reporting.
Item 9B. Other Information.
No events have occurred during the fourth quarter ended December 31, 2019 that would require disclosure under this item.
PART III
Item 10. Directors, Executive Officers and Corporate Governance.
Information concerning the Executive Officers of CVS Health Corporation is included in Part I of this 10-K pursuant to General Instruction G to Form 10-K.
The sections of the Proxy Statement under the captions “Committees of the Board as of the Annual Meeting,” “Code of Conduct,” “Audit Committee Report,” and “Biographies of our Incumbent Board Nominees” are incorporated herein by reference.
Item 11. Executive Compensation.
The sections of the Proxy Statement under the captions “Non-Employee Director Compensation” and “Executive Compensation and Related Matters,” including “Letter from the Management Planning and Development Committee,” “Compensation Committee Report,” “Compensation Discussion and Analysis” and “Compensation of Named Executive Officers” are incorporated herein by reference.
Item 12. Security Ownership of Certain Beneficial Owners and Management and Related Stockholder Matters.
The sections of the Proxy Statement under the captions “Share Ownership of Directors and Certain Executive Officers” and “Share Ownership of Principal Stockholders” are incorporated herein by reference. Those sections contain information concerning security ownership of certain beneficial owners and management and related stockholder matters.
The following table summarizes information about the registrants common stock that may be issued upon the exercise of options, warrants and rights under all of the Company’s equity compensation plans as of December 31, 2019:
| Number of securities to be issued upon exercise of outstanding options, warrants and rights (1) (2) (a) | Weighted average exercise price of outstanding options, warrants and rights (b) | Number of securities remaining available for future issuance under equity compensation plans (excluding securities reflected in first column) (1) (c) | |||||||
| Equity compensation plans approved by stockholders (3) | 32,237 | $ | 73.32 | 17,152 | |||||
| Equity compensation plans not approved by stockholders (4) (5) | 4,518 | 43.46 | 26,849 | ||||||
| Total | 36,755 | $ | 71.83 | 44,001 |
| (1) | Shares in thousands. |
| (2) | Consists of: (i) 21,184 shares of common stock underlying outstanding options, (ii) 1,110 shares of common stock issuable upon the exercise of outstanding stock appreciation rights (“SARs”) and (iii) 14,461 shares of common stock issuable on the vesting of outstanding restricted stock units, deferred stock units and performance stock units, assuming target level performance in the case of performance stock units. The number of shares included with respect to outstanding SARs is the number of shares of CVS Health common stock that would have been issued had the SARs been exercised based on the closing price per share of CVS Health common stock on December 31, 2019, as reported on the NYSE, which was $74.29. |
| (3) | Consists of the CVS Health 2017 Incentive Compensation Plan. |
| (4) | Consists of the Amended Aetna Inc. 2010 Stock Incentive Plan (the “Aetna Stock Plan”). |
| (5) | Amount in column (c) consists of the maximum number of shares of CVS Health common stock available for future issuance under the Aetna Stock Plan as of December 31, 2019. |
The Aetna Stock Plan was last approved by Aetna’s shareholders at Aetna’s 2017 Annual Meeting on May 19, 2017. The Company elected to continue to grant awards under the Aetna Stock Plan to employees of Aetna and its subsidiaries following the completion of the Aetna Acquisition. The Aetna Stock Plan is designed to promote the Company’s interests and those of its stockholders and to further align the interests of stockholders and employees by tying awards to total return to stockholders, enabling plan participants to acquire additional equity interests in the Company and providing compensation opportunities
dependent upon the Company’s performance. The Aetna Stock Plan has not been submitted to the Company’s stockholders and will expire on May 21, 2020.
Under the Aetna Stock Plan, eligible participants can be granted stock options to purchase shares of CVS Health common stock, SARs, time-vesting and/or performance-vesting incentive stock or incentive units and other stock based awards. As of December 31, 2019, the maximum number of shares of CVS Health common stock that may be issued under the awards outstanding under the Aetna Stock Plan was 4.5 million shares, subject to adjustment for corporate transactions and 26.8 million shares remained available for future awards. If an award under the Aetna Stock Plan is paid solely in cash, no shares are deducted from the number of shares available for issuance under the Aetna Stock Plan.
Item 13. Certain Relationships and Related Transactions, and Director Independence.
The sections of the Proxy Statement under the captions “Independence Determinations for Directors” and “Related Person Transaction Policy” are incorporated herein by reference.
Item 14. Principal Accountant Fees and Services.
The section of the Proxy Statement under the caption “Item 2: Ratification of Appointment of Independent Registered Public Accounting Firm for 2020” is incorporated herein by reference.
PART IV
Item 15. Exhibits, Financial Statement Schedules.
The following documents are filed as part of this 10-K:
| 1. | Financial Statements. See “Index to Consolidated Financial Statements” in Item 8 of this 10-K. |
| 2. | Financial Statement Schedules. All financial statement schedules are omitted because they are not applicable, not required under the instructions, or the information is included in the consolidated financial statements or related notes. |
| 3. | Exhibits. The exhibits listed in the “Index to Exhibits” in this Item 15 are filed or incorporated by reference as part of this 10-K. Exhibits marked with an asterisk (*) are management contracts or compensatory plans or arrangements. Exhibits other than those listed are omitted because they are not required to be listed or are not applicable. Pursuant to Item 601(b)(4)(iii) of Regulation S-K, the Registrant hereby agrees to furnish to the Securities and Exchange Commission a copy of any omitted instrument that is not required to be listed. |
INDEX TO EXHIBITS
| 31.2 | Certification by the Chief Financial Officer. | |
| 32 | Section 1350 Certifications | |
| 32.1 | Certification by the Chief Executive Officer. | |
| 32.2 | Certification by the Chief Financial Officer. | |
| 101 | Interactive Data File | |
| 101 | The following materials from the CVS Health Corporation Annual Report on Form 10-K for the fiscal year ended December 31, 2019 formatted in Inline XBRL: (i) the Consolidated Statements of Operations, (ii) the Consolidated Statements of Comprehensive Income (Loss), (iii) the Consolidated Balance Sheets, (iv) the Consolidated Statements of Cash Flows, (v) the Consolidated Statements of Shareholders’ Equity and (vi) the related Notes to Consolidated Financial Statements. The instance document does not appear in the Interactive Data File because its XBRL tags are embedded within the Inline XBRL document. | |
| 104 | ||
| 104 | Cover Page Interactive Data File - The cover page from the Company's Annual Report on Form 10-K for the year ended December 31, 2019, formatted in Inline XBRL (included as Exhibit 101). |
Item 16. Form 10-K Summary.
None.
SIGNATURES
Pursuant to the requirements of Section 13 or 15(d) of the Securities Exchange Act of 1934, the registrant has duly caused this report to be signed on its behalf by the undersigned, thereunto duly authorized.
| CVS HEALTH CORPORATION | |||
| Date: | February 18, 2020 | By: | /s/ EVA C. BORATTO |
| Eva C. Boratto | |||
| Executive Vice President and Chief Financial Officer |
Pursuant to the requirements of the Securities Exchange Act of 1934, this report has been signed below by the following persons on behalf of the registrant and in the capacities and on the dates indicated.
| Signature | Title(s) | Date | ||
| /s/ FERNANDO AGUIRRE | Director | February 18, 2020 | ||
| Fernando Aguirre | ||||
| /s/ RICHARD M. BRACKEN | Director | February 18, 2020 | ||
| Richard M. Bracken | ||||
| /s/ C. DAVID BROWN II | Director | February 18, 2020 | ||
| C. David Brown II | ||||
| /s/ EVA C. BORATTO | Executive Vice President and Chief Financial | February 18, 2020 | ||
| Eva C. Boratto | Officer (Principal Financial Officer) | |||
| /s/ JAMES D. CLARK | Senior Vice President - Controller and Chief | February 18, 2020 | ||
| James D. Clark | Accounting Officer (Principal Accounting Officer) | |||
| /s/ ALECIA A. DECOUDREAUX | Director | February 18, 2020 | ||
| Alecia A. DeCoudreaux | ||||
| /s/ NANCY-ANN M. DEPARLE | Director | February 18, 2020 | ||
| Nancy-Ann M. DeParle | ||||
| /s/ DAVID W. DORMAN | Chair of the Board and Director | February 18, 2020 | ||
| David W. Dorman | ||||
| /s/ ROGER N. FARAH | Director | February 18, 2020 | ||
| Roger N. Farah | ||||
| /s/ ANNE M. FINUCANE | Director | February 18, 2020 | ||
| Anne M. Finucane | ||||
| /s/ EDWARD J. LUDWIG | Director | February 18, 2020 | ||
| Edward J. Ludwig | ||||
| /s/ LARRY J. MERLO | President and Chief Executive Officer | February 18, 2020 | ||
| Larry J. Merlo | (Principal Executive Officer) and Director | |||
| /s/ JEAN-PIERRE MILLON | Director | February 18, 2020 | ||
| Jean-Pierre Millon | ||||
| /s/ MARY L. SCHAPIRO | Director | February 18, 2020 | ||
| Mary L. Schapiro | ||||
| /s/ RICHARD J. SWIFT | Director | February 18, 2020 | ||
| Richard J. Swift | ||||
| /s/ WILLIAM C. WELDON | Director | February 18, 2020 | ||
| William C. Weldon | ||||
| /s/ TONY L. WHITE | Director | February 18, 2020 | ||
| Tony L. White |