 filings.tools
Item 5. Market for Registrant’s Common Equity, Related Stockholder Matters and Issuer Purchases of Equity Securities.
4K characters. Original on sec.gov · Markdown
Item 5. Market for Registrant’s Common Equity, Related Stockholder Matters and Issuer Purchases of Equity Securities.
Market Information
CVS Health’s common stock is listed on the New York Stock Exchange under the symbol “CVS.”
Dividends
CVS Health has paid cash dividends every quarter since becoming a public company. Future dividends will depend on the Company’s earnings, capital requirements, financial condition and other factors considered relevant by the Board.
See Note 12 ‘‘Shareholders’ Equity’’ included in Item 8 of this 10-K for information regarding CVS Health’s dividends.
Holders of Common Stock
As of February 8, 2021, there were 26,078 registered holders of the registrant’s common stock according to the records maintained by the registrant’s transfer agent.
Issuer Purchases of Equity Securities
The following share repurchase program has been authorized by the Board:
| In billions | Remaining as of | ||||||||||
| Authorization Date | Authorized | December 31, 2020 | |||||||||
| November 2, 2016 (“2016 Repurchase Program”) | $ | 15.0 | $ | 13.9 | |||||||
The 2016 Repurchase Program permits the Company to effect repurchases from time to time through a combination of open market repurchases, privately negotiated transactions, accelerated share repurchase transactions, and/or other derivative transactions. The 2016 Repurchase Program can be modified or terminated by the Board at any time. During the three months ended December 31, 2020, the Company did not repurchase any shares of common stock.
See Note 12 ‘‘Shareholders’ Equity’’ included in Item 8 of this 10-K for additional information regarding the Company’s share repurchases.
Stock Performance Graph
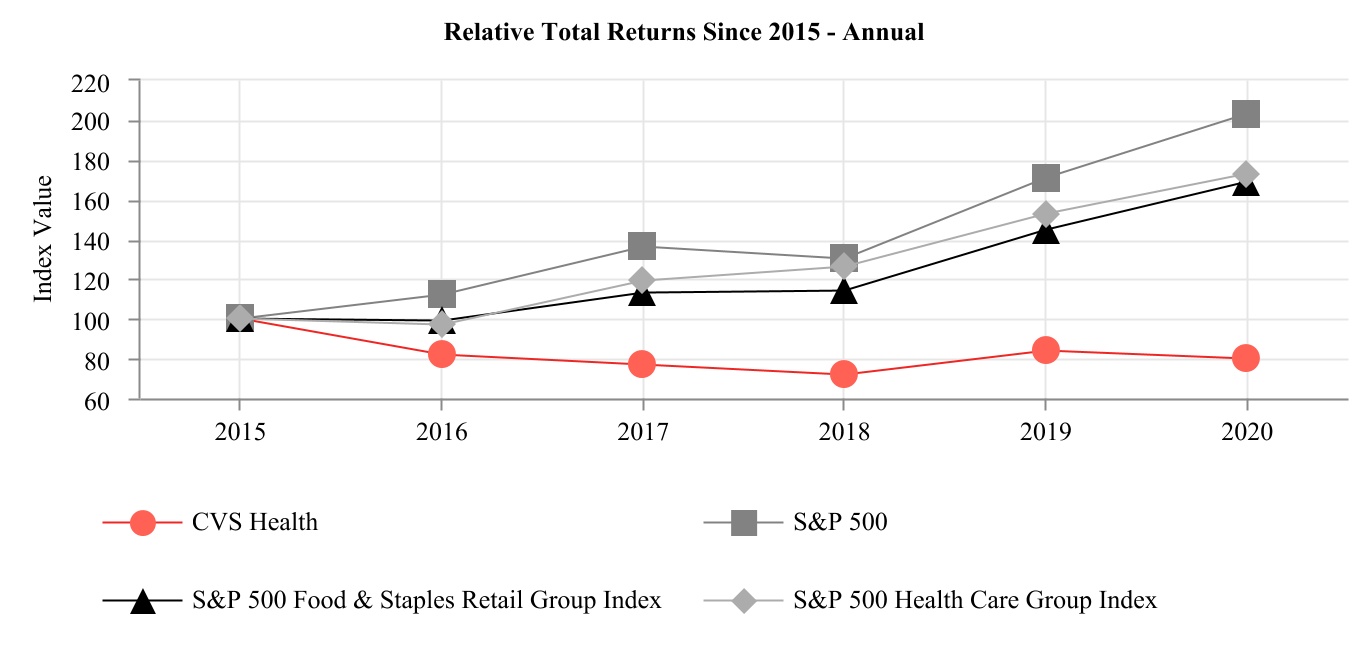
The following graph compares the cumulative total shareholder return on CVS Health’s common stock (assuming reinvestment of dividends) with the cumulative total return on the S&P 500 Index, the S&P 500 Food and Staples Retailing Industry Group Index and the S&P 500 Healthcare Sector Group Index from December 31, 2015 through December 31, 2020. The graph assumes a $100 investment in shares of CVS Health’s common stock on December 31, 2015.
| December 31, | |||||||||||||||||||||||||||||||||||
| 2015 | 2016 | 2017 | 2018 | 2019 | 2020 | ||||||||||||||||||||||||||||||
| CVS Health Corporation | $ | 100 | $ | 82 | $ | 77 | $ | 72 | $ | 84 | $ | 80 | |||||||||||||||||||||||
| S&P 500 (1) | 100 | 112 | 136 | 130 | 171 | 203 | |||||||||||||||||||||||||||||
| S&P 500 Food & Staples Retail Group Index (2) | 100 | 99 | 113 | 114 | 145 | 169 | |||||||||||||||||||||||||||||
| S&P 500 Health Care Group Index (1) (3) | 100 | 97 | 119 | 126 | 153 | 173 |
(1)Includes CVS Health.
(2)Includes five companies (COST, KR, SYY, WBA, WMT).
(3)Includes 63 companies.
The year-ended values of each investment shown in the preceding graph are based on share price appreciation plus dividends, with the dividends reinvested as of the last business day of the month during which such dividends were ex-dividend. The calculations exclude trading commissions and taxes. Total shareholder returns from each investment can be calculated from the year-end investment values shown beneath the graph.
Previous: Item 4. Mine Safety Disclosures. · Next: Item 6. Reserved