 filings.tools
Item 14. Principal Accountant Fees and Services
512K characters. Original on sec.gov · Markdown
Item 14. Principal Accountant Fees and Services
The information required by Item 9(e) of Schedule 14A and contained under the heading “Board Proposal to Ratify PricewaterhouseCoopers LLP as the Independent Registered Public Accounting Firm for 2025” in the 2025 Proxy Statement is incorporated by reference into this Annual Report on Form 10-K.
| Financial Table of Contents | Table of Contents |
| Management’s Discussion and Analysis of Financial Condition and Results of Operations | Financial Table of Contents |
Key Financial Results
| Millions of dollars, except per-share amounts | 2024 | 2023 | 2022 | ||||||||||||||
| Net Income (Loss) Attributable to Chevron Corporation | $ | 17,661 | $ | 21,369 | $ | 35,465 | |||||||||||
| Per Share Amounts: | |||||||||||||||||
| Net Income (Loss) Attributable to Chevron Corporation | |||||||||||||||||
| – Basic | $ | 9.76 | $ | 11.41 | $ | 18.36 | |||||||||||
| – Diluted | $ | 9.72 | $ | 11.36 | $ | 18.28 | |||||||||||
| Dividends | $ | 6.52 | $ | 6.04 | $ | 5.68 | |||||||||||
| Sales and Other Operating Revenues | $ | 193,414 | $ | 196,913 | $ | 235,717 | |||||||||||
| Return on: | |||||||||||||||||
| Capital Employed | 10.1 | % | 11.9 | % | 20.3 | % | |||||||||||
| Stockholders’ Equity | 11.3 | % | 13.3 | % | 23.8 | % | |||||||||||
| Earnings by Major Operating Area | |||||||||||||||||
| Millions of dollars | 2024 | 2023 | 2022 | ||||||||||||||
| Upstream | |||||||||||||||||
| United States | $ | 7,602 | $ | 4,148 | $ | 12,621 | |||||||||||
| International | 11,000 | 13,290 | 17,663 | ||||||||||||||
| Total Upstream | 18,602 | 17,438 | 30,284 | ||||||||||||||
| Downstream | |||||||||||||||||
| United States | 531 | 3,904 | 5,394 | ||||||||||||||
| International | 1,196 | 2,233 | 2,761 | ||||||||||||||
| Total Downstream | 1,727 | 6,137 | 8,155 | ||||||||||||||
| All Other | (2,668) | (2,206) | (2,974) | ||||||||||||||
| Net Income (Loss) Attributable to Chevron Corporation****1,2 | $ | 17,661 | $ | 21,369 | $ | 35,465 | |||||||||||
| 1 Includes foreign currency effects: | $ | 520 | $ | (224) | $ | 669 | |||||||||||
| 2 Income net of tax, also referred to as “earnings” in the discussions that follow. |
Refer to the Results of Operations section for a discussion of financial results by major operating area for the three years ended December 31, 2024. Throughout the document, certain totals and percentages may not sum to their component parts due to rounding.
Business Environment and Outlook
Chevron Corporation is a global energy company with direct and indirect subsidiaries and affiliates that conduct substantial business activities in the following countries: Angola, Argentina, Australia, Bangladesh, Brazil, Canada, China, Egypt, Equatorial Guinea, Israel, Kazakhstan, Mexico, Nigeria, the Partitioned Zone between Saudi Arabia and Kuwait, the Philippines, Singapore, South Korea, Thailand, the United Kingdom, the United States and Venezuela.
The company’s objective is to safely deliver higher returns, lower carbon and superior shareholder value in any business environment. Earnings of the company depend mostly on the profitability of its upstream business segment. The most significant factor affecting the results of operations for the upstream segment is the price of crude oil, which is determined in global markets outside of the company’s control. In the company’s downstream business, crude oil is the largest cost component of refined products. Periods of sustained lower commodity prices could result in the impairment or write-off of specific assets in future periods and cause the company to adjust operating expenses, including employee reductions, and capital expenditures, along with other measures intended to improve financial performance.
Some governments, companies, communities and other stakeholders are supporting efforts to address climate change. International initiatives and national, regional and state legislation and regulations that aim to directly or indirectly reduce GHG emissions are in various stages of design, adoption and implementation. These policies and programs, some of which support the global net zero emissions ambitions of the Paris Agreement, can change the amount of energy consumed, the rate of energy-demand growth, the energy mix and the relative economics of one fuel versus another. Implementation of jurisdiction-specific policies and programs can be dependent on, and can affect the pace of, technological advancements; the granting of necessary permits by governing authorities; the availability and acceptability of cost-effective, verifiable carbon credits; the availability of suppliers that can meet our sustainability-related standards; evolving regulatory or other requirements affecting ESG standards or disclosures and evolving standards and regulations for tracking, reporting, marketing and advertising relating to emissions and emission reductions and removals.
Some of these policies and programs include renewable and low carbon fuel standards, such as the Renewable Fuel Standard program in the U.S. and California’s Low Carbon Fuel Standard; programs that price GHG emissions, including
| Management’s Discussion and Analysis of Financial Condition and Results of Operations | Financial Table of Contents |
California’s Cap-and-Trade Program; performance standards, including methane-specific regulations such as the United States Environmental Protection Agency (U.S. EPA) Standards of Performance for New, Reconstructed, and Modified Sources and Emissions Guidelines for Existing Sources; and measures that provide various incentives for lower carbon activities, including carbon capture and storage and the production of hydrogen and sustainable aviation fuel, such as the U.S. Inflation Reduction Act. Requirements for these and other similar policies and programs are complex, ever changing, program specific and encompass: (1) the blending of renewable fuels into transportation fuels; (2) the purchasing, selling, utilizing and retiring of allowances and carbon credits; and (3) other emissions reduction measures including efficiency improvements and capturing GHG emissions. These compliance policies and programs have had and may continue to have negative impacts on the company now and in the future including, but not limited to, the displacement of hydrocarbon and other products and/or the impairment of assets. These policies have also enabled opportunities for Chevron in its lower carbon business lines. For example, Renewable Energy Group, Inc. (REG) produces most of Chevron’s renewable fuels offering and generates a substantial amount of the company’s carbon credit generation activities. Although we expect the company’s costs to comply with these policies and programs to continue to increase, these costs currently do not have a material impact on the company’s financial condition or results of operations.
Significant uncertainty remains as to the pace and extent to which the transition to a lower carbon future will progress, which is dependent, in part, on further advancements and changes in policy, technology, and customer and consumer preferences. The level of expenditure required to comply with new or potential climate change-related laws and regulations and the amount of additional investments needed in new or existing technology or facilities, such as carbon capture and storage, is difficult to predict with certainty and is expected to vary depending on the actual laws and regulations enacted, available technology options, customer and consumer preferences, the company’s activities and market conditions. As discussed below, in 2021, the company announced planned capital spend of approximately $10 billion through 2028 in lower carbon investments. Although the future is uncertain, many published outlooks conclude that fossil fuels will remain a significant part of an energy system that increasingly incorporates lower carbon sources of supply for many years to come.
Chevron supports the Paris Agreement’s global approach to governments addressing climate change and continues to take actions to help lower the carbon intensity of its operations while continuing to meet the demand for energy. Chevron believes that broad, market-based mechanisms are the most efficient approach to addressing GHG emission reductions. Chevron integrates climate change-related issues and the regulatory and other responses to these issues into its strategy and planning, capital investment reviews and risk management tools and processes, where it believes they are applicable. They are also factored into the company’s long-range supply, demand and energy price forecasts. These forecasts reflect estimates of long-range effects from climate change-related policy actions, such as electric vehicle and renewable fuel penetration, energy efficiency standards and demand response to oil and natural gas prices.
The company will continue to develop oil and gas resources to meet customers’ and consumers’ demand for energy. At the same time, Chevron believes that the future of energy is lower carbon. The company will continue to maintain flexibility in its portfolio to be responsive to changes in policy, technology, and customer and consumer preferences. Chevron aims to grow its oil and gas business, lower the carbon intensity of its operations and grow new businesses in renewable fuels, carbon capture and offsets, hydrogen, power generation for data centers, and emerging technologies. To grow its new businesses, Chevron plans to target sectors of the economy where emissions are harder to abate or that cannot be easily electrified, while leveraging the company’s capabilities, assets, partnerships and customer relationships. The company’s oil and gas business may increase or decrease depending upon market, economic, legislative and regulatory forces, among other factors.
In 2021, Chevron announced aspirations and targets that align with its strategy, as noted below. Chevron uses emissions intensity targets, which enable the company to assess, quantify and transparently communicate its own carbon performance in a standardized way. Chevron regularly evaluates its aspirations, targets and goals and expects to change or eliminate some of its aspirations, targets and goals for various reasons, including market conditions; its strategy or portfolio; and financial, operational, policy, reputational, legal and other factors.
The company’s ability to achieve any aspiration, target or goal is subject to numerous risks and contingencies, many of which are outside of Chevron’s control. Examples of such risks and contingencies include: (1) sufficient and substantial advances in technology, including the continuing progress of commercially viable technologies and low- or non-carbon-based energy sources; (2) laws, governmental regulation, policies, and other enabling actions, including those regarding subsidies, tax and other incentives as well as the granting of necessary permits by governing authorities; (3) the availability and acceptability of cost-effective, verifiable carbon credits; (4) the availability of suppliers that can meet our
| Management’s Discussion and Analysis of Financial Condition and Results of Operations | Financial Table of Contents |
sustainability-related standards; (5) evolving regulatory requirements, including changes to IPCC’s Global Warming Potentials and the U.S. EPA Greenhouse Gas Reporting Program, affecting ESG standards or disclosures; (6) evolving standards for tracking and reporting on emissions and emission reductions and removals; (7) customers’ and consumers’ preferences and use of the company’s products or substitute products; (8) actions taken by the company’s competitors in response to legislation and regulations; and (9) successful negotiations for carbon capture and storage and nature-based solutions with customers, suppliers, partners and governments. Please refer to “Risk Factors” in Part I, Item 1A, on pages 23 through 27 for further discussion of GHG regulation and climate change and the associated risks to Chevron’s business, including the risks impacting Chevron’s strategy, aspirations, targets and disclosures related to environmental, social, and governance matters.
2050 Net Zero Upstream Aspiration Chevron aspires to achieve net zero for upstream production Scope 1 and 2 GHG emissions on an equity basis by 2050. The company believes accomplishing this aspiration depends on, among other things, sufficient and substantial advances in technology, including the continuing progress of commercially viable technologies and low- or non-carbon-based energy sources; enabling policies and other actions by governing authorities, including those regarding subsidies, tax and other incentives as well as the granting of necessary permits; successful negotiations for carbon capture and storage and nature-based solutions with customers, suppliers, partners and governments; market conditions; and the availability and acceptability of cost-effective, verifiable carbon credits.
2028 Upstream Production GHG Intensity Targets These metrics include Scope 1 (direct emissions) and Scope 2 (indirect emissions associated with imported electricity and steam) and are net of emissions from exported electricity and steam. The 2028 GHG emissions intensity targets on an equity ownership basis include:
-
Oil production GHG intensity of 24 kilograms (kg) carbon dioxide equivalent per barrel of oil-equivalent (CO2e/boe),
-
Gas production GHG intensity of 24 kg CO2e/boe,
-
Methane intensity of 2 kg CO2e/boe, and
-
Flaring GHG intensity of 3 kg CO2e/boe.
The company also targets zero routine flaring by 2030 as outlined in the World Bank’s “Zero Routine Flaring by 2030” initiative.
2028 Portfolio Carbon Intensity Target The company also introduced a portfolio carbon intensity (PCI) metric, which is a measure of the carbon intensity across the full value chain of Chevron’s entire business. This metric encompasses the company’s upstream and downstream business and includes Scope 1 (direct emissions), Scope 2 (indirect emissions from imported electricity and steam), and certain Scope 3 (primarily emissions from use of sold products) emissions. The company’s PCI target is 71 grams (g) carbon dioxide equivalent (CO2e) per megajoule (MJ) by 2028.
Planned Lower-Carbon Capital Spend through 2028 In 2021, the company guided to capital spend of approximately $10 billion through 2028 to advance its lower carbon ambitions, which includes approximately $2 billion to lower the carbon intensity of its oil and gas operations, and approximately $8 billion for lower carbon investments including in renewable fuels, hydrogen and carbon capture and offsets. Beyond 2028, the company anticipates capital spending will be necessary to progress the company’s 2050 upstream production Scope 1 and 2 net zero aspiration and building of its lower carbon business lines.
Since 2021, the company has spent $7.7 billion in lower carbon investments, including $2.9 billion associated with the acquisition of REG in 2022.
Income Taxes The effective tax rate for the company can change substantially during periods of significant earnings volatility. This is due to the mix effects that are impacted by both the absolute level of earnings or losses and whether they arise in higher or lower tax rate jurisdictions. As a result, a decline or increase in the effective income tax rate in one period may not be indicative of expected results in future periods. Additional information related to the company’s effective income tax rate is included in Note 17 Taxes to the Consolidated Financial Statements.
| Management’s Discussion and Analysis of Financial Condition and Results of Operations | Financial Table of Contents |
In December 2021, the Organization for Economic Co-operation and Development (OECD) issued model rules for a new 15 percent global minimum tax (Pillar Two), and various jurisdictions in which the company operates enacted or are in the process of enacting Pillar Two legislation. Certain aspects of the tax under the Pillar Two framework became effective in 2024 in some jurisdictions and will be effective in 2025 (or later) in others. Pillar Two did not have a material impact on the company’s results of operations in 2024. Although we do not currently expect that Pillar Two will have a material impact on our future results of operations, we are continuing to evaluate the impact of pending legislative adoption by individual countries.
Supply Chain and Inflation Impacts The company is actively managing its contracting, procurement and supply chain activities to effectively manage costs and facilitate supply chain resiliency and continuity in support of the company’s operational goals. Third party costs for capital and operating expenses can be subject to external factors beyond the company’s control including, but not limited to: severe weather or civil unrest, delays in construction, global and local supply chain distribution issues, inflation, tariffs or other taxes imposed on goods or services, and market-based prices charged by the industry’s material and service providers. Chevron utilizes contracts with various pricing mechanisms, which may result in a lag before the company’s costs reflect changes in market trends.
Trends in the costs of goods and services vary by spend category. The labor market remains tight, and suppliers are passing along wage rate increases for labor intensive operations. Chevron has applied inflation mitigation strategies in an effort to temper these cost increases, including fixed price and index-based contracts. Lead times for key capital equipment remain long and availability of offshore and specialized equipment is under pressure, with some experiencing upward pricing movements. In the United States, cost pressures for materials and standard onshore drilling and completion equipment continue to ease. Chevron has addressed equipment cost increases and long lead times by partnering with suppliers on demand planning, volume commitments, standardization and scope optimization.
In February 2025, the U.S. announced the imposition of tariffs on imports from several U.S. trade partners and could announce additional tariffs in future periods. There is significant uncertainty as to the duration of these and any further tariffs, and the impacts these tariffs and any corresponding retaliatory tariffs will have on the company and its suppliers. The financial impacts of the tariffs are currently not expected to be material; however, the ultimate impact on the company’s results of operations and financial condition remains uncertain.
Refer to the Cautionary Statement Relevant to Forward-Looking Information on page 2 and to Item 1A. Risk Factors for a discussion of some of the inherent risks that could materially impact the company’s results of operations or financial condition.
Acquisition and Disposition of Assets The company continually evaluates opportunities to dispose of assets that are not expected to provide sufficient long-term value and to acquire assets or operations complementary to its asset base to help augment the company’s financial performance and value growth. The company is targeting $10-15 billion of asset sales over the five-year period ending in 2028. From 2024 through January 2025, the company has generated approximately $8 billion of asset sales proceeds. Asset dispositions and restructurings may result in significant gains or losses in future periods.
In addition, some assets are divested along with their related liabilities, such as decommissioning obligations. In certain instances, such transferred obligations have returned and may continue to return to the company and result in losses that could be significant. For example, in fourth quarter 2023, the company recognized charges for decommissioning obligations from certain previously divested assets in the Gulf of America. In 2024, the company spent $235 million related to these obligations and anticipates spending an additional $200-300 million annually through 2033. To the extent the current owners of the company’s previously divested assets default on their decommissioning obligations, regulators may require that Chevron assume such obligations. The company could have additional significant obligations revert, primarily in the United States. The company is not currently aware of any such obligations that are reasonably possible to be material. Refer to Note 24. Other Contingencies and Commitments for additional information.
In December 2024, the company sold its 20 percent non-operated interest in the Athabasca Oil Sands Project and 70 percent operated interest in the Duvernay shale in Alberta, Canada, to Canadian Natural Resources Limited for $6.5 billion before taxes, and expects to make tax payments totaling $1.5 billion in first quarter 2025. In 2024, these assets produced 86 thousand barrels of oil-equivalent per day and generated over $2.2 billion of sales and approximately $590 million of operational net income. As part of the sale, the buyer assumed decommissioning obligations for the transferred assets.
In October 2023, the company announced that it had entered into a definitive merger agreement with Hess Corporation. Refer to Note 30. Agreement to Acquire Hess Corporation for additional information.
| Management’s Discussion and Analysis of Financial Condition and Results of Operations | Financial Table of Contents |
Other Impacts The company closely monitors developments in the financial and credit markets, the level of worldwide economic activity, and the implications for the company of movements in prices for crude oil, natural gas and natural gas liquids (NGLs). Management takes these developments into account in the conduct of daily operations and for business planning.
In fourth quarter 2024, the company announced plans to achieve $2-3 billion in structural cost reductions by the end of 2026. These cost savings will largely come from optimizing the portfolio, leveraging technology to enhance productivity, and changing how and where work is performed, including expanded use of global capability centers. In relation to these efforts, the company recognized a restructuring charge of $715 million after tax in fourth quarter 2024, with associated cash outflows anticipated over the next two years. The company continues to evaluate incremental cost reduction opportunities and could incur additional restructuring and reorganization charges in future periods. This will have an impact on the company’s pension and Other Post-Employment Benefit (OPEB) plans; however, the impact is not yet estimable and any impacts will be recognized in future periods.
Earnings trends for the company’s major business areas are described as follows:
Upstream Earnings for the upstream segment are closely aligned with industry prices for crude oil, natural gas and NGLs. These prices are subject to external factors over which the company has no control, including product demand connected with global economic conditions, industry production and inventory levels, technology advancements, production quotas or other actions imposed by OPEC+ countries, actions of regulators, weather-related damage and disruptions, competing fuel prices, natural and human causes beyond the company’s control, and regional supply interruptions or fears thereof that may be caused by military conflicts, civil unrest or political uncertainty. Any of these factors could also inhibit the company’s production capacity in an affected region. The company closely monitors developments in the countries in which it operates and holds investments and seeks to manage risks in operating its facilities and businesses.
The longer-term trend in earnings for the upstream segment is also a function of other factors, including the company’s ability to efficiently find, acquire and produce crude oil, natural gas and NGLs, changes in fiscal terms of contracts, the pace of energy transition, and changes in tax, environmental and other applicable laws and regulations.
In April 2024, Tengizchevroil LLP (TCO) achieved start-up of the Wellhead Pressure Management Project (WPMP) and at year-end 2024, all four pressure boost facility compressors are online and all metering stations have been converted to low pressure. In January 2025, TCO started oil production at its Future Growth Project, which is expected to contribute to higher free cash flow.
Chevron has interests in Venezuelan assets operated by independent affiliates. Chevron has been conducting limited activities in Venezuela consistent with the authorization provided pursuant to licenses issued by the United States government. In fourth quarter 2022, Chevron received General License 41 from the United States government, enabling the company to resume activity in Venezuela subject to certain limitations, and the company continues such activities under this General License. The financial results for Chevron’s business in Venezuela are being recorded as non-equity investments since 2020, where income is only recognized when cash is received and production and reserves are not included in the company’s results. Crude oil liftings in Venezuela started in first quarter 2023, which have positively impacted the company’s results. The company’s independent affiliates have continued to maintain safe and reliable operations; however, future impact on results of operations and financial condition remain uncertain.
Chevron maintains an equity interest in the Caspian Pipeline Consortium (CPC) which provides a primary export route for Tengiz field production in Kazakhstan. An adverse event or incident affecting CPC operations, which CPC has experienced from time to time, could have a negative impact on the Tengiz field and the company’s results of operations and financial position. The financial impacts of such risks, including presently imposed sanctions and the February 2025 drone attack on the CPC pumping station, remain uncertain.
Other governments (including Russia) have imposed and may impose additional sanctions and other trade laws, restrictions and regulations that could lead to disruption in our ability to produce, transport and/or export crude in the region around Russia.
Chevron holds a 39.7 percent interest in the Leviathan field and a 25 percent interest in the Tamar field in Israel. Despite the ongoing conflict between Israel and various regional adversaries, the company continues to maintain safe and reliable operations while meeting its contractual commitments. The company continues to monitor the ongoing conflict in the region and any future impacts on the company’s results of operations and financial condition remain uncertain.
| Management’s Discussion and Analysis of Financial Condition and Results of Operations | Financial Table of Contents |
Chevron operates and holds interests in the Bibiyana, Jalalabad and Moulavi Bazar fields in Bangladesh. Recent political unrest in the country has not impacted the company’s operations to date; however, the future impacts, if any, on the company’s results of operations and financial condition remain uncertain.
Commodity Prices The following chart shows the trend in benchmark prices for Brent crude oil, West Texas Intermediate (WTI) crude oil and U.S. Henry Hub natural gas. The Brent price averaged $81 per barrel for the full-year 2024, compared to $83 in 2023. As of mid-February 2025, the Brent price was $75 per barrel. The WTI price averaged $76 per barrel for the full-year 2024, compared to $78 in 2023. As of mid-February 2025, the WTI price was $71 per barrel. The majority of the company’s equity crude production is priced based on the Brent benchmark. The U.S. Henry Hub natural gas price averaged $2.25 per thousand cubic feet (MCF) for the full-year 2024, compared to $2.56 in 2023. As of mid-February 2025, the Henry Hub price was $4.42 per MCF. See page 47 for the company’s U.S. and international average realizations for each of the past three years.

Crude prices in 2024 were influenced by geopolitical conflict and OPEC+ supply restraint, which was offset by factors such as non-OPEC supply growth and slowing demand growth.
In contrast to price movements in the global market for crude oil, prices for natural gas are also impacted by regional supply and demand and infrastructure conditions in local markets. In the United States, lower Henry Hub prices were driven by high storage levels, strong production, and delayed starts to liquefied natural gas (LNG) export projects.
Outside the United States, prices for natural gas also depend on a wide range of supply, demand and regulatory circumstances. The company’s long-term contract prices for LNG are typically linked to crude oil prices. Most of the equity LNG offtake from the operated Australian LNG projects is committed under binding long-term contracts, with some sold in the Asian spot LNG market.
Production The company’s worldwide net oil-equivalent production in 2024 was 3.3 million barrels per day, 7 percent higher than in 2023 primarily due to the full-year of legacy PDC Energy, Inc. (PDC) production and growth in the Permian Basin. About 20 percent of the company’s net oil-equivalent production in 2024 occurred in OPEC+ member countries of Equatorial Guinea, Kazakhstan, Nigeria, the Partitioned Zone between Saudi Arabia and Kuwait and the Republic of Congo.
The company estimates its net oil-equivalent production in 2025 to increase six to eight percent over 2024, assuming a Brent crude oil price of $70 per barrel and excluding expected asset sales. This estimate is subject to many factors and uncertainties, including quotas or other actions that may be imposed by OPEC+; price effects on entitlement volumes; changes in fiscal terms or restrictions on the scope of company operations; delays in construction; reservoir performance; greater-than-expected declines in production from mature fields; start-up or ramp-up of projects; acquisition and divestment of assets; fluctuations in demand for crude oil and natural gas in various markets; weather conditions that may shut in production; civil unrest; changing geopolitics; delays in completion of maintenance turnarounds; storage constraints or economic conditions that could lead to shut-in production; or other disruptions to operations. The outlook for future
| Management’s Discussion and Analysis of Financial Condition and Results of Operations | Financial Table of Contents |
production levels is also affected by the size and number of economic investment opportunities and the time lag between initial exploration and the beginning of production.
| Net crude oil production Thousands of barrels per day |

| Affiliates | |||||||||||
| Europe | |||||||||||
| Australia | |||||||||||
| Asia | |||||||||||
| Africa | |||||||||||
| Other Americas | |||||||||||
| United States | |||||||||||
| Net natural gas liquids production Thousands of barrels per day |

| Affiliates | |||||||||||
| Europe | |||||||||||
| Australia | |||||||||||
| Asia | |||||||||||
| Africa | |||||||||||
| Other Americas | |||||||||||
| United States | |||||||||||
| Net natural gas production Millions of cubic feet per day |

| Affiliates | |||||||||||
| Europe | |||||||||||
| Australia | |||||||||||
| Asia | |||||||||||
| Africa | |||||||||||
| Other Americas | |||||||||||
| United States | |||||||||||
| Net proved reserves by geographic area Billions of BOE* |

| Affiliates | |||||||||||
| Europe | |||||||||||
| Australia | |||||||||||
| Asia | |||||||||||
| Africa | |||||||||||
| Other Americas | |||||||||||
| United States | |||||||||||
| *barrels of oil-equivalent | |||||||||||
| Net proved reserves by product Billions of BOE* |

| Natural gas | |||||||||||
| Natural gas liquids | |||||||||||
| Crude oil | |||||||||||
| *barrels of oil-equivalent | |||||||||||
Proved Reserves Net proved reserves for consolidated companies and affiliated companies totaled 9.8 billion barrels of oil-equivalent at year-end 2024, a decrease from year-end 2023. The reserve replacement ratio in 2024 was negative 4 percent. The 5 and 10 year reserve replacement ratios were 72 percent and 88 percent, respectively. Refer to Table V for a tabulation of the company’s proved net oil and gas reserves by geographic area, at the beginning of 2022 and each year-end from 2022 through 2024, and an accompanying discussion of major changes to proved reserves by geographic area for the three-year period ending December 31, 2024.
Refer to the “Results of Operations” section on pages 43 for additional discussion of the company’s upstream business.
Downstream Earnings for the downstream segment are closely tied to margins on the refining, manufacturing and marketing of products that include gasoline, diesel, jet fuel, lubricants, fuel oil, fuel and lubricant additives, petrochemicals and renewable fuels. Industry margins are sometimes volatile and can be affected by the global and regional supply-and-demand balance for refined products and petrochemicals, and by changes in the price of crude oil, other refinery and petrochemical feedstocks, and natural gas. Industry margins can also be influenced by inventory levels, geopolitical events, costs of materials and services, refinery or chemical plant capacity utilization, maintenance programs, and disruptions at refineries or chemical plants resulting from unplanned outages due to severe weather, fires or other operational events.
Other factors affecting profitability for downstream operations include the reliability and efficiency of the company’s refining, marketing and petrochemical assets, the effectiveness of its crude oil and product supply functions, and the volatility of tanker-charter rates for the company’s shipping operations, which are driven by the industry’s demand for crude oil and product tankers. Other factors beyond the company’s control include the general level of inflation and energy costs to operate the company’s refining, marketing and petrochemical assets, and changes in tax, environmental, and other applicable laws and regulations.
The company’s most significant marketing areas are the West Coast and Gulf Coast of the United States and Asia Pacific. Chevron operates or has significant ownership interests in refineries in each of these areas. The company is also one of the largest renewable fuels producers in the United States.
Refer to the “Results of Operations” section on page 44 for additional discussion of the company’s downstream operations.
All Other consists of worldwide cash management and debt financing activities, corporate administrative functions, insurance operations, real estate activities and technology companies.
| Management’s Discussion and Analysis of Financial Condition and Results of Operations | Financial Table of Contents |
Noteworthy Developments
Key noteworthy developments and other events during 2024 and early 2025 included the following:
Angola Added frontier exploration acreage positions in the deepwater lower Congo Basin.
Angola Achieved first gas on the Sanha Lean Gas Connection project, securing incremental natural gas supply to the Angola Liquefied Natural Gas facility.
Australia Announced asset exchange of North West Shelf Assets for Wheatstone Assets and Julimar/Brunello fields.
Australia Received two offshore greenhouse gas assessment permits, covering an area of approximately 10,700 km2, to assess future carbon dioxide storage.
Brazil Secured 15 exploration blocks in the South Santos and Pelotas Basins.
Canada Sold the company’s interest in the Athabasca Oil Sands Project and Duvernay shale for $6.5 billion.
Equatorial Guinea Signed agreements to acquire two exploration blocks offshore Bioko Island.
Israel Reached final investment decision to add midstream infrastructure that is expected to increase production capacity at the Tamar gas field in Israel to 1.6 billion cubic feet per day.
Kazakhstan Completed the Wellhead Pressure Management Project and, in January 2025, started production at the Future Growth Project, which is expected to ramp up total output to around one million barrels of oil equivalent per day at the company’s 50 percent-owned affiliate, Tengizchevroil LLP in Kazakhstan.
Myanmar Withdrew from Chevron’s nonoperated working interests effective April 1, 2024.
Namibia Signed agreements to acquire 80 percent working interest in Petroleum Exploration License 82 in the Walvis Basin.
Nigeria Extended the Meji field offshore Nigeria with a near-field discovery and renewed the Agbami deep-water concession through 2044.
Republic of Congo Sold the company’s 31.5 percent nonoperated working interest in the offshore Haute Mer permit area and its 15.75 percent interest in the Republic of Congo portion of Lianzi in January 2025.
United States Reached final investment decision to build an oilseed processing plant in Louisiana through the company’s joint venture Bunge Chevron Ag Renewables LLC.
United States Drilled onshore and offshore stratigraphic wells to delineate carbon dioxide storage potential through the company’s joint venture Bayou Bend CCS LLC.
United States Launched a $500 million Future Energy Fund III focused on venture investments in technology-based solutions that have the potential to enable affordable, reliable and lower carbon energy.
United States Progressed the company’s pending merger with Hess Corporation by securing Hess stockholder approval and clearing Federal Trade Commission antitrust review.
United States Started production at the industry-first 20,000 pounds per square inch deepwater Anchor project, began water injection to boost production from the St. Malo and Tahiti fields, and in January 2025 started production from the Whale semi-submersible platform in the Gulf of America.
United States Upgraded the Pasadena Refinery, which is expected to increase product flexibility and expand the processing capacity of lighter crude oil to 125,000 barrels per day.
United States Completed projects and operational changes designed to abate over 700,000 tonnes of carbon dioxide-equivalent from the company’s operations.
United States Announced plans to jointly develop scalable power solutions using natural gas-fired turbines with flexibility to integrate carbon capture and storage to support growing energy demand from U.S. data centers.
Uruguay Entered an agreement to assume a 60 percent operated interest in Uruguay’s AREA OFF-1 offshore exploration block.
| Management’s Discussion and Analysis of Financial Condition and Results of Operations | Financial Table of Contents |
Common Stock Dividends The 2024 annual dividend was $6.52 per share, making 2024 the 37th consecutive year that the company increased its annual per share dividend payout. In January 2025, the company’s Board of Directors increased its quarterly dividend by $0.08 per share, approximately five percent, to $1.71 per share payable in March 2025.
Common Stock Repurchase Program The company repurchased $15.2 billion of its common stock in 2024 under its stock repurchase program. For more information on the common stock repurchase program, see Liquidity and Capital Resources.
Results of Operations
The following section presents the results of operations and variances on an after-tax basis for the company’s business segments – Upstream and Downstream – as well as for “All Other.” Earnings are also presented for the U.S. and international geographic areas of the Upstream and Downstream business segments. Refer to Note 14 Operating Segments and Geographic Data for a discussion of the company’s “reportable segments.” This section should also be read in conjunction with the discussion in Business Environment and Outlook. Refer to the Selected Operating Data for a three-year comparison of production volumes, refined product sales volumes and refinery inputs. A discussion of variances between 2023 and 2022 can be found in the “Results of Operations” section on pages 41 through 43 of the company’s 2023 Annual Report on Form 10-K filed with the SEC on February 26, 2024.
| Worldwide Upstream earnings Billions of Dollars |

| United States | |||||||||||
| International | |||||||||||
| Worldwide Downstream earnings Billions of dollars |

| United States | |||||||||||
| International | |||||||||||
| U.S. refined product sales Thousands of barrels per day |

| Other | |||||||||||
| Fuel oil | |||||||||||
| Diesel/Gas oil | |||||||||||
| Jet fuel | |||||||||||
| Gasoline | |||||||||||
| International refined product sales* Thousands of barrels per day |

| Other | |||||||||||
| Fuel oil | |||||||||||
| Diesel/Gas oil | |||||||||||
| Jet fuel | |||||||||||
| Gasoline | |||||||||||
| *includes equity share in affiliates | |||||||||||
U.S. Upstream
| Unit ***** | 2024 | 2023 | 2022 | |||||||||||||||||
| Earnings | $MM | $ | 7,602 | $ | 4,148 | $ | 12,621 | |||||||||||||
| Net Oil-Equivalent Production | MBOED | 1,599 | 1,349 | 1,181 | ||||||||||||||||
| Liquids Production | MBD | 1,152 | 997 | 888 | ||||||||||||||||
| Natural Gas Production | MMCFD | 2,684 | 2,112 | 1,758 | ||||||||||||||||
| Liquids Realization | $/BBL | $ | 56.24 | $ | 59.19 | $ | 76.71 | |||||||||||||
| Natural Gas Realization | $/MCF | $ | 1.04 | $ | 1.67 | $ | 5.55 | |||||||||||||
| * MBD — thousands of barrels per day; MMCFD — millions of cubic feet per day; BBL — Barrel; MCF — thousands of cubic feet; MBOED — thousands of barrels of oil-equivalent per day. |
U.S. upstream earnings increased by $3.5 billion primarily due to higher sales volumes of $2.2 billion, including from legacy PDC assets, and the absence of charges from decommissioning obligations for previously divested assets in the Gulf of America of $1.9 billion, partly offset by lower realizations of $790 million.
Net oil-equivalent production was up 250,000 barrels per day, or 19 percent, primarily due to full-year of legacy PDC production and growth in the Permian Basin.
| Management’s Discussion and Analysis of Financial Condition and Results of Operations | Financial Table of Contents |
International Upstream
| Unit****2 | 2024 | 2023 | 2022 | |||||||||||||||||
| Earnings1 | $MM | $ | 11,000 | $ | 13,290 | $ | 17,663 | |||||||||||||
| Net Oil-Equivalent Production | MBOED | 1,739 | 1,771 | 1,818 | ||||||||||||||||
| Liquids Production | MBD | 823 | 833 | 831 | ||||||||||||||||
| Natural Gas Production | MMCFD | 5,494 | 5,632 | 5,919 | ||||||||||||||||
| Liquids Realization | $/BBL | $ | 71.38 | $ | 71.70 | $ | 90.71 | |||||||||||||
| Natural Gas Realization | $/MCF | $ | 7.32 | $ | 7.69 | $ | 9.75 | |||||||||||||
| 1 Includes foreign currency effects: | $ | 395 | $ | 376 | $ | 816 | ||||||||||||||
| 2 MBD — thousands of barrels per day; MMCFD — millions of cubic feet per day; BBL — Barrel; MCF — thousands of cubic feet; MBOED — thousands of barrels of oil-equivalent per day. |
International upstream earnings decreased by $2.3 billion primarily due to lower realizations of $770 million, higher operating expenses of $580 million, lower sales volumes of $570 million and absence of favorable one-time tax benefit in Nigeria of $560 million. Foreign currency effects had a favorable impact on earnings of $19 million between periods.
Net oil-equivalent production was down 32,000 barrels per day, or 2 percent. The decrease was primarily due to downtime at TCO and Nigeria, and withdrawal from Myanmar, partly offset by entitlement effects.
U.S. Downstream
| Unit ***** | 2024 | 2023 | 2022 | |||||||||||||||||
| Earnings | $MM | $ | 531 | $ | 3,904 | $ | 5,394 | |||||||||||||
| Refinery Crude Unit Inputs | MBD | 917 | 962 | 924 | ||||||||||||||||
| Refined Product Sales | MBD | 1,286 | 1,287 | 1,228 | ||||||||||||||||
| * MBD — thousands of barrels per day. |
U.S. downstream earnings decreased by $3.4 billion primarily due to lower margins on refined product sales of $2.6 billion and higher operating expenses of $810 million.
Refinery crude unit inputs were down 45,000 barrels per day, or 5 percent, primarily due to the upgrade of the Pasadena, Texas refinery that was completed during the fourth quarter 2024 and downtime at the Pascagoula, Mississippi refinery.
Refined product sales were down 1,000 barrels per day.
International Downstream
| Unit 2 | 2024 | 2023 | 2022 | |||||||||||||||||
| Earnings 1 | $MM | $ | 1,196 | $ | 2,233 | $ | 2,761 | |||||||||||||
| Refinery Crude Unit Inputs | MBD | 646 | 636 | 652 | ||||||||||||||||
| Refined Product Sales | MBD | 1,495 | 1,445 | 1,386 | ||||||||||||||||
| 1 Includes foreign currency effects: | $ | 126 | $ | (12) | $ | 235 | ||||||||||||||
| 2 MBD — thousands of barrels per day. |
International downstream earnings decreased by $1.0 billion primarily due to lower margins on refined product sales of $880 million and impairments of $190 million. Foreign currency effects had a favorable impact on earnings of $138 million between periods.
Refinery crude unit inputs were up 10,000 barrels per day, or 2 percent.
Refined product sales were up 50,000 barrels per day, or 3 percent, primarily due to increased trading volumes.
All Other
| Unit | 2024 | 2023 | 2022 | ||||||||||||||||||||
| Net charges***** | $MM | $ | (2,668) | $ | (2,206) | $ | (2,974) | ||||||||||||||||
| *Includes foreign currency effects: | $ | (1) | $ | (588) | $ | (382) |
All Other consists of worldwide cash management and debt financing activities, corporate administrative functions, insurance operations, real estate activities, and technology companies.
Net charges increased by $462 million primarily due to higher employee benefit costs, severance charges, lower interest income and higher interest expense, partially offset by a favorable swing of $587 million in foreign currency effects.
| Management’s Discussion and Analysis of Financial Condition and Results of Operations | Financial Table of Contents |
Consolidated Statement of Income
Comparative amounts for certain income statement categories are shown below. A discussion of variances between 2023 and 2022 can be found in the “Consolidated Statement of Income” section on pages 43 and 44 of the company’s 2023 Annual Report on Form 10-K.
| Millions of dollars | 2024 | 2023 | 2022 | |||||||||||||||||
| Sales and other operating revenues | $ | 193,414 | $ | 196,913 | $ | 235,717 |
Sales and other operating revenues decreased in 2024 mainly due to lower commodity prices, partially offset by higher crude oil, natural gas and refined product sales volumes.
| Millions of dollars | 2024 | 2023 | 2022 | |||||||||||||||||
| Income (loss) from equity affiliates | $ | 4,596 | $ | 5,131 | $ | 8,585 |
Income from equity affiliates decreased in 2024 mainly due to lower downstream-related earnings from GS Caltex in South Korea and lower upstream-related earnings from Tengizchevroil in Kazakhstan, partially offset by an absence of certain U.S. upstream equity affiliate impairments and higher downstream-related earnings from Chevron Phillips Chemical Company LLC (CPChem). Refer to Note 15 Investments and Advances for a discussion of Chevron’s investments in affiliated companies.
| Millions of dollars | 2024 | 2023 | 2022 | |||||||||||||||||
| Other income (loss) | $ | 4,782 | $ | (1,095) | $ | 1,950 |
Other income increased in 2024 mainly due to the absence of charges related to decommissioning obligations from previously divested oil and gas production assets in the Gulf of America, before tax gains on asset sales in Canada, a favorable swing in foreign currency effects and higher dividend income.
| Millions of dollars | 2024 | 2023 | 2022 | |||||||||||||||||
| Purchased crude oil and products | $ | 119,206 | $ | 119,196 | $ | 145,416 |
Crude oil and product purchases remained fairly flat in 2024 as lower crude and refined product prices were partially offset by higher crude oil and refined product volumes.
| Millions of dollars | 2024 | 2023 | 2022 | |||||||||||||||||
| Operating, selling, general and administrative expenses | $ | 32,298 | $ | 29,028 | $ | 29,026 |
Operating, selling, general and administrative expenses increased compared to last year mainly due to higher employee-related expenses as a result of higher severance and employee benefit costs and higher downstream-related shutdown expenses.
| Millions of dollars | 2024 | 2023 | 2022 | |||||||||||||||||
| Exploration expense | $ | 995 | $ | 914 | $ | 974 |
Exploration expenses in 2024 were higher primarily due to higher geological and geophysical engineering costs.
| Millions of dollars | 2024 | 2023 | 2022 | |||||||||||||||||
| Depreciation, depletion and amortization | $ | 17,282 | $ | 17,326 | $ | 16,319 |
Depreciation, depletion and amortization expenses decreased slightly in 2024 primarily due to lower impairment charges partially offset by higher production and higher rates.
| Millions of dollars | 2024 | 2023 | 2022 | |||||||||||||||||
| Taxes other than on income | $ | 4,716 | $ | 4,220 | $ | 4,032 |
Taxes other than on income increased in 2024 primarily due to higher excise and property taxes.
| Millions of dollars | 2024 | 2023 | 2022 | |||||||||||||||||
| Interest and debt expense | $ | 594 | $ | 469 | $ | 516 |
Interest and debt expenses increased in 2024 mainly due to higher debt balances.
| Millions of dollars | 2024 | 2023 | 2022 | |||||||||||||||||
| Other components of net periodic benefit costs | $ | 195 | $ | 212 | $ | 295 |
Other components of net periodic benefit costs decreased in 2024 primarily due to lower pension settlement costs.
| Management’s Discussion and Analysis of Financial Condition and Results of Operations | Financial Table of Contents |
| Millions of dollars | 2024 | 2023 | 2022 | |||||||||||||||||
| Income tax expense (benefit) | $ | 9,757 | $ | 8,173 | $ | 14,066 |
The increase in income tax expense in 2024 of $1.6 billion was primarily due to the tax impacts of the asset sales in Canada, partially offset by the decrease in total income before tax for the company of $2.1 billion. The decrease in income before taxes for the company was primarily the result of lower downstream margins, lower upstream realizations, higher operating expenses, in part due to severance charges, partially offset by the absence of charges from decommissioning obligations for previously divested assets, higher sales volumes and favorable foreign exchange impacts.
U.S. income before tax decreased from $8.6 billion in 2023 to $8.1 billion in 2024. This $0.5 billion decrease in income was primarily driven by lower downstream margins, higher operating expenses, in part due to severance charges, and lower upstream realizations, partially offset by the absence of charges related to decommissioning obligations for previously divested assets and higher sales volumes. The increase of $0.1 billion in U.S. income tax expense between year-over-year periods, from $1.8 billion in 2023 to $1.9 billion in 2024, was primarily driven by current period unfavorable tax items.
International income before tax decreased from $21.0 billion in 2023 to $19.5 billion in 2024. This $1.6 billion decrease in income was primarily driven by lower downstream margins, lower upstream realizations, higher operating expenses and lower sales volumes, partially offset by favorable foreign exchange impacts. The increase of $1.5 billion in international income tax expense between year-over-year periods, from $6.4 billion in 2023 to $7.9 billion in 2024, was primarily driven by the tax impacts of the asset sales in Canada, partially offset by the decrease in income before tax.
Refer also to the discussion of the effective income tax rate in Note 17 Taxes.
| Management’s Discussion and Analysis of Financial Condition and Results of Operations | Financial Table of Contents |
Selected Operating Data****1,2
| Unit | 2024 | 2023 | 2022 | ||||||||||||||||||||
| U.S. Upstream | |||||||||||||||||||||||
| Net Crude Oil and Natural Gas Liquids (NGLs) Production | MBD | 1,152 | 997 | 888 | |||||||||||||||||||
| Net Natural Gas Production3 | MMCFD | 2,684 | 2,112 | 1,758 | |||||||||||||||||||
| Net Oil-Equivalent Production | MBOED | 1,599 | 1,349 | 1,181 | |||||||||||||||||||
| Sales of Natural Gas4 | MMCFD | 5,172 | 4,637 | 4,354 | |||||||||||||||||||
| Sales of Natural Gas Liquids | MBD | 490 | 354 | 276 | |||||||||||||||||||
| Revenues from Net Production | |||||||||||||||||||||||
| Crude | $/BBL | $ | 73.47 | $ | 75.04 | $ | 92.41 | ||||||||||||||||
| NGLs | $/BBL | $ | 19.88 | $ | 20.04 | $ | 33.80 | ||||||||||||||||
| Liquids (weighted average of Crude and NGLs) | $/BBL | $ | 56.24 | $ | 59.19 | $ | 76.71 | ||||||||||||||||
| Natural Gas | $/MCF | $ | 1.04 | $ | 1.67 | $ | 5.55 | ||||||||||||||||
| International Upstream | |||||||||||||||||||||||
| Net Crude Oil and NGLs Production5 | MBD | 823 | 833 | 831 | |||||||||||||||||||
| Net Natural Gas Production3 | MMCFD | 5,494 | 5,632 | 5,919 | |||||||||||||||||||
| Net Oil-Equivalent Production5 | MBOED | 1,739 | 1,771 | 1,818 | |||||||||||||||||||
| Sales of Natural Gas | MMCFD | 5,678 | 6,025 | 5,786 | |||||||||||||||||||
| Sales of Natural Gas Liquids | MBD | 132 | 94 | 107 | |||||||||||||||||||
| Revenues from Liftings | |||||||||||||||||||||||
| Crude | $/BBL | $ | 73.72 | $ | 74.29 | $ | 93.73 | ||||||||||||||||
| NGLs | $/BBL | $ | 26.49 | $ | 24.01 | $ | 37.56 | ||||||||||||||||
| Liquids (weighted average of Crude and NGLs) | $/BBL | $ | 71.38 | $ | 71.70 | $ | 90.71 | ||||||||||||||||
| Natural Gas | $/MCF | $ | 7.32 | $ | 7.69 | $ | 9.75 | ||||||||||||||||
| Worldwide Upstream | |||||||||||||||||||||||
| Net Oil-Equivalent Production5 | |||||||||||||||||||||||
| United States | MBOED | 1,599 | 1,349 | 1,181 | |||||||||||||||||||
| International | MBOED | 1,739 | 1,771 | 1,818 | |||||||||||||||||||
| Total | MBOED | 3,338 | 3,120 | 2,999 | |||||||||||||||||||
| U.S. Downstream | |||||||||||||||||||||||
| Gasoline Sales6 | MBD | 667 | 642 | 639 | |||||||||||||||||||
| Other Refined Product Sales | MBD | 619 | 645 | 589 | |||||||||||||||||||
| Total Refined Product Sales | MBD | 1,286 | 1,287 | 1,228 | |||||||||||||||||||
| Sales of Natural Gas4 | MMCFD | 28 | 32 | 24 | |||||||||||||||||||
| Sales of Natural Gas Liquids | MBD | 21 | 22 | 27 | |||||||||||||||||||
| Refinery Crude Unit Inputs8 | MBD | 917 | 962 | 924 | |||||||||||||||||||
| International Downstream | |||||||||||||||||||||||
| Gasoline Sales6 | MBD | 382 | 353 | 336 | |||||||||||||||||||
| Other Refined Product Sales | MBD | 1,113 | 1,092 | 1,050 | |||||||||||||||||||
| Total Refined Product Sales7 | MBD | 1,495 | 1,445 | 1,386 | |||||||||||||||||||
| Sales of Natural Gas4 | MMCFD | — | 1 | 3 | |||||||||||||||||||
| Sales of Natural Gas Liquids | MBD | 136 | 153 | 127 | |||||||||||||||||||
| Refinery Crude Unit Inputs8 | MBD | 646 | 636 | 652 | |||||||||||||||||||
| 1 Includes company share of equity affiliates. | |||||||||||||||||||||||
| 2 MBD – thousands of barrels per day; MMCFD – millions of cubic feet per day; MBOED – thousands of barrels of oil-equivalents per day; Bbl – barrel; MCF – thousands of cubic feet. Oil-equivalent gas (OEG) conversion ratio is 6,000 cubic feet of natural gas = 1 barrel of crude oil; MBOED - thousands of barrels of oil-equivalent per day. | |||||||||||||||||||||||
| 3 Includes natural gas consumed in operations: | |||||||||||||||||||||||
| United States | MMCFD | 60 | 64 | 53 | |||||||||||||||||||
| International | MMCFD | 549 | 532 | 517 | |||||||||||||||||||
| 4 Downstream sales of Natural Gas separately identified from Upstream. | |||||||||||||||||||||||
| 5 Includes net production of synthetic oil: | |||||||||||||||||||||||
| Canada | MBD | 46 | 51 | 45 | |||||||||||||||||||
| 6 Includes branded and unbranded gasoline. | |||||||||||||||||||||||
| 7 Includes sales of affiliates: | MBD | 386 | 389 | 389 | |||||||||||||||||||
| 8 Includes crude oil and other inputs. |
| Management’s Discussion and Analysis of Financial Condition and Results of Operations | Financial Table of Contents |
Liquidity and Capital Resources
Sources and Uses of Cash The strength of the company’s balance sheet enables it to fund any timing differences throughout the year between cash inflows and outflows.
Cash, Cash Equivalents and Marketable Securities Total balances were $6.8 billion and $8.2 billion at December 31, 2024 and 2023, respectively. The company holds its cash with a diverse group of major financial institutions and has processes and safeguards in place designed to manage its cash balances and mitigate the risk of loss. Cash provided by operating activities in 2024 was $31.5 billion, compared to $35.6 billion in 2023, primarily due to lower earnings and higher payments related to asset retirement obligations. Cash provided by operating activities was net of contributions to employee pension plans of approximately $844 million in 2024 and $1.1 billion in 2023. Capital expenditures totaled $16.4 billion in 2024 compared to $15.8 billion in 2023. Proceeds and deposits related to asset sales and return of investments totaled $7.7 billion in 2024 compared to $669 million in 2023 primarily related to proceeds from asset sales in Canada. Cash flow from financing activities includes proceeds from shares issued for stock options of $330 million in 2024, compared with $261 million in 2023.
Restricted cash of $1.5 billion and $1.1 billion at December 31, 2024 and 2023, respectively, was held in cash and short-term marketable securities and recorded as “Deferred charges and other assets” and “Prepaid expenses and other current assets” on the Consolidated Balance Sheet. These amounts are generally associated with upstream decommissioning activities, tax payments and funds held in escrow for tax-deferred exchanges. The increase of restricted cash in 2024 is mainly due to increase in funds for tax-deferred exchanges.
Dividends Dividends paid to common stockholders were $11.8 billion in 2024 and $11.3 billion in 2023.
Debt and Finance Lease Liabilities Total debt and finance lease liabilities were $24.5 billion at December 31, 2024, up from $20.8 billion at year-end 2023 as the company issued commercial paper and tax-exempt bonds and retired public bonds.
The $3.7 billion increase in total debt and finance lease liabilities during 2024 was primarily due to the issuance of commercial paper. The company’s debt and finance lease liabilities due within one year, consisting primarily of the current portion of long-term debt and redeemable long-term obligations, totaled $12.7 billion at December 31, 2024, compared with $5.1 billion at year-end 2023. Of these amounts, $8.3 billion and $4.5 billion were reclassified to long-term debt at the end of 2024 and 2023, respectively, since settlement of these obligations was not expected to require the use of working capital within one year, as the company had the intent and the ability, as evidenced by committed credit facilities, to continue refinancing them.
The company has access to a commercial paper program as a financing source for working capital or other short-term needs. The company had $5.4 billion of commercial paper outstanding as of December 31, 2024, and there was no commercial paper outstanding at December 31, 2023.
The company has an automatic shelf registration statement that expires in November 2027 for an unspecified amount of nonconvertible debt securities issued by Chevron Corporation or Chevron U.S.A. Inc. (CUSA).
| Management’s Discussion and Analysis of Financial Condition and Results of Operations | Financial Table of Contents |
| Cash from operating activities compared with capital expenditures and cash returned to shareholders Billions of dollars |

| Stock repurchases | |||||||||||
| Capital expenditures | |||||||||||
| Dividends | |||||||||||
| Cash from operating activities | |||||||||||
| Capital expenditures by segment Billions of dollars |

| All Other | |||||||||||
| Downstream | |||||||||||
| Upstream | |||||||||||
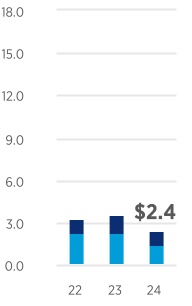
| Affiliate capital expenditure Billions of dollars |
| All Other | |||||||||||
| Downstream | |||||||||||
| Upstream | |||||||||||
| Debt at year-end Billions of dollars |

| Total debt | |||||||||||
| Net debt* | |||||||||||
| *Refer to pages 52-53 for calculations of debt ratio and net debt ratio |
| Debt ratios Percent |

| Debt ratio | |||||||||||
| Net debt ratio* | |||||||||||
| *Refer to pages 52-53 for calculations of debt ratio and net debt ratio |
The major debt rating agencies routinely evaluate the company’s debt, and the company’s cost of borrowing can increase or decrease depending on these debt ratings. The company has outstanding public bonds issued by Chevron Corporation, CUSA, Noble Energy, Inc. (Noble), and Texaco Capital Inc. Most of these securities are the obligations of, or guaranteed by, Chevron Corporation and are rated AA- by Standard and Poor’s Corporation and Aa2 by Moody’s Investors Service. The company’s U.S. commercial paper is rated A-1+ by Standard and Poor’s and P-1 by Moody’s. All of these ratings denote high-quality, investment-grade securities.
The company’s future debt level is dependent primarily on results of operations, cash that may be generated from asset dispositions, the capital program, acquisitions, investments, lending commitments to affiliates and cash returned to shareholders. Based on its high-quality debt ratings, the company believes that it has substantial borrowing capacity to meet unanticipated cash requirements. During extended periods of low prices for crude oil and natural gas and narrow margins for refined products and commodity chemicals, the company has the ability to modify its capital spending plans and discontinue or curtail the stock repurchase program. This provides the flexibility to continue paying the common stock dividend and remain committed to retaining the company’s high-quality debt ratings.
Committed Credit Facilities Information related to committed credit facilities is included in Note 19 Short-Term Debt.
Summarized Financial Information for Guarantee of Securities of Subsidiaries CUSA issued bonds that are fully and unconditionally guaranteed on an unsecured basis by Chevron Corporation (together, the “Obligor Group”). The tables below contain summary financial information for Chevron Corporation, as Guarantor, excluding its consolidated subsidiaries, and CUSA, as the issuer, excluding its consolidated subsidiaries. The summary financial information of the Obligor Group is presented on a combined basis, and transactions between the combined entities have been eliminated. Financial information for non-guarantor entities has been excluded. In the year ended December 31, 2024, the Obligor Group recognized an increase in “Net income (loss)” and reduction in “Current liability - related party” and “Total net equity (deficit)” following the resolution of outstanding balances with subsidiaries outside of the Obligor Group.
| At December 31, | |||||||||||
| 2024 | 2023 | ||||||||||
| (Millions of dollars) (unaudited) | |||||||||||
| Sales and other operating revenues | $ | 96,035 | $ | 100,405 | |||||||
| Sales and other operating revenues - related party | 43,562 | 44,553 | |||||||||
| Total costs and other deductions | 102,116 | 102,773 | |||||||||
| Total costs and other deductions - related party | 35,454 | 35,781 | |||||||||
| Net income (loss) | $ | 73,119 | $ | 12,190 | |||||||
| Management’s Discussion and Analysis of Financial Condition and Results of Operations | Financial Table of Contents |
| At December 31, | |||||||||||
| 2024 | 2023 | ||||||||||
| (Millions of dollars) (unaudited) | |||||||||||
| Current assets | $ | 16,918 | $ | 19,006 | |||||||
| Current assets - related party | 2,626 | 18,375 | |||||||||
| Other assets | 57,921 | 54,558 | |||||||||
| Current liabilities | 30,563 | 20,512 | |||||||||
| Current liabilities - related party | 22,997 | 132,474 | |||||||||
| Other liabilities | 23,719 | 28,849 | |||||||||
| Total net equity (deficit) | $ | 186 | $ | (89,896) |
Common Stock Repurchase Program On January 25, 2023, the Board of Directors authorized the repurchase of the company’s shares of common stock in an aggregate amount of $75 billion (the “2023 Program”). The 2023 Program took effect on April 1, 2023, and does not have a fixed expiration date. During 2024, the company purchased a total of 100.4 million shares for $15.2 billion and paid an additional $145 million in excise taxes related to 2023 buybacks. As of December 31, 2024, the company had purchased a total of 170.9 million shares for $26.4 billion excluding excise taxes, resulting in $48.6 billion remaining under the 2023 Program.
Repurchases of shares of the company’s common stock may be made from time to time in the open market, by block purchases, in privately negotiated transactions or in such other manner as determined by the company. The timing of the repurchases and the actual amount repurchased will depend on a variety of factors, including the market price of the company’s shares, general market and economic conditions, and other factors. The stock repurchase program does not obligate the company to acquire any particular amount of common stock and may be suspended or discontinued at any time.
Capital Expenditures Capital expenditures (Capex) primarily includes additions to fixed asset or investment accounts for the company’s consolidated subsidiaries and is disclosed in the Consolidated Statement of Cash Flows. Capex by business segment for 2024, 2023 and 2022 is as follows:
| Year ended December 31 | |||||||||||||||||||||||||||||||||||||||||
| Capex | 2024 | 2023 | 2022 | ||||||||||||||||||||||||||||||||||||||
| Millions of dollars | U.S. | Int’l. | Total | U.S. | Int’l. | Total | U.S. | Int’l. | Total | ||||||||||||||||||||||||||||||||
| Upstream | $ | 9,481 | $ | 4,850 | $ | 14,331 | $ | 9,842 | $ | 3,836 | $ | 13,678 | $ | 6,847 | $ | 2,718 | $ | 9,565 | |||||||||||||||||||||||
| Downstream | 1,443 | 251 | 1,694 | 1,536 | 237 | 1,773 | 1,699 | 375 | 2,074 | ||||||||||||||||||||||||||||||||
| All Other | 406 | 17 | 423 | 351 | 27 | 378 | 310 | 25 | 335 | ||||||||||||||||||||||||||||||||
| Capex | $ | 11,330 | $ | 5,118 | $ | 16,448 | $ | 11,729 | $ | 4,100 | $ | 15,829 | $ | 8,856 | $ | 3,118 | $ | 11,974 |
Capex for 2024 was $16.4 billion, 4 percent higher than 2023 due to higher investments in the upstream.
The company estimates that 2025 Capex will range from $14.5 to $15.5 billion. Upstream Capex is projected at $13 billion, with two-thirds in the United States. This includes $4.5 to $5 billion for Permian Basin development, with the remaining split between the DJ Basin and the Gulf of America. In international Upstream, about $1 billion is allocated to Australia. Downstream Capex is estimated at $1.2 billion, with two-thirds in the United States. About $1.5 billion of total Capex, which is included within upstream and downstream budgets, is dedicated to lowering the carbon intensity of our operations and growing new energies businesses. Corporate and other Capex is projected to be about $0.7 billion.
Affiliate Capital Expenditures Equity affiliate capital expenditures (Affiliate Capex) primarily includes additions to fixed asset and investment accounts in the equity affiliate companies’ financial statements and does not require cash outlays by the company.
Affiliate Capex by business segment for 2024, 2023 and 2022 is as follows:
| Management’s Discussion and Analysis of Financial Condition and Results of Operations | Financial Table of Contents |
| Year ended December 31 | |||||||||||||||||||||||||||||||||||||||||
| Affiliate Capex | 2024 | 2023 | 2022 | ||||||||||||||||||||||||||||||||||||||
| Millions of dollars | U.S. | Int’l. | Total | U.S. | Int’l. | Total | U.S. | Int’l. | Total | ||||||||||||||||||||||||||||||||
| Upstream | $ | — | $ | 1,451 | $ | 1,451 | $ | — | $ | 2,310 | $ | 2,310 | $ | — | $ | 2,406 | $ | 2,406 | |||||||||||||||||||||||
| Downstream | 802 | 196 | 998 | 983 | 241 | 1,224 | 768 | 192 | 960 | ||||||||||||||||||||||||||||||||
| All Other | — | — | — | — | — | — | — | — | — | ||||||||||||||||||||||||||||||||
| Affiliate Capex | $ | 802 | $ | 1,647 | $ | 2,449 | $ | 983 | $ | 2,551 | $ | 3,534 | $ | 768 | $ | 2,598 | $ | 3,366 |
Affiliate Capex for 2024 was $2.4 billion, 31 percent lower than 2023 mainly due to lower spend at Tengizchevroil’s Wellhead Pressure Management Project (WPMP) and Future Growth Project (FGP).
Affiliate Capex is expected to range between $1.7 to $2.0 billion in 2025. Less than half of Affiliate Capex is for Tengizchevroil, while the remaining spend primarily supports CPChem’s two major integrated polymer projects.
The company monitors market conditions and can adjust future capital outlays should conditions change.
Noncontrolling Interests The company had noncontrolling interests of $839 million at December 31, 2024, and $972 million at December 31, 2023. Distributions to noncontrolling interests net of contributions totaled $195 million and $40 million in 2024 and 2023, respectively.
Pension Obligations Information related to pension plan contributions is included in Note 23 Employee Benefit Plans, under the heading “Cash Contributions and Benefit Payments.”
Contractual Obligations Information related to the company’s significant contractual obligations is included in Note 19 Short-Term Debt, in Note 20 Long-Term Debt and in Note 5 Lease Commitments. The aggregate amount of interest due on these obligations, excluding leases, is: 2025 – $747; 2026 – $666; 2027 – $605; 2028 – $566; 2029 – $562; after 2029 – $4,355.
Long-Term Unconditional Purchase Obligations and Commitments, Including Throughput and Take-or-Pay Agreements Information related to these off-balance sheet matters is included in Note 24 Other Contingencies and Commitments, under the heading “Long-Term Unconditional Purchase Obligations and Commitments, Including Throughput and Take-or-Pay Agreements.”
Direct Guarantees Information related to guarantees is included in Note 24 Other Contingencies and Commitments under the heading “Guarantees.”
Indemnifications Information related to indemnifications is included in Note 24 Other Contingencies and Commitments under the heading “Indemnifications.”
| Management’s Discussion and Analysis of Financial Condition and Results of Operations | Financial Table of Contents |
Financial Ratios and Metrics
The following represent several metrics the company believes are useful measures to monitor the financial health of the company and its performance over time:
Current Ratio Current assets divided by current liabilities, which indicates the company’s ability to repay its short-term liabilities with short-term assets. The current ratio in all periods is adversely affected by the fact that Chevron’s inventories are valued on a last-in, first-out basis. At year-end 2024, the book value of inventory was lower than replacement costs, based on average acquisition costs during the year, by approximately $6.0 billion.
| At December 31 | |||||||||||||||||||||||||||||
| Millions of dollars | 2024 | 2023 | 2022 | ||||||||||||||||||||||||||
| Current assets | $ | 40,911 | $ | 41,128 | $ | 50,343 | |||||||||||||||||||||||
| Current liabilities | 38,558 | 32,258 | 34,208 | ||||||||||||||||||||||||||
| Current Ratio | 1.1 | 1.3 | 1.5 |
Interest Coverage Ratio Income before income tax expense, plus interest and debt expense and amortization of capitalized interest, less net income attributable to noncontrolling interests, divided by before-tax interest costs. This ratio indicates the company’s ability to pay interest on outstanding debt.
| Year ended December 31 | |||||||||||||||||||||||||||||
| Millions of dollars | 2024 | 2023 | 2022 | ||||||||||||||||||||||||||
| Income (Loss) Before Income Tax Expense | $ | 27,506 | $ | 29,584 | $ | 49,674 | |||||||||||||||||||||||
| Plus: Interest and debt expense | 594 | 469 | 516 | ||||||||||||||||||||||||||
| Plus: Before-tax amortization of capitalized interest | 214 | 223 | 199 | ||||||||||||||||||||||||||
| Less: Net income attributable to noncontrolling interests | 88 | 42 | 143 | ||||||||||||||||||||||||||
| Subtotal for calculation | 28,226 | 30,234 | 50,246 | ||||||||||||||||||||||||||
| Total financing interest and debt costs | $ | 773 | $ | 617 | $ | 630 | |||||||||||||||||||||||
| Interest Coverage Ratio | 36.5 | 49.0 | 79.8 |
Free Cash Flow The cash provided by operating activities less capital expenditures, which represents the cash available to creditors and investors after investing in the business.
| Year ended December 31 | ||||||||||||||||||||||||||
| Millions of dollars | 2024 | 2023 | 2022 | |||||||||||||||||||||||
| Net cash provided by operating activities | $ | 31,492 | $ | 35,609 | $ | 49,602 | ||||||||||||||||||||
| Less: Capital expenditures | 16,448 | 15,829 | 11,974 | |||||||||||||||||||||||
| Free Cash Flow | $ | 15,044 | $ | 19,780 | $ | 37,628 |
Debt Ratio Total debt as a percentage of total debt plus Chevron Corporation Stockholders’ Equity, which indicates the company’s leverage.
| At December 31 | |||||||||||||||||||||||||||||
| Millions of dollars | 2024 | 2023 | 2022 | ||||||||||||||||||||||||||
| Short-term debt | $ | 4,406 | $ | 529 | $ | 1,964 | |||||||||||||||||||||||
| Long-term debt | 20,135 | 20,307 | 21,375 | ||||||||||||||||||||||||||
| Total debt | 24,541 | 20,836 | 23,339 | ||||||||||||||||||||||||||
| Total Chevron Corporation Stockholders’ Equity | 152,318 | 160,957 | 159,282 | ||||||||||||||||||||||||||
| Total debt plus total Chevron Corporation Stockholders’ Equity | $ | 176,859 | $ | 181,793 | $ | 182,621 | |||||||||||||||||||||||
| Debt Ratio | 13.9 | % | 11.5 | % | 12.8 | % |
| Management’s Discussion and Analysis of Financial Condition and Results of Operations | Financial Table of Contents |
Net Debt Ratio Total debt less cash and cash equivalents, time deposits and marketable securities as a percentage of total debt less cash and cash equivalents, time deposits and marketable securities, plus Chevron Corporation Stockholders’ Equity, which indicates the company’s leverage, net of its cash balances.
| At December 31 | ||||||||||||||||||||||||||
| Millions of dollars | 2024 | 2023 | 2022 | |||||||||||||||||||||||
| Short-term debt | $ | 4,406 | $ | 529 | $ | 1,964 | ||||||||||||||||||||
| Long-term debt | 20,135 | 20,307 | 21,375 | |||||||||||||||||||||||
| Total Debt | 24,541 | 20,836 | 23,339 | |||||||||||||||||||||||
| Less: Cash and cash equivalents | 6,781 | 8,178 | 17,678 | |||||||||||||||||||||||
| Less: Time deposits | 4 | — | — | |||||||||||||||||||||||
| Less: Marketable securities | — | 45 | 223 | |||||||||||||||||||||||
| Total adjusted debt | 17,756 | 12,613 | 5,438 | |||||||||||||||||||||||
| Total Chevron Corporation Stockholders’ Equity | 152,318 | 160,957 | 159,282 | |||||||||||||||||||||||
| Total adjusted debt plus total Chevron Corporation Stockholders’ Equity | $ | 170,074 | $ | 173,570 | $ | 164,720 | ||||||||||||||||||||
| Net Debt Ratio | 10.4 | % | 7.3 | % | 3.3 | % |
Capital Employed The sum of Chevron Corporation Stockholders’ Equity, total debt and noncontrolling interests, which represents the net investment in the business.
| At December 31 | ||||||||||||||||||||||||||
| Millions of dollars | 2024 | 2023 | 2022 | |||||||||||||||||||||||
| Chevron Corporation Stockholders’ Equity | $ | 152,318 | $ | 160,957 | $ | 159,282 | ||||||||||||||||||||
| Plus: Short-term debt | 4,406 | 529 | 1,964 | |||||||||||||||||||||||
| Plus: Long-term debt | 20,135 | 20,307 | 21,375 | |||||||||||||||||||||||
| Plus: Noncontrolling interest | 839 | 972 | 960 | |||||||||||||||||||||||
| Capital Employed at December 31 | $ | 177,698 | $ | 182,765 | $ | 183,581 |
Return on Average Capital Employed (ROCE) Net income attributable to Chevron (adjusted for after-tax interest expense and noncontrolling interest) divided by average capital employed. Average capital employed is computed by averaging the sum of capital employed at the beginning and end of the year. ROCE is a ratio intended to measure annual earnings as a percentage of historical investments in the business.
| Year ended December 31 | ||||||||||||||||||||||||||
| Millions of dollars | 2024 | 2023 | 2022 | |||||||||||||||||||||||
| Net income attributable to Chevron | $ | 17,661 | $ | 21,369 | $ | 35,465 | ||||||||||||||||||||
| Plus: After-tax interest and debt expense | 539 | 432 | 476 | |||||||||||||||||||||||
| Plus: Noncontrolling interest | 88 | 42 | 143 | |||||||||||||||||||||||
| Net income after adjustments | 18,288 | 21,843 | 36,084 | |||||||||||||||||||||||
| Average capital employed | $ | 180,232 | $ | 183,173 | $ | 177,445 | ||||||||||||||||||||
| Return on Average Capital Employed | 10.1 | % | 11.9 | % | 20.3 | % |
Return on Stockholders’ Equity (ROSE) Net income attributable to Chevron divided by average Chevron Corporation Stockholders’ Equity. Average stockholders’ equity is computed by averaging the sum of stockholders’ equity at the beginning and end of the year. ROSE is a ratio intended to measure earnings as a percentage of shareholder investments.
| Year ended December 31 | ||||||||||||||||||||||||||
| Millions of dollars | 2024 | 2023 | 2022 | |||||||||||||||||||||||
| Net income attributable to Chevron | $ | 17,661 | $ | 21,369 | $ | 35,465 | ||||||||||||||||||||
| Chevron Corporation Stockholders’ Equity at December 31 | 152,318 | 160,957 | 159,282 | |||||||||||||||||||||||
| Average Chevron Corporation Stockholders’ Equity | 156,638 | 160,120 | 149,175 | |||||||||||||||||||||||
| Return on Average Stockholders’ Equity | 11.3 | % | 13.3 | % | 23.8 | % |
Financial and Derivative Instrument Market Risk
The market risk associated with the company’s portfolio of financial and derivative instruments is discussed below. The estimates of financial exposure to market risk do not represent the company’s projection of future market changes. The actual impact of future market changes could differ materially due to factors discussed elsewhere in this report, including those set forth under the heading Item 1A. Risk Factors.
| Management’s Discussion and Analysis of Financial Condition and Results of Operations | Financial Table of Contents |
Derivative Commodity Instruments Chevron is exposed to market risks related to the price volatility of crude oil, refined products, NGLs, natural gas, liquefied natural gas and refinery feedstocks. The company uses derivative commodity instruments to manage these exposures on a portion of its activity, including firm commitments and anticipated transactions for the purchase, sale and storage of crude oil, refined products, NGLs, natural gas, liquefied natural gas and feedstock for company refineries. The company also uses derivative commodity instruments for limited trading purposes. The results of these activities were not material to the company’s financial position, results of operations or cash flows in 2024.
The company’s market exposure positions are monitored on a daily basis by an internal Risk Control group in accordance with the company’s risk management policies. The company’s risk management practices and its compliance with policies are reviewed by the Audit Committee of the company’s Board of Directors.
Derivatives beyond those designated as normal purchase and normal sale contracts are recorded at fair value on the Consolidated Balance Sheet with resulting gains and losses reflected in income. Fair values are derived principally from published market quotes and other independent third-party quotes. The change in fair value of Chevron’s derivative commodity instruments in 2024 was not material to the company’s results of operations.
The company uses the Monte Carlo simulation method as its Value-at-Risk (VaR) model to estimate the maximum potential loss in fair value, at the 95 percent confidence level with a one-day holding period, from the effect of adverse changes in market conditions on derivative commodity instruments held or issued. Based on these inputs, the VaR for the company’s primary risk exposures in the area of derivative commodity instruments at December 31, 2024 and 2023 was not material to the company’s cash flows or results of operations.
Foreign Currency The company may enter into foreign currency derivative contracts to manage some of its foreign currency exposures. These exposures include revenue and anticipated purchase transactions, including foreign currency capital expenditures and lease commitments. The foreign currency derivative contracts, if any, are recorded at fair value on the balance sheet with resulting gains and losses reflected in income. There were no open foreign currency derivative contracts at December 31, 2024.
Interest Rates The company may enter into interest rate swaps from time to time as part of its overall strategy to manage the interest rate risk on its debt. Interest rate swaps, if any, are recorded at fair value on the balance sheet with resulting gains and losses reflected in income. At year-end 2024, the company had no interest rate swaps.
Transactions With Related Parties
Chevron enters into a number of business arrangements with related parties, principally its equity affiliates. These arrangements include long-term supply or offtake agreements and long-term purchase agreements. Refer to “Other Information” in Note 15 Investments and Advances for further discussion. Management believes these agreements have been negotiated on terms consistent with those that would have been negotiated with an unrelated party.
Litigation and Other Contingencies
Climate Change Information related to climate change-related matters is included in Note 16 Litigation under the heading “Climate Change.”
Louisiana Information related to Louisiana coastal matters is included in Note 16 Litigation under the heading “Louisiana.”
Environmental The following table displays the annual changes to the company’s before-tax environmental remediation reserves, including those for U.S. federal Superfund sites and analogous sites under state laws.
| Millions of dollars | 2024 | 2023 | 2022 | ||||||||||||||
| Balance at January 1 | $ | 936 | $ | 868 | $ | 960 | |||||||||||
| Net additions | 264 | 327 | 182 | ||||||||||||||
| Expenditures | (255) | (259) | (274) | ||||||||||||||
| Balance at December 31 | $ | 945 | $ | 936 | $ | 868 |
The company records asset retirement obligations when there is a legal obligation associated with the retirement of long-lived assets and the liability can be reasonably estimated. These asset retirement obligations include costs related to environmental issues. The liability balance of approximately $12.7 billion for asset retirement obligations at year-end 2024 is related primarily to upstream properties.
| Management’s Discussion and Analysis of Financial Condition and Results of Operations | Financial Table of Contents |
For the company’s other ongoing operating assets, such as refineries and chemicals facilities, no provisions are made for exit or cleanup costs that may be required when such assets reach the end of their useful lives unless a decision to sell or otherwise decommission the facility has been made, as the indeterminate settlement dates for the asset retirements prevent estimation of the fair value of the asset retirement obligation.
The company records decommissioning obligations for previously divested assets when it is probable that the decommissioning obligations would revert to the Company and costs can be reasonably estimated. At the end of 2024, the liability balance was $2.5 billion. Refer to Note 24 Other Contingencies and Commitments for additional discussion of decommissioning obligations for previously divested assets.
Refer to the discussion below for additional information on environmental matters and their impact on Chevron, and on the company’s 2024 environmental expenditures. Refer to Note 24 Other Contingencies and Commitments for additional discussion of environmental remediation provisions. Refer also to Note 25 Asset Retirement Obligations for additional discussion of the company’s asset retirement obligations.
Suspended Wells Information related to suspended wells is included in Note 21 Accounting for Suspended Exploratory Wells.
Income Taxes Information related to income tax contingencies is included in Note 17 Taxes and in Note 24 Other Contingencies and Commitments under the heading “Income Taxes.”
Other Contingencies Information related to other contingencies is included in Note 24 Other Contingencies and Commitments under the heading “Other Contingencies.”
Environmental Matters
The company is subject to various international and U.S. federal, state and local environmental, health and safety laws, regulations and market-based programs. These laws, regulations and programs continue to evolve and are expected to increase in both number and complexity over time and govern not only the manner in which the company conducts its operations, but also the products it sells. Consideration of environmental issues and the responses to those issues through international agreements and national, regional or state legislation or regulations are integrated into the company’s strategy and planning, capital investment reviews and risk management tools and processes, where applicable. They are also factored into the company’s long-range supply, demand and energy price forecasts. These forecasts reflect long-range effects from electric vehicle and renewable fuel penetration, energy efficiency standards, climate-related policy actions, and demand response to oil and natural gas prices. In addition, legislation and regulations intended to address hydraulic fracturing also continue to evolve in many jurisdictions where we operate. Refer to Item 1A. Risk Factors for a discussion of some of the inherent risks of increasingly restrictive environmental and other regulation that could materially impact the company’s results of operations or financial condition. Refer to Business Environment and Outlook on pages 35 through 37 for a discussion of legislative and regulatory efforts to address climate change.
Most of the costs of complying with existing laws and regulations pertaining to company operations and products are embedded in the normal costs of doing business. However, it is not possible to predict with certainty the amount of additional investments in new or existing technology or facilities or the amounts of increased operating costs to be incurred in the future to prevent, control, reduce or eliminate releases of hazardous materials or other pollutants into the environment; remediate and restore areas damaged by prior releases of hazardous materials; or comply with new environmental laws or regulations. Although these costs may be significant to the results of operations in any single period, the company does not presently expect them to have a material adverse effect on the company’s liquidity or financial position.
Accidental leaks and spills requiring cleanup may occur in the ordinary course of business. The company may incur expenses for corrective actions at various owned and previously owned facilities and at third-party-owned waste disposal sites used by the company. An obligation may arise when operations are closed or sold or at non-Chevron sites where company products have been handled or disposed of. Most of the expenditures to fulfill these obligations relate to facilities and sites where past operations followed practices and procedures that were considered acceptable at the time but now require investigative or remedial work or both to meet current standards.
Using definitions and guidelines established by the American Petroleum Institute, Chevron estimated its worldwide environmental spending in 2024 at approximately $2.5 billion for its consolidated companies. Included in these expenditures were approximately $0.6 billion of environmental capital expenditures and $1.9 billion of costs associated
| Management’s Discussion and Analysis of Financial Condition and Results of Operations | Financial Table of Contents |
with the prevention, control, abatement or elimination of hazardous substances and pollutants from operating, closed or divested sites, and the decommissioning and restoration of sites.
For 2025, total worldwide environmental capital expenditures are estimated at $0.6 billion. These capital costs are in addition to the ongoing costs of complying with environmental regulations and the costs to remediate previously contaminated sites.
Critical Accounting Estimates and Assumptions
Management makes many estimates and assumptions in the application of accounting principles generally accepted in the United States of America (GAAP) that may have a material impact on the company’s consolidated financial statements and related disclosures and on the comparability of such information over different reporting periods. Such estimates and assumptions affect reported amounts of assets, liabilities, revenues and expenses, as well as disclosures of contingent assets and liabilities. Estimates and assumptions are based on management’s experience and other information available prior to the issuance of the financial statements. Materially different results can occur as circumstances change and additional information becomes known.
The discussion in this section of “critical” accounting estimates and assumptions is according to the disclosure guidelines of the SEC, wherein:
1.the nature of the estimates and assumptions is material due to the levels of subjectivity and judgment necessary to account for highly uncertain matters, or the susceptibility of such matters to change; and
2.the impact of the estimates and assumptions on the company’s financial condition or operating performance is material.
The development and selection of accounting estimates and assumptions, including those deemed “critical,” and the associated disclosures in this discussion have been discussed with the Audit Committee of the Board of Directors. The areas of accounting and the associated “critical” estimates and assumptions made by the company are as follows:
Oil and Gas Reserves Crude oil, NGLs and natural gas reserves are estimates of future production that impact certain asset and expense accounts included in the Consolidated Financial Statements. Proved reserves are the estimated quantities of oil and gas that geoscience and engineering data demonstrate with reasonable certainty to be economically producible in the future under existing economic conditions, operating methods and government regulations. Proved reserves include both developed and undeveloped volumes. Proved developed reserves represent volumes expected to be recovered through existing wells with existing equipment and operating methods. Proved undeveloped reserves are volumes expected to be recovered from new wells on undrilled proved acreage, or from existing wells where a relatively major expenditure is required for recompletion. Variables impacting Chevron’s estimated volumes of crude oil, NGLs and natural gas reserves include field performance, available technology, commodity prices, and development, production and carbon costs.
The estimates of crude oil, NGLs and natural gas reserves are important to the timing of expense recognition for costs incurred and to the valuation of certain oil and gas producing assets. Impacts of oil and gas reserves on Chevron’s Consolidated Financial Statements, using the successful efforts method of accounting, include the following:
1.Depreciation, Depletion and Amortization (DD&A) - Capitalized exploratory drilling and development costs are depreciated on a unit-of-production (UOP) basis using proved developed reserves. Acquisition costs of proved properties are amortized on a UOP basis using total proved reserves. During 2024, Chevron’s UOP DD&A for oil and gas properties was $13.0 billion, and proved developed reserves at the beginning of 2024 were 6.8 billion barrels for consolidated companies. If the estimates of proved reserves used in the UOP calculations for consolidated operations had been lower by five percent across all oil and gas properties, UOP DD&A in 2024 would have increased by approximately $700 million.
2.Impairment - Oil and gas reserves are used in assessing oil and gas producing properties for impairment. A significant reduction in the estimated reserves of a property would trigger an impairment review. Proved reserves (and, in some cases, a portion of unproved resources) are used to estimate future production volumes in the cash flow model. For a further discussion of estimates and assumptions used in impairment assessments, see Impairment of Properties, Plant and Equipment and Investments in Affiliates below.
Refer to Table V, “Proved Reserve Quantity Information,” for the changes in proved reserve estimates for each of the three years ended December 31, 2022, 2023 and 2024, and to Table VII, “Changes in the Standardized Measure of Discounted Future Net Cash Flows From Proved Reserves” for estimates of proved reserve values for each of the three years ended December 31, 2022, 2023 and 2024.
| Management’s Discussion and Analysis of Financial Condition and Results of Operations | Financial Table of Contents |
This Oil and Gas Reserves commentary should be read in conjunction with the Properties, Plant and Equipment section of Note 1 Summary of Significant Accounting Policies, which includes a description of the “successful efforts” method of accounting for oil and gas exploration and production activities.
Impairment of Properties, Plant and Equipment and Investments in Affiliates The company assesses its properties, plant and equipment (PP&E) for possible impairment whenever events or changes in circumstances indicate that the carrying value of the assets may not be recoverable. If the carrying value of an asset exceeds the future undiscounted cash flows expected from the asset, an impairment charge is recorded for the excess of the carrying value of the asset over its estimated fair value.
Determination as to whether and how much an asset is impaired involves management estimates on highly uncertain matters, such as future commodity prices, operating expenses, carbon costs, production profiles, the pace of the energy transition, and the outlook for global or regional market supply-and-demand conditions for crude oil, NGLs, natural gas, commodity chemicals and refined products. However, the impairment reviews and calculations are based on assumptions that are generally consistent with the company’s business plans and long-term investment decisions. Refer also to the discussion of impairments of properties, plant and equipment in Note 18 Properties, Plant and Equipment and to the section on Properties, Plant and Equipment in Note 1 Summary of Significant Accounting Policies.
The company performs impairment assessments when triggering events arise to determine whether any write-down in the carrying value of an asset or asset group is required. For example, when significant downward revisions to crude oil, NGLs and natural gas reserves are made for any single field or concession, an impairment review is performed to determine if the carrying value of the asset remains recoverable. Similarly, a significant downward revision in the company’s crude oil, NGLs or natural gas price outlook would trigger impairment reviews for impacted upstream assets. In addition, impairments could occur due to changes in national, state or local environmental regulations or laws, including those designed to stop or impede the development or production of oil and gas. Also, if the expectation of sale of a particular asset or asset group in any period has been deemed more likely than not, an impairment review is performed, and if the estimated future undiscounted cash flows exceed the carrying value of the asset or asset group, no impairment charge is required. Such calculations are reviewed each period until the asset or asset group is disposed. Assets that are not impaired on a held-and-used basis could possibly become impaired if a decision is made to sell such assets. That is, the assets would be impaired if they are classified as held-for-sale and the estimated proceeds from the sale, less costs to sell, are less than the assets’ associated carrying values.
Investments in common stock of affiliates that are accounted for under the equity method, as well as investments in other securities of these equity investees, are reviewed for impairment when the fair value of the investment falls below the company’s carrying value. When this occurs, a determination must be made as to whether this loss is other-than-temporary, in which case the investment is impaired. Because of the number of differing assumptions potentially affecting whether an investment is impaired in any period or the amount of the impairment, a sensitivity analysis is not practicable.
A sensitivity analysis of the impact on earnings for these periods if other assumptions had been used in impairment reviews and impairment calculations is not practicable, given the broad range of the company’s PP&E and the number of assumptions involved in the estimates. That is, favorable changes to some assumptions might have avoided the need to impair any assets in these periods, whereas unfavorable changes might have caused an additional unknown number of other assets to become impaired, or resulted in larger impacts on impaired assets.
Asset Retirement Obligations In the determination of fair value for an asset retirement obligation (ARO), the company uses various assumptions and judgments, including such factors as the existence of a legal obligation, estimated amounts and timing of settlements, discount and inflation rates, and the expected impact of advances in technology and process improvements. A sensitivity analysis of the ARO impact on earnings for 2024 is not practicable, given the broad range of the company’s long-lived assets and the number of assumptions involved in the estimates. That is, favorable changes to some assumptions would have reduced estimated future obligations, thereby lowering accretion expense and amortization costs, whereas unfavorable changes would have the opposite effect. Refer to Note 25 Asset Retirement Obligations for additional discussions on asset retirement obligations.
Pension and Other Post-Employment Benefit Plans Note 23 Employee Benefit Plans includes information on the funded status of the company’s pension and other post-employment benefit (OPEB) plans reflected on the Consolidated Balance Sheet; the components of pension and OPEB expense reflected on the Consolidated Statement of Income; and the related underlying assumptions.
| Management’s Discussion and Analysis of Financial Condition and Results of Operations | Financial Table of Contents |
The determination of pension plan expense and obligations is based on a number of actuarial assumptions. Two critical assumptions are the expected long-term rate of return on plan assets and the discount rate applied to pension plan obligations. Critical assumptions in determining expense and obligations for OPEB plans, which provide for certain health care and life insurance benefits for qualifying retired employees and which are not funded, are the discount rate and the assumed health care cost-trend rates. Information related to the company’s processes to develop these assumptions is included in Note 23 Employee Benefit Plans under the relevant headings. Actual rates may vary significantly from estimates because of unanticipated changes beyond the company’s control.
For 2024, the company used an expected long-term rate of return of 7.0 percent and a discount rate for service costs of 5.0 percent and a discount rate for interest cost of 4.8 percent for the primary U.S. pension plan. The actual return for 2024 was 3.6 percent. For the 10 years ended December 31, 2024, actual asset returns averaged 4.9 percent for this plan. Additionally, with the exception of four years within this 10-year period, actual asset returns for this plan equaled or exceeded 7.0 percent during each year.
Total pension expense for 2024 was $551 million. An increase in the expected long-term return on plan assets or the discount rate would reduce pension plan expense, and vice versa. As an indication of the sensitivity of pension expense to the long-term rate of return assumption, a one percent increase in this assumption for the company’s primary U.S. pension plan, which accounted for about 63 percent of companywide pension expense, would have reduced total pension plan expense for 2024 by approximately $84 million. A one percent increase in the discount rates for this same plan would have reduced pension expense for 2024 by approximately $106 million.
The aggregate funded status recognized at December 31, 2024, was a net liability of approximately $0.8 billion. An increase in the discount rate would decrease the pension obligation, thus changing the funded status of a plan. At December 31, 2024, the company used a discount rate of 5.7 percent to measure the obligations for the primary U.S. pension plan. As an indication of the sensitivity of pension liabilities to the discount rate assumption, a 0.25 percent increase in the discount rate applied to the company’s primary U.S. pension plan, which accounted for about 66 percent of the companywide pension obligation, would have reduced the plan obligation by approximately $261 million, and would have increased the plan’s surplus from $573 million to $834 million.
For the company’s OPEB plans, expense for 2024 was $91 million, and the total liability, all unfunded at the end of 2024, was $1.9 billion. For the primary U.S. OPEB plan, the company used a discount rate for service cost of 5.1 percent and a discount rate for interest cost of 4.9 percent to measure expense in 2024, and a 5.6 percent discount rate to measure the benefit obligations at December 31, 2024. Discount rate changes, similar to those used in the pension sensitivity analysis, resulted in an immaterial impact on 2024 OPEB expense and OPEB liabilities at the end of 2024.
Differences between the various assumptions used to determine expense and the funded status of each plan and actual experience are included in actuarial gain/loss. Refer to page 95 in Note 23 Employee Benefit Plans for more information on the $3.2 billion of before-tax actuarial losses recorded by the company as of December 31, 2024. In addition, information related to company contributions is included on page 98 in Note 23 Employee Benefit Plans under the heading “Cash Contributions and Benefit Payments.”
Contingent Losses Management also makes judgments and estimates in recording liabilities for claims, litigation, tax matters, transferred liabilities from previously divested assets, and environmental remediation. Actual costs can frequently vary from estimates for a variety of reasons. For example, the costs for settlement of claims and litigation can vary from estimates based on differing interpretations of laws, opinions on culpability and assessments on the amount of damages. The costs for decommissioning obligations for previously divested assets can also vary from estimates. Recording of liabilities for such costs typically requires judgment to assess the likelihood of decommissioning obligations reverting to the company, the timing of decommissioning activity, regulatory requirements and the scope of decommissioning activities. Similarly, liabilities for environmental remediation are subject to change because of changes in laws, regulations and their interpretation, the determination of additional information on the extent and nature of site contamination, and improvements in technology.
Under the accounting rules, a liability is generally recorded for these types of contingencies if management determines the loss to be both probable and estimable. The company generally reports these losses as “Operating expenses,” “Selling, general and administrative expenses” or “Other income (loss)” on the Consolidated Statement of Income. An exception to this handling is for income tax matters, for which benefits are recognized only if management determines the tax position is more likely than not (i.e., likelihood greater than 50 percent) to be allowed by the tax jurisdiction. For additional discussion of income tax uncertainties, refer to Note 24 Other Contingencies and Commitments under the heading “Income Taxes.”
| Management’s Discussion and Analysis of Financial Condition and Results of Operations | Financial Table of Contents |
Refer also to the business segment discussions elsewhere in this section for the effect on earnings from losses associated with certain litigation, environmental remediation and tax matters for the three years ended December 31, 2024.
An estimate as to the sensitivity to earnings for these periods if other assumptions had been used in recording these liabilities is not practicable because of the number of contingencies that must be assessed, the number of underlying assumptions and the wide range of reasonably possible outcomes, both in terms of the probability of loss and the estimates of such loss. For further information, refer to “Changes in management’s estimates and assumptions may have a material impact on the company’s consolidated financial statements and financial or operational performance in any given period” in Item 1A. Risk Factors, on page 27.
New Accounting Standards
Refer to Note 4 New Accounting Standards for information regarding new accounting standards.
| Financial Table of Contents |
Quarterly Results
Unaudited
| 2024 | 2023 | ||||||||||||||||||||||||||||||||||||||||||||||
| Millions of dollars, except per-share amounts | 4th Q | 3rd Q | 2nd Q | 1st Q | 4th Q | 3rd Q | 2nd Q | 1st Q | |||||||||||||||||||||||||||||||||||||||
| Revenues and Other Income | |||||||||||||||||||||||||||||||||||||||||||||||
| Sales and other operating revenues | $ | 48,334 | $ | 48,926 | $ | 49,574 | $ | 46,580 | $ | 48,933 | $ | 51,922 | $ | 47,216 | $ | 48,842 | |||||||||||||||||||||||||||||||
| Income from equity affiliates | 688 | 1,261 | 1,206 | 1,441 | 990 | 1,313 | 1,240 | 1,588 | |||||||||||||||||||||||||||||||||||||||
| Other income (loss) | 3,204 | 482 | 401 | 695 | (2,743) | 845 | 440 | 363 | |||||||||||||||||||||||||||||||||||||||
| Total Revenues and Other Income | 52,226 | 50,669 | 51,181 | 48,716 | 47,180 | 54,080 | 48,896 | 50,793 | |||||||||||||||||||||||||||||||||||||||
| Costs and Other Deductions | |||||||||||||||||||||||||||||||||||||||||||||||
| Purchased crude oil and products | 30,148 | 30,450 | 30,867 | 27,741 | 28,477 | 32,328 | 28,984 | 29,407 | |||||||||||||||||||||||||||||||||||||||
| Operating expenses | 7,622 | 6,695 | 6,614 | 6,533 | 6,510 | 6,299 | 6,057 | 6,021 | |||||||||||||||||||||||||||||||||||||||
| Selling, general and administrative expenses | 1,585 | 1,191 | 1,048 | 1,010 | 969 | 1,163 | 1,128 | 881 | |||||||||||||||||||||||||||||||||||||||
| Exploration expenses | 449 | 154 | 263 | 129 | 254 | 301 | 169 | 190 | |||||||||||||||||||||||||||||||||||||||
| Depreciation, depletion and amortization | 4,973 | 4,214 | 4,004 | 4,091 | 6,254 | 4,025 | 3,521 | 3,526 | |||||||||||||||||||||||||||||||||||||||
| Taxes other than on income | 1,141 | 1,263 | 1,188 | 1,124 | 1,062 | 1,021 | 1,041 | 1,096 | |||||||||||||||||||||||||||||||||||||||
| Interest and debt expense | 199 | 164 | 113 | 118 | 120 | 114 | 120 | 115 | |||||||||||||||||||||||||||||||||||||||
| Other components of net periodic benefit costs | 50 | 49 | 48 | 48 | 44 | 91 | 39 | 38 | |||||||||||||||||||||||||||||||||||||||
| Total Costs and Other Deductions | 46,167 | 44,180 | 44,145 | 40,794 | 43,690 | 45,342 | 41,059 | 41,274 | |||||||||||||||||||||||||||||||||||||||
| Income (Loss) Before Income Tax Expense | 6,059 | 6,489 | 7,036 | 7,922 | 3,490 | 8,738 | 7,837 | 9,519 | |||||||||||||||||||||||||||||||||||||||
| Income Tax Expense (Benefit) | 2,800 | 1,993 | 2,593 | 2,371 | 1,247 | 2,183 | 1,829 | 2,914 | |||||||||||||||||||||||||||||||||||||||
| Net Income (Loss) | $ | 3,259 | $ | 4,496 | $ | 4,443 | $ | 5,551 | $ | 2,243 | $ | 6,555 | $ | 6,008 | $ | 6,605 | |||||||||||||||||||||||||||||||
| Less: Net income (loss) attributable to noncontrolling interests | 20 | 9 | 9 | 50 | (16) | 29 | (2) | 31 | |||||||||||||||||||||||||||||||||||||||
| Net Income (Loss) Attributable to Chevron Corporation | $ | 3,239 | $ | 4,487 | $ | 4,434 | $ | 5,501 | $ | 2,259 | $ | 6,526 | $ | 6,010 | $ | 6,574 | |||||||||||||||||||||||||||||||
| Per Share of Common Stock | |||||||||||||||||||||||||||||||||||||||||||||||
| Net Income (Loss) Attributable to Chevron Corporation | |||||||||||||||||||||||||||||||||||||||||||||||
| – Basic | $ | 1.85 | $ | 2.49 | $ | 2.43 | $ | 2.99 | $ | 1.23 | $ | 3.48 | $ | 3.22 | $ | 3.48 | |||||||||||||||||||||||||||||||
| – Diluted | $ | 1.84 | $ | 2.48 | $ | 2.43 | $ | 2.97 | $ | 1.22 | $ | 3.48 | $ | 3.20 | $ | 3.46 | |||||||||||||||||||||||||||||||
| Dividends per share | $ | 1.63 | $ | 1.63 | $ | 1.63 | $ | 1.63 | $ | 1.51 | $ | 1.51 | $ | 1.51 | $ | 1.51 | |||||||||||||||||||||||||||||||
| Financial Table of Contents |
| Management’s Responsibility for Financial Statements | ||||||||||||||||||||
| To the Stockholders of Chevron Corporation Management of Chevron Corporation is responsible for preparing the accompanying consolidated financial statements and the related information appearing in this report. The statements were prepared in accordance with accounting principles generally accepted in the United States of America and fairly represent the transactions and financial position of the company. The financial statements include amounts that are based on management’s best estimates and judgments. As stated in its report included herein, the independent registered public accounting firm of PricewaterhouseCoopers LLP has audited the company’s consolidated financial statements in accordance with the standards of the Public Company Accounting Oversight Board (United States). The Board of Directors of Chevron has an Audit Committee composed of directors who are not officers or employees of the company. The Audit Committee meets regularly with members of management, the internal auditors and the independent registered public accounting firm to review accounting, internal control, auditing and financial reporting matters. Both the internal auditors and the independent registered public accounting firm have free and direct access to the Audit Committee without the presence of management. The company’s management has evaluated, with the participation of the Chief Executive Officer and Chief Financial Officer, the effectiveness of the company’s disclosure controls and procedures (as defined in the Exchange Act Rules 13a-15(e) and 15d-15(e)) as of December 31, 2024. Based on that evaluation, management concluded that the company’s disclosure controls are effective in ensuring that information required to be recorded, processed, summarized and reported are done within the time periods specified in the U.S. Securities and Exchange Commission’s rules and forms. | ||||||||||||||||||||
| Management’s Report on Internal Control Over Financial Reporting | ||||||||||||||||||||
| The company’s management is responsible for establishing and maintaining adequate internal control over financial reporting, as defined in the Exchange Act Rules 13a-15(f) and 15d-15(f). The company’s management, including the Chief Executive Officer and Chief Financial Officer, conducted an evaluation of the effectiveness of the company’s internal control over financial reporting based on the Internal Control – Integrated Framework (2013) issued by the Committee of Sponsoring Organizations of the Treadway Commission (COSO). Based on the results of this evaluation, the company’s management concluded that internal control over financial reporting was effective as of December 31, 2024. The effectiveness of the company’s internal control over financial reporting as of December 31, 2024, has been audited by PricewaterhouseCoopers LLP, an independent registered public accounting firm, as stated in its report included herein. | ||||||||||||||||||||
| /s/ MICHAEL K. WIRTH | /s/ EIMEAR P. BONNER | /s/ ALANA K. KNOWLES | ||||||||||||||||||
| Michael K. Wirth | Eimear P. Bonner | Alana K. Knowles | ||||||||||||||||||
| Chairman of the Board | Vice President | Vice President | ||||||||||||||||||
| and Chief Executive Officer | and Chief Financial Officer | and Controller | ||||||||||||||||||
| February 21, 2025 | ||||||||||||||||||||
| Financial Table of Contents |
| Report of Independent Registered Public Accounting Firm | ||||||||
| To the Board of Directors and Stockholders of Chevron Corporation | ||||||||
| Opinions on the Financial Statements and Internal Control over Financial Reporting | ||||||||
| We have audited the accompanying consolidated balance sheet of Chevron Corporation and its subsidiaries (the “Company”) as of December 31, 2024 and 2023, and the related consolidated statements of income, of comprehensive income, of equity and of cash flows for each of the three years in the period ended December 31, 2024, including the related notes and financial statement schedule listed in the index appearing under Item 15(a)(2) (collectively referred to as the “consolidated financial statements”). We also have audited the Company's internal control over financial reporting as of December 31, 2024, based on criteria established in Internal Control - Integrated Framework (2013) issued by the Committee of Sponsoring Organizations of the Treadway Commission (COSO). | ||||||||
| In our opinion, the consolidated financial statements referred to above present fairly, in all material respects, the financial position of the Company as of December 31, 2024 and 2023, and the results of its operations and its cash flows for each of the three years in the period ended December 31, 2024 in conformity with accounting principles generally accepted in the United States of America. Also in our opinion, the Company maintained, in all material respects, effective internal control over financial reporting as of December 31, 2024, based on criteria established in Internal Control - Integrated Framework (2013) issued by the COSO. | ||||||||
| Basis for Opinions The Company's management is responsible for these consolidated financial statements, for maintaining effective internal control over financial reporting, and for its assessment of the effectiveness of internal control over financial reporting, included in the accompanying Management’s Report on Internal Control Over Financial Reporting. Our responsibility is to express opinions on the Company’s consolidated financial statements and on the Company's internal control over financial reporting based on our audits. We are a public accounting firm registered with the Public Company Accounting Oversight Board (United States) (PCAOB) and are required to be independent with respect to the Company in accordance with the U.S. federal securities laws and the applicable rules and regulations of the Securities and Exchange Commission and the PCAOB. We conducted our audits in accordance with the standards of the PCAOB. Those standards require that we plan and perform the audits to obtain reasonable assurance about whether the consolidated financial statements are free of material misstatement, whether due to error or fraud, and whether effective internal control over financial reporting was maintained in all material respects. Our audits of the consolidated financial statements included performing procedures to assess the risks of material misstatement of the consolidated financial statements, whether due to error or fraud, and performing procedures that respond to those risks. Such procedures included examining, on a test basis, evidence regarding the amounts and disclosures in the consolidated financial statements. Our audits also included evaluating the accounting principles used and significant estimates made by management, as well as evaluating the overall presentation of the consolidated financial statements. Our audit of internal control over financial reporting included obtaining an understanding of internal control over financial reporting, assessing the risk that a material weakness exists, and testing and evaluating the design and operating effectiveness of internal control based on the assessed risk. Our audits also included performing such other procedures as we considered necessary in the circumstances. We believe that our audits provide a reasonable basis for our opinions. | ||||||||
| Definition and Limitations of Internal Control over Financial Reporting A company’s internal control over financial reporting is a process designed to provide reasonable assurance regarding the reliability of financial reporting and the preparation of financial statements for external purposes in accordance with generally accepted accounting principles. A company’s internal control over financial reporting includes those policies and procedures that (i) pertain to the maintenance of records that, in reasonable detail, accurately and fairly reflect the transactions and dispositions of the assets of the company; (ii) provide reasonable assurance that transactions are recorded as necessary to permit preparation of financial statements in accordance with generally accepted accounting principles, and that receipts and expenditures of the company are being made only in accordance with authorizations of management and directors of the company; and (iii) provide reasonable assurance regarding prevention or timely detection of unauthorized acquisition, use, or disposition of the company’s assets that could have a material effect on the financial statements. |
| Financial Table of Contents |
| Because of its inherent limitations, internal control over financial reporting may not prevent or detect misstatements. Also, projections of any evaluation of effectiveness to future periods are subject to the risk that controls may become inadequate because of changes in conditions, or that the degree of compliance with the policies or procedures may deteriorate. | ||||||||
| Critical Audit Matters The critical audit matter communicated below is a matter arising from the current period audit of the consolidated financial statements that was communicated or required to be communicated to the audit committee and that (i) relates to accounts or disclosures that are material to the consolidated financial statements and (ii) involved our especially challenging, subjective, or complex judgments. The communication of critical audit matters does not alter in any way our opinion on the consolidated financial statements, taken as a whole, and we are not, by communicating the critical audit matter below, providing a separate opinion on the critical audit matter or on the accounts or disclosures to which it relates. | ||||||||
| The Impact of Proved Developed Crude Oil and Natural Gas Reserves on Upstream Property, Plant, and Equipment, Net As described in Notes 1 and 18 to the consolidated financial statements, the Company’s upstream property, plant and equipment, net balance was $129.1 billion as of December 31, 2024, and depreciation, depletion and amortization expense was $15.5 billion for the year ended December 31, 2024. The Company follows the successful efforts method of accounting for crude oil and natural gas exploration and production activities. Depreciation and depletion of all capitalized costs of proved crude oil and natural gas producing properties, except mineral interests, are expensed using the unit-of-production method, generally by individual field, as the proved developed reserves are produced. Depletion expenses for capitalized costs of proved mineral interests are recognized using the unit-of-production method by individual field as the related proved reserves are produced. As disclosed by management, variables impacting the Company’s estimated volumes of proved crude oil, natural gas liquids (NGLs) and natural gas reserves include field performance, available technology, commodity prices, and development, production and carbon costs. Reserves are estimated by Company asset teams composed of earth scientists and engineers. As part of the internal control process related to reserves estimation, the Company maintains a Reserves Advisory Committee (RAC) (the Company’s earth scientists, engineers and RAC are collectively referred to as “management’s specialists”). The principal considerations for our determination that performing procedures relating to the impact of proved developed crude oil and natural gas reserves on upstream property, plant, and equipment, net is a critical audit matter are (i) the significant judgment by management, including the use of management’s specialists, when developing the estimates of proved developed crude oil and natural gas reserves, which in turn led to (ii) a high degree of auditor judgment, subjectivity, and effort in performing procedures and evaluating audit evidence obtained related to the data, methods, and assumptions used by management and its specialists in developing the estimates of proved developed crude oil and natural gas reserves. Addressing the matter involved performing procedures and evaluating audit evidence in connection with forming our overall opinion on the consolidated financial statements. These procedures included testing the effectiveness of controls relating to management’s estimates of proved developed crude oil and natural gas reserves. The work of management’s specialists was used in performing the procedures to evaluate the reasonableness of the proved developed crude oil and natural gas reserves. As a basis for using this work, the specialists’ qualifications were understood and the Company’s relationship with the specialists was assessed. The procedures performed also included evaluation of the methods and assumptions used by the specialists, tests of data used by the specialists and an evaluation of the specialists’ findings related to estimated future production volumes by comparing the estimate to relevant historical and current period information, as applicable. | ||||||||
| /s/ PricewaterhouseCoopers LLP | ||||||||
| San Francisco, California | ||||||||
| February 21, 2025 | ||||||||
| We have served as the Company’s auditor since 1935. |
| Consolidated Statement of Income | Financial Table of Contents | |||||||
| Millions of dollars, except per-share amounts |
| Year ended December 31 | ||||||||||||||||||||||||||
| 2024 | 2023 | 2022 | ||||||||||||||||||||||||
| Revenues and Other Income | ||||||||||||||||||||||||||
| Sales and other operating revenues | $ | 193,414 | $ | 196,913 | $ | 235,717 | ||||||||||||||||||||
| Income (loss) from equity affiliates | 4,596 | 5,131 | 8,585 | |||||||||||||||||||||||
| Other income (loss) | 4,782 | (1,095) | 1,950 | |||||||||||||||||||||||
| Total Revenues and Other Income | 202,792 | 200,949 | 246,252 | |||||||||||||||||||||||
| Costs and Other Deductions | ||||||||||||||||||||||||||
| Purchased crude oil and products | 119,206 | 119,196 | 145,416 | |||||||||||||||||||||||
| Operating expenses | 27,464 | 24,887 | 24,714 | |||||||||||||||||||||||
| Selling, general and administrative expenses | 4,834 | 4,141 | 4,312 | |||||||||||||||||||||||
| Exploration expenses | 995 | 914 | 974 | |||||||||||||||||||||||
| Depreciation, depletion and amortization | 17,282 | 17,326 | 16,319 | |||||||||||||||||||||||
| Taxes other than on income | 4,716 | 4,220 | 4,032 | |||||||||||||||||||||||
| Interest and debt expense | 594 | 469 | 516 | |||||||||||||||||||||||
| Other components of net periodic benefit costs | 195 | 212 | 295 | |||||||||||||||||||||||
| Total Costs and Other Deductions | 175,286 | 171,365 | 196,578 | |||||||||||||||||||||||
| Income (Loss) Before Income Tax Expense | 27,506 | 29,584 | 49,674 | |||||||||||||||||||||||
| Income Tax Expense (Benefit) | 9,757 | 8,173 | 14,066 | |||||||||||||||||||||||
| Net Income (Loss) | 17,749 | 21,411 | 35,608 | |||||||||||||||||||||||
| Less: Net income (loss) attributable to noncontrolling interests | 88 | 42 | 143 | |||||||||||||||||||||||
| Net Income (Loss) Attributable to Chevron Corporation | $ | 17,661 | $ | 21,369 | $ | 35,465 | ||||||||||||||||||||
| Per Share of Common Stock | ||||||||||||||||||||||||||
| Net Income (Loss) Attributable to Chevron Corporation | ||||||||||||||||||||||||||
| - Basic | $ | 9.76 | $ | 11.41 | $ | 18.36 | ||||||||||||||||||||
| - Diluted | $ | 9.72 | $ | 11.36 | $ | 18.28 | ||||||||||||||||||||
| See accompanying Notes to the Consolidated Financial Statements. | ||||||||||||||||||||||||||
| Consolidated Statement of Comprehensive Income | Financial Table of Contents | |||||||
| Millions of dollars |
| Year ended December 31 | |||||||||||||||||||||||||||||
| 2024 | 2023 | 2022 | |||||||||||||||||||||||||||
| Net Income (Loss) | $ | 17,749 | $ | 21,411 | $ | 35,608 | |||||||||||||||||||||||
| Currency translation adjustment | |||||||||||||||||||||||||||||
| Unrealized net change arising during period | (67) | 11 | (41) | ||||||||||||||||||||||||||
| Unrealized holding gain (loss) on securities | |||||||||||||||||||||||||||||
| Net gain (loss) arising during period | (8) | 1 | (1) | ||||||||||||||||||||||||||
| Derivatives | |||||||||||||||||||||||||||||
| Net derivatives gain (loss) on hedge transactions | (50) | (11) | 65 | ||||||||||||||||||||||||||
| Reclassification to net income | 25 | 33 | (80) | ||||||||||||||||||||||||||
| Income tax benefit (cost) on derivatives transactions | 6 | (5) | 3 | ||||||||||||||||||||||||||
| Total | (19) | 17 | (12) | ||||||||||||||||||||||||||
| Defined benefit plans | |||||||||||||||||||||||||||||
| Actuarial gain (loss) | |||||||||||||||||||||||||||||
| Amortization to net income of net actuarial loss and settlements | 247 | 244 | 599 | ||||||||||||||||||||||||||
| Actuarial gain (loss) arising during period | 228 | (550) | 1,050 | ||||||||||||||||||||||||||
| Prior service credits (cost) | |||||||||||||||||||||||||||||
| Amortization to net income of net prior service costs and curtailments | (10) | (13) | (19) | ||||||||||||||||||||||||||
| Prior service (costs) credits arising during period | (48) | (29) | (96) | ||||||||||||||||||||||||||
| Defined benefit plans sponsored by equity affiliates - benefit (cost) | (19) | 6 | 100 | ||||||||||||||||||||||||||
| Income tax benefit (cost) on defined benefit plans | (104) | 151 | (489) | ||||||||||||||||||||||||||
| Total | 294 | (191) | 1,145 | ||||||||||||||||||||||||||
| Other Comprehensive Gain (Loss), Net of Tax | 200 | (162) | 1,091 | ||||||||||||||||||||||||||
| Comprehensive Income (Loss) | 17,949 | 21,249 | 36,699 | ||||||||||||||||||||||||||
| Comprehensive loss (income) attributable to noncontrolling interests | (88) | (42) | (143) | ||||||||||||||||||||||||||
| Comprehensive Income (Loss) Attributable to Chevron Corporation | $ | 17,861 | $ | 21,207 | $ | 36,556 | |||||||||||||||||||||||
| See accompanying Notes to the Consolidated Financial Statements. | |||||||||||||||||||||||||||||
| Consolidated Balance Sheet | Financial Table of Contents | |||||||
| Millions of dollars, except per-share amounts |
| At December 31 | |||||||||||||||||
| 2024 | 2023 | ||||||||||||||||
| Assets | |||||||||||||||||
| Cash and cash equivalents | $ | 6,781 | $ | 8,178 | |||||||||||||
| Time deposits | 4 | — | |||||||||||||||
| Marketable securities | — | 45 | |||||||||||||||
| Accounts and notes receivable (less allowance: 2024 - $259; 2023 - $301) | 20,684 | 19,921 | |||||||||||||||
| Inventories: | |||||||||||||||||
| Crude oil and products | 6,490 | 6,059 | |||||||||||||||
| Chemicals | 502 | 406 | |||||||||||||||
| Materials, supplies and other | 2,082 | 2,147 | |||||||||||||||
| Total inventories | 9,074 | 8,612 | |||||||||||||||
| Prepaid expenses and other current assets | 4,368 | 4,372 | |||||||||||||||
| Total Current Assets | 40,911 | 41,128 | |||||||||||||||
| Long-term receivables, net (less allowances: 2024 - $352; 2023 - $340) | 877 | 942 | |||||||||||||||
| Investments and advances | 47,438 | 46,812 | |||||||||||||||
| Properties, plant and equipment, at cost | 345,933 | 346,081 | |||||||||||||||
| Less: Accumulated depreciation, depletion and amortization | 198,134 | 192,462 | |||||||||||||||
| Properties, plant and equipment, net | 147,799 | 153,619 | |||||||||||||||
| Deferred charges and other assets | 14,854 | 13,734 | |||||||||||||||
| Goodwill | 4,578 | 4,722 | |||||||||||||||
| Assets held for sale | 481 | 675 | |||||||||||||||
| Total Assets | $ | 256,938 | $ | 261,632 | |||||||||||||
| Liabilities and Equity | |||||||||||||||||
| Short-term debt | $ | 4,406 | $ | 529 | |||||||||||||
| Accounts payable | 22,079 | 20,423 | |||||||||||||||
| Accrued liabilities | 8,486 | 7,655 | |||||||||||||||
| Federal and other taxes on income | 1,872 | 1,863 | |||||||||||||||
| Other taxes payable | 1,715 | 1,788 | |||||||||||||||
| Total Current Liabilities | 38,558 | 32,258 | |||||||||||||||
| Long-term debt1 | 20,135 | 20,307 | |||||||||||||||
| Deferred credits and other noncurrent obligations | 22,094 | 24,226 | |||||||||||||||
| Noncurrent deferred income taxes | 19,137 | 18,830 | |||||||||||||||
| Noncurrent employee benefit plans | 3,857 | 4,082 | |||||||||||||||
| Total Liabilities****2 | $ | 103,781 | $ | 99,703 | |||||||||||||
| Preferred stock (authorized 100,000,000 shares; $1.00 par value; none issued) | — | — | |||||||||||||||
| Common stock (authorized 6,000,000,000 shares; $0.75 par value; 2,442,676,580 shares issued at December 31, 2024 and 2023) | 1,832 | 1,832 | |||||||||||||||
| Capital in excess of par value | 21,671 | 21,365 | |||||||||||||||
| Retained earnings | 205,852 | 200,025 | |||||||||||||||
| Accumulated other comprehensive losses | (2,760) | (2,960) | |||||||||||||||
| Deferred compensation and benefit plan trust | (240) | (240) | |||||||||||||||
| Treasury stock, at cost (2024 - 673,664,306 shares; 2023 - 577,028,776 shares) | (74,037) | (59,065) | |||||||||||||||
| Total Chevron Corporation Stockholders’ Equity | 152,318 | 160,957 | |||||||||||||||
| Noncontrolling interests (includes redeemable noncontrolling interest of $0 and $166 at December 31, 2024 and 2023) | 839 | 972 | |||||||||||||||
| Total Equity | 153,157 | 161,929 | |||||||||||||||
| Total Liabilities and Equity | $ | 256,938 | $ | 261,632 | |||||||||||||
| 1 Includes finance lease liabilities of $546 and $574 at December 31, 2024 and 2023, respectively. | |||||||||||||||||
| 2 Refer to Note 24 Other Contingencies and Commitments. | |||||||||||||||||
| See accompanying Notes to the Consolidated Financial Statements. | |||||||||||||||||
| Consolidated Statement of Cash Flows | Financial Table of Contents | |||||||
| Millions of dollars |
| Year ended December 31 | |||||||||||||||||||||||
| 2024 | 2023 | 2022 | |||||||||||||||||||||
| Operating Activities | |||||||||||||||||||||||
| Net Income (Loss) | $ | 17,749 | $ | 21,411 | $ | 35,608 | |||||||||||||||||
| Adjustments | |||||||||||||||||||||||
| Depreciation, depletion and amortization | 17,282 | 17,326 | 16,319 | ||||||||||||||||||||
| Dry hole expense | 429 | 436 | 486 | ||||||||||||||||||||
| Distributions more (less) than income from equity affiliates | (366) | (885) | (4,730) | ||||||||||||||||||||
| Net before-tax gains on asset retirements and sales | (1,685) | (138) | (550) | ||||||||||||||||||||
| Net foreign currency effects | (629) | 578 | (412) | ||||||||||||||||||||
| Deferred income tax provision | 1,240 | 298 | 2,124 | ||||||||||||||||||||
| Net decrease (increase) in operating working capital | 1,211 | (3,185) | 2,125 | ||||||||||||||||||||
| Decrease (increase) in long-term receivables | 114 | 150 | 153 | ||||||||||||||||||||
| Net decrease (increase) in other deferred charges | (1,225) | (300) | (212) | ||||||||||||||||||||
| Cash contributions to employee pension plans | (844) | (1,120) | (1,322) | ||||||||||||||||||||
| Other | (1,784) | 1,038 | 13 | ||||||||||||||||||||
| Net Cash Provided by Operating Activities | 31,492 | 35,609 | 49,602 | ||||||||||||||||||||
| Investing Activities | |||||||||||||||||||||||
| Acquisition of businesses, net of cash received | — | 55 | (2,862) | ||||||||||||||||||||
| Capital expenditures | (16,448) | (15,829) | (11,974) | ||||||||||||||||||||
| Proceeds and deposits related to asset sales and returns of investment | 7,704 | 669 | 2,635 | ||||||||||||||||||||
| Net maturities of (investments in) time deposits | (4) | — | — | ||||||||||||||||||||
| Net sales (purchases) of marketable securities | 45 | 175 | 117 | ||||||||||||||||||||
| Net repayment (borrowing) of loans by equity affiliates | (233) | (302) | (24) | ||||||||||||||||||||
| Net Cash Used for Investing Activities | (8,936) | (15,232) | (12,108) | ||||||||||||||||||||
| Financing Activities | |||||||||||||||||||||||
| Net borrowings (repayments) of short-term obligations | 4,868 | 135 | 263 | ||||||||||||||||||||
| Proceeds from issuances of long-term debt | 478 | 150 | — | ||||||||||||||||||||
| Repayments of long-term debt and other financing obligations | (1,778) | (4,340) | (8,742) | ||||||||||||||||||||
| Cash dividends - common stock | (11,801) | (11,336) | (10,968) | ||||||||||||||||||||
| Net contributions from (distributions to) noncontrolling interests | (195) | (40) | (114) | ||||||||||||||||||||
| Net sales (purchases) of treasury shares | (15,044) | (14,678) | (5,417) | ||||||||||||||||||||
| Net Cash Provided by (Used for) Financing Activities | (23,472) | (30,109) | (24,978) | ||||||||||||||||||||
| Effect of Exchange Rate Changes on Cash, Cash Equivalents and Restricted Cash | (97) | (114) | (190) | ||||||||||||||||||||
| Net Change in Cash, Cash Equivalents and Restricted Cash | (1,013) | (9,846) | 12,326 | ||||||||||||||||||||
| Cash, Cash Equivalents and Restricted Cash at January 1 | 9,275 | 19,121 | 6,795 | ||||||||||||||||||||
| Cash, Cash Equivalents and Restricted Cash at December 31 | $ | 8,262 | $ | 9,275 | $ | 19,121 | |||||||||||||||||
| See accompanying Notes to the Consolidated Financial Statements. | |||||||||||||||||||||||
| Consolidated Statement of Equity | Financial Table of Contents | |||||||
| Millions of dollars, except per-share amounts |
| Acc. Other | Treasury | Chevron Corp. | |||||||||||||||||||||||||||
| Common | Retained | Comprehensive | Stock | Stockholders’ | Noncontrolling | Total | |||||||||||||||||||||||
| Stock****1 | Earnings | Income (Loss) | (at cost) | Equity | Interests | Equity | |||||||||||||||||||||||
| Balance at December 31, 2021 | $ | 18,874 | $ | 165,546 | $ | (3,889) | $ | (41,464) | $ | 139,067 | $ | 873 | $ | 139,940 | |||||||||||||||
| Treasury stock transactions | 63 | — | — | — | 63 | — | 63 | ||||||||||||||||||||||
| Net income (loss) | — | 35,465 | — | — | 35,465 | 143 | 35,608 | ||||||||||||||||||||||
| Cash dividends ($5.68 per share) | — | (10,968) | — | — | (10,968) | (118) | (11,086) | ||||||||||||||||||||||
| Stock dividends | — | (3) | — | — | (3) | — | (3) | ||||||||||||||||||||||
| Other comprehensive income | — | — | 1,091 | — | 1,091 | — | 1,091 | ||||||||||||||||||||||
| Purchases of treasury shares | — | — | — | (11,255) | (11,255) | — | (11,255) | ||||||||||||||||||||||
| Issuances of treasury shares | 1,315 | — | — | 4,523 | 5,838 | — | 5,838 | ||||||||||||||||||||||
| Other changes, net | — | (16) | — | — | (16) | 62 | 46 | ||||||||||||||||||||||
| Balance at December 31, 2022 | $ | 20,252 | $ | 190,024 | $ | (2,798) | $ | (48,196) | $ | 159,282 | $ | 960 | $ | 160,242 | |||||||||||||||
| Treasury stock transactions | 174 | — | — | — | 174 | — | 174 | ||||||||||||||||||||||
| PDC Energy, Inc. acquisition | 2,550 | — | — | 3,970 | 6,520 | — | 6,520 | ||||||||||||||||||||||
| Net income (loss) | — | 21,369 | — | — | 21,369 | 42 | 21,411 | ||||||||||||||||||||||
| Cash dividends ($6.04 per share) | — | (11,336) | — | — | (11,336) | (54) | (11,390) | ||||||||||||||||||||||
| Stock dividends | — | (9) | — | — | (9) | — | (9) | ||||||||||||||||||||||
| Other comprehensive income | — | — | (162) | — | (162) | — | (162) | ||||||||||||||||||||||
| Purchases of treasury shares | — | — | — | (15,085) | (15,085) | — | (15,085) | ||||||||||||||||||||||
| Issuances of treasury shares | 17 | — | — | 246 | 263 | — | 263 | ||||||||||||||||||||||
| Other changes, net | (36) | (23) | — | — | (59) | 24 | (35) | ||||||||||||||||||||||
| Balance at December 31, 2023 | $ | 22,957 | $ | 200,025 | $ | (2,960) | $ | (59,065) | $ | 160,957 | $ | 972 | $ | 161,929 | |||||||||||||||
| Treasury stock transactions | 255 | — | — | — | 255 | — | 255 | ||||||||||||||||||||||
| Net income (loss) | — | 17,661 | — | — | 17,661 | 88 | 17,749 | ||||||||||||||||||||||
| Cash dividends ($6.52 per share) | — | (11,801) | — | — | (11,801) | (210) | (12,011) | ||||||||||||||||||||||
| Stock dividends | — | (22) | — | — | (22) | — | (22) | ||||||||||||||||||||||
| Other comprehensive income | — | — | 200 | — | 200 | — | 200 | ||||||||||||||||||||||
| Purchases of treasury shares2 | — | — | — | (15,374) | (15,374) | — | (15,374) | ||||||||||||||||||||||
| Issuances of treasury shares | 51 | — | — | 402 | 453 | — | 453 | ||||||||||||||||||||||
| Other changes, net | — | (11) | — | — | (11) | (11) | (22) | ||||||||||||||||||||||
| Balance at December 31, 2024 | $ | 23,263 | $ | 205,852 | $ | (2,760) | $ | (74,037) | $ | 152,318 | $ | 839 | $ | 153,157 | |||||||||||||||
| Common Stock Share Activity | |||||||||||||||||||||||||||||
| Issued****3 | Treasury | Outstanding | |||||||||||||||||||||||||||
| Balance at December 31, 2021 | 2,442,676,580 | (512,870,523) | 1,929,806,057 | ||||||||||||||||||||||||||
| Purchases | — | (69,912,961) | (69,912,961) | ||||||||||||||||||||||||||
| Issuances | — | 55,323,247 | 55,323,247 | ||||||||||||||||||||||||||
| Balance at December 31, 2022 | 2,442,676,580 | (527,460,237) | 1,915,216,343 | ||||||||||||||||||||||||||
| Purchases | — | (92,849,905) | (92,849,905) | ||||||||||||||||||||||||||
| Issuances | — | 43,281,366 | 43,281,366 | ||||||||||||||||||||||||||
| Balance at December 31, 2023 | 2,442,676,580 | (577,028,776) | 1,865,647,804 | ||||||||||||||||||||||||||
| Purchases | — | (100,444,608) | (100,444,608) | ||||||||||||||||||||||||||
| Issuances | — | 3,809,078 | 3,809,078 | ||||||||||||||||||||||||||
| Balance at December 31, 2024 | 2,442,676,580 | (673,664,306) | 1,769,012,274 | ||||||||||||||||||||||||||
| 1 Beginning and ending balances for all periods include capital in excess of par, common stock issued at par for $1,832, and $(240) associated with Chevron’s Benefit Plan Trust. Changes reflect capital in excess of par. | |||||||||||||||||||||||||||||
| 2 Includes excise tax on share repurchases. | |||||||||||||||||||||||||||||
| 3 Beginning and ending total issued share balances include 14,168,000 shares associated with Chevron’s Benefit Plan Trust. | |||||||||||||||||||||||||||||
| See accompanying Notes to the Consolidated Financial Statements. | |||||||||||||||||||||||||||||
| Notes to the Consolidated Financial Statements | Financial Table of Contents | |||||||
| Millions of dollars, except per-share amounts |
Note 1
Summary of Significant Accounting Policies
General The company’s Consolidated Financial Statements are prepared in accordance with accounting principles generally accepted in the United States of America. These require the use of estimates and assumptions that affect the assets, liabilities, revenues and expenses reported in the financial statements, as well as amounts included in the notes thereto, including discussion and disclosure of contingent liabilities. Although the company uses its best estimates and judgments, actual results could differ from these estimates as circumstances change and additional information becomes known. Prior years’ data have been reclassified in certain cases to conform to the 2024 presentation basis.
Subsidiary and Affiliated Companies The Consolidated Financial Statements include the accounts of controlled subsidiary companies more than 50 percent-owned and any variable interest entities in which the company is the primary beneficiary. Undivided interests in oil and gas joint ventures and certain other assets are consolidated on a proportionate basis. Investments in and advances to affiliates in which the company has a substantial ownership interest of approximately 20 percent to 50 percent, or for which the company exercises significant influence but not control over policy decisions, are accounted for by the equity method.
Investments in affiliates are assessed for possible impairment when events indicate that the fair value of the investment may be below the company’s carrying value. When such a condition is deemed to be other than temporary, the carrying value of the investment is written down to its fair value, and the amount of the write-down is included in net income. In making the determination as to whether a decline is other than temporary, the company considers such factors as the duration and extent of the decline, the investee’s financial performance, and the company’s ability and intention to retain its investment for a period that will be sufficient to allow for any anticipated recovery in the investment’s market value. The new cost basis of investments in these equity investees is not changed for subsequent recoveries in fair value.
Differences between the company’s carrying value of an equity investment and its underlying equity in the net assets of the affiliate are assigned to the extent practicable to specific assets and liabilities based on the company’s analysis of the various factors giving rise to the difference. When appropriate, the company’s share of the affiliate’s reported earnings is adjusted quarterly to reflect the difference between these allocated values and the affiliate’s historical book values.
Noncontrolling Interests Ownership interests in the company’s subsidiaries held by parties other than the parent are presented separately from the parent’s equity on the Consolidated Balance Sheet. The amount of consolidated net income attributable to the parent and the noncontrolling interests are both presented on the face of the Consolidated Statement of Income and Consolidated Statement of Equity. Included within noncontrolling interest is redeemable noncontrolling interest.
Fair Value Measurements The three levels of the fair value hierarchy of inputs the company uses to measure the fair value of an asset or a liability are as follows. Level 1 inputs are quoted prices in active markets for identical assets or liabilities. Level 2 inputs are inputs other than quoted prices included within Level 1 that are directly or indirectly observable for the asset or liability. Level 3 inputs are inputs that are not observable in the market.
Derivatives The majority of the company’s activity in derivative commodity instruments is intended to manage the financial risk posed by physical transactions. For some of this derivative activity, the company may elect to apply fair value or cash flow hedge accounting with changes in fair value recorded as components of accumulated other comprehensive income (loss). For other similar derivative instruments, generally because of the short-term nature of the contracts or their limited use, the company does not apply hedge accounting, and changes in the fair value of those contracts are reflected in current income. For the company’s commodity trading activity, gains and losses from derivative instruments are reported in current income. The company may enter into interest rate swaps from time to time as part of its overall strategy to manage the interest rate risk on its debt. Interest rate swaps related to a portion of the company’s fixed-rate debt, if any, may be accounted for as fair value hedges. Interest rate swaps related to floating-rate debt, if any, are recorded at fair value on the balance sheet with resulting gains and losses reflected in income. Where Chevron is a party to master netting arrangements, fair value receivable and payable amounts recognized for derivative instruments executed with the same counterparty are generally offset on the balance sheet.
Inventories Crude oil, products and chemicals inventories are generally stated at cost, using a last-in, first-out method. In the aggregate, these costs are below market. “Materials, supplies and other” inventories are primarily stated at cost or net realizable value.
| Notes to the Consolidated Financial Statements | Financial Table of Contents | |||||||
| Millions of dollars, except per-share amounts |
Properties, Plant and Equipment The successful efforts method is used for crude oil and natural gas exploration and production activities. All costs for development wells, related plant and equipment, proved mineral interests in crude oil and natural gas properties, and related asset retirement obligation (ARO) assets are capitalized. Costs of exploratory wells are capitalized pending determination of whether the wells found proved reserves. Costs of wells that are assigned proved reserves remain capitalized. Costs also are capitalized for exploratory wells that have found crude oil and natural gas reserves even if the reserves cannot be classified as proved when the drilling is completed, provided the exploratory well has found a sufficient quantity of reserves to justify its completion as a producing well and the company is making sufficient progress assessing the reserves and the economic and operating viability of the project. All other exploratory wells and costs are expensed. Refer to Note 21 Accounting for Suspended Exploratory Wells for additional discussion of accounting for suspended exploratory well costs.
Long-lived assets to be held and used, including proved crude oil and natural gas properties, are assessed for possible impairment by comparing their carrying values with their associated undiscounted, future net cash flows. Events that can trigger assessments for possible impairments include write-downs of proved reserves based on field performance, significant decreases in the market value of an asset (including changes to the commodity price forecast or carbon costs), significant change in the extent or manner of use of or a physical change in an asset, and a more likely than not expectation that a long-lived asset or asset group will be sold or otherwise disposed of significantly sooner than the end of its previously estimated useful life. Impaired assets are written down to their estimated fair values, generally their discounted, future net cash flows. For proved crude oil and natural gas properties, the company performs impairment reviews on a country, concession, PSC, development area or field basis, as appropriate. In downstream, impairment reviews are performed on the basis of a refinery, a plant, a marketing/lubricants area or distribution area, as appropriate. Impairment amounts are recorded as incremental “Depreciation, depletion and amortization” expense.
Long-lived assets that are held for sale are evaluated for possible impairment by comparing the carrying value of the asset with its fair value less the cost to sell. If the net book value exceeds the fair value less cost to sell, the asset is considered impaired and adjusted to the lower value. Refer to Note 9 Fair Value Measurements relating to fair value measurements.
The fair value of a liability for an ARO is recorded as an asset and a liability when there is a legal obligation associated with the retirement of a long-lived asset and the amount can be reasonably estimated. Refer also to Note 25 Asset Retirement Obligations relating to AROs.
Depreciation and depletion of all capitalized costs of proved crude oil and natural gas producing properties, except mineral interests, are expensed using the unit-of-production method, generally by individual field, as the proved developed reserves are produced. Depletion expenses for capitalized costs of proved mineral interests are recognized using the unit-of-production method by individual field as the related proved reserves are produced. Impairments of capitalized costs of unproved mineral interests are expensed.
The capitalized costs of all other plant and equipment are depreciated or amortized over their estimated useful lives. In general, the declining-balance method is used to depreciate plant and equipment in the United States; the straight-line method is generally used to depreciate international plant and equipment and to amortize finance lease right-of-use assets.
Gains or losses are not recognized for normal retirements of properties, plant and equipment subject to composite group amortization or depreciation. Gains or losses from abnormal retirements are recorded as expenses, and from sales as “Other income.”
Expenditures for maintenance (including those for planned major maintenance projects), repairs and minor renewals to maintain facilities in operating condition are generally expensed as incurred. Major replacements and renewals are capitalized.
Leases Leases are classified as operating or finance leases. Both operating and finance leases recognize lease liabilities and associated right-of-use assets. The company has elected the short-term lease exception and therefore only recognizes right-of-use assets and lease liabilities for leases with a term greater than one year. The company has elected the practical expedient to not separate non-lease components from lease components for most asset classes except for certain asset classes that have significant non-lease (i.e., service) components.
Where leases are used in joint ventures, the company recognizes 100 percent of the right-of-use assets and lease liabilities when the company is the sole signatory for the lease (in most cases, where the company is the operator of a joint venture). Lease costs reflect only the costs associated with the operator’s working interest share. The lease term includes the committed lease term identified in the contract, taking into account renewal and termination options that management is
| Notes to the Consolidated Financial Statements | Financial Table of Contents | |||||||
| Millions of dollars, except per-share amounts |
reasonably certain to exercise. The company uses its incremental borrowing rate as a proxy for the discount rate based on the term of the lease unless the implicit rate is available.
Decommissioning Obligations from Previously Divested Assets Some assets are divested with their related liabilities, including decommissioning obligations, to a buyer that results in de-recognition of the liability from the balance sheet. In certain instances, such transferred obligations may return to the company and result in losses. To the extent the current owners of the company’s previously divested assets default on their decommissioning obligations, regulators may require that Chevron assume such obligations. The company would accrue losses associated with these obligations when management determines the loss to be both probable and reasonably estimable. This typically requires judgment to assess the likelihood of decommissioning obligations reverting to the company, the timing of decommissioning activity, regulatory requirements and the scope of decommissioning activities. For more information on decommissioning obligations related to previously divested assets, refer to Note 24 Other Contingencies and Commitments.
Goodwill Goodwill resulting from a business combination is not subject to amortization. The company tests such goodwill at the reporting unit level for impairment annually at December 31, or more frequently if an event occurs or circumstances change that would more likely than not reduce the fair value of the reporting unit below its carrying amount.
Environmental Expenditures Environmental expenditures that relate to ongoing operations or to conditions caused by past operations are expensed. Expenditures that create future benefits or contribute to future revenue generation are capitalized.
Liabilities related to future remediation costs are recorded when environmental assessments or cleanups or both are probable and the costs can be reasonably estimated. For crude oil, natural gas and mineral-producing properties, a liability for an ARO is made in accordance with accounting standards for asset retirement and environmental obligations. Refer to Note 25 Asset Retirement Obligations for a discussion of the company’s AROs.
For U.S. federal Superfund sites and analogous sites under state laws, the company records a liability for its designated share of the probable and estimable costs, and probable amounts for other potentially responsible parties when mandated by the regulatory agencies because the other parties are not able to pay their respective shares. The gross amount of environmental liabilities is based on the company’s best estimate of future costs using currently available technology and applying current regulations and the company’s own internal environmental policies. Future amounts are not discounted. Recoveries or reimbursements are recorded as assets when receipt is reasonably assured.
Currency Translation The U.S. dollar is the functional currency for substantially all of the company’s consolidated operations and those of its equity affiliates. For those operations, all gains and losses from currency remeasurement are included in current period income. The cumulative translation effects for those few entities, both consolidated and affiliated, using functional currencies other than the U.S. dollar are included in “Currency translation adjustment” on the Consolidated Statement of Equity.
Revenue Recognition The company accounts for each delivery order of crude oil, NGLs, natural gas, petroleum and chemical products as a separate performance obligation. Revenue is recognized when the performance obligation is satisfied, which typically occurs at the point in time when control of the product transfers to the customer. Payment is generally due within 30 days of delivery. The company accounts for delivery transportation as a fulfillment cost, not a separate performance obligation, and recognizes these costs as an operating expense in the period when revenue for the related commodity is recognized.
Revenue is measured as the amount the company expects to receive in exchange for transferring commodities to the customer. The company’s commodity sales are typically based on prevailing market-based prices and may include discounts and allowances. Until market prices become known under terms of the company’s contracts, the transaction price included in revenue is based on the company’s estimate of the most likely outcome.
Discounts and allowances are estimated using a combination of historical and recent data trends. When deliveries contain multiple products, an observable standalone selling price is generally used to measure revenue for each product. The company includes estimates in the transaction price only to the extent that a significant reversal of revenue is not probable in subsequent periods.
Stock Options and Other Share-Based Compensation The company issues stock options and other share-based compensation to certain employees. For equity awards, such as stock options and certain restricted stock units, total compensation cost is based on the grant date fair value, and for liability awards, such as stock appreciation rights, total compensation cost is based on the settlement value. The company recognizes stock-based compensation expense for all awards over the service period required to earn the award, which is the shorter of the vesting period or the time period in
| Notes to the Consolidated Financial Statements | Financial Table of Contents | |||||||
| Millions of dollars, except per-share amounts |
which an employee becomes eligible to retain the award at retirement. For more information on stock options and other share-based compensation, refer to Note 22 Stock Options and Other Share-Based Compensation.
Note 2
Changes in Accumulated Other Comprehensive Losses
The change in Accumulated Other Comprehensive Losses (AOCL) presented on the Consolidated Balance Sheet and the impact of significant amounts reclassified from AOCL on information presented in the Consolidated Statement of Income for the year ended December 31, 2024, are reflected in the table below.
| Currency Translation Adjustments | Unrealized Holding Gains (Losses) on Securities | Derivatives | Defined Benefit Plans | Total | |||||||||||||||||||||||||
| Balance at December 31, 2021 | $ | (162) | $ | (11) | $ | — | $ | (3,716) | $ | (3,889) | |||||||||||||||||||
| Components of Other Comprehensive Income (Loss)1: | |||||||||||||||||||||||||||||
| Before Reclassifications | (41) | (1) | 68 | 703 | 729 | ||||||||||||||||||||||||
| Reclassifications2, 3 | — | — | (80) | 442 | 362 | ||||||||||||||||||||||||
| Net Other Comprehensive Income (Loss) | (41) | (1) | (12) | 1,145 | 1,091 | ||||||||||||||||||||||||
| Balance at December 31, 2022 | $ | (203) | $ | (12) | $ | (12) | $ | (2,571) | $ | (2,798) | |||||||||||||||||||
| Components of Other Comprehensive Income (Loss)1: | |||||||||||||||||||||||||||||
| Before Reclassifications | 11 | 1 | (16) | (397) | (401) | ||||||||||||||||||||||||
| Reclassifications2, 3 | — | — | 33 | 206 | 239 | ||||||||||||||||||||||||
| Net Other Comprehensive Income (Loss) | 11 | 1 | 17 | (191) | (162) | ||||||||||||||||||||||||
| Balance at December 31, 2023 | $ | (192) | $ | (11) | $ | 5 | $ | (2,762) | $ | (2,960) | |||||||||||||||||||
| Components of Other Comprehensive Income (Loss)1: | |||||||||||||||||||||||||||||
| Before Reclassifications | (67) | (8) | (44) | 119 | — | ||||||||||||||||||||||||
| Reclassifications2, 3 | — | — | 25 | 175 | 200 | ||||||||||||||||||||||||
| Net Other Comprehensive Income (Loss) | (67) | (8) | (19) | 294 | 200 | ||||||||||||||||||||||||
| Balance at December 31, 2024 | $ | (259) | $ | (19) | $ | (14) | $ | (2,468) | $ | (2,760) |
1 All amounts are net of tax.
2 Refer to Note 23 Employee Benefit Plans, for reclassified components, including amortization of actuarial gains or losses, amortization of prior service costs and settlement losses, totaling $237 that are included in employee benefit costs for the year ended December 31, 2024. Related income taxes for the same period, totaling $62, are reflected in Income Tax Expense on the Consolidated Statement of Income. All other reclassified amounts were insignificant.
3 Refer to Note 10 Financial and Derivative Instruments for cash flow hedging.
| Notes to the Consolidated Financial Statements | Financial Table of Contents | |||||||
| Millions of dollars, except per-share amounts |
Note 3
Information Relating to the Consolidated Statement of Cash Flows
| Year ended December 31 | ||||||||||||||||||||
| 2024 | 2023 | 2022 | ||||||||||||||||||
| Distributions more (less) than income from equity affiliates includes the following: | ||||||||||||||||||||
| Distributions from equity affiliates | $ | 4,230 | $ | 4,246 | $ | 3,855 | ||||||||||||||
| (Income) loss from equity affiliates | (4,596) | (5,131) | (8,585) | |||||||||||||||||
| Distributions more (less) than income from equity affiliates | $ | (366) | $ | (885) | $ | (4,730) | ||||||||||||||
| Net decrease (increase) in operating working capital was composed of the following: | ||||||||||||||||||||
| Decrease (increase) in accounts and notes receivable | $ | (932) | $ | 1,187 | $ | (2,317) | ||||||||||||||
| Decrease (increase) in inventories | (574) | (320) | (930) | |||||||||||||||||
| Decrease (increase) in prepaid expenses and other current assets | (16) | (1,202) | (226) | |||||||||||||||||
| Increase (decrease) in accounts payable and accrued liabilities | 2,569 | (49) | 2,750 | |||||||||||||||||
| Increase (decrease) in income and other taxes payable | 164 | (2,801) | 2,848 | |||||||||||||||||
| Net decrease (increase) in operating working capital | $ | 1,211 | $ | (3,185) | $ | 2,125 | ||||||||||||||
| Net cash provided by operating activities includes the following cash payments: | ||||||||||||||||||||
| Interest on debt (net of capitalized interest) | $ | 587 | $ | 465 | $ | 525 | ||||||||||||||
| Income taxes | 8,458 | 10,416 | 9,148 | |||||||||||||||||
| Proceeds and deposits related to asset sales and returns of investment consisted of the following gross amounts: | ||||||||||||||||||||
| Proceeds and deposits related to asset sales | $ | 7,509 | $ | 446 | $ | 1,435 | ||||||||||||||
| Returns of investment from equity affiliates | 195 | 223 | 1,200 | |||||||||||||||||
| Proceeds and deposits related to asset sales and returns of investment | $ | 7,704 | $ | 669 | $ | 2,635 | ||||||||||||||
| Net maturities (investments) of time deposits consisted of the following gross amounts: | ||||||||||||||||||||
| Investments in time deposits | $ | (6) | $ | — | $ | — | ||||||||||||||
| Maturities of time deposits | 2 | — | — | |||||||||||||||||
| Net maturities of (investments in) time deposits | $ | (4) | $ | — | $ | — | ||||||||||||||
| Net sales (purchases) of marketable securities consisted of the following gross amounts: | ||||||||||||||||||||
| Marketable securities purchased | $ | — | $ | (289) | $ | (7) | ||||||||||||||
| Marketable securities sold | 45 | 464 | 124 | |||||||||||||||||
| Net sales (purchases) of marketable securities | $ | 45 | $ | 175 | $ | 117 | ||||||||||||||
| Net repayment (borrowing) of loans by equity affiliates: | ||||||||||||||||||||
| Borrowing of loans by equity affiliates | $ | (304) | $ | (368) | $ | (108) | ||||||||||||||
| Repayment of loans by equity affiliates | 71 | 66 | 84 | |||||||||||||||||
| Net repayment (borrowing) of loans by equity affiliates | $ | (233) | $ | (302) | $ | (24) | ||||||||||||||
| Net borrowings (repayments) of short-term obligations consisted of the following gross and net amounts: | ||||||||||||||||||||
| Repayments of short-term obligations | $ | (840) | $ | — | $ | — | ||||||||||||||
| Proceeds from issuances of short-term debt obligations | 4,539 | — | — | |||||||||||||||||
| Net borrowings (repayments) of short-term obligations with three months or less maturity | 1,169 | 135 | 263 | |||||||||||||||||
| Net borrowings (repayments) of short-term obligations | $ | 4,868 | $ | 135 | $ | 263 | ||||||||||||||
| Net sales (purchases) of treasury shares consists of the following gross and net amounts: | ||||||||||||||||||||
| Shares issued for share-based compensation plans | $ | 330 | $ | 261 | $ | 5,838 | ||||||||||||||
| Shares purchased under share repurchase and deferred compensation plans | (15,229) | (14,939) | (11,255) | |||||||||||||||||
| Share repurchase excise tax payments | (145) | — | — | |||||||||||||||||
| Net sales (purchases) of treasury shares | $ | (15,044) | $ | (14,678) | $ | (5,417) | ||||||||||||||
| Net contributions from (distributions to) noncontrolling interests consisted of the following gross and net amounts: | ||||||||||||||||||||
| Distributions to noncontrolling interests | $ | (210) | $ | (54) | $ | (118) | ||||||||||||||
| Contributions from noncontrolling interests | 15 | 14 | 4 | |||||||||||||||||
| Net contributions from (distributions to) noncontrolling interests | $ | (195) | $ | (40) | $ | (114) | ||||||||||||||
The “Other” line in the Operating Activities section includes changes in asset retirement obligations, decommissioning obligations associated with previously divested assets, post-employment benefit obligations and other long-term liabilities. Refer also to Note 25 Asset Retirement Obligations for a discussion of the company’s AROs activity, including revisions that did not involve cash receipts or payments.
The Consolidated Statement of Cash Flows excludes changes to the Consolidated Balance Sheet that did not affect cash. “Depreciation, depletion and amortization” and “Deferred income tax provision” collectively include approximately $400
| Notes to the Consolidated Financial Statements | Financial Table of Contents | |||||||
| Millions of dollars, except per-share amounts |
in non-cash reductions to “Properties, plant and equipment” and “Investments and advances” in 2024 relating to impairments. “Operating expenses” and “Deferred income tax provision” include an approximately $715 severance charge related to non-cash increases to “Net decrease (increase) in operating working capital” and “Other” associated with employee severance. The cash outlay for severance payments is expected to take place through 2026.
The components of “Capital expenditures” are presented in the following table:
| Year ended December 31 | ||||||||||||||||||||
| 2024 | 2023 | 2022 | ||||||||||||||||||
| Additions to properties, plant and equipment* | $ | 15,544 | $ | 14,788 | $ | 10,349 | ||||||||||||||
| Additions to investments | 573 | 690 | 1,147 | |||||||||||||||||
| Current-year dry hole expenditures | 331 | 326 | 309 | |||||||||||||||||
| Payments for other assets and liabilities, net | — | 25 | 169 | |||||||||||||||||
| Capital expenditures | $ | 16,448 | $ | 15,829 | $ | 11,974 |
- Excludes non-cash movements of $395 in 2024, $1,559 in 2023 and $316 in 2022.
The table below quantifies the beginning and ending balances of restricted cash and restricted cash equivalents in the Consolidated Balance Sheet:
| Year ended December 31 | |||||||||||||||||||||||||||||
| 2024 | 2023 | 2022 | |||||||||||||||||||||||||||
| Cash and cash equivalents | $ | 6,781 | $ | 8,178 | $ | 17,678 | |||||||||||||||||||||||
| Restricted cash included in “Prepaid expenses and other current assets” | 281 | 275 | 630 | ||||||||||||||||||||||||||
| Restricted cash included in “Deferred charges and other assets” | 1,200 | 822 | 813 | ||||||||||||||||||||||||||
| Total cash, cash equivalents and restricted cash | $ | 8,262 | $ | 9,275 | $ | 19,121 |
Note 4
New Accounting Standards
Segment Reporting (Topic 280) Improvements to Reportable Segment Disclosures The company has adopted the Financial Accounting Standards Board (FASB) Accounting Standard Update (ASU) 2023-07 which is effective for fiscal years beginning after December 15, 2023, and interim periods within fiscal years beginning after December 15, 2024. The standard requires companies to disclose significant segment expenses. The adoption of this ASU did not have an impact on the company’s consolidated financial position or results of operations. For additional information, refer to Note 14 Operating Segments and Geographic Data.
Income Taxes (Topic 740) Improvements to Income Tax Disclosures In December 2023, the FASB issued ASU 2023-09, which becomes effective for fiscal years beginning after December 15, 2024. The standard requires companies to disclose specific categories in the income tax rate reconciliation table and the amount of income taxes paid per major jurisdiction. The company does not expect the standard to have a material effect on its consolidated financial statements and continues to evaluate disclosure presentation alternatives.
Income Statement (Topic 220) Reporting Comprehensive Income - Expense Disaggregation Disclosures In November 2024, the FASB issued ASU 2024-03, which becomes effective for fiscal years beginning after December 15, 2026, and interim periods within fiscal years beginning after December 15, 2027. The standard requires companies to disclose disaggregated information about certain income statement expense line items. The company does not expect the standard to have a material effect on its consolidated financial statements and has begun evaluating disclosure presentation alternatives.
Note 5
Lease Commitments
The company enters into leasing arrangements as a lessee; any lessor arrangements are not significant. Operating lease arrangements mainly involve land, bareboat charters, terminals, drill ships, drilling rigs, time chartered vessels, office buildings and warehouses, and exploration and production equipment. Finance leases primarily include facilities, vessels and office buildings.
| Notes to the Consolidated Financial Statements | Financial Table of Contents | |||||||
| Millions of dollars, except per-share amounts |
Details of the right-of-use assets and lease liabilities for operating and finance leases, including the balance sheet presentation, are as follows:
| At December 31, 2024 | At December 31, 2023 | ||||||||||||||||||||||
| Operating Leases | Finance Leases | Operating Leases | Finance Leases | ||||||||||||||||||||
| Deferred charges and other assets | $ | 5,315 | $ | — | $ | 5,422 | $ | — | |||||||||||||||
| Properties, plant and equipment, net | — | 570 | — | 583 | |||||||||||||||||||
| Right-of-use assets* | $ | 5,315 | $ | 570 | $ | 5,422 | $ | 583 | |||||||||||||||
| Accrued liabilities | $ | 1,519 | $ | — | $ | 1,538 | $ | — | |||||||||||||||
| Short-term debt | — | 58 | — | 60 | |||||||||||||||||||
| Current lease liabilities | 1,519 | 58 | 1,538 | 60 | |||||||||||||||||||
| Deferred credits and other noncurrent obligations | 3,551 | — | 3,696 | — | |||||||||||||||||||
| Long-term debt | — | 546 | — | 574 | |||||||||||||||||||
| Noncurrent lease liabilities | 3,551 | 546 | 3,696 | 574 | |||||||||||||||||||
| Total lease liabilities | $ | 5,070 | $ | 604 | $ | 5,234 | $ | 634 | |||||||||||||||
| Weighted-average remaining lease term (in years) | 6.3 | 13.2 | 6.7 | 12.6 | |||||||||||||||||||
| Weighted-average discount rate | 3.7 | % | 4.6 | % | 3.3 | % | 4.5 | % |
- Includes non-cash additions of $2,205 and $40 in 2024, and $2,556 and $233 in 2023 for right-of-use assets obtained in exchange for new and modified lease liabilities for operating and finance leases, respectively.
Total lease costs consist of both amounts recognized in the Consolidated Statement of Income during the period and amounts capitalized as part of the cost of another asset. Total lease costs incurred for operating and finance leases were as follows:
| Year-ended December 31 | |||||||||||||||||
| 2024 | 2023 | 2022 | |||||||||||||||
| Operating lease costs* | $ | 3,447 | $ | 2,984 | $ | 2,359 | |||||||||||
| Finance lease costs | 83 | 52 | 57 | ||||||||||||||
| Total lease costs | $ | 3,530 | $ | 3,036 | $ | 2,416 |
- Includes variable and short-term lease costs.
Cash paid for amounts included in the measurement of lease liabilities was as follows:
| Year-ended December 31 | |||||||||||||||||
| 2024 | 2023 | 2022 | |||||||||||||||
| Operating cash flows from operating leases | $ | 2,468 | $ | 2,271 | $ | 1,892 | |||||||||||
| Investing cash flows from operating leases | 979 | 713 | 467 | ||||||||||||||
| Operating cash flows from finance leases | 26 | 15 | 18 | ||||||||||||||
| Financing cash flows from finance leases | 67 | 42 | 44 |
At December 31, 2024, the estimated future undiscounted cash flows for operating and finance leases were as follows:
| At December 31, 2024 | ||||||||||||||
| Operating Leases | Finance Leases | |||||||||||||
| Year | 2025 | $ | 1,665 | $ | 83 | |||||||||
| 2026 | 1,162 | 80 | ||||||||||||
| 2027 | 833 | 73 | ||||||||||||
| 2028 | 555 | 69 | ||||||||||||
| 2029 | 275 | 64 | ||||||||||||
| Thereafter | 1,276 | 445 | ||||||||||||
| Total | $ | 5,766 | $ | 814 | ||||||||||
| Less: Amounts representing interest | 696 | 210 | ||||||||||||
| Total lease liabilities | $ | 5,070 | $ | 604 |
Additionally, the company has $403 in future undiscounted cash flows for operating leases not yet commenced. These leases are primarily for drilling rigs, time chartered vessels, exploration and production equipment and storage tanks. For
| Notes to the Consolidated Financial Statements | Financial Table of Contents | |||||||
| Millions of dollars, except per-share amounts |
those leasing arrangements where the underlying asset is not yet constructed, the lessor is primarily involved in the design and construction of the asset.
Note 6
Summarized Financial Data – Chevron U.S.A. Inc.
Chevron U.S.A. Inc. (CUSA) is a major subsidiary of Chevron Corporation. CUSA and its subsidiaries manage and operate most of Chevron’s U.S. businesses. Assets include those related to the exploration and production of crude oil, natural gas, and natural gas liquids (NGLs) and those associated with the refining, marketing, supply and distribution of products derived from petroleum, excluding most of the regulated pipeline operations of Chevron. CUSA also holds the company’s investment in the Chevron Phillips Chemical Company LLC joint venture, which is accounted for using the equity method. The summarized financial information for CUSA and its consolidated subsidiaries is as follows:
| Year ended December 31 | ||||||||||||||||||||
| 2024 | 2023 | 2022 | ||||||||||||||||||
| Sales and other operating revenues | $ | 149,925 | $ | 152,347 | $ | 183,032 | ||||||||||||||
| Total costs and other deductions | 145,582 | 144,482 | 166,955 | |||||||||||||||||
| Net income (loss) attributable to CUSA | 4,151 | 4,598 | 13,315 |
| At December 31 | ||||||||||||||
| 2024 | 2023 | |||||||||||||
| Current assets | $ | 20,153 | $ | 19,489 | ||||||||||
| Other assets | 58,485 | 54,460 | ||||||||||||
| Current liabilities | 25,825 | 20,624 | ||||||||||||
| Other liabilities | 21,455 | 22,227 | ||||||||||||
| Total CUSA net equity | $ | 31,358 | $ | 31,098 | ||||||||||
| Memo: Total debt | $ | 8,917 | $ | 9,740 |
Note 7
Summarized Financial Data – Tengizchevroil LLP
Chevron has a 50 percent equity ownership interest in Tengizchevroil LLP (TCO). Refer to Note 15 Investments and Advances for a discussion of TCO operations. Summarized financial information for 100 percent of TCO is presented in the table below:
| Year ended December 31 | ||||||||||||||||||||
| 2024 | 2023 | 2022 | ||||||||||||||||||
| Sales and other operating revenues | $ | 18,872 | $ | 19,758 | $ | 23,975 | ||||||||||||||
| Costs and other deductions | 10,616 | 10,193 | 11,956 | |||||||||||||||||
| Net income attributable to TCO | 5,779 | 6,569 | 8,566 |
| At December 31 | ||||||||||||||
| 2024 | 2023 | |||||||||||||
| Current assets | $ | 4,753 | $ | 3,919 | ||||||||||
| Other assets | 58,057 | 57,454 | ||||||||||||
| Current liabilities | 3,203 | 2,372 | ||||||||||||
| Other liabilities | 12,459 | 12,782 | ||||||||||||
| Total TCO net equity | $ | 47,148 | $ | 46,219 |
Note 8
Restructuring and Reorganization Costs
In 2024, the company announced plans to achieve $2-3 billion in structural cost reductions by the end of 2026. As a result, the company recorded severance accruals during fourth quarter 2024 for employee reduction programs related to an enterprise-wide restructuring, which is expected to be substantially completed by the end of 2026.
A charge of $980 was recorded in fourth quarter 2024, with $706 reported as “Operating expenses” and $274 reported as “Selling, general and administrative expenses” on the Consolidated Statement of Income. Approximately $240 is associated with employee reductions in U.S. Upstream, $197 in International Upstream, $247 in U.S. Downstream, $22 in International Downstream and $274 in All Other. Approximately $560 is classified as current and $430 is classified as long-term on the Consolidated Balance Sheet at December 31, 2024.
| Notes to the Consolidated Financial Statements | Financial Table of Contents | |||||||
| Millions of dollars, except per-share amounts |
The following table summarizes the accrued severance liability.
| Amounts Before Tax | |||||
| Balance at January 1, 2024 | $ | 6 | |||
| Accruals/Adjustments | 987 | ||||
| Payments | (3) | ||||
| Balance at December 31, 2024 | $ | 990 |
Note 9
Fair Value Measurements
Marketable Securities The company calculates fair value for its marketable securities based on quoted market prices for identical assets. The fair values reflect the cash that would have been received if the instruments were sold at December 31, 2024.
Derivatives The company records most of its derivative instruments – other than any commodity derivative contracts that are accounted for as normal purchase and normal sale – on the Consolidated Balance Sheet at fair value, with the offsetting amount to the Consolidated Statement of Income. The company designates certain derivative instruments as cash flow hedges, if applicable. Derivatives classified as Level 1 include futures, swaps and options contracts valued using quoted prices from active markets such as the New York Mercantile Exchange. Derivatives classified as Level 2 include swaps, options and forward contracts, the fair values of which are obtained from third-party broker quotes, industry pricing services and exchanges. The company obtains multiple sources of pricing information for the Level 2 instruments. Since this pricing information is generated from observable market data, it has historically been very consistent. The company does not materially adjust this information.
Properties, Plant and Equipment In 2024, the company did not have any individually material impairments of long lived assets measured at fair value on a nonrecurring basis. In 2023, the company impaired a portion of its U.S. upstream assets, primarily in California, due to continuing regulatory challenges in the state that have resulted in lower anticipated future investment levels in its business plans.
Investments and Advances The company did not have any material impairments of investments and advances measured at fair value on a nonrecurring basis to report in 2024 or 2023.
The tables below show the fair value hierarchy for assets and liabilities measured at fair value on a recurring and nonrecurring basis at December 31, 2024 and 2023.
Assets and Liabilities Measured at Fair Value on a Recurring Basis
| At December 31, 2024 | At December 31, 2023 | ||||||||||||||||||||||||||||||||||||||||||||||
| Total | Level 1 | Level 2 | Level 3 | Total | Level 1 | Level 2 | Level 3 | ||||||||||||||||||||||||||||||||||||||||
| Marketable securities | $ | — | $ | — | $ | — | $ | — | $ | 45 | $ | 45 | $ | — | $ | — | |||||||||||||||||||||||||||||||
| Derivatives - not designated | 137 | 127 | 10 | — | 152 | 24 | 128 | — | |||||||||||||||||||||||||||||||||||||||
| Derivatives - designated | — | — | — | — | 7 | 7 | — | — | |||||||||||||||||||||||||||||||||||||||
| Total assets at fair value | $ | 137 | $ | 127 | $ | 10 | $ | — | $ | 204 | $ | 76 | $ | 128 | $ | — | |||||||||||||||||||||||||||||||
| Derivatives - not designated | 136 | 47 | 89 | — | 262 | 160 | 102 | — | |||||||||||||||||||||||||||||||||||||||
| Derivatives - designated | 17 | 17 | — | — | — | — | — | — | |||||||||||||||||||||||||||||||||||||||
| Total liabilities at fair value | $ | 153 | $ | 64 | $ | 89 | $ | — | $ | 262 | $ | 160 | $ | 102 | $ | — |
Assets and Liabilities Measured at Fair Value on a Nonrecurring Basis
| At December 31 | At December 31 | |||||||||||||||||||||||||||||||
| Before-Tax Loss | Before-Tax Loss | |||||||||||||||||||||||||||||||
| Total | Level 1 | Level 2 | Level 3 | Year 2024 | Total | Level 1 | Level 2 | Level 3 | Year 2023 | |||||||||||||||||||||||
| Properties, plant and equipment, net (held and used) | $ | 324 | $ | — | $ | — | $ | 324 | $ | 226 | $ | 484 | $ | — | $ | — | $ | 484 | $ | 2,175 | ||||||||||||
| Properties, plant and equipment, net (held for sale) | 616 | — | 616 | — | 274 | — | — | — | — | 5 | ||||||||||||||||||||||
| Investments and advances | 36 | — | 36 | — | 289 | 207 | 5 | 165 | 37 | 352 | ||||||||||||||||||||||
| Total nonrecurring assets at fair value | $ | 976 | $ | — | $ | 652 | $ | 324 | $ | 789 | $ | 691 | $ | 5 | $ | 165 | $ | 521 | $ | 2,532 |
| Notes to the Consolidated Financial Statements | Financial Table of Contents | |||||||
| Millions of dollars, except per-share amounts |
At year-end 2024, the company had assets measured at fair value Level 3 using unobservable inputs of $324. The carrying value of these assets were written down to fair value based on estimates derived from discounted cash flow models. Cash flows were determined using estimates of future production, an outlook of future price based on published prices and a discount rate believed to be consistent with those used by principal market participants.
Assets and Liabilities Not Required to Be Measured at Fair Value The company holds cash equivalents in U.S. and non-U.S. portfolios. The instruments classified as cash equivalents are primarily bank time deposits with maturities of 90 days or less and money market funds. “Cash and cash equivalents” had carrying/fair values of $6,781 and $8,178 at December 31, 2024, and December 31, 2023, respectively. The fair values of cash and cash equivalents are classified as Level 1 and reflect the cash that would have been received if the instruments were settled at December 31, 2024.
“Cash and cash equivalents” do not include investments with a carrying/fair value of $1,481 and $1,097 at December 31, 2024, and December 31, 2023, respectively. At December 31, 2024, these investments are classified as Level 1 and include restricted funds mainly related to certain upstream decommissioning activities, a tax-deferred transaction and financing programs.
Long-term debt, excluding finance lease liabilities, of $10,810 and $14,612 at December 31, 2024, and December 31, 2023, respectively, had estimated fair values of $9,791 and $13,709, respectively. Long-term debt primarily includes corporate issued bonds. At December 31, 2024, the fair value of corporate bonds is $9,243 and classified as Level 1 and the fair value of other long-term debt classified as Level 2 is $548.
The carrying values of other short-term financial assets and liabilities on the Consolidated Balance Sheet approximate their fair values. Fair value remeasurements of other financial instruments at December 31, 2024 and 2023, were not material.
Note 10
Financial and Derivative Instruments
Derivative Commodity Instruments The company’s derivative commodity instruments principally include crude oil, natural gas, liquefied natural gas and refined product futures, swaps, options, and forward contracts. The company applies cash flow hedge accounting to certain commodity transactions, where appropriate, to manage the market price risk associated with forecasted sales of crude oil. The company’s derivatives are not material to the company’s financial position, results of operations or liquidity. The company believes it has no material market or credit risks to its operations, financial position or liquidity as a result of its commodity derivative activities.
The company uses derivative commodity instruments traded on the New York Mercantile Exchange and on electronic platforms of the Inter-Continental Exchange and Chicago Mercantile Exchange. In addition, the company enters into swap contracts and option contracts principally with major financial institutions and other oil and gas companies in the “over-the-counter” markets, which are governed by International Swaps and Derivatives Association agreements and other master netting arrangements. Depending on the nature of the derivative transactions, bilateral collateral arrangements may also be required.
Derivative instruments measured at fair value at December 31, 2024, 2023 and 2022, and their classification on the Consolidated Balance Sheet and Consolidated Statement of Income are as follows:
Consolidated Balance Sheet: Fair Value of Derivatives
| At December 31 | |||||||||||||||||
| Type of Contract | Balance Sheet Classification | 2024 | 2023 | ||||||||||||||
| Commodity | Accounts and notes receivable | $ | 122 | $ | 151 | ||||||||||||
| Commodity | Long-term receivables, net | 15 | 8 | ||||||||||||||
| Total assets at fair value | $ | 137 | $ | 159 | |||||||||||||
| Commodity | Accounts payable | $ | 127 | $ | 216 | ||||||||||||
| Commodity | Deferred credits and other noncurrent obligations | 26 | 46 | ||||||||||||||
| Total liabilities at fair value | $ | 153 | $ | 262 |
| Notes to the Consolidated Financial Statements | Financial Table of Contents | |||||||
| Millions of dollars, except per-share amounts |
Consolidated Statement of Income: The Effect of Derivatives
| Gain/(Loss) | |||||||||||||||||||||||
| Year ended December 31 | |||||||||||||||||||||||
| Type of Contract | Statement of Income Classification | 2024 | 2023 | 2022 | |||||||||||||||||||
| Commodity | Sales and other operating revenues | $ | (57) | $ | (304) | $ | (651) | ||||||||||||||||
| Commodity | Purchased crude oil and products | 28 | (154) | (226) | |||||||||||||||||||
| Commodity | Other income (loss) | 6 | (47) | 10 | |||||||||||||||||||
| $ | (23) | $ | (505) | $ | (867) |
The amount reclassified from AOCL to “Sales and other operating revenues” from designated hedges was a net loss of $25 in 2024, compared with a net loss of $33 in the prior year. At December 31, 2024, before-tax deferred losses in AOCL related to outstanding crude oil price hedging contracts were $17, all of which is expected to be reclassified into earnings during the next 12 months as the hedged crude oil sales are recognized in earnings.
The table below represents gross and net derivative assets and liabilities subject to netting agreements on the Consolidated Balance Sheet at December 31, 2024 and 2023.
Consolidated Balance Sheet: The Effect of Netting Derivative Assets and Liabilities
| Gross Amounts Recognized | Gross Amounts Offset | Net Amounts Presented | Gross Amounts Not Offset | Net Amounts | ||||||||||||||||||||||||||||
| At December 31, 2024 | ||||||||||||||||||||||||||||||||
| Derivative Assets - not designated | $ | 1,895 | $ | 1,758 | $ | 137 | $ | 3 | $ | 134 | ||||||||||||||||||||||
| Derivative Assets - designated | $ | — | $ | — | $ | — | $ | — | $ | — | ||||||||||||||||||||||
| Derivative Liabilities - not designated | $ | 1,894 | $ | 1,758 | $ | 136 | $ | 2 | $ | 134 | ||||||||||||||||||||||
| Derivative Liabilities - designated | $ | 17 | $ | — | $ | 17 | $ | — | $ | 17 | ||||||||||||||||||||||
| At December 31, 2023 | ||||||||||||||||||||||||||||||||
| Derivative Assets - not designated | $ | 2,394 | $ | 2,242 | $ | 152 | $ | 4 | $ | 148 | ||||||||||||||||||||||
| Derivative Assets - designated | $ | 8 | $ | 1 | $ | 7 | $ | — | $ | 7 | ||||||||||||||||||||||
| Derivative Liabilities - not designated | $ | 2,504 | $ | 2,242 | $ | 262 | $ | 15 | $ | 247 | ||||||||||||||||||||||
| Derivative Liabilities - designated | $ | 1 | $ | 1 | $ | — | $ | — | $ | — | ||||||||||||||||||||||
Derivative assets and liabilities are classified on the Consolidated Balance Sheet as “Accounts and notes receivable,” “Long-term receivables,” “Accounts payable,” and “Deferred credits and other noncurrent obligations.” Amounts not offset on the Consolidated Balance Sheet represent positions that do not meet all the conditions for “a right of offset.”
Concentrations of Credit Risk The company’s financial instruments that are exposed to concentrations of credit risk consist primarily of its cash equivalents, marketable securities, derivative financial instruments and trade receivables. The company’s short-term investments are placed with a wide array of financial institutions with high credit ratings. Company investment policies limit the company’s exposure both to credit risk and to concentrations of credit risk. Similar policies on diversification and creditworthiness are applied to the company’s counterparties in derivative instruments. For a discussion of credit risk on trade receivables, see Note 28 Financial Instruments - Credit Losses.
Note 11
Assets Held for Sale
At December 31, 2024, the company classified $481 of net properties, plant and equipment as “Assets held for sale” on the Consolidated Balance Sheet. These assets are associated with upstream and downstream operations that were sold in early 2025, or are anticipated to be sold in the next 12 months. The revenues and earnings contributions of these assets in 2024 were not material.
Note 12
Equity
Retained earnings at December 31, 2024 and 2023, included $35,349 and $34,359, respectively, for the company’s share of undistributed earnings of equity affiliates.
At December 31, 2024, about 96 million shares of Chevron’s common stock remained available for issuance from the 104 million shares that were reserved for issuance under the 2022 Chevron Long-Term Incentive Plan. In addition, 559,513 shares remain available for issuance from the 1,600,000 shares of the company’s common stock that were reserved for awards under the Chevron Corporation Non-Employee Directors’ Equity Compensation and Deferral Plan.
| Notes to the Consolidated Financial Statements | Financial Table of Contents | |||||||
| Millions of dollars, except per-share amounts |
Note 13
Earnings Per Share
Basic earnings per share (EPS) is based upon “Net Income (Loss) Attributable to Chevron Corporation” (“earnings”) and includes the effects of deferrals of salary and other compensation awards that are invested in Chevron stock units by certain officers and employees of the company. Diluted EPS includes the effects of these items as well as the dilutive effects of outstanding stock options awarded under the company’s stock option programs (refer to Note 22 Stock Options and Other Share-Based Compensation). The table below sets forth the computation of basic and diluted EPS:
| Year ended December 31 | ||||||||||||||||||||
| 2024 | 2023 | 2022 | ||||||||||||||||||
| Basic EPS Calculation | ||||||||||||||||||||
| Earnings available to common stockholders - Basic* | $ | 17,661 | $ | 21,369 | $ | 35,465 | ||||||||||||||
| Weighted-average number of common shares outstanding | 1,810 | 1,873 | 1,931 | |||||||||||||||||
| Add: Deferred awards held as stock units | — | — | — | |||||||||||||||||
| Total weighted-average number of common shares outstanding | 1,810 | 1,873 | 1,931 | |||||||||||||||||
| Earnings per share of common stock - Basic | $ | 9.76 | $ | 11.41 | $ | 18.36 | ||||||||||||||
| Diluted EPS Calculation | ||||||||||||||||||||
| Earnings available to common stockholders - Diluted* | $ | 17,661 | $ | 21,369 | $ | 35,465 | ||||||||||||||
| Weighted-average number of common shares outstanding | 1,810 | 1,873 | 1,931 | |||||||||||||||||
| Add: Deferred awards held as stock units | — | — | — | |||||||||||||||||
| Add: Dilutive effect of employee stock-based awards | 7 | 7 | 9 | |||||||||||||||||
| Total weighted-average number of common shares outstanding | 1,817 | 1,880 | 1,940 | |||||||||||||||||
| Earnings per share of common stock - Diluted | $ | 9.72 | $ | 11.36 | $ | 18.28 | ||||||||||||||
| * There was no effect of dividend equivalents paid on stock units or dilutive impact of employee stock-based awards on earnings. | ||||||||||||||||||||
Note 14
Operating Segments and Geographic Data
Although each subsidiary of Chevron is responsible for its own affairs, Chevron Corporation manages its investments in these subsidiaries and their affiliates. The investments are grouped into two business segments, Upstream and Downstream, representing the company’s “reportable segments” and “operating segments.” Upstream operations consist primarily of exploring for, developing, producing and transporting crude oil and natural gas; liquefaction, transportation and regasification associated with LNG; transporting crude oil by major international oil export pipelines; processing, transporting, storage and marketing of natural gas; carbon capture and storage; and a gas-to-liquids plant. Downstream operations consist primarily of refining of crude oil into petroleum products; marketing of crude oil, refined products, and lubricants; manufacturing and marketing of renewable fuels; transporting of crude oil and refined products by pipeline, marine vessel, motor equipment and rail car; and manufacturing and marketing of commodity petrochemicals, plastics for industrial uses, and fuel and lubricant additives. All Other activities of the company include worldwide cash management and debt financing activities, corporate administrative functions, insurance operations, real estate activities, and technology activities.
The company’s segments are managed by “segment managers” who report to the “chief operating decision maker” (CODM), which is comprised of the company’s Executive Committee, as referenced in Item 10 Executive Officers.
The segments represent components of the company that engage in activities from which revenues are earned and expenses are incurred. Each segment has discrete financial information available. The CODM regularly reviews the operating results of these segments to assess their performance and make decisions about resources to be allocated to the segments. The company's primary country of operation is the United States of America, its country of domicile, while other components of the company's operations are reported as “International” (outside the United States).
Segment Sales and Other Operating Revenues Products are transferred between operating segments at internal product values that approximate market prices. Revenues for the upstream segment are derived primarily from the production and sale of crude oil, natural gas and NGLs, as well as the sale of third-party production of natural gas. Revenues for the downstream segment are derived from the refining and marketing of petroleum products such as gasoline, jet fuel, gas oils, lubricants, residual fuel oils and other products derived from crude oil. This segment also generates revenues from the manufacture and sale of fuel and lubricant additives, renewable fuels, and the transportation and trading of refined products and crude oil. “All Other” activities include revenues from insurance operations, real estate activities and technology companies.
| Notes to the Consolidated Financial Statements | Financial Table of Contents | |||||||
| Millions of dollars, except per-share amounts |
Segment Expenses Purchased crude oil and products, operating and selling, general and administrative (SG&A) expense, and depreciation, depletion and amortization are the company’s significant segment expenses. Operating and SG&A expenses include transportation, employee costs, service and fees, fuel and utilities, materials and supplies, SG&A expenses and other components of periodic benefit costs. Other costs and deductions primarily represent taxes other than on income, exploration expense and interest and debt expenses.
Segment Earnings The company evaluates the performance of its operating segments on an after-tax basis, without considering the effects of debt financing interest expense or investment interest income, both of which are managed by the company on a worldwide basis. Corporate administrative costs are not allocated to the operating segments. However, operating segments are billed for the direct use of corporate services. Non-billable costs remain at the corporate level in “All Other.”
Segmented income statements for the years ended December 31, 2024, 2023 and 2022 are presented below:
| Upstream | Downstream | Segment Total | All Other | Total | |||||||||||||||||||
| Year Ended December 31, 2024 | U.S. | Int'l. | U.S. | Int'l. | |||||||||||||||||||
| Sales and other operating revenues before elimination | $ | 44,302 | $ | 43,466 | $ | 80,417 | $ | 77,430 | $ | 245,615 | $ | 617 | $ | 246,232 | |||||||||
| Intersegment revenue elimination | (29,662) | (11,258) | (9,745) | (1,668) | (52,333) | (485) | (52,818) | ||||||||||||||||
| Sales and Other Operating Revenues | 14,640 | 32,208 | 70,672 | 75,762 | 193,282 | 132 | 193,414 | ||||||||||||||||
| Income (loss) from equity affiliates | (62) | 3,642 | 1,010 | 10 | 4,600 | (4) | 4,596 | ||||||||||||||||
| Other income (loss)1 | 346 | 3,460 | 358 | 96 | 4,260 | 522 | 4,782 | ||||||||||||||||
| Total Revenues and Other Income | 14,924 | 39,310 | 72,040 | 75,868 | 202,142 | 650 | 202,792 | ||||||||||||||||
| Intersegment product transfers2 | 25,305 | 4,190 | (26,845) | (2,833) | (183) | 183 | — | ||||||||||||||||
| Less expenses: | |||||||||||||||||||||||
| Purchased crude oil and products | 13,326 | 9,445 | 33,514 | 62,921 | 119,206 | — | 119,206 | ||||||||||||||||
| Operating and SG&A expenses | 7,708 | 6,412 | 9,425 | 6,034 | 29,579 | 2,914 | 32,493 | ||||||||||||||||
| Depreciation, depletion and amortization | 7,562 | 7,935 | 1,091 | 360 | 16,948 | 334 | 17,282 | ||||||||||||||||
| Other costs and deductions3 | 1,805 | 1,156 | 550 | 2,071 | 5,582 | 723 | 6,305 | ||||||||||||||||
| Total Costs and Other Deductions | 30,401 | 24,948 | 44,580 | 71,386 | 171,315 | 3,971 | 175,286 | ||||||||||||||||
| Income Tax Expense (Benefit) | 2,198 | 7,548 | 84 | 397 | 10,227 | (470) | 9,757 | ||||||||||||||||
| Less: Net income (loss) attributable to non-controlling interests | 28 | 4 | — | 56 | 88 | — | 88 | ||||||||||||||||
| Net Income (Loss) Attributable to Chevron Corporation | $ | 7,602 | $ | 11,000 | $ | 531 | $ | 1,196 | $ | 20,329 | $ | (2,668) | $ | 17,661 | |||||||||
| Values have been adjusted for eliminations, unless otherwise specified. | |||||||||||||||||||||||
| 1 Includes interest income of $296 in “All Other.” | |||||||||||||||||||||||
| 2 Valuation of product transfers between operating segments. | |||||||||||||||||||||||
| 3 Includes interest expense of $539 in “All Other.” |
| Notes to the Consolidated Financial Statements | Financial Table of Contents | |||||||
| Millions of dollars, except per-share amounts |
| Upstream | Downstream | Segment Total | All Other | Total | |||||||||||||||||||
| Year ended December 31, 2023 | U.S. | Int'l. | U.S. | Int'l. | |||||||||||||||||||
| Sales and other operating revenues before elimination | $ | 40,115 | $ | 43,805 | $ | 83,567 | $ | 78,058 | $ | 245,545 | $ | 597 | $ | 246,142 | |||||||||
| Intersegment revenue elimination | (26,307) | (11,871) | (8,793) | (1,794) | (48,765) | (464) | (49,229) | ||||||||||||||||
| Sales and Other Operating Revenues | 13,808 | 31,934 | 74,774 | 76,264 | 196,780 | 133 | 196,913 | ||||||||||||||||
| Income (loss) from equity affiliates | (387) | 4,272 | 736 | 519 | 5,140 | (9) | 5,131 | ||||||||||||||||
| Other income (loss)1 | (2,536) | 776 | 444 | 39 | (1,277) | 182 | (1,095) | ||||||||||||||||
| Total Revenues and Other Income | 10,885 | 36,982 | 75,954 | 76,822 | 200,643 | 306 | 200,949 | ||||||||||||||||
| Intersegment product transfers2 | 23,665 | 4,274 | (23,887) | (4,184) | (132) | 132 | — | ||||||||||||||||
| Less expenses: | |||||||||||||||||||||||
| Purchased crude oil and products | 13,019 | 7,270 | 37,176 | 61,731 | 119,196 | — | 119,196 | ||||||||||||||||
| Operating and SG&A expenses | 6,879 | 5,837 | 8,432 | 6,058 | 27,206 | 2,034 | 29,240 | ||||||||||||||||
| Depreciation, depletion and amortization | 7,666 | 8,109 | 931 | 301 | 17,007 | 319 | 17,326 | ||||||||||||||||
| Other costs and deductions3 | 1,676 | 1,010 | 515 | 1,782 | 4,983 | 620 | 5,603 | ||||||||||||||||
| Total Costs and Other Deductions | 29,240 | 22,226 | 47,054 | 69,872 | 168,392 | 2,973 | 171,365 | ||||||||||||||||
| Income Tax Expense (Benefit) | 1,141 | 5,733 | 1,109 | 519 | 8,502 | (329) | 8,173 | ||||||||||||||||
| Less: Net income (loss) attributable to non-controlling interests | 21 | 7 | — | 14 | 42 | — | 42 | ||||||||||||||||
| Net Income (Loss) Attributable to Chevron Corporation | $ | 4,148 | $ | 13,290 | $ | 3,904 | $ | 2,233 | $ | 23,575 | $ | (2,206) | $ | 21,369 | |||||||||
| Values have been adjusted for eliminations, unless otherwise specified. | |||||||||||||||||||||||
| 1 Includes interest income of $491 in “All Other.” | |||||||||||||||||||||||
| 2 Valuation of product transfers between operating segments. | |||||||||||||||||||||||
| 3 Includes interest expense of $432 in “All Other.” |
| Upstream | Downstream | Segment Total | All Other | Total | |||||||||||||||||||
| Year Ended December 31, 2022 | U.S. | Int'l. | U.S. | Int'l. | |||||||||||||||||||
| Sales and other operating revenues before elimination | $ | 50,822 | $ | 56,156 | $ | 91,824 | $ | 87,741 | $ | 286,543 | $ | 518 | $ | 287,061 | |||||||||
| Intersegment revenue elimination | (29,870) | (13,815) | (5,529) | (1,728) | (50,942) | (402) | (51,344) | ||||||||||||||||
| Sales and Other Operating Revenues | 20,952 | 42,341 | 86,295 | 86,013 | 235,601 | 116 | 235,717 | ||||||||||||||||
| Income (loss) from equity affiliates | (22) | 6,648 | 1,003 | 962 | 8,591 | (6) | 8,585 | ||||||||||||||||
| Other income (loss)1 | 103 | 1,272 | 527 | (8) | 1,894 | 56 | 1,950 | ||||||||||||||||
| Total Revenues and Other Income | 21,033 | 50,261 | 87,825 | 86,967 | 246,086 | 166 | 246,252 | ||||||||||||||||
| Intersegment product transfers2 | 29,801 | 7,078 | (31,245) | (5,706) | (72) | 72 | — | ||||||||||||||||
| Less expenses: | |||||||||||||||||||||||
| Purchased crude oil and products | 21,008 | 12,717 | 40,483 | 71,208 | 145,416 | — | 145,416 | ||||||||||||||||
| Operating and SG&A expenses | 6,799 | 6,810 | 7,829 | 5,094 | 26,532 | 2,789 | 29,321 | ||||||||||||||||
| Depreciation, depletion and amortization | 5,012 | 9,830 | 913 | 311 | 16,066 | 253 | 16,319 | ||||||||||||||||
| Other costs and deductions3 | 1,699 | 1,230 | 446 | 1,515 | 4,890 | 632 | 5,522 | ||||||||||||||||
| Total Costs and Other Deductions | 34,518 | 30,587 | 49,671 | 78,128 | 192,904 | 3,674 | 196,578 | ||||||||||||||||
| Income Tax Expense (Benefit) | 3,678 | 9,055 | 1,515 | 280 | 14,528 | (462) | 14,066 | ||||||||||||||||
| Less: Net income (loss) attributable to non-controlling interests | 17 | 34 | — | 92 | 143 | — | 143 | ||||||||||||||||
| Net Income (Loss) Attributable to Chevron Corporation | $ | 12,621 | $ | 17,663 | $ | 5,394 | $ | 2,761 | $ | 38,439 | $ | (2,974) | $ | 35,465 | |||||||||
| Values have been adjusted for eliminations, unless otherwise specified. | |||||||||||||||||||||||
| 1 Includes interest income of $261 in “All Other.” | |||||||||||||||||||||||
| 2 Valuation of product transfers between operating segments. | |||||||||||||||||||||||
| 3 Includes interest expense of $476 in “All Other.” |
| Notes to the Consolidated Financial Statements | Financial Table of Contents | |||||||
| Millions of dollars, except per-share amounts |
Segment Assets Segment assets do not include intercompany investments or receivables. Assets at year-end 2024 and 2023 are as follows:
| At December 31 | ||||||||||||||
| 2024 | 2023 | |||||||||||||
| Upstream | ||||||||||||||
| United States | $ | 60,914 | $ | 58,750 | ||||||||||
| International | 123,343 | 131,685 | ||||||||||||
| Goodwill | 4,226 | 4,370 | ||||||||||||
| Total Upstream | 188,483 | 194,805 | ||||||||||||
| Downstream | ||||||||||||||
| United States | 34,253 | 33,066 | ||||||||||||
| International | 22,165 | 21,070 | ||||||||||||
| Goodwill | 352 | 352 | ||||||||||||
| Total Downstream | 56,770 | 54,488 | ||||||||||||
| Total Segment Assets | 245,253 | 249,293 | ||||||||||||
| All Other | ||||||||||||||
| United States | 8,382 | 10,292 | ||||||||||||
| International | 3,303 | 2,047 | ||||||||||||
| Total All Other | 11,685 | 12,339 | ||||||||||||
| Total Assets – United States | 103,549 | 102,108 | ||||||||||||
| Total Assets – International | 148,811 | 154,802 | ||||||||||||
| Goodwill | 4,578 | 4,722 | ||||||||||||
| Total Assets | $ | 256,938 | $ | 261,632 |
Other Segment Information Additional information for the segmentation of major equity affiliates is contained in Note 15 Investments and Advances. Information related to properties, plant and equipment by segment is contained in Note 18 Properties, Plant and Equipment. Information related to unusual items is contained in Note 27 Other Financial Information.
Note 15
Investments and Advances
Equity in earnings, together with investments in and advances to companies accounted for using the equity method and other investments accounted for at or below cost, is shown in the following table. For certain equity affiliates, Chevron pays its share of some income taxes directly. For such affiliates, the equity in earnings does not include these taxes, which are reported on the Consolidated Statement of Income as “Income tax expense.”
| Investments and Advances | Equity in Earnings | ||||||||||||||||||||||||||||
| At December 31 | Year ended December 31 | ||||||||||||||||||||||||||||
| 2024 | 2023 | 2024 | 2023 | 2022 | |||||||||||||||||||||||||
| Upstream | |||||||||||||||||||||||||||||
| Tengizchevroil | $ | 27,368 | $ | 26,954 | $ | 3,033 | $ | 3,375 | $ | 4,386 | |||||||||||||||||||
| Caspian Pipeline Consortium | 719 | 797 | 180 | 158 | 128 | ||||||||||||||||||||||||
| Angola LNG Limited | 1,665 | 1,762 | 405 | 513 | 1,857 | ||||||||||||||||||||||||
| Other | 1,716 | 2,106 | (38) | (161) | 255 | ||||||||||||||||||||||||
| Total Upstream | 31,468 | 31,619 | 3,580 | 3,885 | 6,626 | ||||||||||||||||||||||||
| Downstream | |||||||||||||||||||||||||||||
| Chevron Phillips Chemical Company LLC | 8,571 | 7,765 | 903 | 608 | 867 | ||||||||||||||||||||||||
| GS Caltex Corporation | 4,144 | 4,309 | 58 | 437 | 874 | ||||||||||||||||||||||||
| Other | 2,432 | 2,426 | 60 | 210 | 224 | ||||||||||||||||||||||||
| Total Downstream | 15,147 | 14,500 | 1,021 | 1,255 | 1,965 | ||||||||||||||||||||||||
| All Other | |||||||||||||||||||||||||||||
| Other | 3 | (6) | (5) | (9) | (6) | ||||||||||||||||||||||||
| Total equity method | $ | 46,618 | $ | 46,113 | $ | 4,596 | $ | 5,131 | $ | 8,585 | |||||||||||||||||||
| Other non-equity method investments | 820 | 699 | |||||||||||||||||||||||||||
| Total investments and advances | $ | 47,438 | $ | 46,812 | |||||||||||||||||||||||||
| Total United States | $ | 11,960 | $ | 10,985 | $ | 944 | $ | 340 | $ | 975 | |||||||||||||||||||
| Total International | $ | 35,478 | $ | 35,827 | $ | 3,652 | $ | 4,791 | $ | 7,610 |
| Notes to the Consolidated Financial Statements | Financial Table of Contents | |||||||
| Millions of dollars, except per-share amounts |
Descriptions of major equity affiliates and non-equity investments, including significant differences between the company’s carrying value of its investments and its underlying equity in the net assets of the affiliates, are as follows:
Tengizchevroil Chevron has a 50 percent equity ownership interest in TCO, which operates the Tengiz and Korolev crude oil fields in Kazakhstan. At December 31, 2024, the company’s carrying value of its investment in TCO was about $73 higher than the amount of underlying equity in TCO’s net assets. This difference results from Chevron acquiring a portion of its interest in TCO at a value greater than the underlying book value for that portion of TCO’s net assets. Included in the investment is a loan to TCO to fund the development of the Wellhead Pressure Management Project (WPMP) and Future Growth Project (FGP) with a principal balance of $4,500.
Caspian Pipeline Consortium Chevron has a 15 percent interest in the Caspian Pipeline Consortium, which provides the critical export route for crude oil from both TCO and Karachaganak.
Angola LNG Limited Chevron has a 36.4 percent interest in Angola LNG Limited, which processes and liquefies natural gas produced in Angola for delivery to international markets.
Chevron Phillips Chemical Company LLC Chevron owns 50 percent of Chevron Phillips Chemical Company LLC. Included in the investment balance is a loan with a principal balance of $669 to fund a portion of the Golden Triangle Polymers Project in Orange, Texas, in which Chevron Phillips Chemical Company LLC owns 51 percent.
GS Caltex Corporation Chevron owns 50 percent of GS Caltex Corporation, a joint venture with GS Energy in South Korea. The joint venture imports, produces and markets petroleum products, petrochemicals and lubricants.
Other Information “Sales and other operating revenues” on the Consolidated Statement of Income includes $13,850, $13,623 and $16,286 with affiliated companies for 2024, 2023 and 2022, respectively. “Purchased crude oil and products” includes $6,547, $7,404 and $10,171 with affiliated companies for 2024, 2023 and 2022, respectively.
“Accounts and notes receivable” on the Consolidated Balance Sheet includes $1,258 and $1,480 due from affiliated companies at December 31, 2024 and 2023, respectively. “Accounts payable” includes $556 and $591 due to affiliated companies at December 31, 2024 and 2023, respectively.
The following table provides summarized financial information on a 100 percent basis for all equity affiliates as well as Chevron’s total share, which includes Chevron’s net loans to affiliates of $4,731, $4,494 and $4,278 at December 31, 2024, 2023 and 2022, respectively.
| Affiliates | Chevron Share | |||||||||||||||||||||||||||||||||||||
| Year ended December 31 | 2024 | 2023 | 2022 | 2024 | 2023 | 2022 | ||||||||||||||||||||||||||||||||
| Total revenues | $ | 46,081 | $ | 49,306 | $ | 100,184 | $ | 21,765 | $ | 23,217 | $ | 48,323 | ||||||||||||||||||||||||||
| Income before income tax expense* | 13,127 | 15,304 | 23,811 | 6,088 | 7,209 | 10,876 | ||||||||||||||||||||||||||||||||
| Net income attributable to affiliates | 10,253 | 11,618 | 19,077 | 4,802 | 5,485 | 8,595 | ||||||||||||||||||||||||||||||||
| At December 31 | ||||||||||||||||||||||||||||||||||||||
| Current assets | $ | 21,697 | $ | 22,772 | $ | 26,632 | $ | 9,323 | $ | 10,110 | $ | 11,671 | ||||||||||||||||||||||||||
| Noncurrent assets | 104,396 | 105,965 | 101,557 | 49,435 | 48,753 | 46,428 | ||||||||||||||||||||||||||||||||
| Current liabilities | 12,906 | 14,085 | 16,319 | 5,084 | 6,698 | 7,708 | ||||||||||||||||||||||||||||||||
| Noncurrent liabilities | 22,651 | 23,797 | 22,943 | 7,278 | 6,342 | 5,980 | ||||||||||||||||||||||||||||||||
| Total affiliates’ net equity | $ | 90,536 | $ | 90,855 | $ | 88,927 | $ | 46,396 | $ | 45,823 | $ | 44,411 |
- Chevron’s net income attributable to affiliates is recorded in the company’s before-tax consolidated earnings in accordance with U.S. Generally Accepted Accounting Principles. The total income tax expense recorded by the company’s equity affiliates in 2024 was $2,874, with Chevron’s share being $1,286.
| Notes to the Consolidated Financial Statements | Financial Table of Contents | |||||||
| Millions of dollars, except per-share amounts |
Note 16
Litigation
Climate Change
Governmental and other plaintiffs in various jurisdictions across the United States have brought legal proceedings against fossil fuel producing companies, including Chevron entities, purporting to seek legal and equitable relief to address alleged impacts of climate change. Chevron entities are or were among the codefendants in 32 separate lawsuits filed by various U.S. cities and counties, four U.S. states, the District of Columbia, the Commonwealth of Puerto Rico, two Native American tribes, and a trade group in both federal and state courts.3 The lawsuits have asserted various causes of action, including public nuisance, private nuisance, failure to warn, fraud, conspiracy to commit fraud, design defect, product defect, trespass, negligence, impairment of public trust, equitable relief for pollution, impairment and destruction of natural resources, unjust enrichment, violations of consumer and environmental protection statutes, violations of unfair competition statutes, violations of a federal antitrust statute, and violations of federal and state RICO statutes, based upon, among other things, the company’s production of oil and gas products and alleged misrepresentations or omissions relating to climate change risks associated with those products. Further such proceedings are likely to be brought by other parties. While defendants have sought to remove cases filed in state court to federal court, most of those cases have been remanded to state court and the U.S. Supreme Court has denied petitions for writ of certiorari on jurisdictional questions to date. The U.S. Supreme Court has also denied petitions for certiorari to review a decision from the Hawaii Supreme Court allowing claims brought by the City and County of Honolulu to proceed past the pleadings. The unprecedented legal theories set forth in these proceedings include claims for damages (both compensatory and punitive), injunctive and other forms of equitable relief, including without limitation abatement, contribution to abatement funds, disgorgement of profits and equitable relief for pollution, impairment and destruction of natural resources, civil penalties and liability for fees and costs of suits. Due to the unprecedented nature of the suits, the company is unable to estimate any range of possible liability, but given the uncertainty of litigation there can be no assurance that the cases will not have a material adverse effect on the company’s results of operations and financial condition. Management believes that these proceedings are legally and factually meritless and detract from constructive efforts to address the important policy issues presented by climate change and will vigorously defend against such proceedings.
3 The cases are: Municipality of Bayamon et al. v. Exxon Mobil Corp., et al., No. 22-cv-1550 (D.P.R.); City of Annapolis v. BP P.L.C., et al., No. C-02-CV-21-000250 (Md. Cir. Ct.) (dismissed on the merits, Plaintiff’s appeal pending); Anne Arundel County v. BP P.L.C., et al., No. C-02-CV-21-000565 (Md. Cir. Ct.) (dismissed on the merits, Plaintiff’s appeal pending); Mayor and City Council of Baltimore v. BP P.L.C., et al., No. 24-C-18-004219 (Md. Cir. Ct.) (dismissed on the merits, Plaintiff’s appeal pending); People ex rel. Bonta v. Exxon Mobil Corp., et al., No. CGC-23-609134 (Cal. Super. Ct.); Bucks County v. BP P.L.C., et al., No. 2024-01836 (Pa. Ct. Com. Pl.); City of Charleston v. Brabham Oil Co., et al., No. 2020-CP-10-3975 (S.C. Ct. of Com. Pl.); District of Columbia v. Exxon Mobil Corp., et al., No. 2020-CA-002892-B (D.C. Super. Ct.); Delaware ex rel. Jennings v. BP America Inc., et al., C.A. No. N20C-09-097 (Del.Super. Ct.); City of Hoboken v. Exxon Mobil Corp., et al., No. HUD-L-003179-20 (N.J. Super. Ct.); City and County of Honolulu, et al. v. Sunoco LP, et al., No. 1CCV-20-0000380 (Haw. Cir. Ct.); City of Imperial Beach v. Chevron Corp., et al., No. C17-01227 (Cal. Super. Ct.); King County v. BP P.L.C., et al., No. 18-2-11859-0 (Wash. Super. Ct.) (voluntarily dismissed); Makah Indian Tribe v. Exxon Mobil Corp., et al., No. 23-25216-1-SEA (Wash. Super. Ct.); County of Marin v. Chevron Corp., et al., No. 17-cv-02586 (Cal. Super. Ct.); County of Maui v. Sunoco LP, et al., No. 2CCV-20-0000283 (Haw. Cir. Ct.); County of Multnomah v. Exxon Mobil Corp., et al., No. 23-cv-25164 (Or. Cir. Ct.); Municipality of San Juan, Puerto Rico v. Exxon Mobil Corp., et al., No. 23-cv-01608 (D.P.R.); City of Oakland v. BP P.L.C., et al., No. RG17875889 (Cal. Super. Ct.); Platkin, et al. v. Exxon Mobil Corp., et al., No. MER-L-001797-22 (N.J. Super. Ct.) (dismissed on the merits, appeal may be filed); Estado Libre Asociado de Puerto Rico [Commonwealth of Puerto Rico] v. Exxon Mobil Corp., et al., No. SJ2024CV06512 (Tribunal de Primera Instancia, Estado Libre Asociado de P.R.) [P.R. Ct. of First Instance, Commonwealth of P.R.]; City of New York v. Chevron Corp., et al., No. 18-cv-00182 (S.D.N.Y.) (dismissed on the merits); Pacific Coast Federation of Fishermen’s Associations, Inc. v. Chevron Corp., et al., No. CGC-18-571285 (Cal. Super. Ct.) (voluntarily dismissed); State of Rhode Island v. Chevron Corp., et al., C.A. No. PC-2018-4716 (R.I. Super. Ct.); City of Richmond v. Chevron Corp., et al., No. C18-00055 (Cal. Super. Ct.); City of San Francisco v. BP P.L.C., et al., No. CGC-17-561370 (Cal. Super. Ct.); County of San Mateo v. Chevron Corp., et al., No. 17-CIV-03222 (Cal. Super. Ct.); City of Santa Cruz v. Chevron Corp., et al., No. 17-CV-03243 (Cal. Super. Ct.); County of Santa Cruz v. Chevron Corp., et al., No. 17-CV-03242 (Cal. Super. Ct.); Shoalwater Bay Indian Tribe v. Exxon Mobil Corp., et al., No. 23-2-25215-2-SEA (Wash. Super. Ct.); City of Chicago v. BP P.L.C., et al., No. 2024CH01024 (Ill. Cir. Ct.); Maine v. BP P.L.C. et al., No. PORSC-CV-24-442 (Me. Super. Ct.).
| Notes to the Consolidated Financial Statements | Financial Table of Contents | |||||||
| Millions of dollars, except per-share amounts |
Louisiana
Seven coastal parishes and the State of Louisiana have filed lawsuits in Louisiana against numerous oil and gas companies seeking damages for coastal erosion in or near oil fields located within Louisiana’s coastal zone under Louisiana’s State and Local Coastal Resources Management Act (SLCRMA). Chevron entities are defendants in 37 of these cases.4 The lawsuits allege that the defendants’ historical operations were conducted without necessary permits or failed to comply with permits obtained and seek damages and other relief, including the costs of restoring coastal wetlands allegedly impacted by oil field operations. Further such proceedings may be brought by other parties. The Supreme Court denied a petition for writ of certiorari on jurisdictional questions impacting certain of these cases, and those cases have been or will be remanded to Louisiana state court, one of which has been set for trial and is scheduled to begin in March 2025. Federal jurisdictional questions are still being decided for the remaining cases in the United States federal court system. Due to the unprecedented nature of the suits, the company is unable to estimate any range of possible liability, but given the uncertainty of litigation there can be no assurance that the cases will not have a material adverse effect on the company’s results of operations and financial condition. Management believes that the claims lack legal and factual merit and will continue to vigorously defend against such proceedings.
4 The cases are: Jefferson Parish v. Atlantic Richfield Company, et al., No. 732-768 (24th Jud. Dist. Ct., Jefferson Par.); Jefferson Parish v. Chevron U.S.A. Holdings, Inc., et al., No. 732-769 (24th Jud. Dist. Ct., Jefferson Par.); Jefferson Parish v. Destin Operating Company, Inc., et al., No. 732-770 (24th Jud. Dist. Ct., Jefferson Par.); Jefferson Parish v. Canlan Oil Company, et al., No. 732-771 (24th Jud. Dist. Ct., Jefferson Par.); Jefferson Parish v. Anadarko E&P Onshore LLC, et al., No. 732-772 (24th Jud. Dist. Ct., Jefferson Par.); Jefferson Parish v. ExxonMobil Corporation, et al., No. 732-774 (24th Jud. Dist. Ct., Jefferson Par.); Jefferson Parish v. Equitable Petroleum Corporation, et al., No. 732-775 (24th Jud. Dist. Ct., Jefferson Par.); Plaquemines Parish v. ConocoPhillips Co., et al., No. 60-982 (25th Jud. Dist. Ct., Plaquemines Par.); Plaquemines Parish v. HHE Energy Co., et al., No. 60-983 (25th Jud. Dist. Ct., Plaquemines Par.); Plaquemines Parish v. Exchange Oil & Gas Corp., et al., No. 60-984 (25th Jud. Dist. Ct., Plaquemines Par.); Plaquemines Parish v. LLOG Exploration & Production Co., et al., No. 60-985 (25th Jud. Dist. Ct., Plaquemines Par.); Plaquemines Parish v. Equitable Petroleum Corporation, et al., No. 60-986 (25th Jud. Dist. Ct., Plaquemines Par.); Plaquemines Parish v. June Energy, et al., No. 60-987 (25th Jud. Dist. Ct., Plaquemines Par.); Plaquemines Parish v. Linder Oil Company, et al., No. 60-988 (25th Jud. Dist. Ct., Plaquemines Par.); Plaquemines Parish v. Riverwood Production Company, et al., No. 60-989 (25th Jud. Dist. Ct., Plaquemines Par.); Plaquemines Parish v. Helis Oil & Gas Company, et al., No. 60-990 (25th Jud. Dist. Ct., Plaquemines Par.); Plaquemines Parish v. Northcoast Oil Company, et al., No. 60-992 (25th Jud. Dist. Ct., Plaquemines Par.); Plaquemines Parish v. Goodrich Petroleum Company, L.L.C., et al., No. 60-994 (25th Jud. Dist. Ct., Plaquemines Par.); Plaquemines Parish v. Devon Energy Production Company, L.P., et al., No. 60-995 (25th Jud. Dist. Ct., Plaquemines Par.); Plaquemines Parish v. Rozel Operating Co., et al., No. 60-996 (25th Jud. Dist. Ct., Plaquemines Par.); Plaquemines Parish v. Palm Energy Offshore, L.L.C., et al., No. 60-997 (25th Jud. Dist. Ct., Plaquemines Par.); Plaquemines Parish v. Great Southern Oil & Gas Company, Inc., et al., No. 60-998 (25th Jud. Dist. Ct., Plaquemines Par.); Plaquemines Parish v. Hilcorp Energy Company, et al., No. 60-999 (25th Jud. Dist. Ct., Plaquemines Par.); Plaquemines Parish v. Apache Oil Corporation, et al., No. 61-000 (25th Jud. Dist. Ct., Plaquemines Par.); Plaquemines Parish v. Campbell Energy Corporation, et al., No. 61-001 (25th Jud. Dist. Ct., Plaquemines Par.); Plaquemines Parish v. TotalPetrochemicals & Refining USA, Inc., et al., No. 61-002 (25th Jud. Dist. Ct., Plaquemines Par.); Cameron Parish v. Alpine Exploration Companies, Inc., et al., No. 10-19580 (38th Jud. Dist. Ct., Cameron Par.); Cameron Parish v. Apache Corporation (of Delaware), et al., No. 10-19579 (38th Jud. Dist. Ct., Cameron Par.); Cameron Parish v. Ballard Exploration Company, Inc., et al., No. 10-19574 (38th Jud. Dist. Ct., Cameron Par.); Cameron Parish v. Bay Coquille, Inc., et al., No. 10-19581 (38th Jud. Dist. Ct., Cameron Par.); Cameron Parish v. BEPCO, LP, et al., No. 10-19572 (38th Jud. Dist. Ct., Cameron Par.); Cameron Parish v. BP America Production Company, et al., No. 10-19576 (38th Jud. Dist. Ct., Cameron Par.); Cameron Parish v. Brammer Engineering, Inc., et al., No. 10-19573 (38th Jud. Dist. Ct., Cameron Par.); Cameron Parish v. Burlington Resources, et al., No. 10-19575 (38th Jud. Dist. Ct., Cameron Par.); Stutes v. Gulfport Energy Corporation, et al., No. 102,146 (15th Jud. Dist. Ct., Vermilion Par.); St. Bernard Parish v. Atlantic Richfield, et al., No. 16-1228 (34th Jud. Dist. Ct. St., Bernard Par.); City of New Orleans v. Apache Louisiana Mins, LLC, et al., No. 19-cv-08290, (E.D. La.).
| Notes to the Consolidated Financial Statements | Financial Table of Contents | |||||||
| Millions of dollars, except per-share amounts |
Note 17
Taxes
| Income Taxes | Year ended December 31 | |||||||||||||||||||
| 2024 | 2023 | 2022 | ||||||||||||||||||
| Income tax expense (benefit) | ||||||||||||||||||||
| U.S. federal | ||||||||||||||||||||
| Current | $ | 854 | $ | 895 | $ | 1,723 | ||||||||||||||
| Deferred | 748 | 666 | 2,240 | |||||||||||||||||
| State and local | ||||||||||||||||||||
| Current | 275 | 211 | 482 | |||||||||||||||||
| Deferred | 10 | 1 | 39 | |||||||||||||||||
| Total United States | 1,887 | 1,773 | 4,484 | |||||||||||||||||
| International | ||||||||||||||||||||
| Current | 7,388 | 6,745 | 9,738 | |||||||||||||||||
| Deferred | 482 | (345) | (156) | |||||||||||||||||
| Total International | 7,870 | 6,400 | 9,582 | |||||||||||||||||
| Total income tax expense (benefit) | $ | 9,757 | $ | 8,173 | $ | 14,066 |
The reconciliation between the U.S. statutory federal income tax rate and the company’s effective income tax rate is detailed in the following table:
| Year ended December 31 | ||||||||||||||||||||
| 2024 | 2023 | 2022 | ||||||||||||||||||
| Income (loss) before income taxes | ||||||||||||||||||||
| United States | $ | 8,056 | $ | 8,565 | $ | 21,005 | ||||||||||||||
| International | 19,450 | 21,019 | 28,669 | |||||||||||||||||
| Total income (loss) before income taxes | 27,506 | 29,584 | 49,674 | |||||||||||||||||
| Theoretical tax (at U.S. statutory rate of 21%) | 5,776 | 6,213 | 10,432 | |||||||||||||||||
| Equity affiliate accounting effect | (845) | (1,072) | (1,678) | |||||||||||||||||
| Effect of income taxes from international operations | 4,742 | 3,001 | 5,041 | |||||||||||||||||
| State and local taxes on income, net of U.S. federal income tax benefit | 214 | 252 | 508 | |||||||||||||||||
| Prior year tax adjustments, claims and settlements 1 | (30) | (32) | (90) | |||||||||||||||||
| Tax credits | (28) | (20) | (6) | |||||||||||||||||
| Other U.S. 1, 2 | (72) | (169) | (141) | |||||||||||||||||
| Total income tax expense (benefit) | $ | 9,757 | $ | 8,173 | $ | 14,066 | ||||||||||||||
| Effective income tax rate 3 | 35.5 | % | 27.6 | % | 28.3 | % |
1 Includes one-time tax costs (benefits) associated with changes in uncertain tax positions.
2 Includes one-time tax costs (benefits) associated with changes in valuation allowances (2024 - $(12); 2023 - $(84); 2022 - $(36)).
3 The company’s effective tax rate is reflective of equity income reported on an after-tax basis as part of the “Total Income (Loss) Before Income Tax Expense,” in accordance with U.S. Generally Accepted Accounting Principles. Chevron’s share of its equity affiliates’ total income tax expense in 2024 was $1,286.
The 2024 increase in income tax expense of $1,584 and the change in the company’s effective tax rate from 27.6 percent in 2023 to 35.5 percent in 2024 were primarily a result of the tax impacts from the asset sales in Canada.
| Notes to the Consolidated Financial Statements | Financial Table of Contents | |||||||
| Millions of dollars, except per-share amounts |
The company records its deferred taxes on a tax-jurisdiction basis. The reported deferred tax balances are composed of the following:
| At December 31 | ||||||||||||||
| 2024 | 2023 | |||||||||||||
| Deferred tax liabilities | ||||||||||||||
| Properties, plant and equipment | $ | 20,648 | $ | 20,303 | ||||||||||
| Investments and other | 5,254 | 4,263 | ||||||||||||
| Total deferred tax liabilities | 25,902 | 24,566 | ||||||||||||
| Deferred tax assets | ||||||||||||||
| Foreign tax credits | (15,261) | (13,560) | ||||||||||||
| Asset retirement obligations/environmental reserves | (4,220) | (4,543) | ||||||||||||
| Employee benefits | (2,050) | (1,785) | ||||||||||||
| Deferred credits | (292) | (268) | ||||||||||||
| Tax loss carryforwards | (3,034) | (3,492) | ||||||||||||
| Other accrued liabilities | (1,137) | (1,416) | ||||||||||||
| Inventory | (68) | (126) | ||||||||||||
| Operating leases | (1,352) | (1,479) | ||||||||||||
| Miscellaneous | (4,180) | (3,652) | ||||||||||||
| Total deferred tax assets | (31,594) | (30,321) | ||||||||||||
| Deferred tax assets valuation allowance | 21,313 | 20,416 | ||||||||||||
| Total deferred income taxes, net | $ | 15,621 | $ | 14,661 |
Deferred tax liabilities increased by $1,336 from year-end 2023, driven by deferred tax impacts resulting from the asset sales in Canada and foreign exchange impacts. Deferred tax assets increased by $1,273 from year-end 2023. This increase was primarily related to increases in foreign tax credits and foreign exchange impacts, partially offset by decreases in tax loss carryforwards and other accrued liabilities.
The overall valuation allowance, which increased by $897 from year-end 2023, relates to deferred tax assets for U.S. foreign tax credit carryforwards, tax loss carryforwards and temporary differences. The valuation allowance reduces the deferred tax assets to amounts that are, in management’s assessment, more likely than not to be realized. At the end of 2024, the company had gross tax loss carryforwards of approximately $9,231 and tax credit carryforwards of approximately $288, primarily related to various international tax jurisdictions. Whereas some of these tax loss carryforwards do not have an expiration date, others expire at various times from 2025 through 2043. U.S. foreign tax credit carryforwards of $15,261 will expire between 2025 and 2034.
At December 31, 2024 and 2023, deferred taxes were classified on the Consolidated Balance Sheet as follows:
| At December 31 | ||||||||||||||
| 2024 | 2023 | |||||||||||||
| Deferred charges and other assets | $ | (3,516) | $ | (4,169) | ||||||||||
| Noncurrent deferred income taxes | 19,137 | 18,830 | ||||||||||||
| Total deferred income taxes, net | $ | 15,621 | $ | 14,661 |
Income taxes, including U.S. state and foreign withholding taxes, are not accrued for unremitted earnings of international operations that have been or are intended to be reinvested indefinitely, or where no taxable temporary differences exist that are attributable to an investment in a foreign entity. The indefinite reinvestment assertion continues to apply for the purpose of determining deferred tax liabilities for U.S. state and foreign withholding tax purposes. It is not practicable to estimate the amount of state and foreign withholding taxes that might be payable on the possible remittance of earnings that are intended to be reinvested indefinitely. The company does not anticipate incurring significant additional taxes on remittances of earnings that are not indefinitely reinvested.
Uncertain Income Tax Positions The company recognizes a tax benefit in the financial statements for an uncertain tax position only if management’s assessment is that the position is more likely than not (i.e., a likelihood greater than 50 percent) to be allowed by the tax jurisdiction based solely on the technical merits of the position. The term “tax position” in the accounting standards for income taxes refers to a position in a previously filed tax return or a position expected to be taken in a future tax return that is reflected in measuring current or deferred income tax assets and liabilities for interim or annual periods.
The following table indicates the changes to the company’s unrecognized tax benefits for the years ended December 31, 2024, 2023 and 2022. The term “unrecognized tax benefits” in the accounting standards for income taxes refers to the
| Notes to the Consolidated Financial Statements | Financial Table of Contents | |||||||
| Millions of dollars, except per-share amounts |
differences between a tax position taken or expected to be taken in a tax return and the benefit measured and recognized in the financial statements. Interest and penalties are not included.
| 2024 | 2023 | 2022 | ||||||||||||||||||
| Balance at January 1 | $ | 5,452 | $ | 5,323 | $ | 5,288 | ||||||||||||||
| Foreign currency effects | — | (27) | (2) | |||||||||||||||||
| Additions based on tax positions taken in current year | 236 | 248 | 30 | |||||||||||||||||
| Additions for tax positions taken in prior years | 101 | 265 | 234 | |||||||||||||||||
| Reductions based on tax positions taken in current year | (54) | (104) | — | |||||||||||||||||
| Reductions for tax positions taken in prior years | (883) | (251) | (117) | |||||||||||||||||
| Settlements with taxing authorities in current year | — | (2) | (110) | |||||||||||||||||
| Balance at December 31 | $ | 4,852 | $ | 5,452 | $ | 5,323 |
Approximately 76 percent of the $4,852 of unrecognized tax benefits at December 31, 2024, would have an impact on the effective tax rate if subsequently recognized. Certain of these unrecognized tax benefits relate to tax carryforwards that may require a full valuation allowance at the time of any such recognition.
The company and its subsidiaries are subject to income taxation and audits throughout the world. With certain exceptions, income tax examinations are completed through 2016 for the United States and 2007 for other major jurisdictions.
The company engages in ongoing discussions with tax authorities regarding the resolution of tax matters in the various jurisdictions. Both the outcome of these tax matters and the timing of resolution and/or closure of the tax audits are highly uncertain. Of the amount of unrecognized tax benefits the company has identified as of December 31, 2024, it is reasonably possible that developments on tax matters in certain tax jurisdictions may result in decreases of approximately 68 percent within the next 12 months. Given the number of years that still remain subject to examination and the number of matters being examined in the various tax jurisdictions, the company is unable to estimate the range of possible adjustments to the balance of unrecognized tax benefits.
On the Consolidated Statement of Income, the company reports interest and penalties related to liabilities for uncertain tax positions as “Income Tax Expense (Benefit).” As of December 31, 2024, accrued expense of $268 for anticipated interest and penalties was included on the Consolidated Balance Sheet, compared with accrued expense of $229 as of year-end 2023. Income tax expense (benefit) associated with interest and penalties was $40, $124 and $152 in 2024, 2023 and 2022, respectively.
| Taxes Other Than on Income | ||||||||||||||||||||
| Year ended December 31 | ||||||||||||||||||||
| 2024 | 2023 | 2022 | ||||||||||||||||||
| United States | ||||||||||||||||||||
| Import duties and other levies | $ | 8 | $ | (9) | $ | 10 | ||||||||||||||
| Property and other miscellaneous taxes | 977 | 818 | 609 | |||||||||||||||||
| Payroll taxes | 296 | 286 | 248 | |||||||||||||||||
| Taxes on production | 842 | 801 | 989 | |||||||||||||||||
| Total United States | 2,123 | 1,896 | 1,856 | |||||||||||||||||
| International | ||||||||||||||||||||
| Import duties and other levies | 90 | 72 | 63 | |||||||||||||||||
| Property and other miscellaneous taxes | 2,283 | 2,004 | 1,789 | |||||||||||||||||
| Payroll taxes | 125 | 121 | 122 | |||||||||||||||||
| Taxes on production | 95 | 127 | 202 | |||||||||||||||||
| Total International | 2,593 | 2,324 | 2,176 | |||||||||||||||||
| Total taxes other than on income | $ | 4,716 | $ | 4,220 | $ | 4,032 | ||||||||||||||
| Notes to the Consolidated Financial Statements | Financial Table of Contents | |||||||
| Millions of dollars, except per-share amounts |
Note 18
Properties, Plant and Equipment1
| At December 31 | Year ended December 31 | ||||||||||||||||||||||||||||||||||||||||||||||
| Gross Investment at Cost | Net Investment | Additions at Cost2 | Depreciation Expense3 | ||||||||||||||||||||||||||||||||||||||||||||
| 2024 | 2023 | 2022 | 2024 | 2023 | 2022 | 2024 | 2023 | 2022 | 2024 | 2023 | 2022 | ||||||||||||||||||||||||||||||||||||
| Upstream | |||||||||||||||||||||||||||||||||||||||||||||||
| United States | $ | 124,439 | $ | 117,955 | $ | 96,590 | $ | 52,428 | $ | 50,390 | $ | 37,031 | $ | 9,591 | $ | 20,408 | $ | 6,461 | $ | 7,562 | $ | 7,666 | $ | 5,012 | |||||||||||||||||||||||
| International | 176,401 | 183,996 | 188,556 | 76,642 | 84,561 | 88,549 | 4,426 | 4,130 | 2,599 | 7,935 | 8,109 | 9,830 | |||||||||||||||||||||||||||||||||||
| Total Upstream | 300,840 | 301,951 | 285,146 | 129,070 | 134,951 | 125,580 | 14,017 | 24,538 | 9,060 | 15,497 | 15,775 | 14,842 | |||||||||||||||||||||||||||||||||||
| Downstream | |||||||||||||||||||||||||||||||||||||||||||||||
| United States | 32,336 | 31,192 | 29,802 | 13,667 | 13,521 | 12,827 | 1,217 | 1,623 | 2,742 | 1,091 | 931 | 913 | |||||||||||||||||||||||||||||||||||
| International | 8,331 | 8,401 | 8,281 | 2,946 | 3,122 | 3,226 | 245 | 237 | 246 | 360 | 301 | 311 | |||||||||||||||||||||||||||||||||||
| Total Downstream | 40,667 | 39,593 | 38,083 | 16,613 | 16,643 | 16,053 | 1,462 | 1,860 | 2,988 | 1,451 | 1,232 | 1,224 | |||||||||||||||||||||||||||||||||||
| All Other | |||||||||||||||||||||||||||||||||||||||||||||||
| United States | 4,304 | 4,390 | 4,402 | 2,082 | 1,991 | 1,931 | 355 | 311 | 230 | 328 | 313 | 247 | |||||||||||||||||||||||||||||||||||
| International | 122 | 147 | 154 | 34 | 34 | 27 | 7 | 15 | 12 | 6 | 6 | 6 | |||||||||||||||||||||||||||||||||||
| Total All Other | 4,426 | 4,537 | 4,556 | 2,116 | 2,025 | 1,958 | 362 | 326 | 242 | 334 | 319 | 253 | |||||||||||||||||||||||||||||||||||
| Total United States | 161,079 | 153,537 | 130,794 | 68,177 | 65,902 | 51,789 | 11,163 | 22,342 | 9,433 | 8,981 | 8,910 | 6,172 | |||||||||||||||||||||||||||||||||||
| Total International | 184,854 | 192,544 | 196,991 | 79,622 | 87,717 | 91,802 | 4,678 | 4,382 | 2,857 | 8,301 | 8,416 | 10,147 | |||||||||||||||||||||||||||||||||||
| Total | $ | 345,933 | $ | 346,081 | $ | 327,785 | $ | 147,799 | $ | 153,619 | $ | 143,591 | $ | 15,841 | $ | 26,724 | $ | 12,290 | $ | 17,282 | $ | 17,326 | $ | 16,319 |
1Other than the United States and Australia, no other country accounted for 10 percent or more of the company’s net properties, plant and equipment (PP&E) in 2024. Australia had PP&E of $38,969, $41,409 and $44,012 in 2024, 2023 and 2022, respectively. Gross Investment at Cost and Additions at Cost for 2023 each include $10,487 associated with the PDC acquisition.
2Net of dry hole expense related to prior years’ expenditures of $98, $110 and $177 in 2024, 2023 and 2022, respectively.
3Depreciation expense includes accretion expense of $586, $593 and $560 in 2024, 2023 and 2022, respectively, and impairments and write-offs of $500, $2,180 and $950 in 2024, 2023 and 2022, respectively.
Note 19
Short-Term Debt
| At December 31 | ||||||||||||||
| 2024 | 2023 | |||||||||||||
| Commercial paper | $ | 5,386 | $ | — | ||||||||||
| Notes payable to banks and others with originating terms of one year or less | 131 | 469 | ||||||||||||
| Current maturities of long-term debt* | 4,012 | 1,667 | ||||||||||||
| Current maturities of long-term finance leases | 58 | 60 | ||||||||||||
| Redeemable long-term obligations | 3,069 | 2,876 | ||||||||||||
| Subtotal | 12,656 | 5,072 | ||||||||||||
| Reclassified to long-term debt | (8,250) | (4,543) | ||||||||||||
| Total short-term debt | $ | 4,406 | $ | 529 | ||||||||||
| * Inclusive of unamortized premiums of $0 at December 31, 2024 and $17 at December 31, 2023. | ||||||||||||||
Redeemable long-term obligations consist primarily of tax-exempt variable-rate put bonds that are included as current liabilities because they become redeemable at the option of the bondholders during the year following the balance sheet date.
The company may periodically enter into interest rate swaps on a portion of its short-term debt. At December 31, 2024, the company had no interest rate swaps on short-term debt.
At December 31, 2024, the company had $8,250 in 364-day committed credit facilities with various major banks that enable the refinancing of short-term obligations. The credit facilities allow the company the option to convert outstanding short-term obligations into a term loan for a period of up to one year from the facilities termination date. This supports commercial paper borrowing and can also be used for general corporate purposes. The company’s practice has been to replace expiring commitments with new commitments on substantially the same terms, maintaining levels management believes appropriate. Any borrowings under these facilities would be unsecured indebtedness at interest rates based on the Secured Overnight Financing Rate (SOFR), or an average of base lending rates published by specified banks and on terms reflecting the company’s strong credit rating. No borrowings were outstanding under these facilities at December 31, 2024.
The company classified $8,250 and $4,543 of short-term debt as long-term at December 31, 2024 and 2023, respectively. Settlement of these obligations is not expected to require the use of working capital within one year, as the company had the intent and the ability, as evidenced by committed credit facilities, to continue refinancing them.
| Notes to the Consolidated Financial Statements | Financial Table of Contents | |||||||
| Millions of dollars, except per-share amounts |
Note 20
Long-Term Debt
Total long-term debt including finance lease liabilities at December 31, 2024, was $20,135. The company’s long-term debt outstanding at year-end 2024 and 2023 was as follows:
| At December 31 | ||||||||||||||||||||||||||
| 2024 | 2023 | |||||||||||||||||||||||||
| Weighted Average Interest Rate (%)1 | Range of Interest Rates (%)2 | Principal | Principal | |||||||||||||||||||||||
| Notes due 2025 | 1.724 | 0.687 - 3.326 | 4,000 | 4,000 | ||||||||||||||||||||||
| Notes due 2026 | 2.954 | 2,250 | 2,250 | |||||||||||||||||||||||
| Notes due 2027 | 2.379 | 1.018 - 8.000 | 2,000 | 2,000 | ||||||||||||||||||||||
| Notes due 2028 | 3.850 | 600 | 600 | |||||||||||||||||||||||
| Notes due 2029 | 3.250 | 500 | 500 | |||||||||||||||||||||||
| Notes due 2030 | 2.236 | 1,500 | 1,500 | |||||||||||||||||||||||
| Debentures due 2031 | 8.625 | 102 | 102 | |||||||||||||||||||||||
| Debentures due 2032 | 8.416 | 8.000 - 8.625 | 183 | 183 | ||||||||||||||||||||||
| Notes due 2040 | 2.978 | 293 | 293 | |||||||||||||||||||||||
| Notes due 2041 | 6.000 | 397 | 397 | |||||||||||||||||||||||
| Notes due 2043 | 5.250 | 330 | 330 | |||||||||||||||||||||||
| Notes due 2044 | 5.050 | 222 | 222 | |||||||||||||||||||||||
| Notes due 2047 | 4.950 | 187 | 187 | |||||||||||||||||||||||
| Notes due 2049 | 4.200 | 237 | 237 | |||||||||||||||||||||||
| Notes due 2050 | 2.763 | 2.343 - 3.078 | 1,750 | 1,750 | ||||||||||||||||||||||
| Debentures due 2097 | 7.250 | 60 | 60 | |||||||||||||||||||||||
| Bank loans due 2025 to 2027 | 3.321 | 3.306 - 3.367 | 205 | — | ||||||||||||||||||||||
| Medium-term notes, maturing from 2033 to 2038 | 6.101 | 4.324 - 7.840 | 20 | 20 | ||||||||||||||||||||||
| Notes due 2024 | — | 1,650 | ||||||||||||||||||||||||
| Total including debt due within one year | 14,836 | 16,281 | ||||||||||||||||||||||||
| Debt due within one year | (4,012) | (1,650) | ||||||||||||||||||||||||
| Fair market value adjustment for debt acquired in the Noble acquisition | 529 | 578 | ||||||||||||||||||||||||
| Reclassified from short-term debt | 8,250 | 4,543 | ||||||||||||||||||||||||
| Unamortized discounts and debt issuance costs | (14) | (19) | ||||||||||||||||||||||||
| Finance lease liabilities3 | 546 | 574 | ||||||||||||||||||||||||
| Total long-term debt | $ | 20,135 | $ | 20,307 | ||||||||||||||||||||||
| 1 Weighted-average interest rate at December 31, 2024. | ||||||||||||||||||||||||||
| 2 Range of interest rates at December 31, 2024. | ||||||||||||||||||||||||||
| 3 For details on finance lease liabilities, see Note 5 Lease Commitments. |
Chevron has an automatic shelf registration statement that expires in November 2027. This registration statement is for an unspecified amount of nonconvertible debt securities issued or guaranteed by Chevron Corporation or CUSA.
Long-term debt excluding finance lease liabilities with a principal balance of $14,836 matures as follows: 2025 – $4,012; 2026 – $2,290; 2027 – $2,153; 2028 – $600; 2029 – $500; and after 2029 – $5,281.
See Note 9 Fair Value Measurements for information concerning the fair value of the company’s long-term debt.
Note 21
Accounting for Suspended Exploratory Wells
The company continues to capitalize exploratory well costs after the completion of drilling when the well has found a sufficient quantity of reserves to justify completion as a producing well, and the business unit is making sufficient progress assessing the reserves and the economic and operating viability of the project. If either condition is not met or if the company obtains information that raises substantial doubt about the economic or operational viability of the project, the exploratory well would be assumed to be impaired, and its costs, net of any salvage value, would be charged to expense.
| Notes to the Consolidated Financial Statements | Financial Table of Contents | |||||||
| Millions of dollars, except per-share amounts |
The following table indicates the changes to the company’s suspended exploratory well costs for the three years ended December 31, 2024:
| 2024 | 2023 | 2022 | |||||||||
| Beginning balance at January 1 | $ | 1,648 | $ | 1,627 | $ | 2,109 | |||||
| Additions to capitalized exploratory well costs pending the determination of proved reserves | 14 | 88 | 72 | ||||||||
| Reclassifications to wells, facilities and equipment based on the determination of proved reserves | — | — | (481) | ||||||||
| Capitalized exploratory well costs charged to expense | — | (67) | (73) | ||||||||
| Ending balance at December 31 | $ | 1,662 | $ | 1,648 | $ | 1,627 |
The following table provides an aging of capitalized well costs and the number of projects for which exploratory well costs have been capitalized for a period greater than one year since the completion of drilling:
| At December 31 | |||||||||||
| 2024 | 2023 | 2022 | |||||||||
| Exploratory well costs capitalized for a period of one year or less | $ | 17 | $ | 78 | $ | 73 | |||||
| Exploratory well costs capitalized for a period greater than one year | 1,645 | 1,570 | 1,554 | ||||||||
| Balance at December 31 | $ | 1,662 | $ | 1,648 | $ | 1,627 | |||||
| Number of projects with exploratory well costs that have been capitalized for a period greater than one year* | 14 | 13 | 12 |
*Certain projects have multiple wells or fields or both.
Of the $1,645 of exploratory well costs capitalized for more than one year at December 31, 2024, $847 is related to seven projects that had drilling activities underway or firmly planned for the near future. The $798 balance is related to seven projects in areas requiring a major capital expenditure before production could begin and for which additional drilling efforts were not underway or firmly planned for the near future. Additional drilling was not deemed necessary because the presence of hydrocarbons had already been established, and other activities were in process to enable a future decision on project development.
The projects for the $798 referenced above had the following activities associated with assessing the reserves and the projects’ economic viability: (a) $383 (five projects) – undergoing front-end engineering and design with final investment decision expected within four years; (b) $415 (two projects) – development alternatives under review. While progress was being made on all 14 projects, the decision on the recognition of proved reserves under SEC rules in some cases may not occur for several years because of the complexity, scale and negotiations associated with the projects. Approximately half of these decisions are expected to occur in the next five years.
The $1,645 of suspended well costs capitalized for a period greater than one year as of December 31, 2024, represents 75 exploratory wells in 14 projects. The tables below contain the aging of these costs on a well and project basis:
| Aging based on drilling completion date of individual wells: | Amount | Number of wells | ||||||||||||
| 2000-2009 | $ | 263 | 14 | |||||||||||
| 2010-2014 | 1,122 | 49 | ||||||||||||
| 2015-2023 | 260 | 12 | ||||||||||||
| Total | $ | 1,645 | 75 | |||||||||||
| Aging based on drilling completion date of last suspended well in project: | Amount | Number of projects | ||||||||||||
| 2008-2012 | $ | 292 | 2 | |||||||||||
| 2013-2016 | 1,082 | 6 | ||||||||||||
| 2017-2024 | 271 | 6 | ||||||||||||
| Total | $ | 1,645 | 14 |
Note 22
Stock Options and Other Share-Based Compensation
Compensation expense for stock options for 2024, 2023 and 2022 was $90 ($68 after tax), $85 ($65 after tax) and $60 ($46 after tax), respectively. In addition, compensation expense for stock appreciation rights, restricted stock, performance shares and restricted stock units for 2024, 2023 and 2022 was $510 ($388 after tax), $(100) ($(76) after tax) and $1,013 ($770 after tax), respectively. No significant stock-based compensation cost was capitalized at December 31, 2024, or December 31, 2023.
| Notes to the Consolidated Financial Statements | Financial Table of Contents | |||||||
| Millions of dollars, except per-share amounts |
Cash received in payment for option exercises under all share-based payment arrangements for 2024, 2023 and 2022 was $356, $263 and $5,835, respectively. Actual tax benefits realized for the tax deductions from option exercises were $24, $20 and $216 for 2024, 2023 and 2022, respectively.
Cash paid to settle performance shares, restricted stock units and stock appreciation rights was $395, $566 and $556 for 2024, 2023 and 2022, respectively.
On May 25, 2022, stockholders approved the Chevron 2022 Long-Term Incentive Plan (2022 LTIP). Awards under the 2022 LTIP may take the form of, but are not limited to, stock options, restricted stock, restricted stock units, stock appreciation rights, performance shares and non-stock grants. From May 2022 through May 2032, no more than 104 million shares may be issued under the 2022 LTIP. For awards issued on or after May 25, 2022, no more than 48 million of those shares may be issued in the form of full value awards such as share-settled restricted stock, share-settled restricted stock units, share-settled performance shares and other share-settled awards that do not require full payment in cash or property for shares underlying such awards by the award recipient. Contractual terms of equity awards vary between three years for the performance shares and special restricted stock units with cliff vesting at the end of the contractual period, five years for standard restricted stock units with cliff vesting at the end of the contractual period and 10 years for the stock options and stock appreciation rights with graded vesting provisions by which one-third of each award vests around each of the first, second and third anniversaries of the date of grant. Commencing for grants issued in January 2023 and after, standard restricted stock units vest ratably on an annual basis over a three-year period. Forfeitures of performance shares, restricted stock units, and stock appreciation rights are recognized as they occur. Forfeitures of stock options are estimated using historical forfeiture data dating back to 1990.
Fair Value and Assumptions The fair market values of stock options and stock appreciation rights granted in 2024, 2023 and 2022 were measured on the date of grant using the Black-Scholes option-pricing model with the following weighted-average assumptions:
| Year ended December 31 | |||||||||||||||||||||||
| 2024 | 2023 | 2022 | |||||||||||||||||||||
| Expected term in years1 | 6.5 | 6.4 | 6.9 | ||||||||||||||||||||
| Volatility2 | 33.0 | % | 32.5 | % | 31.3 | % | |||||||||||||||||
| Risk-free interest rate based on zero coupon U.S. treasury note | 3.98 | % | 3.43 | % | 1.79 | % | |||||||||||||||||
| Dividend yield | 4.1 | % | 3.5 | % | 5.0 | % | |||||||||||||||||
| Weighted-average fair value per option granted | $ | 38.00 | $ | 45.82 | $ | 23.56 |
1 Expected term is based on historical exercise and post-vesting cancellation data.
2 Volatility rate is based on historical stock prices over an appropriate period, generally equal to the expected term.
A summary of option activity during 2024 is presented below:
| Shares (Thousands) | Weighted-Average Exercise Price | Averaged Remaining Contractual Term (Years) | Aggregate Intrinsic Value | ||||||||||||||||||||
| Outstanding at January 1, 2024 | 24,375 | $ | 118.72 | ||||||||||||||||||||
| Granted | 2,730 | $ | 152.35 | ||||||||||||||||||||
| Exercised | (3,504) | $ | 101.60 | ||||||||||||||||||||
| Forfeited | (433) | $ | 260.55 | ||||||||||||||||||||
| Outstanding at December 31, 2024 | 23,168 | $ | 122.62 | 5.06 | $ | 687 | |||||||||||||||||
| Exercisable at December 31, 2024 | 18,372 | $ | 114.15 | 4.15 | $ | 675 |
The total intrinsic value (i.e., the difference between the exercise price and the market price) of options exercised during 2024, 2023 and 2022 was $190, $167 and $2,369, respectively. During this period, the company continued its practice of issuing treasury shares upon exercise of these awards.
As of December 31, 2024, there was $320 of total unrecognized before-tax compensation cost related to nonvested share-based compensation arrangements granted under the plan. That cost is expected to be recognized over a weighted-average period of 1.9 years.
At January 1, 2024, the number of LTIP performance shares outstanding was equivalent to 4,419,310 shares. During 2024, 1,525,452 performance shares were granted, 1,966,923 shares vested with cash proceeds distributed to recipients and 118,400 shares were forfeited. At December 31, 2024, there were 3,859,439 performance shares outstanding, of which 2,815,575 are payable in cash and 1,043,864 are payable in shares. The fair value of the liability recorded for these instruments payable in cash was $307 and was measured largely using the Monte Carlo simulation method.
| Notes to the Consolidated Financial Statements | Financial Table of Contents | |||||||
| Millions of dollars, except per-share amounts |
At January 1, 2024, the number of restricted stock units outstanding was equivalent to 5,060,242 shares. During 2024, 1,813,119 restricted stock units were granted, 1,340,664 units vested with cash proceeds distributed to recipients and 132,899 units were forfeited. At December 31, 2024, there were 5,399,798 restricted stock units outstanding, of which 3,346,557 are payable in cash and 2,053,241 are payable in shares. The fair value of the liability recorded for the vested portion of these instruments payable in cash was $387, valued at the stock price as of December 31, 2024. In addition, outstanding stock appreciation rights that were granted under the LTIP totaled 535,122 equivalent shares as of December 31, 2024. The fair value of the liability recorded for the vested portion of these instruments was $23.
Note 23
Employee Benefit Plans
The company has defined benefit pension plans for many employees. The company typically prefunds defined benefit plans as required by local regulations or in certain situations where prefunding provides economic advantages. In the United States, all qualified plans are subject to the Employee Retirement Income Security Act (ERISA) minimum funding standard. The company does not typically fund U.S. nonqualified pension plans that are not subject to funding requirements under laws and regulations because contributions to these pension plans may be less economic and investment returns may be less attractive than the company’s other investment alternatives.
The company also sponsors other post-employment benefit (OPEB) plans that provide medical and dental benefits, as well as life insurance for some active and qualifying retired employees. The plans are unfunded, and the company and retirees share the costs. For the company’s main U.S. medical plan, the increase to the pre-Medicare company contribution for retiree medical coverage is limited to no more than 4 percent each year. Certain life insurance benefits are paid by the company.
The company recognizes the overfunded or underfunded status of each of its defined benefit pension and OPEB plans as an asset or liability on the Consolidated Balance Sheet.
The funded status of the company’s pension and OPEB plans for 2024 and 2023 follows:
| Pension Benefits | |||||||||||||||||||||||||||||||||||||||||
| 2024 | 2023 | Other Benefits | |||||||||||||||||||||||||||||||||||||||
| U.S. | Int’l. | U.S. | Int’l. | 2024 | 2023 | ||||||||||||||||||||||||||||||||||||
| Change in Benefit Obligation | |||||||||||||||||||||||||||||||||||||||||
| Benefit obligation at January 1 | $ | 10,392 | $ | 3,605 | $ | 9,713 | $ | 3,354 | $ | 2,017 | $ | 1,938 | |||||||||||||||||||||||||||||
| Service cost | 357 | 54 | 342 | 58 | 34 | 33 | |||||||||||||||||||||||||||||||||||
| Interest cost | 465 | 191 | 448 | 193 | 98 | 97 | |||||||||||||||||||||||||||||||||||
| Plan participants’ contributions | — | 2 | — | 3 | 54 | 63 | |||||||||||||||||||||||||||||||||||
| Plan amendments | — | 18 | — | 28 | 30 | — | |||||||||||||||||||||||||||||||||||
| Actuarial (gain) loss | (382) | (274) | 603 | 17 | (144) | 103 | |||||||||||||||||||||||||||||||||||
| Foreign currency exchange rate changes | — | (88) | — | 180 | (6) | 5 | |||||||||||||||||||||||||||||||||||
| Benefits paid | (692) | (217) | (714) | (218) | (202) | (222) | |||||||||||||||||||||||||||||||||||
| Actual expenses/taxes | — | (2) | — | — | — | — | |||||||||||||||||||||||||||||||||||
| Divestitures/Acquisitions | — | — | — | (14) | — | — | |||||||||||||||||||||||||||||||||||
| Curtailment | — | — | — | 2 | (1) | — | |||||||||||||||||||||||||||||||||||
| Special termination costs | — | — | — | 2 | — | — | |||||||||||||||||||||||||||||||||||
| Benefit obligation at December 31 | 10,140 | 3,289 | 10,392 | 3,605 | 1,880 | 2,017 | |||||||||||||||||||||||||||||||||||
| Change in Plan Assets | |||||||||||||||||||||||||||||||||||||||||
| Fair value of plan assets at January 1 | 9,137 | 3,398 | 7,942 | 3,286 | — | — | |||||||||||||||||||||||||||||||||||
| Actual return on plan assets | 338 | (133) | 889 | 46 | — | — | |||||||||||||||||||||||||||||||||||
| Foreign currency exchange rate changes | — | (77) | — | 181 | — | — | |||||||||||||||||||||||||||||||||||
| Employer contributions | 754 | 90 | 1,020 | 100 | 148 | 159 | |||||||||||||||||||||||||||||||||||
| Plan participants’ contributions | — | 2 | — | 3 | 54 | 63 | |||||||||||||||||||||||||||||||||||
| Benefits paid | (692) | (217) | (714) | (218) | (202) | (222) | |||||||||||||||||||||||||||||||||||
| Actual expenses | — | (2) | — | — | — | — | |||||||||||||||||||||||||||||||||||
| Fair value of plan assets at December 31 | 9,537 | 3,061 | 9,137 | 3,398 | — | — | |||||||||||||||||||||||||||||||||||
| Funded status at December 31 | $ | (603) | $ | (228) | $ | (1,255) | $ | (207) | $ | (1,880) | $ | (2,017) |
| Notes to the Consolidated Financial Statements | Financial Table of Contents | |||||||
| Millions of dollars, except per-share amounts |
Amounts recognized on the Consolidated Balance Sheet for the company’s pension and OPEB plans at December 31, 2024 and 2023, include:
| Pension Benefits | |||||||||||||||||||||||||||||||||||||||||
| 2024 | 2023 | Other Benefits | |||||||||||||||||||||||||||||||||||||||
| U.S. | Int’l. | U.S. | Int’l. | 2024 | 2023 | ||||||||||||||||||||||||||||||||||||
| Deferred charges and other assets | $ | 607 | $ | 655 | $ | 31 | $ | 703 | $ | — | $ | — | |||||||||||||||||||||||||||||
| Accrued liabilities | (146) | (71) | (145) | (73) | (149) | (154) | |||||||||||||||||||||||||||||||||||
| Noncurrent employee benefit plans | (1,064) | (812) | (1,141) | (837) | (1,731) | (1,863) | |||||||||||||||||||||||||||||||||||
| Net amount recognized at December 31 | $ | (603) | $ | (228) | $ | (1,255) | $ | (207) | $ | (1,880) | $ | (2,017) |
For the year ended December 31, 2024, the decrease in benefit obligations was primarily due to actuarial gains caused by higher discount rates used to value the obligations. For the year ended December 31, 2023, the increase in benefit obligations was primarily due to actuarial losses caused by lower discount rates used to value the obligations.
Amounts recognized on a before-tax basis in “Accumulated other comprehensive loss” for the company’s pension and OPEB plans were $3,376 and $3,792 at the end of 2024 and 2023, respectively. These amounts consisted of:
| Pension Benefits | |||||||||||||||||||||||||||||||||||||||||
| 2024 | 2023 | Other Benefits | |||||||||||||||||||||||||||||||||||||||
| U.S. | Int’l. | U.S. | Int’l. | 2024 | 2023 | ||||||||||||||||||||||||||||||||||||
| Net actuarial (gain) loss | $ | 2,796 | $ | 849 | $ | 3,161 | $ | 823 | $ | (401) | $ | (266) | |||||||||||||||||||||||||||||
| Prior service (credits) costs | 33 | 133 | 37 | 126 | (34) | (89) | |||||||||||||||||||||||||||||||||||
| Total recognized at December 31 | $ | 2,829 | $ | 982 | $ | 3,198 | $ | 949 | $ | (435) | $ | (355) |
The accumulated benefit obligations for all U.S. and international pension plans were $9,053 and $3,066, respectively, at December 31, 2024, and $9,284 and $3,378, respectively, at December 31, 2023.
Information for U.S. and international pension plans with an accumulated benefit obligation in excess of plan assets at December 31, 2024 and 2023, was:
| Pension Benefits | ||||||||||||||||||||||||||
| 2024 | 2023 | |||||||||||||||||||||||||
| U.S. | Int’l. | U.S. | Int’l. | |||||||||||||||||||||||
| Projected benefit obligations | $ | 1,214 | $ | 884 | $ | 1,203 | $ | 913 | ||||||||||||||||||
| Accumulated benefit obligations | 1,145 | 744 | 1,108 | 773 | ||||||||||||||||||||||
| Fair value of plan assets | 7 | 1 | — | 4 |
The components of net periodic benefit cost and amounts recognized in the Consolidated Statement of Comprehensive Income for 2024, 2023 and 2022 are shown in the table below:
| Notes to the Consolidated Financial Statements | Financial Table of Contents | |||||||
| Millions of dollars, except per-share amounts |
| Pension Benefits | |||||||||||||||||||||||||||||||||||||||||||||||
| 2024 | 2023 | 2022 | Other Benefits | ||||||||||||||||||||||||||||||||||||||||||||
| U.S. | Int’l. | U.S. | Int’l. | U.S. | Int’l. | 2024 | 2023 | 2022 | |||||||||||||||||||||||||||||||||||||||
| Net Periodic Benefit Cost | |||||||||||||||||||||||||||||||||||||||||||||||
| Service cost | $ | 357 | $ | 54 | $ | 342 | $ | 58 | $ | 432 | $ | 83 | $ | 34 | $ | 33 | $ | 43 | |||||||||||||||||||||||||||||
| Interest cost | 465 | 191 | 448 | 193 | 318 | 137 | 98 | 97 | 60 | ||||||||||||||||||||||||||||||||||||||
| Expected return on plan assets | (597) | (196) | (557) | (204) | (624) | (176) | — | — | — | ||||||||||||||||||||||||||||||||||||||
| Amortization of prior service costs (credits) | 4 | 11 | 4 | 8 | 2 | 6 | (25) | (25) | (27) | ||||||||||||||||||||||||||||||||||||||
| Recognized actuarial (gains) losses | 243 | 18 | 199 | 8 | 218 | 15 | (15) | (19) | 13 | ||||||||||||||||||||||||||||||||||||||
| Settlement losses (gains) | — | 1 | 56 | — | 363 | (6) | — | — | — | ||||||||||||||||||||||||||||||||||||||
| Curtailment losses (gains) | — | — | — | 2 | — | (5) | (1) | — | — | ||||||||||||||||||||||||||||||||||||||
| Special termination benefits | — | — | — | 2 | — | — | — | — | — | ||||||||||||||||||||||||||||||||||||||
| Acquisition/Divestiture losses (gains) | — | — | — | (2) | — | — | — | — | — | ||||||||||||||||||||||||||||||||||||||
| Total net periodic benefit cost | 472 | 79 | 492 | 65 | 709 | 54 | 91 | 86 | 89 | ||||||||||||||||||||||||||||||||||||||
| Changes Recognized in Comprehensive Income | |||||||||||||||||||||||||||||||||||||||||||||||
| Net actuarial (gain) loss during period | (122) | 45 | 270 | 172 | (279) | (257) | (151) | 108 | (514) | ||||||||||||||||||||||||||||||||||||||
| Amortization of actuarial (gain) loss | (243) | (19) | (255) | (8) | (581) | (5) | 15 | 19 | (13) | ||||||||||||||||||||||||||||||||||||||
| Prior service (credits) costs during period | — | 18 | — | 28 | 40 | 38 | 30 | 1 | 18 | ||||||||||||||||||||||||||||||||||||||
| Amortization of prior service (costs) credits | (4) | (11) | (4) | (8) | (2) | (6) | 25 | 25 | 27 | ||||||||||||||||||||||||||||||||||||||
| Total changes recognized in other comprehensive income | (369) | 33 | 11 | 184 | (822) | (230) | (81) | 153 | (482) | ||||||||||||||||||||||||||||||||||||||
| Recognized in Net Periodic Benefit Cost and Other Comprehensive Income | $ | 103 | $ | 112 | $ | 503 | $ | 249 | $ | (113) | $ | (176) | $ | 10 | $ | 239 | $ | (393) |
Assumptions The following weighted-average assumptions were used to determine benefit obligations and net periodic benefit costs for years ended December 31:
| Pension Benefits | ||||||||||||||||||||||||||||||||||||||||||||||||||
| 2024 | 2023 | 2022 | Other Benefits | |||||||||||||||||||||||||||||||||||||||||||||||
| U.S. | Int’l. | U.S. | Int’l. | U.S. | Int’l. | 2024 | 2023 | 2022 | ||||||||||||||||||||||||||||||||||||||||||
| Assumptions used to determine benefit obligations: | ||||||||||||||||||||||||||||||||||||||||||||||||||
| Discount rate | 5.7 | % | 6.0 | % | 5.0 | % | 5.5 | % | 5.2 | % | 5.8 | % | 5.7 | % | 5.1 | % | 5.3 | % | ||||||||||||||||||||||||||||||||
| Rate of compensation increase | 4.5 | % | 3.9 | % | 4.5 | % | 3.9 | % | 4.5 | % | 4.2 | % | N/A | N/A | N/A | |||||||||||||||||||||||||||||||||||
| Assumptions used to determine net periodic benefit cost: | ||||||||||||||||||||||||||||||||||||||||||||||||||
| Discount rate for service cost | 5.0 | % | 5.5 | % | 5.2 | % | 5.8 | % | 3.6 | % | 2.8 | % | 5.2 | % | 5.4 | % | 3.1 | % | ||||||||||||||||||||||||||||||||
| Discount rate for interest cost | 4.8 | % | 5.5 | % | 5.0 | % | 5.8 | % | 2.8 | % | 2.8 | % | 5.1 | % | 5.2 | % | 2.4 | % | ||||||||||||||||||||||||||||||||
| Expected return on plan assets | 7.0 | % | 5.9 | % | 7.0 | % | 6.1 | % | 6.6 | % | 3.9 | % | N/A | N/A | N/A | |||||||||||||||||||||||||||||||||||
| Rate of compensation increase | 4.5 | % | 3.9 | % | 4.5 | % | 4.2 | % | 4.5 | % | 4.1 | % | N/A | N/A | N/A |
Expected Return on Plan Assets The company’s estimated long-term rates of return on pension assets are driven primarily by actual historical asset-class returns, an assessment of expected future performance, advice from external actuarial firms and the incorporation of specific asset-class risk factors. Asset allocations are periodically updated using pension plan asset/liability studies, and the company’s estimated long-term rates of return are consistent with these studies. For 2024, the company used an expected long-term rate of return of 7.0 percent for U.S. pension plan assets, which account for 73 percent of the company’s pension plan assets at the beginning of the year.
The market-related value of assets of the main U.S. pension plan used in the determination of pension expense was based on the market values in the three months preceding the year-end measurement date. Management considers the three-month time period long enough to minimize the effects of distortions from day-to-day market volatility and still be contemporaneous to the end of the year. For other plans, market value of assets as of year-end is used in calculating the pension expense.
Discount Rate The discount rate assumptions used to determine the U.S. and international pension and OPEB plan obligations and expense reflect the rate at which benefits could be effectively settled, and are equal to the equivalent single rate resulting from yield curve analysis. This analysis considered the projected benefit payments specific to the company’s plans and the yields on high-quality bonds. The projected cash flows were discounted to the valuation date using the yield curve for the main U.S. pension and OPEB plans. The effective discount rates derived from this analysis were 5.7 percent, 5.0 percent, and 5.2 percent for 2024, 2023, and 2022, respectively, for the main U.S. pension plan and 5.6 percent, 5.0 percent, and 5.2 percent for 2024, 2023, and 2022, respectively, for the main U.S. OPEB plans.
| Notes to the Consolidated Financial Statements | Financial Table of Contents | |||||||
| Millions of dollars, except per-share amounts |
Other Benefit Assumptions For the measurement of accumulated post-employment benefit obligation at December 31, 2024, for the main U.S. OPEB plan, the assumed health care cost-trend rates start with 8.4 percent in 2025 and gradually decline to 4.5 percent for 2034 and beyond. For this measurement at December 31, 2023, the assumed health care cost-trend rates started with 8.4 percent in 2024 and gradually declined to 4.5 percent for 2033 and beyond.
Plan Assets and Investment Strategy
The fair value measurements of the company’s pension plans for 2024 and 2023 are as follows:
| U.S. | Int’l. | |||||||||||||||||||||||||||||||||||||||||||||||||||||||||||||
| Total | Level 1 | Level 2 | Level 3 | NAV | Total | Level 1 | Level 2 | Level 3 | NAV | |||||||||||||||||||||||||||||||||||||||||||||||||||||
| At December 31, 2023 | ||||||||||||||||||||||||||||||||||||||||||||||||||||||||||||||
| Equities | ||||||||||||||||||||||||||||||||||||||||||||||||||||||||||||||
| U.S.1 | $ | 1,691 | $ | 1,689 | $ | 1 | $ | 1 | $ | — | $ | 188 | $ | 188 | $ | — | $ | — | $ | — | ||||||||||||||||||||||||||||||||||||||||||
| International | 1,128 | 1,128 | — | — | — | 124 | 124 | — | — | — | ||||||||||||||||||||||||||||||||||||||||||||||||||||
| Collective Trusts/Mutual Funds2 | 1,269 | 4 | — | — | 1,265 | 95 | 6 | — | — | 89 | ||||||||||||||||||||||||||||||||||||||||||||||||||||
| Fixed Income | ||||||||||||||||||||||||||||||||||||||||||||||||||||||||||||||
| Government | 82 | — | 82 | — | — | 172 | 101 | 71 | — | — | ||||||||||||||||||||||||||||||||||||||||||||||||||||
| Corporate | 964 | — | 964 | — | — | 431 | 4 | 427 | — | — | ||||||||||||||||||||||||||||||||||||||||||||||||||||
| Bank Loans | 5 | — | 5 | — | — | — | — | — | — | — | ||||||||||||||||||||||||||||||||||||||||||||||||||||
| Mortgage/Asset Backed | 1 | — | 1 | — | — | 5 | — | 5 | — | — | ||||||||||||||||||||||||||||||||||||||||||||||||||||
| Collective Trusts/Mutual Funds2 | 2,293 | — | — | — | 2,293 | 1,819 | — | — | — | 1,819 | ||||||||||||||||||||||||||||||||||||||||||||||||||||
| Mixed Funds3 | — | — | — | — | — | 85 | 8 | 77 | — | — | ||||||||||||||||||||||||||||||||||||||||||||||||||||
| Real Estate4 | 1,087 | — | — | — | 1,087 | 147 | — | 24 | — | 123 | ||||||||||||||||||||||||||||||||||||||||||||||||||||
| Alternative Investments | — | — | — | — | — | 9 | — | 9 | — | — | ||||||||||||||||||||||||||||||||||||||||||||||||||||
| Cash and Cash Equivalents | 548 | 12 | — | — | 536 | 81 | 74 | 1 | — | 6 | ||||||||||||||||||||||||||||||||||||||||||||||||||||
| Other5 | 69 | (2) | 14 | 56 | 1 | 242 | — | 11 | 81 | 150 | ||||||||||||||||||||||||||||||||||||||||||||||||||||
| Total at December 31, 2023 | $ | 9,137 | $ | 2,831 | $ | 1,067 | $ | 57 | $ | 5,182 | $ | 3,398 | $ | 505 | $ | 625 | $ | 81 | $ | 2,187 | ||||||||||||||||||||||||||||||||||||||||||
| At December 31, 2024 | ||||||||||||||||||||||||||||||||||||||||||||||||||||||||||||||
| Equities | ||||||||||||||||||||||||||||||||||||||||||||||||||||||||||||||
| U.S.1 | $ | 1,866 | $ | 1,866 | $ | — | $ | — | $ | — | $ | 180 | $ | 180 | $ | — | $ | — | $ | — | ||||||||||||||||||||||||||||||||||||||||||
| International | 1,208 | 1,197 | — | 11 | — | 107 | 97 | — | 10 | — | ||||||||||||||||||||||||||||||||||||||||||||||||||||
| Collective Trusts/Mutual Funds2 | 1,191 | 4 | — | — | 1,187 | 98 | 6 | 13 | — | 79 | ||||||||||||||||||||||||||||||||||||||||||||||||||||
| Fixed Income | ||||||||||||||||||||||||||||||||||||||||||||||||||||||||||||||
| Government | 132 | — | 132 | — | — | 167 | 99 | 68 | — | — | ||||||||||||||||||||||||||||||||||||||||||||||||||||
| Corporate | 1,042 | — | 1,042 | — | — | 403 | 2 | 401 | — | — | ||||||||||||||||||||||||||||||||||||||||||||||||||||
| Bank Loans | 10 | — | 10 | — | — | — | — | — | — | — | ||||||||||||||||||||||||||||||||||||||||||||||||||||
| Mortgage/Asset Backed | 1 | — | 1 | — | — | 4 | — | 4 | — | — | ||||||||||||||||||||||||||||||||||||||||||||||||||||
| Collective Trusts/Mutual Funds2 | 2,342 | — | — | — | 2,342 | 1,594 | 2 | 10 | — | 1,582 | ||||||||||||||||||||||||||||||||||||||||||||||||||||
| Mixed Funds3 | — | — | — | — | — | 76 | — | 76 | — | — | ||||||||||||||||||||||||||||||||||||||||||||||||||||
| Real Estate4 | 1,383 | — | — | — | 1,383 | 105 | — | 16 | — | 89 | ||||||||||||||||||||||||||||||||||||||||||||||||||||
| Alternative Investments | — | — | — | — | — | 9 | — | 9 | — | — | ||||||||||||||||||||||||||||||||||||||||||||||||||||
| Cash and Cash Equivalents | 289 | 13 | — | — | 276 | 108 | 90 | — | — | 18 | ||||||||||||||||||||||||||||||||||||||||||||||||||||
| Other5 | 73 | (3) | 13 | 63 | — | 209 | — | 12 | 68 | 129 | ||||||||||||||||||||||||||||||||||||||||||||||||||||
| Total at December 31, 2024 | $ | 9,537 | $ | 3,077 | $ | 1,198 | $ | 74 | $ | 5,188 | $ | 3,060 | $ | 476 | $ | 609 | $ | 78 | $ | 1,897 |
1 There were no investments in the company’s common stock at December 31, 2024 or December 31, 2023.
2 Collective Trusts/Mutual Funds for U.S. plans are entirely index funds; for International plans, they are mostly unit trust and index funds.
3 Mixed funds are composed of funds that invest in both equity and fixed-income instruments in order to diversify and lower risk.
4 The year-end valuations of the U.S. real estate assets are based on third-party appraisals that occur at least once a year for each property in the portfolio.
5 The “Other” asset class includes net payables for securities purchased but not yet settled (Level 1); dividends and interest- and tax-related receivables (Level 2); insurance contracts (Level 3); and investments in private-equity limited partnerships (NAV).
| Notes to the Consolidated Financial Statements | Financial Table of Contents | |||||||
| Millions of dollars, except per-share amounts |
The effects of fair value measurements using significant unobservable inputs on changes in Level 3 plan assets are outlined below:
| Equity | ||||||||||||||||||||||||||||||||||||||
| U.S. | Int’l. | Real Estate | Other | Total | ||||||||||||||||||||||||||||||||||
| Total at December 31, 2022 | $ | — | $ | — | $ | 38 | $ | 139 | $ | 177 | ||||||||||||||||||||||||||||
| Actual Return on Plan Assets: | ||||||||||||||||||||||||||||||||||||||
| Assets held at the reporting date | 1 | — | 5 | — | 6 | |||||||||||||||||||||||||||||||||
| Assets sold during the period | — | — | — | (2) | (2) | |||||||||||||||||||||||||||||||||
| Purchases, Sales and Settlements | — | — | — | — | — | |||||||||||||||||||||||||||||||||
| Transfers in and/or out of Level 3 | — | — | (43) | — | (43) | |||||||||||||||||||||||||||||||||
| Total at December 31, 2023 | $ | 1 | $ | — | $ | — | $ | 137 | $ | 138 | ||||||||||||||||||||||||||||
| Actual Return on Plan Assets: | ||||||||||||||||||||||||||||||||||||||
| Assets held at the reporting date | (1) | 11 | — | — | 10 | |||||||||||||||||||||||||||||||||
| Assets sold during the period | — | 2 | — | 9 | 11 | |||||||||||||||||||||||||||||||||
| Purchases, Sales and Settlements | — | 2 | — | (9) | (7) | |||||||||||||||||||||||||||||||||
| Transfers in and/or out of Level 3 | — | 6 | — | (6) | — | |||||||||||||||||||||||||||||||||
| Total at December 31, 2024 | $ | — | $ | 21 | $ | — | $ | 131 | $ | 152 |
The primary investment objectives of the pension plans are to achieve the highest rate of total return within prudent levels of risk and liquidity, to diversify and mitigate potential downside risk associated with the investments, and to provide adequate liquidity for benefit payments and portfolio management.
The company’s U.S. and U.K. pension plans comprise 95 percent of the total pension assets. Both the U.S. and U.K. plans have an Investment Committee that regularly meets during the year to review the asset holdings and their returns. To assess the plans’ investment performance, long-term asset allocation policy benchmarks have been established.
For the primary U.S. pension plan, the company’s Investment Committee has established the following approved asset allocation ranges: Equities 30–60 percent, Fixed Income 30–50 percent, Real Estate 5–25 percent, Alternative Investments 0–5 percent and Cash 0–15 percent. For the U.K. pension plan, the U.K. Board of Trustees has established the following asset allocation guidelines: Equities 5–15 percent, Fixed Income 63–93 percent, Real Estate 5–15 percent, and Cash 0–7 percent. The other significant international pension plans also have established maximum and minimum asset allocation ranges that vary by plan. Actual asset allocation within approved ranges is based on a variety of factors, including market conditions and liquidity constraints. To mitigate concentration and other risks, assets are invested across multiple asset classes with active investment managers and passive index funds.
The company does not prefund its OPEB obligations.
Cash Contributions and Benefit Payments In 2024, the company contributed $754 and $90 to its U.S. and international pension plans, respectively. In 2025, the company expects contributions to be approximately $750 to its U.S. plans and $100 to its international pension plans. Actual contribution amounts are dependent upon investment returns, changes in pension obligations, regulatory environments, tax law changes and other economic factors. Additional funding may ultimately be required if investment returns are insufficient to offset increases in plan obligations.
The company anticipates paying OPEB benefits of approximately $150 in 2025; $148 was paid in 2024.
The following benefit payments, which include estimated future service, are expected to be paid by the company in the next 10 years:
| Pension Benefits | Other | ||||||||||||||||
| U.S. | Int’l. | Benefits | |||||||||||||||
| 2025 | $ | 899 | $ | 205 | $ | 149 | |||||||||||
| 2026 | 901 | 213 | 147 | ||||||||||||||
| 2027 | 894 | 221 | 145 | ||||||||||||||
| 2028 | 879 | 226 | 144 | ||||||||||||||
| 2029 | 871 | 231 | 143 | ||||||||||||||
| 2030-2034 | 4,251 | 1,279 | 709 |
Employee Savings Investment Plan Eligible employees of Chevron and certain of its subsidiaries participate in the Chevron Employee Savings Investment Plan (ESIP). Compensation expense for the ESIP totaled $330, $320 and $283 in 2024, 2023 and 2022, respectively.
| Notes to the Consolidated Financial Statements | Financial Table of Contents | |||||||
| Millions of dollars, except per-share amounts |
Benefit Plan Trusts Prior to its acquisition by Chevron, Texaco established a benefit plan trust for funding obligations under some of its benefit plans. At year-end 2024, the trust contained 14.2 million shares of Chevron treasury stock. The trust will sell the shares or use the dividends from the shares to pay benefits only to the extent that the company does not pay such benefits. The company intends to continue to pay its obligations under the benefit plans. The trustee will vote the shares held in the trust as instructed by the trust’s beneficiaries. The shares held in the trust are not considered outstanding for earnings-per-share purposes until distributed or sold by the trust in payment of benefit obligations.
Employee Incentive Plans The Chevron Incentive Plan is an annual cash bonus plan for eligible employees that links awards to corporate and individual performance in the prior year. Charges to expense for cash bonuses were $965, $809 and $1,169 in 2024, 2023 and 2022, respectively. Chevron also has the LTIP for officers and other regular salaried employees of the company and its subsidiaries who hold positions of significant responsibility. Awards under the LTIP consist of stock options and other share-based compensation that are described in Note 22 Stock Options and Other Share-Based Compensation.
Note 24
Other Contingencies and Commitments
Income Taxes The company calculates its income tax expense and liabilities quarterly. These liabilities generally are subject to audit and are not finalized with the individual taxing authorities until several years after the end of the annual period for which income taxes have been calculated. Refer to Note 17 Taxes for a discussion of the periods for which tax returns have been audited for the company’s major tax jurisdictions and a discussion for all tax jurisdictions of the differences between the amount of tax benefits recognized in the financial statements and the amount taken or expected to be taken in a tax return.
Settlement of open tax years, as well as other tax issues in countries where the company conducts its businesses, are not expected to have a material effect on the consolidated financial position or liquidity of the company and, in the opinion of management, adequate provisions have been made for all years under examination or subject to future examination.
Guarantees The company has one guarantee to an equity affiliate totaling $98. This guarantee is associated with certain payments under a terminal use agreement entered into by an equity affiliate. Over the approximate 3-year remaining term of this guarantee, the maximum guarantee amount will be reduced as certain fees are paid by the affiliate. There are numerous cross-indemnity agreements with the affiliate and the other partners to permit recovery of amounts paid under the guarantee. Chevron has recorded no liability for this guarantee.
Indemnifications The company often includes standard indemnification provisions in its arrangements with its partners, suppliers and vendors in the ordinary course of business, the terms of which range in duration and sometimes are not limited. The company may be obligated to indemnify such parties for losses or claims suffered or incurred in connection with its service or other claims made against such parties.
Long-Term Unconditional Purchase Obligations and Commitments, Including Throughput and Take-or-Pay Agreements The company and its subsidiaries have certain contingent liabilities with respect to long-term unconditional purchase obligations and commitments, including throughput and take-or-pay agreements, some of which may relate to suppliers’ financing arrangements. The agreements typically provide goods and services, such as pipeline and storage capacity, utilities, and petroleum products, to be used or sold in the ordinary course of the company’s business. The aggregate amounts of required payments under throughput and take-or-pay agreements are: 2025 – $1,039; 2026 – $1,129; 2027 – $1,304; 2028 – $1,326; 2029 – $1,236; after 2029 – $6,882. The aggregate amount of required payments for other unconditional purchase obligations are: 2025 – $436; 2026 – $653; 2027 – $477; 2028 – $380; 2029 – $186; after 2029 – $907. A portion of these commitments may ultimately be shared with project partners. Total payments under the agreements were $1,354 in 2024, $1,420 in 2023 and $1,866 in 2022.
Environmental The company is subject to loss contingencies pursuant to laws, regulations, private claims and legal proceedings related to environmental matters that are subject to legal settlements or that in the future may require the company to take action to correct or ameliorate the effects on the environment of prior release of chemicals or petroleum substances by the company or other parties. Such contingencies may exist for various operating, closed and divested sites, including, but not limited to, U.S. federal Superfund sites and analogous sites under state laws, refineries, chemical plants, marketing facilities, crude oil fields and mining sites.
| Notes to the Consolidated Financial Statements | Financial Table of Contents | |||||||
| Millions of dollars, except per-share amounts |
Although the company has provided for known environmental obligations that are probable and reasonably estimable, it is likely that the company will continue to incur additional liabilities. The amount of additional future costs are not fully determinable due to such factors as the unknown magnitude of possible contamination, the unknown timing and extent of the corrective actions that may be required, the determination of the company’s liability in proportion to other responsible parties, and the extent to which such costs are recoverable from third parties. These future costs may be material to results of operations in the period in which they are recognized, but the company does not expect these costs will have a material effect on its consolidated financial position or liquidity.
Chevron’s environmental reserve as of December 31, 2024, was $945. Included in this balance was $220 related to remediation activities at sites for which the company has been identified as a potentially responsible party under the provisions of the U.S. federal Superfund law which provide for joint and several liability for all responsible parties. Any future actions by regulatory agencies to require Chevron to assume other potentially responsible parties’ costs at designated hazardous waste sites are not expected to have a material effect on the company’s results of operations, consolidated financial position or liquidity.
Of the remaining year-end 2024 environmental reserves balance of $725, $440 is related to the company’s U.S. downstream operations, $49 to its international downstream operations, and $236 to its upstream operations. Liabilities at all sites were primarily associated with the company’s plans and activities to remediate soil or groundwater contamination or both.
The company manages environmental liabilities under specific sets of regulatory requirements, which in the United States include the Resource Conservation and Recovery Act and various state and local regulations. No single remediation site at year-end 2024 had a recorded liability that was material to the company’s results of operations, consolidated financial position or liquidity.
Refer to Note 25 Asset Retirement Obligations for a discussion of the company’s asset retirement obligations.
Decommissioning Obligations for Previously Divested Assets Some assets are divested along with their related liabilities, such as decommissioning obligations. In certain instances, such transferred obligations have returned and may continue to return to the company. For example, in fourth quarter 2023, the company recognized charges for decommissioning obligations from certain previously divested assets in the Gulf of America. To the extent the current owners of the company’s previously divested assets default on their decommissioning obligations, regulators may require that Chevron assume such obligations. The company could have additional significant obligations revert, primarily in the United States. The company is not currently aware of any such obligations that are reasonably possible to be material. The liability balance at the end of 2023 was $2,708, $235 was spent in 2024, and the balance at the end of 2024 was $2,478.
Other Contingencies The company and its affiliates continue to review and analyze their operations and may close, retire, sell, exchange, acquire or restructure assets to achieve operational or strategic benefits and to improve competitiveness and profitability. These activities, individually or together, may result in significant gains or losses in future periods.
Chevron receives claims from and submits claims to customers; trading partners; joint venture partners; U.S. federal, state and local regulatory bodies; governments; contractors; insurers; suppliers; and individuals. The amounts of these claims, individually and in the aggregate, may be significant and take lengthy periods to resolve, and may result in gains or losses in future periods.
Note 25
Asset Retirement Obligations
The company records the fair value of a liability for an asset retirement obligation (ARO) both as an asset and a liability when there is a legal obligation associated with the retirement of a tangible long-lived asset and the liability can be reasonably estimated. The legal obligation to perform the asset retirement activity is unconditional, even though uncertainty may exist about the timing and/or method of settlement that may be beyond the company’s control. This uncertainty about the timing and/or method of settlement is factored into the measurement of the liability when sufficient information exists to reasonably estimate fair value. The ARO liability is initially recognized at its fair value with an increase to the related asset. Subsequent accretion of the liability and depreciation of the asset is recorded over time. The company evaluates its ARO estimates regularly or when there is significant new information about costs, timing, and duration of asset retirement activity.
| Notes to the Consolidated Financial Statements | Financial Table of Contents | |||||||
| Millions of dollars, except per-share amounts |
AROs are primarily recorded for the company’s crude oil and natural gas producing assets. No significant AROs associated with any legal obligations to retire downstream long-lived assets have been recognized, as indeterminate settlement dates for the asset retirements prevent estimation of the fair value of the associated ARO. The company performs periodic reviews of its downstream long-lived assets for any changes in facts and circumstances that might require recognition of a retirement obligation.
The following table indicates the changes to the company’s before-tax asset retirement obligations in 2024, 2023 and 2022:
| 2024 | 2023 | 2022 | ||||||||||||||||||
| Balance at January 1 | $ | 13,833 | $ | 12,701 | $ | 12,808 | ||||||||||||||
| Liabilities assumed in the PDC acquisition | — | 220 | — | |||||||||||||||||
| Liabilities incurred | 83 | 183 | 9 | |||||||||||||||||
| Liabilities settled | (2,083) | (1,471) | (1,102) | |||||||||||||||||
| Reduction due to asset sales | (171) | (94) | (179) | |||||||||||||||||
| Accretion expense | 588 | 593 | 560 | |||||||||||||||||
| Revisions in estimated cash flows | 417 | 1,701 | 605 | |||||||||||||||||
| Balance at December 31 | $ | 12,667 | $ | 13,833 | $ | 12,701 |
In the table above, the amount associated with “Revisions in estimated cash flows” primarily reflects increased cost estimates and scope changes to decommission wells, equipment and facilities. The long-term portion of the $12,667 balance at the end of 2024 was $11,429.
Note 26
Revenue
Revenue from contracts with customers is presented in “Sales and other operating revenues” along with some activity that is accounted for outside the scope of Accounting Standard Codification (ASC) 606, which is not material to this line, on the Consolidated Statement of Income. Purchases and sales of inventory with the same counterparty that are entered into in contemplation of one another (including buy/sell arrangements) are combined and recorded on a net basis and reported in “Purchased crude oil and products” on the Consolidated Statement of Income. Refer to Note 14 Operating Segments and Geographic Data for additional information on the company’s segmentation of revenue.
Receivables related to revenue from contracts with customers are included in “Accounts and notes receivable” on the Consolidated Balance Sheet, net of the allowance for doubtful accounts. The net balance of these receivables was $14,227 and $13,641 at December 31, 2024 and 2023, respectively. Other items included in “Accounts and notes receivable” represent amounts due from partners for their share of joint venture operating and project costs and amounts due from others, primarily related to derivatives, leases, buy/sell arrangements and product exchanges, which are accounted for outside the scope of ASC 606*.*
Contract assets and related costs are reflected in “Prepaid expenses and other current assets” and contract liabilities are reflected in “Accrued liabilities” and “Deferred credits and other noncurrent obligations” on the Consolidated Balance Sheet. Amounts for these items are not material to the company’s financial position.
Note 27
Other Financial Information
Earnings in 2024 included after-tax gains of approximately $246 relating to the sale of certain properties. Of this amount, approximately $231 and $15 related to upstream and downstream, respectively. Earnings in 2023 included after-tax gains of approximately $143 relating to the sale of certain properties, of which approximately $110 and $33 related to upstream and downstream assets, respectively. Earnings in 2022 included after-tax gains of approximately $390 relating to the sale of certain properties, of which approximately $300 and $90 related to upstream and downstream assets, respectively.
Earnings in 2024 included after-tax charges of approximately $715 for severance ($208 in All Other, $188 in U.S. Downstream, $183 in U.S. Upstream, $119 in International Upstream, $17 in International Downstream) and $400 for impairments ($185 in International Downstream, $125 in International Upstream, $90 in U.S. Downstream). Earnings in 2023 included after-tax charges of approximately $1,950 for decommissioning obligations from previously divested oil and gas production assets in the U.S. Upstream Gulf of America, $1,765 for U.S. Upstream impairments, mainly in California, and several tax items with a net benefit of $655 in International Upstream. Earnings in 2022 included after-tax charges of approximately $1,075 for impairments and other asset write-offs related to International Upstream, $600 for an early contract termination in U.S. Upstream, and $271 for pension settlement costs in All Other.
| Notes to the Consolidated Financial Statements | Financial Table of Contents | |||||||
| Millions of dollars, except per-share amounts |
| Other financial information is as follows: | ||||||||||||||||||||
| Year ended December 31 | ||||||||||||||||||||
| 2024 | 2023 | 2022 | ||||||||||||||||||
| Total financing interest and debt costs | $ | 773 | $ | 617 | $ | 630 | ||||||||||||||
| Less: Capitalized interest | 179 | 148 | 114 | |||||||||||||||||
| Interest and debt expense | $ | 594 | $ | 469 | $ | 516 | ||||||||||||||
| Research and development expenses | $ | 353 | $ | 320 | $ | 268 | ||||||||||||||
| Excess of replacement cost over the carrying value of inventories (LIFO method) | $ | 5,997 | $ | 6,455 | $ | 9,061 | ||||||||||||||
| LIFO profits (losses) on inventory drawdowns included in earnings | $ | (111) | $ | 14 | $ | 122 | ||||||||||||||
| Foreign currency effects* | $ | 520 | $ | (224) | $ | 669 |
- Includes $45, $(11) and $253 in 2024, 2023 and 2022, respectively, for the company’s share of equity affiliates’ foreign currency effects.
The company has $4,578 in goodwill on the Consolidated Balance Sheet, of which $4,226 is in the upstream segment primarily related to the 2005 acquisition of Unocal and $352 is in the downstream segment related to the 2022 acquisition of Renewable Energy Group, Inc. The company tested this goodwill for impairment during 2024, and no impairment was required.
Note 28
Financial Instruments - Credit Losses
Chevron’s expected credit loss allowance balance was $611 and $641 at December 31, 2024, and December 31, 2023, respectively, with a majority of the allowance relating to non-trade receivable balances.
The majority of the company’s receivable balance is concentrated in trade receivables, with a balance of $18,338 at December 31, 2024, which reflects the company’s diversified sources of revenues and is dispersed across the company’s broad worldwide customer base. As a result, the company believes the concentration of credit risk is limited. The company routinely assesses the financial strength of its customers. When the financial strength of a customer is not considered sufficient, alternative risk mitigation measures may be deployed, including requiring prepayments, letters of credit or other acceptable forms of collateral. Once credit is extended and a receivable balance exists, the company applies a quantitative calculation to current trade receivable balances that reflects credit risk predictive analysis, including probability of default and loss given default, which takes into consideration current and forward-looking market data as well as the company’s historical loss data. This statistical approach becomes the basis of the company’s expected credit loss allowance for current trade receivables with payment terms that are typically short-term in nature, with most due in less than 90 days.
Chevron’s non-trade receivable balance was $3,835 at December 31, 2024, which includes receivables from certain governments in their capacity as joint venture partners. Joint venture partner balances that are paid as per contract terms or not yet due are subject to the statistical analysis described above while past due balances are subject to additional qualitative management quarterly review. This management review includes review of reasonable and supportable repayment forecasts. Non-trade receivables also include employee and tax receivables that are deemed immaterial and low risk. Loans to equity affiliates and non-equity investees are also considered non-trade and associated allowances of zero and $219 at December 31, 2024, and December 31, 2023, respectively, are included within “Investments and advances” on the Consolidated Balance Sheet.
| Notes to the Consolidated Financial Statements | Financial Table of Contents | |||||||
| Millions of dollars, except per-share amounts |
Note 29
Acquisition of PDC Energy, Inc.
On August 7, 2023, the company acquired PDC Energy, Inc. (PDC), an independent exploration and production company with operations in the Denver-Julesburg Basin in Colorado and the Delaware Basin in west Texas.
The aggregate purchase price of PDC was $6,520, with approximately 41 million shares of Chevron common stock issued as consideration in the transaction. The shares represented approximately two percent of the shares of Chevron common stock outstanding immediately after the transaction closed on August 7, 2023.
The acquisition was accounted for as a business combination under ASC 805, which requires assets acquired and liabilities assumed to be measured at their acquisition date fair value. Oil and gas properties were valued using a discounted cash flow approach that incorporated internally generated price assumptions and production profiles together with appropriate operating cost and development cost assumptions. Debt assumed in the acquisition was valued based on observable market prices for PDC’s debt. As a result of measuring the assets acquired and the liabilities assumed at fair value, there was no goodwill or bargain purchase recognized.
The following table summarizes the fair values assigned to assets acquired and liabilities assumed:
| At August 7, 2023 | |||||||||||
| Current assets | $ | 630 | |||||||||
| Properties, plant and equipment | 10,487 | ||||||||||
| Other assets | 118 | ||||||||||
| Total assets acquired | 11,235 | ||||||||||
| Current liabilities | 1,376 | ||||||||||
| Long-term debt | 1,473 | ||||||||||
| Deferred income tax | 1,397 | ||||||||||
| Other liabilities | 469 | ||||||||||
| Total liabilities assumed | 4,715 | ||||||||||
| Purchase Price | $ | 6,520 |
Pro forma financial information is not disclosed as the acquisition was deemed not to have a material impact on the company’s results of operations.
Note 30
Agreement to Acquire Hess Corporation
On October 23, 2023, Chevron Corporation announced it had entered into a definitive agreement with Hess Corporation (Hess) to acquire all of its outstanding shares in an all-stock transaction, valued at approximately $53,000, pursuant to which Hess stockholders will receive 1.0250 shares of Chevron common stock for each Hess share. The transaction was unanimously approved by the Boards of Directors of both companies.
On May 28, 2024, a majority of Hess stockholders voted to approve the merger. Following the Federal Trade Commission’s (FTC) review of the transaction, on September 30, 2024, the FTC announced that a majority of the Commission voted to accept a consent agreement among the FTC, Chevron and Hess, resolving the concerns the FTC identified during its review of the transaction. Chevron and Hess have taken and will continue to take appropriate steps to maintain our ability to close the merger under the Hart-Scott-Rodino Act of 1976, as amended. The filing of an arbitration relating to the right of first refusal contained in the Stabroek Block operating agreement among Hess Guyana Exploration Limited, a wholly owned subsidiary of Hess, and affiliates of Exxon Mobil Corporation, and China National Offshore Oil Corporation has delayed completion of the transaction. An arbitration decision against Hess Guyana and in favor of Exxon Guyana and CNOOC Guyana would cause the transaction not to be completed. The arbitration merits hearing has been scheduled for May 2025, with a decision expected in approximately the following three months.
Chevron and Hess are working to complete the merger as soon as practicable. However, neither Chevron nor Hess can predict the actual date on which the transaction will be completed, if at all, because it is subject to conditions beyond each company’s control. See Item 1A. Risk Factors for a discussion of risks related to the Hess acquisition.
| Supplemental Information on Oil and Gas Producing Activities - Unaudited | Financial Table of Contents |
In accordance with FASB and SEC disclosure requirements for oil and gas producing activities, this section provides supplemental information on oil and gas exploration and producing activities of the company in seven separate tables. Tables I through IV provide historical cost information pertaining to costs incurred in exploration, property acquisitions and development, capitalized costs and results of operations. Tables V through VII present information on the company’s estimated net proved reserve quantities, standardized measure of estimated discounted future net cash flows related to
Table I - Costs Incurred in Exploration, Property Acquisitions and Development****1
| Consolidated Companies | Affiliated Companies | |||||||||||||||||||||||||||||||
| Other | ||||||||||||||||||||||||||||||||
| Millions of dollars | U.S. | Americas | Africa | Asia | Australia | Europe | Total | TCO | Other | |||||||||||||||||||||||
| Year Ended December 31, 2024 | ||||||||||||||||||||||||||||||||
| Exploration | ||||||||||||||||||||||||||||||||
| Wells | $ | 193 | $ | 2 | $ | 155 | $ | 94 | $ | 4 | $ | — | $ | 448 | $ | — | $ | — | ||||||||||||||
| Geological and geophysical | 173 | 81 | 47 | 23 | 3 | — | 327 | — | — | |||||||||||||||||||||||
| Other | 62 | 62 | 70 | 15 | 30 | — | 239 | — | — | |||||||||||||||||||||||
| Total exploration | 428 | 145 | 272 | 132 | 37 | — | 1,014 | — | — | |||||||||||||||||||||||
| Property acquisitions2 | ||||||||||||||||||||||||||||||||
| Proved - Other | 11 | — | 95 | — | — | — | 106 | — | — | |||||||||||||||||||||||
| Unproved - Other | 69 | 38 | 22 | — | — | — | 129 | — | — | |||||||||||||||||||||||
| Total property acquisitions | 80 | 38 | 117 | — | — | — | 235 | — | — | |||||||||||||||||||||||
| Development3 | 9,334 | 1,261 | 895 | 774 | 1,015 | 54 | 13,333 | 1,480 | 7 | |||||||||||||||||||||||
| Total Costs Incurred****4 | $ | 9,842 | $ | 1,444 | $ | 1,284 | $ | 906 | $ | 1,052 | $ | 54 | $ | 14,582 | $ | 1,480 | $ | 7 | ||||||||||||||
| Year Ended December 31, 2023 | ||||||||||||||||||||||||||||||||
| Exploration | ||||||||||||||||||||||||||||||||
| Wells | $ | 280 | $ | 92 | $ | 36 | $ | 111 | $ | 11 | $ | — | $ | 530 | $ | — | $ | — | ||||||||||||||
| Geological and geophysical | 84 | 49 | 83 | — | — | — | 216 | — | — | |||||||||||||||||||||||
| Other | 50 | 104 | 57 | 15 | 32 | 4 | 262 | — | — | |||||||||||||||||||||||
| Total exploration | 414 | 245 | 176 | 126 | 43 | 4 | 1,008 | — | — | |||||||||||||||||||||||
| Property acquisitions2 | ||||||||||||||||||||||||||||||||
| Proved - Other | 10,123 | — | — | — | — | — | 10,123 | — | — | |||||||||||||||||||||||
| Unproved - Other | 504 | 1 | — | 3 | — | — | 508 | — | — | |||||||||||||||||||||||
| Total property acquisitions | 10,627 | 1 | — | 3 | — | — | 10,631 | — | — | |||||||||||||||||||||||
| Development3 | 9,645 | 986 | 784 | 619 | 822 | 64 | 12,920 | 2,278 | 86 | |||||||||||||||||||||||
| Total Costs Incurred****4 | $ | 20,686 | $ | 1,232 | $ | 960 | $ | 748 | $ | 865 | $ | 68 | $ | 24,559 | $ | 2,278 | $ | 86 | ||||||||||||||
| Year Ended December 31, 2022 | ||||||||||||||||||||||||||||||||
| Exploration | ||||||||||||||||||||||||||||||||
| Wells | $ | 239 | $ | 84 | $ | 78 | $ | 34 | $ | 4 | $ | — | $ | 439 | $ | — | $ | — | ||||||||||||||
| Geological and geophysical | 98 | 28 | 110 | — | 1 | — | 237 | — | — | |||||||||||||||||||||||
| Other | 53 | 72 | 75 | 30 | 27 | 2 | 259 | — | — | |||||||||||||||||||||||
| Total exploration | 390 | 184 | 263 | 64 | 32 | 2 | 935 | — | — | |||||||||||||||||||||||
| Property acquisitions2 | ||||||||||||||||||||||||||||||||
| Proved - Other | 18 | — | 63 | 13 | — | — | 94 | — | — | |||||||||||||||||||||||
| Unproved - Other | 104 | 78 | 73 | — | — | — | 255 | — | — | |||||||||||||||||||||||
| Total property acquisitions | 122 | 78 | 136 | 13 | — | — | 349 | — | — | |||||||||||||||||||||||
| Development3 | 6,221 | 863 | 21 | 649 | 719 | 35 | 8,508 | 2,429 | 34 | |||||||||||||||||||||||
| Total Costs Incurred****4 | $ | 6,733 | $ | 1,125 | $ | 420 | $ | 726 | $ | 751 | $ | 37 | $ | 9,792 | $ | 2,429 | $ | 34 |
| 1 Includes costs incurred whether capitalized or expensed. Excludes general support equipment expenditures. Includes capitalized amounts related to asset retirement obligations. See Note 25 Asset Retirement Obligations. | ||||||||||||||||||||
| 2 Includes wells, equipment and facilities associated with proved reserves. Does not include properties acquired in nonmonetary transactions. | ||||||||||||||||||||
| 3 Includes $59, $208 and $186 of costs incurred on major capital projects prior to assignment of proved reserves for consolidated companies in 2024, 2023, and 2022, respectively. | ||||||||||||||||||||
| 4 Reconciliation of consolidated companies total cost incurred to Upstream Capex - $ billions: | ||||||||||||||||||||
| 2024 | 2023 | 2022 | ||||||||||||||||||
| Total cost incurred by Consolidated Companies | $ | 14.6 | $ | 24.6 | $ | 9.8 | ||||||||||||||
| PDC Energy, Inc. (PDC) acquisition | — | (10.5) | — | |||||||||||||||||
| Expensed exploration costs | (0.6) | (0.5) | (0.5) | (Geological and geophysical and other exploration costs) | ||||||||||||||||
| Non-oil and gas activities | 0.6 | 1.4 | 0.6 | (Primarily LNG and transportation activities) | ||||||||||||||||
| ARO reduction/(build) | (0.3) | (1.3) | (0.3) | |||||||||||||||||
| Upstream Capex | $ | 14.3 | $ | 13.7 | $ | 9.6 | Reference page 50 Upstream Capex |
| Supplemental Information on Oil and Gas Producing Activities - Unaudited | Financial Table of Contents |
proved reserves, and changes in estimated discounted future net cash flows. The amounts for consolidated companies are organized by geographic areas including the United States, Other Americas, Africa, Asia, Australia/Oceania and Europe. Amounts for affiliated companies include Chevron’s equity interests in Tengizchevroil (TCO) in the Republic of Kazakhstan and in other affiliates, principally in Angola. Refer to Note 15 Investments and Advances for a discussion of the company’s major equity affiliates.
| Table II - Capitalized Costs Related to Oil and Gas Producing Activities | ||||||||||||||||||||||||||||||||
| Consolidated Companies | Affiliated Companies | |||||||||||||||||||||||||||||||
| Other | ||||||||||||||||||||||||||||||||
| Millions of dollars | U.S. | Americas | Africa | Asia | Australia | Europe | Total | TCO | Other | |||||||||||||||||||||||
| At December 31, 2024 | ||||||||||||||||||||||||||||||||
| Unproved properties | $ | 2,473 | $ | 1,545 | $ | 287 | $ | 536 | $ | 1,882 | $ | — | $ | 6,723 | $ | 108 | $ | — | ||||||||||||||
| Proved properties and related producing assets | 109,147 | 15,739 | 48,391 | 29,265 | 24,310 | 2,283 | 229,135 | 35,374 | 1,612 | |||||||||||||||||||||||
| Support equipment | 2,075 | 213 | 1,565 | 698 | 19,134 | — | 23,685 | 733 | — | |||||||||||||||||||||||
| Deferred exploratory wells | 17 | 69 | 204 | 179 | 1,119 | 74 | 1,662 | — | — | |||||||||||||||||||||||
| Other uncompleted projects | 8,918 | 650 | 1,756 | 1,040 | 1,814 | 69 | 14,247 | 4,634 | — | |||||||||||||||||||||||
| Gross Capitalized Costs | 122,630 | 18,216 | 52,203 | 31,718 | 48,259 | 2,426 | 275,452 | 40,849 | 1,612 | |||||||||||||||||||||||
| Unproved properties valuation | 119 | 1,119 | 213 | 533 | 5 | — | 1,989 | 80 | — | |||||||||||||||||||||||
| Proved producing properties – Depreciation and depletion | 69,545 | 10,314 | 41,485 | 18,251 | 14,038 | 956 | 154,589 | 11,441 | 1,014 | |||||||||||||||||||||||
| Support equipment depreciation | 1,265 | 152 | 1,231 | 556 | 6,375 | — | 9,579 | 535 | — | |||||||||||||||||||||||
| Accumulated provisions | 70,929 | 11,585 | 42,929 | 19,340 | 20,418 | 956 | 166,157 | 12,056 | 1,014 | |||||||||||||||||||||||
| Net Capitalized Costs | $ | 51,701 | $ | 6,631 | $ | 9,274 | $ | 12,378 | $ | 27,841 | $ | 1,470 | $ | 109,295 | $ | 28,793 | $ | 598 | ||||||||||||||
| At December 31, 2023 | ||||||||||||||||||||||||||||||||
| Unproved properties | $ | 2,541 | $ | 1,666 | $ | 265 | $ | 536 | $ | 1,882 | $ | — | $ | 6,890 | $ | 108 | $ | — | ||||||||||||||
| Proved properties and related producing assets | 100,680 | 23,867 | 47,635 | 30,387 | 23,842 | 2,228 | 228,639 | 23,139 | 1,609 | |||||||||||||||||||||||
| Support equipment | 2,121 | 191 | 1,555 | 688 | 19,118 | — | 23,673 | 673 | — | |||||||||||||||||||||||
| Deferred exploratory wells | — | 73 | 205 | 178 | 1,119 | 74 | 1,649 | — | — | |||||||||||||||||||||||
| Other uncompleted projects | 10,872 | 734 | 1,271 | 1,121 | 1,469 | 52 | 15,519 | 15,438 | 130 | |||||||||||||||||||||||
| Gross Capitalized Costs | 116,214 | 26,531 | 50,931 | 32,910 | 47,430 | 2,354 | 276,370 | 39,358 | 1,739 | |||||||||||||||||||||||
| Unproved properties valuation | 168 | 1,214 | 183 | 533 | 5 | — | 2,103 | 77 | — | |||||||||||||||||||||||
| Proved producing properties – Depreciation and depletion | 65,055 | 14,009 | 39,921 | 18,941 | 12,082 | 834 | 150,842 | 10,279 | 866 | |||||||||||||||||||||||
| Support equipment depreciation | 1,295 | 155 | 1,202 | 529 | 5,478 | — | 8,659 | 478 | — | |||||||||||||||||||||||
| Accumulated provisions | 66,518 | 15,378 | 41,306 | 20,003 | 17,565 | 834 | 161,604 | 10,834 | 866 | |||||||||||||||||||||||
| Net Capitalized Costs | $ | 49,696 | $ | 11,153 | $ | 9,625 | $ | 12,907 | $ | 29,865 | $ | 1,520 | $ | 114,766 | $ | 28,524 | $ | 873 | ||||||||||||||
| At December 31, 2022 | ||||||||||||||||||||||||||||||||
| Unproved properties | $ | 2,541 | $ | 2,176 | $ | 265 | $ | 970 | $ | 1,987 | $ | — | $ | 7,939 | $ | 108 | $ | — | ||||||||||||||
| Proved properties and related producing assets | 83,525 | 22,867 | 46,950 | 31,179 | 22,926 | 2,186 | 209,633 | 15,793 | 1,552 | |||||||||||||||||||||||
| Support equipment | 2,146 | 194 | 1,543 | 696 | 19,107 | — | 23,686 | 646 | — | |||||||||||||||||||||||
| Deferred exploratory wells | 43 | 56 | 116 | 40 | 1,119 | 74 | 1,448 | — | — | |||||||||||||||||||||||
| Other uncompleted projects | 8,213 | 610 | 1,095 | 914 | 1,869 | 30 | 12,731 | 20,590 | 54 | |||||||||||||||||||||||
| Gross Capitalized Costs | 96,468 | 25,903 | 49,969 | 33,799 | 47,008 | 2,290 | 255,437 | 37,137 | 1,606 | |||||||||||||||||||||||
| Unproved properties valuation | 178 | 1,589 | 146 | 969 | 110 | — | 2,992 | 74 | — | |||||||||||||||||||||||
| Proved producing properties – Depreciation and depletion | 58,253 | 12,974 | 38,543 | 19,051 | 10,689 | 720 | 140,230 | 9,441 | 654 | |||||||||||||||||||||||
| Support equipment depreciation | 1,302 | 155 | 1,166 | 500 | 4,644 | — | 7,767 | 424 | — | |||||||||||||||||||||||
| Accumulated provisions | 59,733 | 14,718 | 39,855 | 20,520 | 15,443 | 720 | 150,989 | 9,939 | 654 | |||||||||||||||||||||||
| Net Capitalized Costs | $ | 36,735 | $ | 11,185 | $ | 10,114 | $ | 13,279 | $ | 31,565 | $ | 1,570 | $ | 104,448 | $ | 27,198 | $ | 952 |
| Supplemental Information on Oil and Gas Producing Activities - Unaudited | Financial Table of Contents |
Table III - Results of Operations for Oil and Gas Producing Activities****1
The company’s results of operations from oil and gas producing activities for the years 2024, 2023 and 2022 are shown in the following table. Net income (loss) from exploration and production activities as reported on page 81 reflects income taxes computed on an effective rate basis.
Income taxes in Table III are based on statutory tax rates, reflecting allowable deductions and tax credits. Interest income and expense are excluded from the results reported in Table III and from the upstream net income amounts on page 81.
| Consolidated Companies | Affiliated Companies | |||||||||||||||||||||||||||||||
| Other | ||||||||||||||||||||||||||||||||
| Millions of dollars | U.S. | Americas | Africa | Asia | Australia | Europe | Total | TCO | Other | |||||||||||||||||||||||
| Year Ended December 31, 2024 | ||||||||||||||||||||||||||||||||
| Revenues from net production | ||||||||||||||||||||||||||||||||
| Sales | $ | 6,657 | $ | 799 | $ | 622 | $ | 3,376 | $ | 5,856 | $ | 319 | $ | 17,629 | $ | 7,240 | $ | 700 | ||||||||||||||
| Transfers | 18,043 | 3,110 | 5,227 | 2,101 | 4,237 | — | 32,718 | — | — | |||||||||||||||||||||||
| Total | 24,700 | 3,909 | 5,849 | 5,477 | 10,093 | 319 | 50,347 | 7,240 | 700 | |||||||||||||||||||||||
| Production expenses excluding taxes | (5,472) | (928) | (1,662) | (939) | (540) | (74) | (9,615) | (696) | (46) | |||||||||||||||||||||||
| Taxes other than on income | (1,445) | (67) | (165) | (24) | (209) | (3) | (1,913) | (1,117) | — | |||||||||||||||||||||||
| Proved producing properties: | ||||||||||||||||||||||||||||||||
| Depreciation and depletion | (7,231) | (981) | (1,616) | (1,236) | (2,547) | (103) | (13,714) | (1,222) | (154) | |||||||||||||||||||||||
| Accretion expense2 | (205) | (26) | (127) | (63) | (104) | (8) | (533) | (5) | (3) | |||||||||||||||||||||||
| Exploration expenses | (352) | (141) | (308) | (233) | (33) | (1) | (1,068) | — | — | |||||||||||||||||||||||
| Unproved properties valuation | (68) | (31) | (30) | (1) | — | — | (130) | — | — | |||||||||||||||||||||||
| Other income (loss)3 | 247 | 1,556 | 534 | 139 | (8) | (4) | 2,464 | (80) | (150) | |||||||||||||||||||||||
| Results before income taxes | 10,174 | 3,291 | 2,475 | 3,120 | 6,652 | 126 | 25,838 | 4,120 | 347 | |||||||||||||||||||||||
| Income tax (expense) benefit | (2,238) | (954) | (1,240) | (1,684) | (2,010) | (95) | (8,221) | (1,238) | 12 | |||||||||||||||||||||||
| Results of Producing Operations | $ | 7,936 | $ | 2,337 | $ | 1,235 | $ | 1,436 | $ | 4,642 | $ | 31 | $ | 17,617 | $ | 2,882 | $ | 359 | ||||||||||||||
| Year Ended December 31, 2023 | ||||||||||||||||||||||||||||||||
| Revenues from net production | ||||||||||||||||||||||||||||||||
| Sales | $ | 6,658 | $ | 724 | $ | 515 | $ | 3,309 | $ | 6,780 | $ | 368 | $ | 18,354 | $ | 6,831 | $ | 891 | ||||||||||||||
| Transfers | 15,948 | 3,243 | 5,979 | 2,151 | 4,753 | — | 32,074 | — | — | |||||||||||||||||||||||
| Total | 22,606 | 3,967 | 6,494 | 5,460 | 11,533 | 368 | 50,428 | 6,831 | 891 | |||||||||||||||||||||||
| Production expenses excluding taxes | (5,459) | (1,000) | (1,619) | (1,103) | (556) | (64) | (9,801) | (602) | (44) | |||||||||||||||||||||||
| Taxes other than on income | (1,222) | (69) | (142) | (27) | (256) | (4) | (1,720) | (675) | — | |||||||||||||||||||||||
| Proved producing properties: | ||||||||||||||||||||||||||||||||
| Depreciation and depletion | (7,133) | (1,042) | (1,414) | (1,114) | (2,561) | (115) | (13,379) | (895) | (173) | |||||||||||||||||||||||
| Accretion expense2 | (176) | (25) | (126) | (120) | (92) | (8) | (547) | (7) | (3) | |||||||||||||||||||||||
| Exploration expenses | (439) | (274) | (151) | (33) | (32) | (5) | (934) | — | — | |||||||||||||||||||||||
| Unproved properties valuation | (71) | (68) | (44) | — | — | — | (183) | — | — | |||||||||||||||||||||||
| Other income (loss)3 | (2,673) | (69) | 45 | 89 | (52) | 4 | (2,656) | 32 | (185) | |||||||||||||||||||||||
| Results before income taxes | 5,433 | 1,420 | 3,043 | 3,152 | 7,984 | 176 | 21,208 | 4,684 | 486 | |||||||||||||||||||||||
| Income tax (expense) benefit | (1,195) | (389) | (832) | (1,576) | (2,776) | (196) | (6,964) | (1,408) | 24 | |||||||||||||||||||||||
| Results of Producing Operations | $ | 4,238 | $ | 1,031 | $ | 2,211 | $ | 1,576 | $ | 5,208 | $ | (20) | $ | 14,244 | $ | 3,276 | $ | 510 |
1 The value of owned production consumed in operations as fuel has been eliminated from revenues and production expenses, and the related volumes have been deducted from net production in calculating the unit average sales price and production cost. This has no effect on the results of producing operations.
2 Represents accretion of ARO liability. Refer to Note 25 Asset Retirement Obligations.
3 Includes foreign currency gains and losses, gains and losses on property dispositions and other miscellaneous income and expenses. 2023 also includes a loss related to decommissioning obligations from certain previously divested oil and gas production assets in the Gulf of America.
| Supplemental Information on Oil and Gas Producing Activities - Unaudited | Financial Table of Contents |
Table III - Results of Operations for Oil and Gas Producing Activities1, continued
| Consolidated Companies | Affiliated Companies | |||||||||||||||||||||||||||||||
| Other | ||||||||||||||||||||||||||||||||
| Millions of dollars | U.S. | Americas | Africa | Asia | Australia | Europe | Total | TCO | Other | |||||||||||||||||||||||
| Year Ended December 31, 2022 | ||||||||||||||||||||||||||||||||
| Revenues from net production | ||||||||||||||||||||||||||||||||
| Sales | $ | 9,656 | $ | 1,172 | $ | 2,192 | $ | 3,963 | $ | 7,302 | $ | 564 | $ | 24,849 | $ | 8,304 | $ | 2,080 | ||||||||||||||
| Transfers | 18,494 | 3,801 | 6,829 | 2,477 | 7,535 | — | 39,136 | — | — | |||||||||||||||||||||||
| Total | 28,150 | 4,973 | 9,021 | 6,440 | 14,837 | 564 | 63,985 | 8,304 | 2,080 | |||||||||||||||||||||||
| Production expenses excluding taxes | (4,752) | (1,071) | (1,515) | (1,316) | (614) | (60) | (9,328) | (485) | (47) | |||||||||||||||||||||||
| Taxes other than on income | (1,286) | (85) | (170) | (52) | (352) | (4) | (1,949) | (933) | — | |||||||||||||||||||||||
| Proved producing properties: | ||||||||||||||||||||||||||||||||
| Depreciation and depletion | (4,612) | (1,223) | (1,943) | (1,765) | (2,520) | (117) | (12,180) | (964) | (164) | |||||||||||||||||||||||
| Accretion expense2 | (167) | (22) | (147) | (87) | (77) | (11) | (511) | (6) | (3) | |||||||||||||||||||||||
| Exploration expenses | (402) | (169) | (243) | (92) | (52) | (2) | (960) | — | — | |||||||||||||||||||||||
| Unproved properties valuation | (38) | (250) | (15) | (124) | — | — | (427) | — | — | |||||||||||||||||||||||
| Other income (loss)3 | 92 | 21 | 300 | 180 | 51 | 105 | 749 | 195 | (27) | |||||||||||||||||||||||
| Results before income taxes | 16,985 | 2,174 | 5,288 | 3,184 | 11,273 | 475 | 39,379 | 6,111 | 1,839 | |||||||||||||||||||||||
| Income tax (expense) benefit | (3,736) | (670) | (3,114) | (1,742) | (3,185) | (193) | (12,640) | (1,835) | 12 | |||||||||||||||||||||||
| Results of Producing Operations | $ | 13,249 | $ | 1,504 | $ | 2,174 | $ | 1,442 | $ | 8,088 | $ | 282 | $ | 26,739 | $ | 4,276 | $ | 1,851 |
1 The value of owned production consumed in operations as fuel has been eliminated from revenues and production expenses, and the related volumes have been deducted from net production in calculating the unit average sales price and production cost. This has no effect on the results of producing operations.
2 Represents accretion of ARO liability. Refer to Note 25 Asset Retirement Obligations.
3 Includes foreign currency gains and losses, gains and losses on property dispositions and other miscellaneous income and expenses.
Table IV - Results of Operations for Oil and Gas Producing Activities - Unit Prices and Costs****1
| Consolidated Companies | Affiliated Companies | |||||||||||||||||||||||||||||||
| Other | ||||||||||||||||||||||||||||||||
| U.S. | Americas | Africa | Asia | Australia | Europe | Total | TCO | Other | ||||||||||||||||||||||||
| Year Ended December 31, 2024 | ||||||||||||||||||||||||||||||||
| Average sales prices | ||||||||||||||||||||||||||||||||
| Crude, per barrel | $ | 73.47 | $ | 70.06 | $ | 75.69 | $ | 71.22 | $ | 74.20 | $ | 77.47 | $ | 73.27 | $ | 67.02 | $ | — | ||||||||||||||
| Natural gas liquids, per barrel | 19.88 | 26.53 | 32.13 | — | 59.48 | — | 20.51 | 12.09 | 47.61 | |||||||||||||||||||||||
| Natural gas, per thousand cubic feet | 1.03 | 1.03 | 4.14 | 4.21 | 10.24 | 9.10 | 4.99 | 1.57 | 7.75 | |||||||||||||||||||||||
| Average production costs, per barrel2 | 9.41 | 14.28 | 18.07 | 6.80 | 3.37 | 16.43 | 9.23 | 5.44 | 2.89 | |||||||||||||||||||||||
| Year Ended December 31, 2023 | ||||||||||||||||||||||||||||||||
| Average sales prices | ||||||||||||||||||||||||||||||||
| Crude, per barrel | $ | 74.36 | $ | 72.85 | $ | 72.86 | $ | 70.05 | $ | 78.93 | $ | 83.00 | $ | 73.76 | $ | 66.44 | $ | — | ||||||||||||||
| Natural gas liquids, per barrel | 20.01 | 29.00 | 27.80 | — | 51.00 | — | 20.79 | 9.43 | 45.33 | |||||||||||||||||||||||
| Natural gas, per thousand cubic feet | 1.65 | 2.63 | 3.95 | 4.10 | 11.43 | 12.00 | 6.01 | 1.31 | 10.34 | |||||||||||||||||||||||
| Average production costs, per barrel2 | 11.19 | 16.13 | 16.35 | 7.82 | 3.41 | 12.80 | 10.23 | 4.47 | 2.94 | |||||||||||||||||||||||
| Year Ended December 31, 2022 | ||||||||||||||||||||||||||||||||
| Average sales prices | ||||||||||||||||||||||||||||||||
| Crude, per barrel | $ | 91.88 | $ | 90.04 | $ | 100.82 | $ | 85.64 | $ | 98.00 | $ | 102.00 | $ | 92.92 | $ | 85.71 | $ | — | ||||||||||||||
| Natural gas liquids, per barrel | 33.76 | 34.33 | 35.43 | — | — | — | 34.31 | 20.83 | 65.33 | |||||||||||||||||||||||
| Natural gas, per thousand cubic feet | 5.53 | 5.15 | 9.00 | 4.02 | 15.34 | 27.00 | 8.85 | 0.95 | 29.44 | |||||||||||||||||||||||
| Average production costs, per barrel2 | 11.10 | 17.00 | 14.43 | 8.49 | 3.79 | 12.00 | 10.16 | 3.85 | 3.36 |
1 The value of owned production consumed in operations as fuel has been eliminated from revenues and production expenses, and the related volumes have been deducted from net production in calculating the unit average sales price and production cost. This has no effect on the results of producing operations.
2 Natural gas converted to oil-equivalent gas (OEG) barrels at a rate of 6 MCF = 1 OEG barrel.
| Supplemental Information on Oil and Gas Producing Activities - Unaudited | Financial Table of Contents |
Table V Proved Reserve Quantity Information*****
Summary of Net Oil and Gas Reserves
| 2024 | 2023 | 2022 | ||||||||||||||||||||||||||||||||||||||||||
| Liquids in Millions of Barrels | ||||||||||||||||||||||||||||||||||||||||||||
| Natural Gas in Billions of Cubic Feet | Crude Oil Condensate | SyntheticOil | NGL | Natural Gas | Crude Oil Condensate | SyntheticOil | NGL | Natural Gas | Crude Oil Condensate | SyntheticOil | NGL | Natural Gas | ||||||||||||||||||||||||||||||||
| Proved Developed | ||||||||||||||||||||||||||||||||||||||||||||
| Consolidated Companies | ||||||||||||||||||||||||||||||||||||||||||||
| U.S. | 1,207 | — | 615 | 4,420 | 1,221 | — | 611 | 4,543 | 1,198 | — | 450 | 3,288 | ||||||||||||||||||||||||||||||||
| Other Americas | 181 | — | — | 168 | 195 | 598 | 7 | 298 | 174 | 574 | 7 | 305 | ||||||||||||||||||||||||||||||||
| Africa | 392 | — | 67 | 1,491 | 367 | — | 70 | 1,632 | 392 | — | 72 | 1,734 | ||||||||||||||||||||||||||||||||
| Asia | 246 | — | — | 6,560 | 240 | — | — | 6,974 | 235 | — | — | 6,578 | ||||||||||||||||||||||||||||||||
| Australia | 72 | — | 1 | 6,517 | 85 | — | 2 | 6,951 | 99 | — | 3 | 7,898 | ||||||||||||||||||||||||||||||||
| Europe | 23 | — | — | 10 | 25 | — | — | 9 | 26 | — | — | 9 | ||||||||||||||||||||||||||||||||
| Total Consolidated | 2,121 | — | 683 | 19,166 | 2,133 | 598 | 690 | 20,407 | 2,124 | 574 | 532 | 19,812 | ||||||||||||||||||||||||||||||||
| Affiliated Companies | ||||||||||||||||||||||||||||||||||||||||||||
| TCO | 663 | — | 70 | 1,118 | 478 | — | 67 | 1,062 | 515 | — | 52 | 895 | ||||||||||||||||||||||||||||||||
| Other | 2 | — | 12 | 670 | 3 | — | 13 | 323 | 3 | — | 13 | 349 | ||||||||||||||||||||||||||||||||
| Total Consolidated and Affiliated Companies | 2,786 | — | 765 | 20,954 | 2,614 | 598 | 770 | 21,792 | 2,642 | 574 | 597 | 21,056 | ||||||||||||||||||||||||||||||||
| Proved Undeveloped | ||||||||||||||||||||||||||||||||||||||||||||
| Consolidated Companies | ||||||||||||||||||||||||||||||||||||||||||||
| U.S. | 639 | — | 373 | 2,730 | 721 | — | 413 | 3,139 | 875 | — | 435 | 3,543 | ||||||||||||||||||||||||||||||||
| Other Americas | 106 | — | — | 146 | 129 | — | 8 | 276 | 121 | — | 10 | 240 | ||||||||||||||||||||||||||||||||
| Africa | 63 | — | 19 | 703 | 78 | — | 27 | 625 | 62 | — | 25 | 756 | ||||||||||||||||||||||||||||||||
| Asia | 52 | — | — | 1,351 | 61 | — | — | 1,419 | 58 | — | — | 1,959 | ||||||||||||||||||||||||||||||||
| Australia | 20 | — | — | 2,422 | 22 | — | — | 2,444 | 22 | — | — | 2,444 | ||||||||||||||||||||||||||||||||
| Europe | 26 | — | — | 8 | 28 | — | — | 8 | 32 | — | — | 11 | ||||||||||||||||||||||||||||||||
| Total Consolidated | 906 | — | 392 | 7,360 | 1,039 | — | 448 | 7,911 | 1,170 | — | 470 | 8,953 | ||||||||||||||||||||||||||||||||
| Affiliated Companies | ||||||||||||||||||||||||||||||||||||||||||||
| TCO | 224 | — | 2 | 20 | 526 | — | 11 | 233 | 611 | — | 21 | 368 | ||||||||||||||||||||||||||||||||
| Other | — | — | — | 41 | — | — | — | 445 | — | — | — | 487 | ||||||||||||||||||||||||||||||||
| Total Consolidated and Affiliated Companies | 1,130 | — | 394 | 7,421 | 1,565 | — | 459 | 8,589 | 1,781 | — | 491 | 9,808 | ||||||||||||||||||||||||||||||||
| Total Proved Reserves | 3,916 | — | 1,159 | 28,375 | 4,179 | 598 | 1,229 | 30,381 | 4,423 | 574 | 1,088 | 30,864 |
- Reserve quantities include natural gas projected to be consumed in operations of 2,462, 2,655 and 2,737 billions of cubic feet and equivalent synthetic oil projected to be consumed in operations of 0, 27, and 28 millions of barrels as of December 31, 2024, 2023 and 2022, respectively.
Reserves Governance The company has adopted a comprehensive reserves and resources classification system modeled after a system developed and approved by a number of organizations, including the Society of Petroleum Engineers, the World Petroleum Congress and the American Association of Petroleum Geologists. The company classifies discovered recoverable hydrocarbons into six categories based on their status at the time of reporting – three deemed commercial and three potentially recoverable. Within the commercial classification are proved reserves and two categories of unproved reserves: probable and possible. The potentially recoverable categories are also referred to as contingent resources. For reserves estimates to be classified as proved, they must meet all SEC and company standards.
Proved oil and gas reserves are the estimated quantities that geoscience and engineering data demonstrate with reasonable certainty to be economically producible in the future from known reservoirs under existing economic conditions, operating methods and government regulations. Net proved reserves exclude royalties and interests owned by others and reflect contractual arrangements and royalty obligations in effect at the time of the estimate.
Proved reserves are classified as either developed or undeveloped. Proved developed reserves are the quantities expected to be recovered through existing wells with existing equipment and operating methods, or in which the cost of the required equipment is relatively minor compared to the cost of a new well. Proved undeveloped reserves are the quantities expected to be recovered from new wells on undrilled acreage or from existing wells where a relatively major expenditure is required for recompletion.
| Supplemental Information on Oil and Gas Producing Activities - Unaudited | Financial Table of Contents |
Due to the inherent uncertainties and the limited nature of reservoir data, estimates of reserves are subject to change as additional information becomes available.
Proved reserves are estimated by company asset teams composed of earth scientists and engineers. As part of the internal control process related to reserves estimation, the company maintains a Reserves Advisory Committee (RAC) that is chaired by the Manager of Global Reserves, an organization that is separate from the business units that estimate reserves. The Manager of Global Reserves has more than 35 years of experience working in the oil and gas industry and holds both undergraduate and graduate degrees in geoscience. His experience includes various technical and management roles in providing reserve and resource estimates in support of major capital and exploration projects, and more than 10 years of overseeing oil and gas reserves processes. He has been named a Distinguished Lecturer by the American Association of Petroleum Geologists and is an active member of the American Association of Petroleum Geologists, the SEPM Society of Sedimentary Geologists and the Society of Petroleum Engineers.
All RAC members are degreed professionals, each with more than 10 years of experience in various aspects of reserves estimation relating to reservoir engineering, petroleum engineering, earth science or finance. The members are knowledgeable in SEC guidelines for proved reserves classification and receive annual training on the preparation of reserves estimates.
The RAC has the following primary responsibilities: establish the policies and processes used within the business units to estimate reserves; provide independent reviews and oversight of the business units’ recommended reserves estimates and changes; confirm that proved reserves are recognized in accordance with SEC guidelines; determine that reserve quantities are calculated using consistent and appropriate standards, procedures and technology; and maintain the Chevron Corporation Reserves Manual*,* which provides standardized procedures used corporatewide for classifying and reporting hydrocarbon reserves.
During the year, the RAC is represented in meetings with each of the company’s business units to review and discuss reserve changes recommended by the various asset teams. Major changes are also reviewed with the company’s senior leadership team including the Chief Executive Officer and the Chief Financial Officer. The company’s annual reserves activity is also reviewed with the company’s Audit Committee and Board of Directors. If major changes to reserves were to occur between the annual reviews, those matters would also be discussed with the Board.
RAC sub-teams also conduct in-depth reviews during the year of many of the fields that have large proved reserves quantities. These reviews include an examination of the proved reserve records and documentation of their compliance with the Chevron Corporation Reserves Manual.
Technologies Used in Establishing Proved Reserves Additions In 2024, additions to Chevron’s proved reserves were based on a wide range of geologic and engineering technologies. Information generated from wells, such as well logs, wire line sampling, production and pressure testing, fluid analysis, and core analysis, was integrated with seismic data, regional geologic studies, and information from analogous reservoirs to provide “reasonably certain” proved reserves estimates. Both proprietary and commercially available analytic tools, including reservoir simulation, geologic modeling and seismic processing, have been used in the interpretation of the subsurface data. These technologies have been utilized extensively by the company in the past, and the company believes that they provide a high degree of confidence in establishing reliable and consistent reserves estimates.
Proved Undeveloped Reserves
Noteworthy changes in proved undeveloped reserves are shown in the table below and discussed below.
| Proved Undeveloped Reserves (Millions of BOE) | 2024 | ||||
| Quantity at January 1 | 3,456 | ||||
| Revisions | (154) | ||||
| Improved recovery | 3 | ||||
| Extension and discoveries | 390 | ||||
| Purchases | 70 | ||||
| Sales | (54) | ||||
| Transfers to proved developed | (950) | ||||
| Quantity at December 31 | 2,761 |
| Supplemental Information on Oil and Gas Producing Activities - Unaudited | Financial Table of Contents |
In 2024, revisions in the United States were primarily from the Denver-Julesburg (DJ) basin yielding a decrease of 98 million BOE mainly due to reservoir performance and portfolio optimization. A net decrease of 33 million BOE in the Midland and Delaware basins was due to reservoir performance.
In 2024, extensions and discoveries of 316 million BOE in the United States were primarily due to planned development of new locations in shale and tight assets in the DJ basin of 171 million BOE, the Midland and Delaware basins of 123 million BOE, and deepwater assets in the Gulf of America of 22 million BOE. In Other Americas, 58 million BOE of extensions and discoveries were from shale and tight assets in Argentina.
In 2024, purchases of 70 million BOE in the United States are primarily from newly identified proved undeveloped well locations associated with the acquisition of PDC.
The difference in 2024 extensions and discoveries of 161 million BOE, between the net quantities of proved reserves of 551 million BOE as reflected on pages 112 to 114 and net quantities of proved undeveloped reserves of 390 million BOE, is primarily due to proved extensions and discoveries that were not recognized as proved undeveloped reserves in the prior year and were recognized directly as proved developed reserves in 2024.
Transfers to proved developed reserves in 2024 include 464 million BOE in the United States, from 256 million BOE in the Midland and Delaware basins, 126 million BOE in the DJ basin, and 82 million BOE in the Gulf of America. Other significant transfers to proved developed were 329 million BOE in Kazakhstan, primarily at TCO, and 75 million BOE in Angola, primarily at Angola LNG. A combined 81 million BOE of transfers to proved developed were recorded in Argentina, Canada, Australia, Nigeria, China, and other international locations. These transfers are the consequence of development expenditures on completing wells and facilities.
During 2024, the company’s investments totaled approximately $8.2 billion in oil and gas producing activities, and about $0.1 billion in non-oil and gas producing activities, to advance the development of proved undeveloped reserves. The United States accounted for about $5.5 billion primarily related to various development activities in the Midland and Delaware basins, the Gulf of America and the DJ basin. In Africa, about $0.8 billion was expended on various offshore development and natural gas projects in Nigeria and Angola. An additional $0.5 billion was spent on development activities in Australia. Development activities in other international locations were primarily responsible for about $1.4 billion of expenditures. The company’s equity affiliates investments in oil and gas producing activities to advance development of proved undeveloped reserves in 2024 was $1.3 billion primarily related to development projects for TCO in Kazakhstan.
Reserves that remain proved undeveloped for five or more years are a result of several factors that affect optimal project development and execution. These factors may include the complex nature of the development project in adverse and remote locations, physical limitations of infrastructure or plant capacities that dictate project timing, compression projects that are pending reservoir pressure declines, and contractual limitations that dictate production levels.
At year-end 2024, the company held approximately 624 million BOE of proved undeveloped reserves that have remained undeveloped for five years or more. The majority of these reserves are in locations where the company has a proven track record of developing major projects. In Australia, approximately 223 million BOE remain undeveloped for five years or more related to the Gorgon and Wheatstone Projects. Further field development to convert the remaining proved undeveloped reserves is scheduled to occur in line with operating constraints, reservoir depletion and infrastructure optimization. In Africa, approximately 138 million BOE have remained undeveloped for five years or more, due to facility constraints at various fields and infrastructure associated with the Escravos gas projects in Nigeria. Affiliates account for about 237 million BOE of proved undeveloped reserves with about 197 million BOE that have remained undeveloped for five years or more related to TCO. At TCO, further field development to convert the remaining proved undeveloped reserves is scheduled to occur in line with reservoir depletion and facility constraints.
Annually, the company assesses whether any changes have occurred in facts or circumstances, such as changes to development plans, regulations, or government policies, that would warrant a revision to reserve estimates. In 2024, lower natural gas prices in North America were primarily responsible for the negative impact to the economic limits of oil and gas properties, resulting in a proved reserve decrease of approximately 58 million BOE. The year-end reserves quantities have been updated for these circumstances and significant changes are discussed in the appropriate reserves sections herein. Over the past three years, the ratio of proved undeveloped reserves to total proved reserves has ranged between 28 percent and 35 percent.
| Supplemental Information on Oil and Gas Producing Activities - Unaudited | Financial Table of Contents |
Proved Reserve Quantities For the three-year period ended December 31, 2024, the pattern of net reserve changes shown in the following tables is not necessarily indicative of future trends. Apart from acquisitions, the company’s ability to add proved reserves can be affected by events and circumstances that are outside the company’s control, such as delays in government permitting, partner approvals of development plans, changes in oil and gas prices, OPEC constraints, geopolitical uncertainties, civil unrest, events of war or military conflicts.
At December 31, 2024, proved reserves for the company were 9.8 billion BOE. The company’s estimated net proved reserves of liquids, including crude oil, condensate and synthetic oil for the years 2022, 2023 and 2024, are shown in the table on page 112. The company’s estimated net proved reserves of natural gas liquids (NGLs) are shown on page 113, and the company’s estimated net proved reserves of natural gas are shown on page 114.
Noteworthy changes in crude oil, condensate and synthetic oil proved reserves for 2022 through 2024 are discussed below and shown in the table on the following page:
Revisions In 2022, entitlement effects primarily contributed to a decrease of 49 million barrels of synthetic oil at the Athabasca Oil Sands project in Canada. In TCO, entitlement effects and changes in operating assumptions were primarily responsible for the 35 million barrels decrease in Kazakhstan.
In 2023, the 257 million barrels decrease in United States was primarily in the Midland and Delaware basins and California. Reservoir performance led to the decrease of 101 million barrels, and portfolio optimization led to a decrease of 59 million barrels in the Midland and Delaware basins. A reduction in planned development activities led to a decrease of 58 million barrels in California. In Other Americas, entitlement effects primarily contributed to an increase of 42 million barrels of synthetic oil at the Athabasca Oil Sands project in Canada. In Asia, reservoir performance, mainly in the Partitioned Zone between Saudi Arabia and Kuwait (the Partitioned Zone), was responsible for the 48 million barrels increase. Reservoir performance in Nigeria was mainly responsible for the 37 million barrels increase in Africa.
In 2024, the 37 million barrels increase in Asia was due to reservoir performance, primarily in the Partitioned Zone.
Extensions and Discoveries In 2022, extensions and discoveries in the Midland, Delaware and DJ basins, and approval of the Ballymore Project in the Gulf of America, were primarily responsible for the 264 million barrels increase in the United States. In Other Americas, the 32 million barrels of extensions and discoveries were from Argentina and Canada.
In 2023, extensions and discoveries of 124 million barrels in the Midland and Delaware basins were primarily responsible for the 170 million barrels increase in the United States. In Other Americas, the 55 million barrels of extensions and discoveries increase was mainly from shale and tight assets in Argentina.
In 2024, extensions and discoveries of 119 million barrels in the Midland and Delaware basins, and 45 million barrels in the DJ basin, were primarily responsible for the 185 million barrels increase in the United States. In Other Americas, the 52 million barrels of extensions and discoveries increase was mainly from shale and tight assets in Argentina.
Purchases In 2022, the company exercised its option to acquire additional land acreage in the Athabasca Oil Sands project in Canada contributing 168 million barrels in synthetic oil. The extension of deepwater licenses in Nigeria and the Republic of Congo contributed 36 million barrels in Africa.
In 2023, the acquisition of PDC in the DJ and Delaware basins was primarily responsible for the 207 million barrels increase in the United States.
In 2024, the renewal of the Agbami field deepwater license in Nigeria increased reserves by 51 million barrels.
Sales In 2024, sales of 593 million barrels in synthetic oil were from the Athabasca oil sand assets in Canada and the 46 million barrels in Other Americas were from the divestment of shale and tight assets in Canada.
| Supplemental Information on Oil and Gas Producing Activities - Unaudited | Financial Table of Contents |
Net Proved Reserves of Crude Oil, Condensate and Synthetic Oil
| Consolidated Companies | Affiliated Companies | Total Consolidated | ||||||||||||||||||||||||||||||||||||||||||
| Other | Synthetic | Synthetic | and Affiliated | |||||||||||||||||||||||||||||||||||||||||
| Millions of barrels | U.S. | Americas1 | Africa | Asia | Australia | Europe | Oil 2,5 | Total | TCO | Oil | Other3 | Companies | ||||||||||||||||||||||||||||||||
| Reserves at January 1, 2022 | 2,064 | 288 | 480 | 322 | 134 | 62 | 471 | 3,821 | 1,250 | — | 4 | 5,075 | ||||||||||||||||||||||||||||||||
| Changes attributable to: | ||||||||||||||||||||||||||||||||||||||||||||
| Revisions | (26) | (9) | 4 | 8 | 2 | 1 | (49) | (69) | (35) | — | — | (104) | ||||||||||||||||||||||||||||||||
| Improved recovery | 2 | 15 | 4 | 5 | — | — | — | 26 | — | — | — | 26 | ||||||||||||||||||||||||||||||||
| Extensions and discoveries | 264 | 32 | 6 | — | — | — | — | 302 | 10 | — | — | 312 | ||||||||||||||||||||||||||||||||
| Purchases | 22 | 5 | 36 | — | — | — | 168 | 231 | — | — | — | 231 | ||||||||||||||||||||||||||||||||
| Sales | (16) | — | (3) | — | — | — | — | (19) | — | — | — | (19) | ||||||||||||||||||||||||||||||||
| Production | (237) | (36) | (73) | (42) | (15) | (5) | (16) | (424) | (99) | — | (1) | (524) | ||||||||||||||||||||||||||||||||
| Reserves at December 31, 2022 4, 5 | 2,073 | 295 | 454 | 293 | 121 | 58 | 574 | 3,868 | 1,126 | — | 3 | 4,997 | ||||||||||||||||||||||||||||||||
| Changes attributable to: | ||||||||||||||||||||||||||||||||||||||||||||
| Revisions | (257) | 9 | 37 | 48 | 1 | (1) | 42 | (121) | (20) | — | 1 | (140) | ||||||||||||||||||||||||||||||||
| Improved recovery | 9 | — | 2 | — | — | — | — | 11 | — | — | — | 11 | ||||||||||||||||||||||||||||||||
| Extensions and discoveries | 170 | 55 | — | — | — | — | — | 225 | — | — | — | 225 | ||||||||||||||||||||||||||||||||
| Purchases | 207 | — | 24 | — | — | — | — | 231 | — | — | — | 231 | ||||||||||||||||||||||||||||||||
| Sales | (1) | — | — | — | — | — | — | (1) | — | — | — | (1) | ||||||||||||||||||||||||||||||||
| Production | (259) | (35) | (72) | (40) | (15) | (4) | (18) | (443) | (102) | — | (1) | (546) | ||||||||||||||||||||||||||||||||
| Reserves at December 31, 2023 4, 5 | 1,942 | 324 | 445 | 301 | 107 | 53 | 598 | 3,770 | 1,004 | — | 3 | 4,777 | ||||||||||||||||||||||||||||||||
| Changes attributable to: | ||||||||||||||||||||||||||||||||||||||||||||
| Revisions | 2 | (7) | 21 | 37 | — | — | (4) | 49 | (13) | — | — | 36 | ||||||||||||||||||||||||||||||||
| Improved recovery | 9 | 1 | 1 | — | — | — | — | 11 | — | — | — | 11 | ||||||||||||||||||||||||||||||||
| Extensions and discoveries | 185 | 52 | 4 | — | — | — | — | 241 | — | — | — | 241 | ||||||||||||||||||||||||||||||||
| Purchases | 21 | — | 51 | — | — | — | 16 | 88 | — | — | — | 88 | ||||||||||||||||||||||||||||||||
| Sales | (27) | (46) | — | — | — | — | (593) | (666) | — | — | — | (666) | ||||||||||||||||||||||||||||||||
| Production | (286) | (37) | (67) | (40) | (15) | (4) | (17) | (466) | (104) | — | (1) | (571) | ||||||||||||||||||||||||||||||||
| Reserves at December 31, 2024 4, 5 | 1,846 | 287 | 455 | 298 | 92 | 49 | — | 3,027 | 887 | — | 2 | 3,916 |
1 Ending reserve balances in North America were 132, 188 and 185 and in South America were 155, 136 and 110 in 2024, 2023 and 2022, respectively.
2 Reserves associated with Canada.
3 Reserves associated with Africa.
4 Included are year-end reserve quantities related to production-sharing contracts (PSC) (refer to page E-8 for the definition of a PSC). PSC-related reserve quantities are 8 percent, 6 percent and 6 percent for consolidated companies for 2024, 2023 and 2022, respectively.
5 Reserve quantities include synthetic oil projected to be consumed in operations of 0, 27, and 28 millions of barrels as of December 31, 2024, 2023 and 2022, respectively.
Noteworthy changes in NGLs proved reserves for 2022 through 2024 are discussed below and shown in the table on the following page:
Revisions In 2023, the 110 million barrels decrease in the United States was primarily in the Midland and Delaware basins with a decrease of 49 million barrels due to portfolio optimization and a decrease of 29 million barrels due to reservoir performance.
In 2024, the 41 million barrels decrease in the United States was primarily from a decrease of 65 million barrels in the DJ basin, which was partially offset by an increase of 31 million barrels from the Gulf of America.
Extensions and Discoveries In 2022, extensions and discoveries in the Midland and Delaware basins were primarily responsible for the 163 million barrels increase in the United States.
In 2023, extensions and discoveries in the Midland and Delaware basins were primarily responsible for the 92 million barrels increase in the United States.
In 2024, extensions and discoveries in the Midland and Delaware basins of 72 million barrels, and in the DJ basin of 52 million barrels, were responsible for the 124 million barrels increase in the United States.
Purchases In 2023, the acquisition of PDC in the DJ and Delaware basins was primarily responsible for the 262 million barrels increase in the United States.
Sales In 2022, sales of 35 million barrels in the United States were primarily from the divestment of the Eagle Ford shale assets and some properties in the Midland and Delaware basins.
| Supplemental Information on Oil and Gas Producing Activities - Unaudited | Financial Table of Contents |
Net Proved Reserves of Natural Gas Liquids
| Consolidated Companies | Affiliated Companies | Total Consolidated | ||||||||||||||||||||||||||||||||||||
| Other | and Affiliated | |||||||||||||||||||||||||||||||||||||
| Millions of barrels | U.S. | Americas1 | Africa | Asia | Australia | Europe | Total | TCO | Other2 | Companies | ||||||||||||||||||||||||||||
| Reserves at January 1, 2022 | 812 | 15 | 106 | — | 3 | — | 936 | 84 | 18 | 1,038 | ||||||||||||||||||||||||||||
| Changes attributable to: | ||||||||||||||||||||||||||||||||||||||
| Revisions | 18 | — | (3) | — | — | — | 15 | (5) | (3) | 7 | ||||||||||||||||||||||||||||
| Improved recovery | — | — | — | — | — | — | — | — | — | — | ||||||||||||||||||||||||||||
| Extensions and discoveries | 163 | 2 | 1 | — | — | — | 166 | — | — | 166 | ||||||||||||||||||||||||||||
| Purchases | 14 | 2 | — | — | — | — | 16 | — | — | 16 | ||||||||||||||||||||||||||||
| Sales | (35) | — | — | — | — | — | (35) | — | — | (35) | ||||||||||||||||||||||||||||
| Production | (87) | (2) | (7) | — | — | — | (96) | (6) | (2) | (104) | ||||||||||||||||||||||||||||
| Reserves at December 31, 2022****3 | 885 | 17 | 97 | — | 3 | — | 1,002 | 73 | 13 | 1,088 | ||||||||||||||||||||||||||||
| Changes attributable to: | ||||||||||||||||||||||||||||||||||||||
| Revisions | (110) | — | (6) | — | — | — | (116) | 12 | 2 | (102) | ||||||||||||||||||||||||||||
| Improved recovery | — | — | — | — | — | — | — | — | — | — | ||||||||||||||||||||||||||||
| Extensions and discoveries | 92 | — | — | — | — | — | 92 | — | — | 92 | ||||||||||||||||||||||||||||
| Purchases | 262 | — | 11 | — | — | — | 273 | — | — | 273 | ||||||||||||||||||||||||||||
| Sales | — | — | — | — | — | — | — | — | — | — | ||||||||||||||||||||||||||||
| Production | (105) | (2) | (5) | — | (1) | — | (113) | (7) | (2) | (122) | ||||||||||||||||||||||||||||
| Reserves at December 31, 2023****3 | 1,024 | 15 | 97 | — | 2 | — | 1,138 | 78 | 13 | 1,229 | ||||||||||||||||||||||||||||
| Changes attributable to: | ||||||||||||||||||||||||||||||||||||||
| Revisions | (41) | — | (7) | — | — | — | (48) | 1 | 1 | (46) | ||||||||||||||||||||||||||||
| Improved recovery | — | — | — | — | — | — | — | — | — | — | ||||||||||||||||||||||||||||
| Extensions and discoveries | 124 | — | — | — | — | — | 124 | — | — | 124 | ||||||||||||||||||||||||||||
| Purchases | 20 | — | — | — | — | — | 20 | — | — | 20 | ||||||||||||||||||||||||||||
| Sales | (3) | (13) | — | — | — | — | (16) | — | — | (16) | ||||||||||||||||||||||||||||
| Production | (136) | (2) | (4) | — | (1) | — | (143) | (7) | (2) | (152) | ||||||||||||||||||||||||||||
| Reserves at December 31, 2024****3 | 988 | — | 86 | — | 1 | — | 1,075 | 72 | 12 | 1,159 |
1 Reserves associated with North America.
2 Reserves associated with Africa.
3 Year-end reserve quantities related to PSC are not material for 2024, 2023 and 2022, respectively.
Noteworthy changes in natural gas proved reserves for 2022 through 2024 are discussed below and shown in the table on the following page:
Revisions In 2022, the performance of the Leviathan and Tamar fields in Israel and the Bibiyana and Jalalabad fields in Bangladesh were mainly responsible for the 1.8 TCF increase in Asia. In Australia, the 377 BCF decrease was mainly due to updated reservoir characterization of the Wheatstone field. In TCO, entitlement effects and changes in operating assumptions were primarily responsible for the 285 BCF decrease.
In 2023, portfolio optimization decrease of 276 BCF and a reservoir performance decrease of 186 BCF in the Midland and Delaware basins along with a reduction in planned development activities leading to a decrease of 485 BCF in the Haynesville shale formation of east Texas, were mainly responsible for the 1.2 TCF decrease in the United States. In Asia, final investment decision on a new gas pipeline project in Israel and reservoir performance in Bangladesh were mainly responsible for the 481 BCF increase.
In 2024, a decrease of 425 BCF in the DJ basin, primarily related to reservoir performance, was mainly responsible for the 572 BCF decrease in the United States. The 504 BCF increase in Australia was mainly due to reservoir performance of the Jansz Io field.
Extensions and Discoveries In 2022, extensions and discoveries of 1.6 TCF in the United States were primarily in the Midland and Delaware basins.
In 2023, extensions and discoveries of 660 BCF in the United States were primarily in the Midland and Delaware basins.
In 2024, extensions and discoveries of 912 BCF in the United States were primarily in the DJ basin with 476 BCF, and the Midland and Delaware basins with 432 BCF.
| Supplemental Information on Oil and Gas Producing Activities - Unaudited | Financial Table of Contents |
Purchases In 2023, the acquisition of PDC in the DJ basin was primarily responsible for the 2.2 TCF in the United States.
In 2024, the 177 BCF in the United States was primarily associated with the acquisition of PDC in the DJ basin.
Sales In 2022, sales of 243 BCF in the United States were primarily in the Eagle Ford shale and Midland and Delaware basins.
In 2024, sales of 260 BCF in Other Americas were from the divestment of shale and tight assets in Canada.
Net Proved Reserves of Natural Gas
| Consolidated Companies | Affiliated Companies | Total Consolidated | ||||||||||||||||||||||||||||||||||||
| Other | and Affiliated | |||||||||||||||||||||||||||||||||||||
| Billions of cubic feet (BCF) | U.S. | Americas1 | Africa | Asia | Australia | Europe | Total | TCO | Other2 | Companies | ||||||||||||||||||||||||||||
| Reserves at January 1, 2022 | 5,885 | 455 | 2,796 | 7,473 | 11,684 | 21 | 28,314 | 1,701 | 893 | 30,908 | ||||||||||||||||||||||||||||
| Changes attributable to: | ||||||||||||||||||||||||||||||||||||||
| Revisions | 171 | 62 | (118) | 1,765 | (377) | 2 | 1,505 | (285) | 3 | 1,223 | ||||||||||||||||||||||||||||
| Improved recovery | 1 | — | — | — | — | — | 1 | — | — | 1 | ||||||||||||||||||||||||||||
| Extensions and discoveries | 1,573 | 64 | — | — | — | — | 1,637 | — | 17 | 1,654 | ||||||||||||||||||||||||||||
| Purchases | 85 | 25 | 30 | — | — | — | 140 | — | — | 140 | ||||||||||||||||||||||||||||
| Sales | (243) | — | (11) | — | — | — | (254) | — | — | (254) | ||||||||||||||||||||||||||||
| Production3 | (641) | (61) | (207) | (701) | (965) | (3) | (2,578) | (153) | (77) | (2,808) | ||||||||||||||||||||||||||||
| Reserves at December 31, 2022 4, 5 | 6,831 | 545 | 2,490 | 8,537 | 10,342 | 20 | 28,765 | 1,263 | 836 | 30,864 | ||||||||||||||||||||||||||||
| Changes attributable to: | ||||||||||||||||||||||||||||||||||||||
| Revisions | (1,198) | (1) | (154) | 481 | 31 | 1 | (840) | 166 | 18 | (656) | ||||||||||||||||||||||||||||
| Improved recovery | 2 | — | — | — | — | — | 2 | — | — | 2 | ||||||||||||||||||||||||||||
| Extensions and discoveries | 660 | 83 | — | — | — | — | 743 | — | — | 743 | ||||||||||||||||||||||||||||
| Purchases | 2,161 | — | 97 | — | — | — | 2,258 | — | — | 2,258 | ||||||||||||||||||||||||||||
| Sales | (3) | — | — | — | — | — | (3) | — | — | (3) | ||||||||||||||||||||||||||||
| Production3 | (771) | (53) | (176) | (625) | (978) | (4) | (2,607) | (134) | (86) | (2,827) | ||||||||||||||||||||||||||||
| Reserves at December 31, 2023 4, 5 | 7,682 | 574 | 2,257 | 8,393 | 9,395 | 17 | 28,318 | 1,295 | 768 | 30,381 | ||||||||||||||||||||||||||||
| Changes attributable to: | ||||||||||||||||||||||||||||||||||||||
| Revisions | (572) | (54) | (19) | 118 | 504 | 3 | (20) | (21) | 30 | (11) | ||||||||||||||||||||||||||||
| Improved recovery | 2 | — | — | — | — | — | 2 | — | — | 2 | ||||||||||||||||||||||||||||
| Extensions and discoveries | 912 | 119 | 83 | — | — | — | 1,114 | — | — | 1,114 | ||||||||||||||||||||||||||||
| Purchases | 177 | — | 32 | — | — | — | 209 | — | — | 209 | ||||||||||||||||||||||||||||
| Sales | (70) | (260) | — | — | — | — | (330) | — | — | (330) | ||||||||||||||||||||||||||||
| Production3 | (981) | (65) | (159) | (600) | (960) | (2) | (2,767) | (136) | (87) | (2,990) | ||||||||||||||||||||||||||||
| Reserves at December 31, 2024 4, 5 | 7,150 | 314 | 2,194 | 7,911 | 8,939 | 18 | 26,526 | 1,138 | 711 | 28,375 |
1 Ending reserve balances in North America and South America were 49, 363 and 407 and 265, 211 and 138 in 2024, 2023 and 2022, respectively.
2 Reserves associated with Africa.
3 Total “as sold” volumes were 2,768, 2,609 and 2,600 for 2024, 2023 and 2022, respectively.
4 Includes reserve quantities related to PSC. PSC-related reserve quantities were 6 percent, 7 percent and 8 percent for consolidated companies for 2024, 2023 and 2022, respectively.
5 Reserve quantities include natural gas projected to be consumed in operations of 2,462, 2,655 and 2,737 billions of cubic feet as of December 31, 2024, 2023 and 2022, respectively.
| Supplemental Information on Oil and Gas Producing Activities - Unaudited | Financial Table of Contents |
Table VI - Standardized Measure of Discounted Future Net Cash Flows Related to Proved Oil and Gas Reserves
The standardized measure of discounted future net cash flows is calculated in accordance with SEC and FASB requirements. This includes using the unweighted arithmetic average of the first-day-of-the-month oil and gas prices for the 12-month period prior to the end of the reporting period, estimated future development and production costs assuming the continuation of existing economic conditions, estimated costs for asset retirement obligations (includes costs to retire existing wells and facilities in addition to those future wells and facilities necessary to produce proved undeveloped reserves), and estimated future income taxes based on appropriate statutory tax rates. Discounted future net cash flows are calculated using 10 percent mid-period discount factors. Estimates of proved reserve quantities are imprecise and change over time as new information becomes available. Probable and possible reserves, which may become proved in the future, are excluded from the calculations. The valuation requires assumptions as to the timing and amount of future development and production costs, which could change over time as new information becomes available. The calculations are made as of December 31 each year and do not represent management’s estimate of the company’s future cash flows or value of its oil and gas reserves. In the following table, the caption “Standardized Measure Net Cash Flows” refers to the standardized measure of discounted future net cash flows.
| Consolidated Companies | Affiliated Companies | Total Consolidated | ||||||||||||||||||||||||||||||||||||
| Other | and Affiliated | |||||||||||||||||||||||||||||||||||||
| Millions of dollars | U.S. | Americas | Africa | Asia | Australia | Europe | Total | TCO | Other | Companies | ||||||||||||||||||||||||||||
| At December 31, 2024 | ||||||||||||||||||||||||||||||||||||||
| Future cash inflows from production | $ | 163,846 | $ | 21,827 | $ | 43,539 | $ | 58,245 | $ | 84,026 | $ | 3,999 | $ | 375,482 | $ | 65,221 | $ | 5,308 | $ | 446,011 | ||||||||||||||||||
| Future production costs | (52,680) | (5,896) | (17,996) | (13,355) | (10,964) | (1,188) | (102,079) | (19,945) | (392) | (122,416) | ||||||||||||||||||||||||||||
| Future development costs | (15,377) | (2,131) | (3,554) | (2,290) | (6,333) | (420) | (30,105) | (1,560) | (30) | (31,695) | ||||||||||||||||||||||||||||
| Future income taxes | (18,919) | (4,443) | (12,345) | (25,354) | (25,891) | (1,004) | (87,956) | (13,115) | (1,710) | (102,781) | ||||||||||||||||||||||||||||
| Undiscounted future net cash flows | 76,870 | 9,357 | 9,644 | 17,246 | 40,838 | 1,387 | 155,342 | 30,601 | 3,176 | 189,119 | ||||||||||||||||||||||||||||
| 10 percent midyear annual discount for timing of estimated cash flows | (28,615) | (3,492) | (3,573) | (8,157) | (15,114) | (503) | (59,454) | (8,722) | (1,003) | (69,179) | ||||||||||||||||||||||||||||
| Standardized Measure Net Cash Flows | $ | 48,255 | $ | 5,865 | $ | 6,071 | $ | 9,089 | $ | 25,724 | $ | 884 | $ | 95,888 | $ | 21,879 | $ | 2,173 | $ | 119,940 | ||||||||||||||||||
| At December 31, 2023 | ||||||||||||||||||||||||||||||||||||||
| Future cash inflows from production | $ | 181,152 | $ | 65,265 | $ | 42,786 | $ | 62,094 | $ | 99,003 | $ | 4,395 | $ | 454,695 | $ | 74,758 | $ | 7,324 | $ | 536,777 | ||||||||||||||||||
| Future production costs | (48,784) | (22,549) | (16,502) | (13,000) | (11,534) | (1,194) | (113,563) | (21,467) | (484) | (135,514) | ||||||||||||||||||||||||||||
| Future development costs | (16,938) | (3,538) | (4,474) | (2,845) | (5,804) | (438) | (34,037) | (3,617) | (67) | (37,721) | ||||||||||||||||||||||||||||
| Future income taxes | (21,089) | (10,337) | (12,446) | (27,415) | (24,499) | (1,160) | (96,946) | (14,902) | (2,371) | (114,219) | ||||||||||||||||||||||||||||
| Undiscounted future net cash flows | 94,341 | 28,841 | 9,364 | 18,834 | 57,166 | 1,603 | 210,149 | 34,772 | 4,402 | 249,323 | ||||||||||||||||||||||||||||
| 10 percent midyear annual discount for timing of estimated cash flows | (39,553) | (16,623) | (3,262) | (9,343) | (22,011) | (600) | (91,392) | (11,283) | (1,640) | (104,315) | ||||||||||||||||||||||||||||
| Standardized Measure Net Cash Flows | $ | 54,788 | $ | 12,218 | $ | 6,102 | $ | 9,491 | $ | 35,155 | $ | 1,003 | $ | 118,757 | $ | 23,489 | $ | 2,762 | $ | 145,008 | ||||||||||||||||||
| At December 31, 2022 | ||||||||||||||||||||||||||||||||||||||
| Future cash inflows from production | $ | 257,478 | $ | 76,940 | $ | 55,865 | $ | 67,188 | $ | 147,839 | $ | 5,920 | $ | 611,230 | $ | 106,114 | $ | 22,630 | $ | 739,974 | ||||||||||||||||||
| Future production costs | (51,022) | (22,744) | (16,373) | (12,261) | (13,313) | (1,069) | (116,782) | (28,046) | (574) | (145,402) | ||||||||||||||||||||||||||||
| Future development costs | (20,907) | (3,233) | (2,657) | (2,879) | (5,030) | (502) | (35,208) | (4,127) | (8) | (39,343) | ||||||||||||||||||||||||||||
| Future income taxes | (40,096) | (13,207) | (26,160) | (30,674) | (38,861) | (2,827) | (151,825) | (22,182) | (7,707) | (181,714) | ||||||||||||||||||||||||||||
| Undiscounted future net cash flows | 145,453 | 37,756 | 10,675 | 21,374 | 90,635 | 1,522 | 307,415 | 51,759 | 14,341 | 373,515 | ||||||||||||||||||||||||||||
| 10 percent midyear annual discount for timing of estimated cash flows | (62,918) | (22,165) | (3,001) | (10,769) | (37,519) | (571) | (136,943) | (18,810) | (5,824) | (161,577) | ||||||||||||||||||||||||||||
| Standardized Measure Net Cash Flows | $ | 82,535 | $ | 15,591 | $ | 7,674 | $ | 10,605 | $ | 53,116 | $ | 951 | $ | 170,472 | $ | 32,949 | $ | 8,517 | $ | 211,938 |
| Supplemental Information on Oil and Gas Producing Activities - Unaudited | Financial Table of Contents |
Table VII - Changes in the Standardized Measure of Discounted Future Net Cash Flows From Proved Reserves
The changes in present values between years, which can be significant, reflect changes in estimated proved reserve quantities and prices and assumptions used in forecasting production volumes and costs. Changes in the timing of production are included with “Revisions of previous quantity estimates.”
| Total Consolidated and | ||||||||||||||||||||||||||
| Millions of dollars | Consolidated Companies | Affiliated Companies | Affiliated Companies | |||||||||||||||||||||||
| Present Value at January 1, 2022 | $ | 103,884 | $ | 24,991 | $ | 128,875 | ||||||||||||||||||||
| Sales and transfers of oil and gas produced net of production costs | (53,356) | (9,127) | (62,483) | |||||||||||||||||||||||
| Development costs incurred | 7,962 | 2,430 | 10,392 | |||||||||||||||||||||||
| Purchases of reserves | 2,248 | — | 2,248 | |||||||||||||||||||||||
| Sales of reserves | (1,807) | — | (1,807) | |||||||||||||||||||||||
| Extensions, discoveries and improved recovery less related costs | 16,054 | 823 | 16,877 | |||||||||||||||||||||||
| Revisions of previous quantity estimates | 5,281 | (1,481) | 3,800 | |||||||||||||||||||||||
| Net changes in prices, development and production costs | 110,467 | 28,052 | 138,519 | |||||||||||||||||||||||
| Accretion of discount | 14,075 | 3,429 | 17,504 | |||||||||||||||||||||||
| Net change in income tax | (34,336) | (7,651) | (41,987) | |||||||||||||||||||||||
| Net Change for 2022 | 66,588 | 16,475 | 83,063 | |||||||||||||||||||||||
| Present Value at December 31, 2022 | $ | 170,472 | $ | 41,466 | $ | 211,938 | ||||||||||||||||||||
| Sales and transfers of oil and gas produced net of production costs | (38,638) | (6,350) | (44,988) | |||||||||||||||||||||||
| Development costs incurred | 11,381 | 2,281 | 13,662 | |||||||||||||||||||||||
| Purchases of reserves | 9,628 | — | 9,628 | |||||||||||||||||||||||
| Sales of reserves | (51) | — | (51) | |||||||||||||||||||||||
| Extensions, discoveries and improved recovery less related costs | 7,262 | — | 7,262 | |||||||||||||||||||||||
| Revisions of previous quantity estimates | (14,389) | (493) | (14,882) | |||||||||||||||||||||||
| Net changes in prices, development and production costs | (80,284) | (23,517) | (103,801) | |||||||||||||||||||||||
| Accretion of discount | 23,306 | 5,722 | 29,028 | |||||||||||||||||||||||
| Net change in income tax | 30,070 | 7,142 | 37,212 | |||||||||||||||||||||||
| Net Change for 2023 | (51,715) | (15,215) | (66,930) | |||||||||||||||||||||||
| Present Value at December 31, 2023 | $ | 118,757 | $ | 26,251 | $ | 145,008 | ||||||||||||||||||||
| Sales and transfers of oil and gas produced net of production costs | (38,457) | (6,242) | (44,699) | |||||||||||||||||||||||
| Development costs incurred | 12,809 | 1,487 | 14,296 | |||||||||||||||||||||||
| Purchases of reserves | 1,607 | — | 1,607 | |||||||||||||||||||||||
| Sales of reserves | (8,904) | — | (8,904) | |||||||||||||||||||||||
| Extensions, discoveries and improved recovery less related costs | 7,328 | — | 7,328 | |||||||||||||||||||||||
| Revisions of previous quantity estimates | 2,897 | (154) | 2,743 | |||||||||||||||||||||||
| Net changes in prices, development and production costs | (17,755) | (1,898) | (19,653) | |||||||||||||||||||||||
| Accretion of discount | 15,867 | 3,601 | 19,468 | |||||||||||||||||||||||
| Net change in income tax | 1,739 | 1,007 | 2,746 | |||||||||||||||||||||||
| Net Change for 2024 | (22,869) | (2,199) | (25,068) | |||||||||||||||||||||||
| Present Value at December 31, 2024 | $ | 95,888 | $ | 24,052 | $ | 119,940 |
| Table of Contents |
PART IV
Previous: Item 13. Certain Relationships and Related Transactions, and Director Independence · Next: Item 15. Exhibit and Financial Statement Schedules