 filings.tools
Item 5. MARKET FOR REGISTRANT'S COMMON EQUITY, RELATED STOCKHOLDER MATTERS AND ISSUER PURCHASES OF EQUITY SECURITIES
3K characters. Original on sec.gov · Markdown
Item 5. MARKET FOR REGISTRANT'S COMMON EQUITY, RELATED STOCKHOLDER MATTERS AND ISSUER PURCHASES OF EQUITY SECURITIES
The Company's common stock is traded on the NYSE under the ticker symbol "DD." Fourth quarter dividend information can be found in Note 24 to the Consolidated Financial Statements.
At February 3, 2021, there were 75,797 stockholders of record.
See Part III, Item 11. Executive Compensation for information relating to the Company’s equity compensation plans.
Issuer Purchases of Equity Securities
On June 1, 2019, the Company announced a $2 billion share buyback program, which expires on June 1, 2021. For the three months ended December 31, 2020, there were no purchases of the Company’s common stock under this share repurchase program. At December 31, 2020, $1 billion is the approximate dollar value of shares that may yet be purchased by the Company under this program.
Stockholder Return
The form of the chart presented below is in accordance with the requirements of the U.S. Securities and Exchange Commission. Stockholders are cautioned against drawing any conclusions from the data contained therein, as past results are not necessarily indicative of future performance. The chart illustrates the cumulative total return of the Company's stock following completion of the DWDP Merger based on a presumed investment of $100 on September 1, 2017 and a presumption that all dividends were reinvested. The historical stock prices of DuPont presented in the chart have been adjusted to reflect the impact of the DWDP Distributions and the Reverse Stock Split. The Company elected to display the closing price on May 31, 2019, the day preceding the Corteva Distribution, in order to provide the reader a more useful baseline for the Company's performance as a specialty products company after consummation of the DWDP Distributions. The chart does not reflect the Company's forecast of future financial performance.
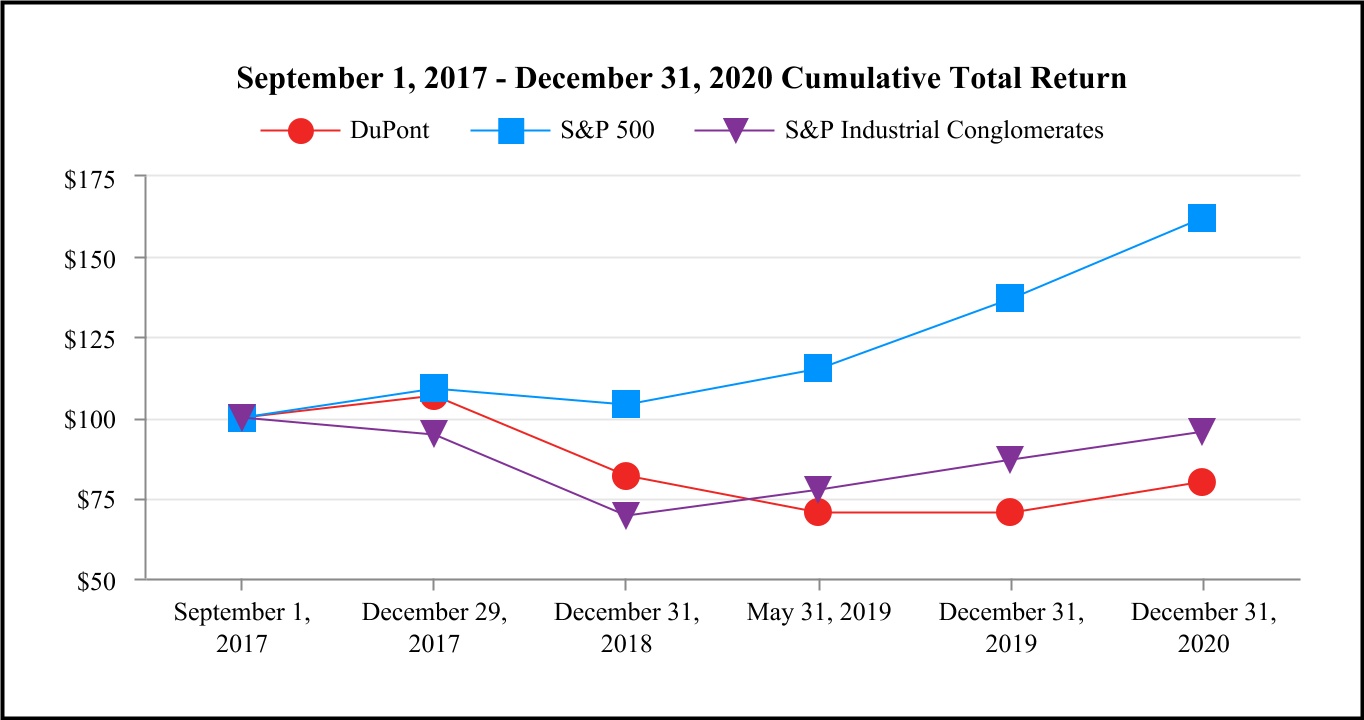
| Cumulative Total Return | September 1, 2017 | December 29, 2017 | December 31, 2018 | May 31, 2019 2 | December 31, 2019 | December 31, 2020 | ||||||||||||||
| DuPont 1 | $ | 100.00 | $ | 106.60 | $ | 81.92 | $ | 70.30 | $ | 70.48 | $ | 79.86 | ||||||||
| S&P 500 | $ | 100.00 | $ | 108.84 | $ | 104.07 | $ | 115.24 | $ | 136.84 | $ | 162.02 | ||||||||
| S&P Industrial Conglomerates | $ | 100.00 | $ | 94.76 | $ | 69.29 | $ | 77.63 | $ | 86.70 | $ | 95.60 |
-
The historical stock prices of DuPont prior to the DWDP Distributions have been adjusted to reflect the impact of the DWDP Distributions and the Reverse Stock Split.
-
Represents the day preceding the Corteva Distribution.
Previous: Item 4. MINE SAFETY DISCLOSURES · Next: Item 7. MANAGEMENT'S DISCUSSION AND ANALYSIS OF FINANCIAL CONDITION AND RESULTS OF OPERATIONS