 filings.tools
Datadog 10-K 2023-12-31
Filed 2024-02-23. 24 sections, 435K characters. Original on sec.gov · Markdown · JSON
Cover and table of contents
UNITED STATES
SECURITIES AND EXCHANGE COMMISSION
WASHINGTON, DC 20549
________________________________________
FORM 10-K
(Mark One)
| ☒ | ANNUAL REPORT PURSUANT TO SECTION 13 OR 15(d) OF THE SECURITIES EXCHANGE ACT OF 1934 |
For the fiscal year ended December 31, 2023
OR
| ☐ | TRANSITION REPORT PURSUANT TO SECTION 13 OR 15(d) OF THE SECURITIES EXCHANGE ACT OF 1934 |
For the transition period from ______ to ______
Commission File Number: 001-39051
Datadog, Inc.
(Exact Name of Registrant as Specified in its Charter)
| Delaware | 27-2825503 | ||||||||||
| (State or other jurisdiction of incorporation or organization) | (I.R.S. Employer Identification No.) | ||||||||||
| 620 8th Avenue, | 45th Floor | ||||||||||
| New York, | NY | 10018 | |||||||||
| (Address of principal executive offices) | (Zip Code) |
Registrant’s telephone number, including area code: (866) 329-4466
Securities registered pursuant to Section 12(b) of the Act:
| Title of each class | Trading Symbol(s) | Name of each exchange on which registered | ||||||
| Class A common stock, par value $0.00001 per share | DDOG | The Nasdaq Stock Market LLC | ||||||
| (Nasdaq Global Select Market) |
Indicate by check mark if the registrant is a well-known seasoned issuer, as defined in Rule 405 of the Securities Act. Yes ☒ No ☐
Indicate by check mark if the registrant is not required to file reports pursuant to Section 13 or 15(d) of the Act. Yes ☐ No ☒
Indicate by check mark whether the registrant (1) has filed all reports required to be filed by Section 13 or 15(d) of the Securities Exchange Act of 1934 during the preceding 12 months (or for such shorter period that the registrant was required to file such reports), and (2) has been subject to such filing requirements for the past 90 days. Yes ☒ No ☐
Indicate by check mark whether the registrant has submitted electronically every Interactive Data File required to be submitted pursuant to Rule 405 of Regulation S-T (§ 232.405 of this chapter) during the preceding 12 months (or for such shorter period that the registrant was required to submit such files). Yes ☒ No ☐
Indicate by check mark whether the registrant is a large accelerated filer, an accelerated filer, a non-accelerated filer, a smaller reporting company, or an emerging growth company. See the definitions of “large accelerated filer,” “accelerated filer,” “smaller reporting company,” and “emerging growth company” in Rule 12b-2 of the Exchange Act.
| Large accelerated filer | ☒ | Accelerated filer | ☐ | |||||||||||
| Non-accelerated filer | ☐ | Smaller reporting company | ☐ | |||||||||||
| Emerging growth company | ☐ |
If an emerging growth company, indicate by check mark if the registrant has elected not to use the extended transition period for complying with any new or revised financial accounting standards provided pursuant to Section 13(a) of the Exchange Act. ☐
Indicate by check mark whether the registrant has filed a report on and attestation to its management’s assessment of the effectiveness of its internal control over financial reporting under Section 404(b) of the Sarbanes-Oxley Act (15 U.S.C. 7262(b)) by the registered public accounting firm that prepared or issued its audit report. ☒
If securities are registered pursuant to Section 12(b) of the Act, indicate by check mark whether the financial statements of the registrant included in the filing reflect the correction of an error to previously issued financial statements. ☐
Indicate by check mark whether any of those error corrections are restatements that required a recovery analysis of incentive-based compensation received by any of the registrant’s executive officers during the relevant recovery period pursuant to §240.10D-1(b). ☐
Indicate by check mark whether the registrant is a shell company (as defined in Rule 12b-2 of the Exchange Act). Yes o No x
The aggregate market value of the voting and non-voting common equity held by non-affiliates of the registrant, based on the closing price of the registrant’s shares of Class A common stock as reported by The Nasdaq Global Select Market on June 30, 2023 was approximately $29.3 billion.
As of February 15, 2024, there were 305,929,910 shares of the registrant’s Class A common stock and 25,944,197 shares of the registrant’s Class B common stock, each with a par value of $0.00001 per share, outstanding.
DOCUMENTS INCORPORATED BY REFERENCE
Portions of the registrant’s Proxy Statement for its 2024 Annual Meeting of Stockholders are incorporated by reference into Part III of this Annual Report on Form 10-K to the extent stated herein. Such Proxy Statement will be filed with the Securities and Exchange Commission within 120 days of the registrant’s fiscal year ended December 31, 2023.
DATADOG, INC.
2023 ANNUAL REPORT ON FORM 10-K
TABLE OF CONTENTS
RISK FACTORS SUMMARY
Our operations and financial results and an investment in our Class A common stock are subject to various risks and uncertainties, the most significant of which are summarized below. You should consider carefully the summary below and the risks and uncertainties described in the “Risk Factors” section of this Annual Report on Form 10-K, as well as the other information contained in this Annual Report on Form 10-K, including our consolidated financial statements and related notes. The risks and uncertainties described below and in “Risk Factors” are not the only ones we face. Additional risks and uncertainties that we are unaware of, or that we currently believe are not material, may also become important factors that adversely affect our business. If any of such risks or others not specified below or in “Risk Factors” materialize, our business, financial condition and results of operations could be materially and adversely affected. In that case, the trading price of our Class A common stock could decline.
-
Unfavorable conditions in our industry or the global economy, or reductions in information technology spending, could limit our ability to grow our business and negatively affect our results of operations.
-
Our recent rapid growth may not be indicative of our future growth. Our rapid growth also makes it difficult to evaluate our future prospects and may increase the risk that we will not be successful.
-
We have a history of operating losses and may not achieve or sustain profitability in the future.
-
We have a limited operating history, which makes it difficult to forecast our future results of operations.
-
We may require additional capital to support the growth of our business, and this capital might not be available on acceptable terms, if at all.
-
Our business depends on our existing customers purchasing additional subscriptions and products from us and renewing their subscriptions. If our customers do not renew or expand their subscriptions with us, our future operating results would be harmed.
-
If we are unable to attract new customers, our business, financial condition and results of operations will be adversely affected.
-
Failure to effectively develop and expand our sales and marketing capabilities could harm our ability to increase our customer base and achieve broader market acceptance of our products.
-
If we or our third-party service providers experience, or are unable to protect against cyber-attacks, ransomware, security incidents, or security breaches, or if unauthorized parties otherwise obtain access to our customers’ data, our data, or our platform and information technology systems, then our solution may be perceived as not being secure, our reputation may be harmed, demand for our platform and products may be reduced, and we may incur significant liabilities or additional expenses.
-
Interruptions or performance problems associated with our products and platform capabilities may adversely affect our business, financial condition and results of operations.
-
We may not be able to successfully manage our growth, and if we are not able to grow efficiently, our business, financial condition and results of operations could be harmed.
-
If we fail to adapt and respond effectively to rapidly changing technology, evolving industry standards, changing regulations, or to changing customer needs, requirements or preferences, our platform and products may become less competitive.
-
The markets in which we participate are competitive, and if we do not compete effectively, our business, financial condition and results of operations could be harmed.
-
The dual class structure of our common stock has the effect of concentrating voting control with holders of our Class B common stock, including our executive officers, directors and their affiliates, which will limit the ability of holders of our Class A common stock to influence the outcome of important transactions.
SPECIAL NOTE REGARDING FORWARD-LOOKING STATEMENTS
This Annual Report on Form 10-K contains forward-looking statements about us and our industry that involve substantial risks and uncertainties. All statements other than statements of historical facts contained in this Annual Report on Form 10-K including statements regarding our future results of operations or financial condition, business strategy and plans and objectives of management for future operations, are forward-looking statements. In some cases, you can identify forward-looking statements because they contain words such as “anticipate,” “believe,” “contemplate,” “continue,” “could,” “estimate,” “expect,” “intend,” “may,” “plan,” “potential,” “predict,” “project,” “should,” “target,” “will” or “would” or the negative of these words or other similar terms or expressions. These forward-looking statements include, but are not limited to, statements concerning the following:
-
our expectations regarding our revenue, expenses and other operating results;
-
our ability to acquire new customers and successfully retain existing customers;
-
our ability to increase usage of our platform and upsell and cross sell additional products;
-
our ability to achieve or sustain our profitability;
-
future investments in our business, our anticipated capital expenditures and our estimates regarding our capital requirements;
-
the costs and success of our sales and marketing efforts, and our ability to promote our brand;
-
our reliance on key personnel and our ability to identify, recruit and retain skilled personnel;
-
our ability to effectively manage our growth, including any international expansion;
-
our ability to protect our intellectual property rights and any costs associated therewith;
-
our ability to compete effectively with existing competitors and new market entrants;
-
the growth rates of the markets in which we compete; and
-
the potential impact of general market, political, economic, and business conditions in our industry, or reductions in information technology spending, on our business, results of operations and financial condition.
You should not rely on forward-looking statements as predictions of future events. The outcome of the events described in these forward-looking statements is subject to risks, uncertainties and other factors described in under the header “Risk Factors” and elsewhere in this Annual Report on Form 10-K. Moreover, we operate in a very competitive and rapidly changing environment. New risks and uncertainties emerge from time to time, and it is not possible for us to predict all risks and uncertainties that could have an impact on the forward-looking statements contained herein. The results, events and circumstances reflected in the forward-looking statements may not be achieved or occur, and actual results, events or circumstances could differ materially from those described in the forward-looking statements.
The forward-looking statements made in this Annual Report on Form 10-K relate only to events as of the date on which the statements are made, and we undertake no obligation to update them to reflect events or circumstances after the date of this Annual Report on Form 10-K or to reflect new information or the occurrence of unanticipated events, except as required by law.
Unless the context otherwise indicates, references in this report to the terms “Datadog”, “the Company,” “we,” “our” and “us” refer to Datadog, Inc. and its subsidiaries.
“Datadog” and other trade names and trademarks of ours appearing in this report are our property. This report contains trade names and trademarks of other companies, which are the property of their respective owners. We do not intend our use or display of other companies’ trade names or trademarks to imply an endorsement or sponsorship of us by such companies, or any relationship with any of these companies.
We may announce material business and financial information to our investors using our investor relations website (www.investors.datadoghq.com). We therefore encourage investors and others interested in Datadog to review the information that we make available on our website, in addition to following our filings with the Securities and Exchange Commission, or the SEC, webcasts, press releases and conference calls.
MARKET, INDUSTRY AND OTHER DATA
The statistical data, estimates and forecasts referenced throughout this Annual Report on Form 10-K are based on independent industry publications or other publicly available information, as well as information based on our internal sources. While we believe the industry and market data included in this Annual Report on Form 10-K are reliable and are based on reasonable assumptions, these data involve many assumptions and limitations, and you are cautioned not to give undue weight to these estimates. We have not independently verified the accuracy or completeness of the data contained in these industry publications and other publicly available information. None of the industry publications referred to in this Annual Report on Form 10-K were prepared on our or on our affiliates’ behalf or at our expense. The industry in which we operate is subject to a high degree of uncertainty and risk due to a variety of factors, including those described in the section titled “Risk Factors” and “Special Note Regarding Forward-Looking Statements,” that could cause results to differ materially from those expressed in these publications and other publicly available information.
The Gartner content referenced herein (the “Gartner Content”) represents research opinion or viewpoints published, as part of a syndicated subscription service, by Gartner, Inc. (“Gartner”), and are not representations of fact. The Gartner Content speaks as of its original publication date in December 2023 (and not as of the date of this Annual Report on Form 10-K) and the opinions expressed in the Gartner Content are subject to change without notice.
PART I
Item 1. Business
Overview
Datadog is the observability and security platform for cloud applications.
Our SaaS platform integrates and automates infrastructure monitoring, application performance monitoring, log management, user experience monitoring, cloud security, and many other capabilities to provide unified, real-time observability and security for our customers’ entire technology stack. Datadog is used by organizations of all sizes and across a wide range of industries to enable digital transformation and cloud migration, drive collaboration among development, operations, security and business teams, accelerate time to market for applications, reduce time to problem resolution, secure applications and infrastructure, understand user behavior, and track key business metrics.
Software applications are transforming how organizations engage with customers and operate their businesses. Companies across all industries are re-platforming their businesses to cloud native or hybrid on-premise and cloud infrastructures to enable this digital transformation. Historically, engineering teams have been siloed, making the development of next generation applications in dynamic cloud environments challenging. We started Datadog to break this model and facilitate collaboration among development and operations teams, enabling the adoption of DevOps practices. Since then we have continuously pushed to unify separate tools into an integrated monitoring and analytics platform, readily available to everyone who cares about applications and their impact on business. And while we continue to broaden our capabilities in observability, we have continued to expand our platform into use cases beyond observability. Starting in 2020, we began to develop products in cloud security, and in 2021, we expanded into developer-focused products.
From our founding goal of breaking down silos between Dev and Ops, we set out in 2010 to build a real-time data integration platform to turn chaos of having uncorrelated data from disparate sources into digestible and actionable insights. Since launching our first use case with Infrastructure Monitoring in 2012, we have expanded our platform rapidly, and today, we offer end-to-end monitoring and analytics, powered by a common data model that is extensible for use cases across observability, security, and software delivery. In 2023, we launched Application Vulnerability Management to detect vulnerabilities in open-source libraries in production, Data Streams Monitoring to track and improve the performance of event-driven applications, and Workflow Automation to easily automate actions based on observability insights.
Our proprietary platform combines the power of metrics, traces, logs, user sessions, security signals, and other data from a single agent and over 700 integrations to provide a unified view of infrastructure, application performance and the real-time events impacting performance. Datadog is designed to be cloud agnostic and easy to deploy, with hundreds of out-of-the-box integrations, a built-in understanding of modern technology stacks and extensive customizations. Customers can deploy our platform across their entire infrastructure, making it ubiquitous and a daily part of the lives of developers, operations engineers, security professionals, and business leaders.
We believe that our platform currently addresses a significant portion of the IT Operations Management market. According to Gartner, the IT Operations Management market represents a $81 billion opportunity in 2027. We believe a large portion of this spend is for legacy on-premise and private cloud environments but does not fully include the opportunity in modern multi-cloud and hybrid cloud environments. Our platform is designed to address both legacy and modern environments.
We employ a land-and-expand business model centered around offering products that are easy to adopt and have a very short time to value. Our customers can expand their footprint with us on a self-service basis. Our customers often significantly increase their usage of the products they initially buy from us and expand their usage to other products we offer on our platform. We grow with our customers as they expand their workloads in the public and private cloud.
Our Solution and Key Strengths
Datadog was founded on the premise that the old model of siloed developers and IT operations engineers is broken, and that legacy tools used for monitoring static on-premise architectures do not work in modern cloud or hybrid environments. Datadog’s cloud-native platform enables development and operations teams to collaborate, quickly build and improve applications, and drive business performance. Empowered by our out-of-the box functionality and simple, self-service installation, our customers are able to rapidly deploy our platform to provide application- and infrastructure-wide visibility, often within minutes.
-
Built for dynamic cloud and hybrid infrastructures**. Our innovative platform was born in the cloud and was built to work with ephemeral cloud technologies such as microservices, containers and serverless computing. Our data model was built to work at cloud scale with highly dynamic data sets and processes more than 10 trillion events a day.
-
Simple but not simplistic**. Our platform is easy-to-use with out-of-the-box integrations, customizable drag-and-drop dashboards, real-time visualization and prioritized alerting. The platform is deployed in a self-service installation process within minutes, allowing new users to quickly derive value without any specialized training or heavy implementation or customization. It is highly extensible across a wide array of use cases to a broad set of developers, operations engineers, security professionals, product managers, product designers, platform engineers, customer support staff, and business users. As a result, our platform is integral to business operations and used every day, and our users find increasing value in the solution over time.
-
Integrated data platform**. We were the first to combine the “three pillars of observability” - metrics, traces, and logs - with the introduction of our log management solution in 2018. Today, our platform combines infrastructure monitoring, application performance monitoring, log management, user experience monitoring, security monitoring, incident management, continuous integration and continuous delivery, or CI/CD, pipeline and test monitoring in one integrated data platform. This approach increases efficiency by reducing both the expense and friction of attempting to glean insights from disparate systems. We are able to provide a unified view across the IT stack, including infrastructure and application performance, as well as the real-time events impacting performance. Each of our products is integrated and taken together, they provide the ability to view metrics, traces, logs, sessions, security signals, and other data side-by-side and to perform correlation analysis.
-
Built for collaboration**. Our platform was built to break down the silos between developers and operations teams in order to help organizations adopt DevOps practices and improve overall business performance. We provide development and operations teams with a common set of tools to develop a joint understanding of application performance and shared insights into the infrastructure supporting the applications. Additionally, our customizable and interactive dashboards can be shared with business teams to provide them with real-time actionable insights. Over time, as the use cases for our platform have expanded, the types of users that we can serve and help to collaborate have expanded as well, to include security professionals, product managers, product designers, platform engineers, customer support staff, and business users.
-
Cloud agnostic**. Our platform is designed to be deployable across all environments, including public cloud, private cloud, on-premise, multi-cloud, and hybrid environments, allowing organizations to diversify their infrastructure and reduce single vendor dependence.
-
Ubiquitous**. Datadog is frequently deployed across a customer’s entire infrastructure, making it ubiquitous. Compared to legacy systems that are often used only by a few users in an organization’s IT operations team, Datadog is a daily part of the lives of developers, operations engineers and business leaders.
-
Integrates with our customers’ complex environments**. We enable development and operations teams to harness the full spectrum of SaaS and open source tools. We have over 700 out-of-the-box integrations with technologies to provide significant value to our customers without the need for professional services. Our integrations provide for comprehensive data point aggregation and consistent, up-to-date, high-quality customer experiences across heterogeneous IT environments as they are fully maintained by Datadog.
-
Powered by robust machine-learning and artificial intelligence**. Our platform ingests massive amounts of data into our unified data warehouse. We develop actionable insights using our advanced analytics capabilities. Our platform's Watchdog capabilities feature artificial intelligence and machine learning that can cross-correlate metrics, traces, logs, sessions, security signals, and other data to identify outliers and notify users of potential anomalies; discover and help resolve issues quickly with automated root cause analysis; augment the troubleshooting workflow with contextual insights; and minimize impact on customers.
-
Scalable**. Our SaaS platform is highly scalable and is delivered through the cloud. Our platform is massively scalable, currently monitoring more than tens of trillion events a day and millions of servers and containers at any point in time. We offer secure, easily accessible data retention at full granularity for extensive periods of time, which can provide customers with a complete view of their historical data.
Key Benefits to Our Customers
Organizations of all sizes, in all industries, both private and public, purchase our products for a variety of use cases. As of December 31, 2023, we had approximately 27,300 customers in over 150 countries. Our platform provides the following key benefits to our customers:
-
Accelerate digital transformation**. We enable customers to take full advantage of the cloud to develop and maintain mission-critical applications with agility and with confidence in the face of increasing business and time pressure and complexity of underlying infrastructure. As a result, our platform helps accelerate innovation cycles, deliver exceptional digital experiences and optimize business performance.
-
Reduce time to problem detection and resolution**. Using infrastructure, APM, log data, and data from integrations in our unified platform, our customers are able to quickly isolate the root cause of application issues in one place where they otherwise would be required to spend hours trying to investigate using multiple tools. The reduction in mean time to detection and mean time to resolution helps our customers avoid lost revenues and enhance customer experience.
-
Improve agility of development, operations, security and business teams**. We eliminate the historical silos of development and operations teams and provide a platform that enables efficient and agile development through the adoption of DevOps and DevSecOps. Our platform enables development, operations and security teams to collaborate closely with a shared understanding of data and analytics. This helps them develop a joint understanding of application performance and shared insights into the infrastructure supporting the applications.
-
Enable operational efficiency**. Our solution is easy to install, which eliminates the need for heavy implementation costs and professional services. We have hundreds of integrations with key technologies, from which our customers can derive significant value, avoiding internal development costs and professional services required to create those integrations. Our customer-centric pricing model is tailored to customers’ desired usage needs. Our platform empowers customers to better understand the operational needs of their applications and IT environments, enabling greater efficiency in resource allocation and spend on cloud infrastructure.
Our Growth Strategies
We intend to pursue the following growth strategies:
-
Expand our customer base by acquiring new customers**. Our market penetration is low. We believe there is a substantial opportunity to continue to grow our customer base. We intend to drive new customer additions by expanding our sales and marketing efforts in the markets we serve.
-
Expand within our existing customer base through broader deployments, new use cases and new product adoption**. Our base of approximately 27,300 customers as of December 31, 2023 represents a significant opportunity for further sales expansion. We plan to continue to increase sales within our existing customer base through increased usage of our platform and the cross selling of additional products.
-
Expand our technology leadership through continued investment and new products**. We intend to invest in expanding the functionality of our current platform and adding capabilities that address new market opportunities. We have a history of continued innovation. For example, in 2017 we launched APM, in 2018 we launched Log Management, in 2019 we launched Digital Experience Monitoring and Network Performance Monitoring, in 2020 we launched Cloud SIEM, Continuous Profiler and Incident Management, in 2021 we launched Cloud Security Posture Management, Cloud Workload Security, Database Monitoring, and Sensitive Data Scanner, in 2022 we launched Application Security Management, Cloud Security Management, Audit Trail, Observability Pipelines, Cloud Cost Management, and Universal Service Monitoring, and in 2023 we launched Application Vulnerability Management, Data Streams Monitoring, and Workflow Automation.
-
Expand our customer base internationally**. We believe there is a significant opportunity to continue to expand usage of our platform outside of the United States, as international markets have increased the shift of their IT spend to the cloud.
Our Platform
Our proprietary platform provides real-time insights into software applications and IT infrastructure performance to enable better user experiences, faster problem detection and resolution and smarter, more impactful business decisions. Our platform is modular and includes infrastructure monitoring, application performance monitoring, log management, user experience monitoring, network performance monitoring, cloud and application security, developer-focused observability, and incident management, as well as a range of shared features such as sophisticated dashboards, advanced analytics, collaboration tools, workflow automation, and alerting capabilities. Many of our products are fully capable stand-alone so clients can choose to use different capabilities incrementally or deploy many at once. When deployed together, our products automatically enable cross-correlation, which in turn allows customers to gain greater levels of visibility across their infrastructure and applications to more rapidly troubleshoot problems.
Our platform is supported by more than 700 integrations to seamlessly aggregate metrics and events across all of the systems and services that power digital businesses. Our easy-to-use platform is deployed through a self-service installation process. Users can derive value from our platform within minutes without any specialized training or heavy implementation or customization. Customers can easily expand their usage of our platform on a self-serve basis, adding hosts or volumes of data monitored. Our platform is massively scalable currently monitoring more than tens of trillion events a day and millions of servers and containers.
The key elements that can be leveraged across our platform:
-
Single Pane of Glass****.** Our ability to provide a unified source of data enables users to access information from a single platform and easily explore multiple data sources. Through a single dashboard and with a common data framework, users are able to access and explore all of the relevant performance data. Users are able to more quickly assess and resolve their issues without having to toggle between multiple products.
-
Robust, Deep Data Set****.** Our client-side collection technology relies on installation of a single agent for metrics, traces, logs, and other data, allowing for a simple, seamless deployment experience for the customers. We ingest massive amounts of complex data and normalize it. The volume of data associated with combining infrastructure, APM and log management provides for a dramatically more robust data set than any of the individual data sources would provide on their own.
-
SaaS Platform****.** Our cloud based multi-tenant SaaS platform allows for real-time ingestion, and analysis of massive amounts of data, without our customers needing to worry about the provisioning, sizing and capacity of their monitoring platform.
-
One Data Model.** Every piece of data that is ingested by our platform is consistently tagged with metadata regardless of its type. This allows for different kinds of performance data, such as a log event and an application trace, to be queried together, correlated, alerted on, and visualized in a common user interface.
-
Cross-Correlation****.** All of our solutions are integrated and work cohesively to provide a deep level of context and insight into what is occurring in a customer’s IT environment and power faster troubleshooting.
-
Out-Of-The-Box, Actionable Insights****.** From the moment of installation, our platform provides actionable insights through customizable dashboards, predictive analytics, automated correlations, visualizations and alerting.
-
High Accuracy Machine-Learning Capabilities and Predictive Capabilities Powered by the Network Effect****.** Our multi-tenant cloud platform analyzes massive data sets ingested across our customers and their IT environments. It uses machine learning to predict and identify sources of performance or availability issues that customers share due to dependencies on common service providers or third-party services.
-
700+ Fully Supported Integrations****.** We offer more than 700 out-of-the-box integrations including public cloud, private cloud, on-premise hardware, databases and third-party software.
-
Automated Alerts****.** We offer sophisticated real time alerting capabilities in the platform that detects issues, alerts users, and integrates with their service management systems.
Our platform consists of products that can be used individually or as a unified solution, and includes a Marketplace where customers can access products built by our partners on top of the Datadog platform. Our products include:
-
Infrastructure Monitoring****.** Our Infrastructure Monitoring platform provides real-time monitoring of IT infrastructure across public cloud, private cloud and hybrid environments, as well as in containers and serverless architectures, ensuring performance, and availability of applications. All infrastructure data is located in one repository with automatic correlation, regardless of environment size or rate of change, to provide a fulsome view of everything that is occurring across the IT ecosystem.
-
Application Performance Monitoring (APM).** APM provides full visibility into the health and functioning of applications regardless of the deployment environment. Code-level distributed tracing across microservices, hosts, containers and serverless computing functions allows our customers to gain deep insights into application and code performance.
-
Log Management.** Log Management for applications, systems and cloud platforms ingests data, creates indexes and enables querying of logs with visualizations and alerting to provide immediate insight into any performance issues. Logging Without Limits® decouples the cost of log ingestion from processing, allowing customers to cost effectively collect a massive volume of logs and selectively process those they need to monitor.
-
Digital Experience Monitoring.** Digital Experience Monitoring brings visibility up the stack to monitor the digital experience of the user and consists of Synthetics, Real User Monitoring (RUM), and Session Replay. Synthetics provides user-experience monitoring of applications and API endpoints via simulated AI-powered user requests to proactively track application performance and ensure uptime. RUM provides analysis and visualization of the performance of web browser and mobile applications as experienced by all actual users. Session Replay captures and visually replays users' web browser and mobile application experiences to help identify errors, application usage patterns, and design issues.
-
Continuous Profiler****.** Continuous Profiler measures code level performance in any environment through an always-on, and low overhead solution. This allows customers to quickly identify and optimize the slowest and most resource-consuming parts in application code in order to improve mean time to resolution, reduce application latency, and lower cloud costs.
-
Database Monitoring.** Database Monitoring allows customers to view query metrics and explain plans from all of their databases in a single place. With Database Monitoring, they can quickly pinpoint costly and slow queries and drill into precise execution details to address bottlenecks. Additionally, query, host, and application metric correlation makes it easy to identify and understand the impact of resource constraints on database performance.
-
Data Streams Monitoring.** Data Streams Monitoring (DSM) enables customers to easily track and improve the performance of event-driven applications. DSM automatically maps dependencies among services and queues to help measure end-to-end latencies, locate faulty queues or services and their owners, and remediate backed-up messages.
-
Universal Service Monitoring. Universal Service Monitoring automatically detects all microservices across an organization's environment and provides instant visibility into their health and dependencies—all without any code changes.
-
Network Monitoring.** Network Performance Monitoring enables the analysis and visualization of the flow of network traffic in on-premise, cloud-based or hybrid environments, helping customers determine when the network is the root cause of an issue. Network Device Monitoring seamlessly consolidates monitoring and troubleshooting of network hardware, such as routers, firewalls, switches, load balancers, and other network devices.
-
Incident Management.** Incident Management allows users to declare incidents, investigate root cause and dependencies, collaborate around a shared view of the incident, follow to resolution, and auto-generate post-mortem documentations, all within the Datadog platform.
-
Workflow Automation.** Workflow Automation enables customers to easily automate and orchestrate processes across their tech stacks, with hundreds of out-of-the-box actions and dozens of customizable blueprints. Workflow Automation enables automated actions based on observability insights for faster incident remediation, proactive prevention, and improved security.
-
Observability Pipelines. Observability Pipelines enables IT and security teams to cost-effectively collect, transform, and route logs, metrics, and traces from any source to any destination at scale.
-
Cloud Cost Management. Cloud Cost Management provides granular visibility into costs across cloud resources, automatically surfacing changes in cloud costs and visualizing cost data alongside metrics, traces, logs, and other data, and making it easy to find and fix cost inefficiencies.
-
Cloud Security Management. Cloud Security Management delivers vulnerability management, automated compliance checks, continuous posture management, real-time threat detection, identity risk assessments, and a comprehensive resource inventory across the entire cloud infrastructure, all in a unified platform for seamless collaboration and faster remediation. With a unified platform and real-time observability context,
DevOps and security teams can quickly remediate issues and continuously improve their organization's security posture.
-
Application Security Management.** Application Security Management (ASM) delivers continuous, real-time visibility into attacks that target customers' web applications, serverless applications, and APIs. ASM is automatically integrated with APM distributed traces and code-level context, empowering Dev, Ops, and security teams to build and run secure applications in production. Application Vulnerability Management continuously monitors customers' production environments for both code-level and open-source vulnerabilities.
-
Cloud SIEM.** Cloud SIEM (Security Information and Event Management) allows customers to detect threats in real time and investigate security signals across metrics, traces, logs, and other data. It provides the engineering organization, including Dev, Ops, and security teams, visibility into common data sources, in order to better operationalize IT security.
-
Sensitive Data Scanner.** Sensitive Data Scanner helps businesses meet compliance goals by discovering, classifying, and redacting sensitive data, in real-time and at scale. Datadog scans for patterns of sensitive data upon ingestion and then hashes or redacts it, following built-in or user-defined rules to support compliance with GDPR, HIPAA, CCPA, and more.
-
CI Visibility. CI, or Continuous Integration, Visibility provides deep insight into the health and performance of customers' CI environment. Pipeline Visibility allows platform engineers to detect and find the root cause of slow or failing pipelines, builds, and jobs across all their CI providers in a single place. Test Visibility auto-instruments every test service to help developers detect and resolve slow, failing, and flaky tests.
Sales and Marketing
Our sales team is segmented into four revenue-generating areas: an enterprise sales team that sells to large businesses; a high velocity inside sales team that is focused on acquiring new customers; a customer success team that handles new customer on-boarding and expansions in existing customers; and a partner team that works with resellers, system integrators, referral partners and managed service providers. Each of these teams is further split regionally for geographic coverage across the Americas, Asia-Pacific, or APAC, and Europe, the Middle East and Africa, or EMEA, regions. The sales teams work with marketing to actively pursue leads generated from marketing programs and help take prospective customers through an evaluation and purchase process.
We focus our multi-touch marketing efforts on the strength of our product innovation, the value we provide, and our domain expertise. We target the development and IT operations community through our marketing activities, using diverse tactics to connect with prospective customers, such as content marketing, email marketing, events, digital advertising, social media, public relations, partner marketing and community initiatives. We offer prospective customers free trials to help them understand the power of our platform. We also host and present at regional, national, global and virtual events to engage both customers and prospects, deliver product training, share best practices and foster community.
As of December 31, 2023, we had approximately 2,400 employees in our sales and marketing organization, including sales development, field sales, sales engineering, technical solutions, business development, sales operations, sales strategy, customer success and marketing personnel. We intend to continue to invest in our sales and marketing capabilities to capitalize on our market opportunity.
Research and Development
Our research and development organization is responsible for the design, development, testing and delivery of new technologies, features and integrations of our platform, as well as the continued improvement and iteration of our existing products. It is also responsible for operating and scaling our platform including the underlying cloud infrastructure. Our research and development investments seek to drive core technology innovation and bring new products to market. Research and development employees are located primarily in our New York and Paris offices, as well as remotely distributed.
Our research and development team consists of our software engineering, product management, development and site reliability engineering teams. As of December 31, 2023, we had approximately 2,400 employees in our research and development organization. We intend to continue to invest in our research and development capabilities to extend our platform and products.
Our Competition
The worldwide monitoring and analytics market is and has been highly competitive for decades and is rapidly evolving. We compete on the basis of a number of factors, including:
-
ability to provide unified, real-time observability of IT environments;
-
ability to operate in dynamic and elastic environments;
-
extensibility across the enterprise, including development, operations and business users;
-
propensity to enable collaboration between development, operations and business users;
-
ability to monitor any combination of public clouds, private clouds, on-premise and multi-cloud hybrids;
-
ability to provide advanced analytics and machine learning;
-
ease of deployment, implementation and use;
-
breadth of offering and key technology integrations;
-
performance, security, scalability and reliability;
-
quality of service and customer satisfaction;
-
total cost of ownership; and
-
brand recognition and reputation.
Our unified platform combines functionality from numerous traditional product categories, and hence we compete in each of these categories with different vendors:
-
with respect to on-premise infrastructure monitoring, we compete with diversified technology companies and systems management vendors including IBM, Microsoft Corporation, and SolarWinds Corporation.
-
with respect to APM, we compete with Cisco Systems, Inc., New Relic, Inc. and Dynatrace Software Inc.
-
with respect to Log Management, we compete with Splunk Inc. and Elastic N.V.
-
with respect to Cloud monitoring, we compete with native solutions from cloud providers such as Amazon Web Services, or AWS, Microsoft Azure, and Google Cloud Platform, or GCP.
Additionally, we compete with home-grown and open-source technologies across the categories described above. We believe that we compete favorably with respect to the factors listed above. However, many of our competitors have greater financial, technical and other resources, greater brand recognition, larger sales forces and marketing budgets, broader distribution networks, more diverse product and services offerings and larger and more mature intellectual property portfolios. They may be able to leverage these resources to gain business in a manner that discourages customers from purchasing our offerings. Furthermore, we expect that our industry will continue to attract new companies, including smaller emerging companies, which could introduce new offerings. We may also expand into new markets and encounter additional competitors in such markets.
Human Capital Management
Headcount
As of December 31, 2023, we had approximately 5,200 employees operating across 33 countries. Approximately 39% of our full-time employees as of that date were located outside of the United States, 36% of whom were located in France. In countries in which we operate, such as France, we are subject to, and comply with, local labor law requirements, which may automatically make our employees subject to industry-wide collective bargaining agreements. We have not experienced any work stoppages and we consider our relations with our employees to be good.
Culture and Engagement
We strive to create a culture that promotes a healthy work-life balance, career growth, low drama, and a friendly office environment. As part of our commitment to our employees, we periodically assess our culture by conducting global engagement surveys to gain a better understanding of what is important to our employees. The areas in which we have been rated most favorable include employee pride and belief in Datadog's mission and purpose and alignment on how their work supports Datadog's goals and priorities.
Training and Development
Datadog promotes professional growth by offering individual- and team-specific training on an ongoing basis, as well as a wide range of learning programs delivered by our global Talent Development team. We also provide robust manager training that shares effective tools and frameworks around recruiting, managing, and developing team members.
We continually invest in our employees’ career growth and provide employees with a wide range of development opportunities, including face-to-face, virtual, social, and self-directed learning and mentoring.
Compensation and Benefits
We offer industry competitive wages and benefits and are committed to maintaining a workplace environment that promotes employee productivity and satisfaction. We believe our employees should have the support they need to maintain a strong work/life balance, grow personally and professionally, and save for their future. While the philosophy around our benefits is the same worldwide, specific benefits vary regionally due to local regulations and preferences.
Diversity and Inclusion
At Datadog, diversity means making a conscious effort to reflect the many experiences and identities of the world outside, while treating each other with fairness and without bias. Inclusion is the choice we make every day to foster an environment where people of all backgrounds not only belong but excel, so that together, as a company, we can succeed.
We are committed to creating inclusive work spaces for employees with diverse backgrounds and experiences. Our diversity and inclusion programming includes a focus on training workshops and resources that increase education, promote moments of celebration, support belonging, and help our employees feel welcome and respected.
Intellectual Property
Intellectual property rights are important to the success of our business. We rely on a combination of patent, copyright, trademark and trade secret laws in the United States and other jurisdictions, as well as license agreements, confidentiality procedures, non-disclosure agreements with third parties, and other contractual protections, to protect our intellectual property, including our proprietary technology, software, know-how and brand. We use open source software in our services. Our API libraries and agent used by customers to send data to our proprietary platform are licensed by us on an open source basis.
As of December 31, 2023, we own thirty-seven patents globally, five patent applications pending for examination in the United States, three pending PCT applications, and six pending foreign patent applications. The pending U.S. patent applications, if issued, would be scheduled to expire between 2039 and 2043. Despite our pending patent applications, there can be no assurance that our patent applications will result in issued patents. As of December 31, 2023, we own seven registered trademarks in the United States and one hundred sixteen registered trademarks in various non-U.S. jurisdictions. However, as we have expanded internationally, we have been unable to register or obtain the exclusive right to use the Datadog trademark in certain jurisdictions, and as we continue to expand may face similar issues in other jurisdictions.
Although we rely on intellectual property rights, including patents, copyrights, trademarks and trade secrets, as well as contractual protections to establish and protect our proprietary rights, we believe that factors such as the technological and creative skills of our personnel, creation of new services, features and functionality, and frequent enhancements to our proprietary platform are more essential to establishing and maintaining our technology leadership position.
We control access to and use of our proprietary technology and other confidential information through the use of internal and external controls, including contractual protections with employees, contractors, customers and partners. We require our employees, consultants and other third parties to enter into confidentiality and proprietary rights agreements and we
control and monitor access to our software, internal documentation, proprietary technology and other confidential information. Our policy is to require all employees and independent contractors to sign agreements assigning to us any inventions, trade secrets, works of authorship, developments, processes and other intellectual property generated by them on our behalf and under which they agree to protect our confidential information. In addition, we generally enter into confidentiality agreements with our customers and partners. See the section titled “Risk Factors” for a more comprehensive description of risks related to our intellectual property.
Corporate Information
We were incorporated in Delaware in June 2010. Our principal executive offices are located at 620 8th Avenue, 45th Floor, New York, New York 10018, and our telephone number is (866) 329-4466. Our website address is www.datadog.com. Information contained on, or that can be accessed through, our website is not incorporated by reference into this Annual Report on Form 10-K, and you should not consider information on our website to be part of this Annual Report on Form 10-K.
Available Information
Our Annual Report on Form 10-K, Quarterly Reports on Form 10-Q, Current Reports on Form 8-K, and amendments to reports filed pursuant to Sections 13(a) and 15(d) of the Securities Exchange Act of 1934, as amended, or the Exchange Act, are filed with the SEC. Such reports and other information filed by us with the SEC are available free of charge on our website at www.investors.datadoghq.com when such reports are available on the SEC’s website. The SEC maintains an internet site that contains reports, proxy and information statements and other information regarding issuers that file electronically with the SEC at www.sec.gov. The information contained on the websites referenced in this Annual Report on Form 10-K is not incorporated by reference into this filing. Further, our references to website URLs are intended to be inactive textual references only.
Item 1A. Risk Factors
Our operations and financial results are subject to various risks and uncertainties including those described below. You should consider carefully the risks and uncertainties described below, in addition to other information contained in this Annual Report on Form 10-K, including our consolidated financial statements and related notes. The risks and uncertainties described below are not the only ones we face. Additional risks and uncertainties that we are unaware of, or that we currently believe are not material, may also become important factors that adversely affect our business. If any of the following risks or others not specified below materialize, our business, financial condition and results of operations could be materially and adversely affected. In that case, the trading price of our Class A common stock could decline.
Risks Associated with our Growth
Unfavorable conditions in our industry or the global economy, or reductions in information technology spending, could limit our ability to grow our business and negatively affect our results of operations.
Our results of operations may vary based on the impact of unfavorable changes in our industry or the global economy on us or our customers and potential customers. Unfavorable conditions in the economy both in the United States and abroad, including conditions resulting from changes in gross domestic product growth in the United States or abroad, financial and credit market fluctuations, inflation, rising interest rates, international trade relations, political turmoil, natural catastrophes, outbreaks of contagious diseases, such as the COVID-19 pandemic, warfare and terrorist attacks on the United States, Europe, the Asia Pacific region or elsewhere, such as the conflict in the Middle East, could cause a decrease in business investments, including spending on information technology, disrupt the timing and cadence of key industry events, and negatively affect the growth of our business and our results of operations. For example, the COVID-19 pandemic adversely affected workforces, economies and financial markets globally, leading to a reduction in the ability of, or the inability of, customers, partners, suppliers, vendors or other parties to meet their contractual obligations, and for a period of time, a reduction in customer spending on technology, and such conditions may reoccur in the future. The war in Ukraine and the related political and economic responses imposed on Russia such as sanctions, may also exacerbate these issues and trends especially in Europe. More recently, in response to persistently high inflation, the U.S. Federal Reserve has increased interest rates, which may reduce economic growth and cause companies to decrease spending on information technology. These types of unfavorable conditions could disrupt the timing of and attendance at key industry events, which we rely upon in part to generate sales of our products. If those events are disrupted, our marketing investments, sales pipeline and ability to generate new customers and sales of our products could be negatively and adversely affected. Our competitors, many of which are larger and have greater financial resources than we do, may respond to challenging market conditions by lowering prices in an attempt to attract our
customers and may be less dependent on key industry events to generate sales for their products. The increased pace of consolidation in certain industries may result in reduced overall spending on our products and solutions. We cannot predict the timing, strength, or duration of any economic slowdown, instability, or recovery, generally or how any such event may impact our business.
Our recent rapid growth may not be indicative of our future growth. Our rapid growth also makes it difficult to evaluate our future prospects and may increase the risk that we will not be successful.
Our revenue was $2,128.4 million, $1,675.1 million and $1,028.8 million for the years ended December 31, 2023, 2022 and 2021, respectively. You should not rely on the revenue growth of any prior quarterly or annual period as an indication of our future performance. Even if our revenue continues to increase, we expect that our revenue growth rate will decline in the future as a result of a variety of factors, including the maturation of our business. Overall growth of our revenue depends on a number of factors, including our ability to:
-
price our products effectively so that we are able to attract new customers and expand sales to our existing customers;
-
expand the functionality and use cases for the products we offer on our platform;
-
maintain and expand the rates at which customers purchase and renew subscriptions to our platform;
-
provide our customers with support that meets their needs;
-
continue to introduce our products to new markets outside of the United States;
-
successfully identify and acquire or invest in businesses, products or technologies that we believe could complement or expand our platform; and
-
increase awareness of our brand on a global basis and successfully compete with other companies.
We may not successfully accomplish any of these objectives, and as a result, it is difficult for us to forecast our future results of operations. If the assumptions that we use to plan our business are incorrect or change in reaction to changes in our market, or if we are unable to maintain consistent revenue or revenue growth, our stock price could be volatile, and it may be difficult to achieve and maintain profitability. You should not rely on our revenue for any prior quarterly or annual periods as any indication of our future revenue or revenue growth.
In addition, we expect to continue to expend substantial financial and other resources on:
-
our technology infrastructure, including systems architecture, scalability, availability, performance and security;
-
our sales and marketing organization to engage our existing and prospective customers, increase brand awareness and drive adoption of our products;
-
product development, including investments in our product development team and the development of new products and new functionality for our platform as well as investments in further optimizing our existing products and infrastructure;
-
acquisitions or strategic investments;
-
international expansion; and
-
general administration.
These investments may not result in increased revenue growth in our business. If we are unable to maintain or increase our revenue at a rate sufficient to offset the expected increase in our costs, our business, financial position, and results of operations will be harmed, and we may not be able to achieve or maintain profitability over the long term. Additionally, we may encounter unforeseen operating expenses, difficulties, complications, delays, and other unknown factors that may result in losses in future periods. If our revenue growth does not meet our expectations in future periods, our business, financial position and results of operations may be harmed, and we may not achieve or maintain profitability in the future.
We have a history of operating losses and may not achieve or sustain profitability in the future.
We have experienced net losses in several recent fiscal years and as of December 31, 2023, we had an accumulated deficit of $153.7 million. While we have experienced significant revenue growth in recent periods and periods of
profitability, we are not certain whether or when we will obtain a high enough volume of sales to sustain or increase our growth or maintain profitability in the future. We also expect our costs and expenses to increase in future periods, which could negatively affect our future results of operations if our revenue does not increase. In particular, we intend to continue to expend significant funds to further develop our platform, including by introducing new products and functionality, and to e
Showing the first 8K of 143K characters. Open the full section
Item 1B. Unresolved Staff Comments
None.
Item 1C. Cybersecurity
Risk Management and Strategy
We utilize various processes and tools to assess, identify, and manage risks from cybersecurity threats. In the development of our products and features, our security teams work with our engineering and product teams to identify, assess, and agree upon mitigation or remediation measures with respect to product development. On an ongoing basis, we encourage an environment of openness in which our engineering and product teams, led by our security teams, proactively identify, manage and discuss actual or perceived cybersecurity risks. These teams also use automated and manual processes to identify and track risks from cybersecurity threats. The identified risks are triaged, prioritized for remediation, and reported by the security teams to various levels of our senior management, as appropriate. We also deploy technical safeguards that are designed to protect our platform and systems from cybersecurity threats, including firewalls, intrusion prevention, and detection systems. We have established an incident response plan that addresses our response to cybersecurity incidents, and we require periodic training for our employees on cybersecurity threats. In addition, we maintain cybersecurity insurance, however, the costs related to cybersecurity threats or disruptions may not be fully insured.
In addition, we maintain third-party vendor management standards that are used to evaluate cybersecurity risks associated with our third-party service providers, and we assess information technology and software vendors to determine their security posture and maturity. All vendors that process our data or access our systems go through a security and privacy review before they are engaged that is targeted to the services to be provided and the systems and data involved. Based on the information provided by the vendor and depending on the nature of the services provided, our vendor management process may involve security questionnaires and contractual obligations such as audit rights and breach reporting.
We also periodically perform various types of security audits and assessments, including penetration tests, via internal and external parties. In addition, certain Datadog products are subject to specific compliance requirements and standards, including, as applicable, ISO 27001, SOC 2, PCI, and FedRAMP (Low and Moderate), and are tested and evaluated by third-party auditors against those applicable compliance requirements and standards. The identified risks from such audits and assessments are triaged, prioritized, reported by our security teams to various levels of our senior management and tracked and remediated depending on the severity.
Our internal audit function conducts annual interviews across business groups to identify key areas of risk, including cybersecurity risk. This enterprise risk assessment helps inform the internal audit plan, and both the assessment and progress against the internal audit plan are periodically presented to the Audit Committee. Our Chief Information Security Officer also reports separately to our Audit Committee on cyber and information security risk on a quarterly basis.
We have previously and may in the future become the target of cyber-attacks by third parties seeking unauthorized access to our or our customers’ data or to disrupt our ability to provide our services. As a result, we have expended and plan to continue to expend significant resources in an effort to protect against security incidents and to mitigate, detect, and remediate actual and potential vulnerabilities. Notwithstanding the measures and processes we take to manage cybersecurity risk, there is no guarantee that these measures and processes will be successful in preventing or mitigating a cybersecurity incident that could have a material adverse effect on us. For a description of the risks from cybersecurity threats that may materially affect the Company and how those risks may affect the Company, see our risk factors under Part 1. Item 1A. Risk Factors in this Annual Report on Form 10-K, including without limitation “Strategic and Operational Risks—If we or our third-party service providers experience, or are unable to protect against cyber-attacks, ransomware, security incidents, or security breaches, or if unauthorized parties otherwise obtain access to or otherwise compromise our customers’ data, our data, or our platform and information technology systems, then our solution may be perceived as not being secure, our reputation may be harmed, demand for our platform and products may be reduced, and we may incur significant liabilities or additional expenses.”
Governance
Our Board of Directors has delegated its oversight of risks associated with cybersecurity to its Audit Committee. Generally, each quarter, the Audit Committee reviews and discusses with our Chief Information Security Officer material cybersecurity risks and our processes for assessing, identifying, and managing such risks, and the Audit Committee will receive updates as necessary between each quarterly meeting. In the event of a material cybersecurity incident, the Audit Committee will be notified, and the Board of Directors will also receive updates on cybersecurity risks and incidents, as appropriate.
Our Chief Information Security Officer and Chief Technology Officer are the members of our executive team who are principally responsible for overseeing our cybersecurity risk management program. Our Chief Information Security Officer and Chief Technology Officer are informed about cybersecurity threats through their involvement with the processes set forth above. For example, our Chief Information Security Officer receives regular reports on identified cybersecurity risks and
progress toward remediation from our security teams and both our Chief Information Security Officer and Chief Technology Officer are notified of cybersecurity incidents and the management of such incidents in accordance with the escalation procedures of our incident response plan.
We believe these members of our executive team have the appropriate expertise, background, and experience to manage risks arising from cybersecurity threats. Alexis Lê-Quôc is one of the co-founders of our company and has served as our Chief Technology Officer and a member of our board of directors since June 2010. Mr. Lê-Quôc has extensive knowledge and experience from building and leading the development of our technology and from his decades of experience in the technology industry. Prior to co-founding Datadog, Mr. Lê-Quôc worked at Wireless Generation from March 2004 to December 2010, where he most recently served as Director of Live Operations. Previously, Mr. Lê-Quôc held engineering positions at a number of technology and software companies, including IBM Research and France Télécom S.A. Mr. Lê-Quôc received his M.S. in Computer Science from CentraleSupélec. Emilio Escobar has served as our Chief Information Security Officer since September 2020. With two decades of experience in information security and compliance, Mr. Escobar has worked at large enterprises, medium-sized companies, and governmental organizations. Previously, Mr. Escobar served as the Vice President of Information Security for Hulu, where he played a pivotal role in setting up key security functions. Prior to that, Mr. Escobar worked for PlayStation, where he built and ran the software security teams. Mr. Escobar holds a BS in Computer Science from the University of Puerto Rico.
Item 2. Properties
Our current principal executive office is located in New York, New York and, as of December 31, 2023, it consists of approximately 238,000 square feet of space under leases that expire in June 2033.
We lease other offices around the world for our employees, including in Boston, Denver, San Francisco, Paris, Dublin, Amsterdam, Sydney, Tokyo, and Singapore.
We lease all of our facilities and do not own any real property. We intend to procure additional space in the future as we continue to add employees and expand geographically. We believe our facilities are adequate and suitable for our current needs.
Item 3. Legal Proceedings
From time to time we may become involved in legal proceedings or be subject to claims arising in the ordinary course of our business. We are not presently a party to any legal proceedings that, if determined adversely to us, would individually or taken together have a material adverse effect on our business, operating results, cash flows or financial condition. Defending such proceedings is costly and can impose a significant burden on management and employees. The results of any current or future litigation cannot be predicted with certainty, and regardless of the outcome, litigation can have an adverse impact on us because of defense and settlement costs, diversion of management resources and other factors.
Item 4. Mine Safety Disclosures
Not applicable.
PART II
Item 5. Market for Registrant's Common Equity, Related Stockholder Matters and Issuer Purchases of Equity Securities
Market Information and Holders of Record
Our Class A common stock is traded on The Nasdaq Global Select Market, or Nasdaq, under the symbol “DDOG”. Our Class B common stock is not listed or traded on any exchange, but each share of Class B common stock is convertible at any time at the option of the holder into one share of Class A common stock, and is automatically converted upon sale or transfer into one share of Class A common stock.
As of February 15, 2024, there were 305,929,910 holders of record of our Class A common stock and 25,944,197 holders of record of our Class B common stock.
Dividend Policy
We have never declared or paid any dividends on our Class A common stock or Class B common stock. We currently intend to retain all available funds and any future earnings for the operation and expansion of our business. Accordingly, we do not anticipate declaring or paying dividends in the foreseeable future. The payment of any future dividends will be at the discretion of our Board of Directors and will depend on our results of operations, capital requirements, financial condition, prospects, contractual arrangements, any limitations on payment of dividends present in any debt agreements, and other factors that our Board of Directors may deem relevant.
Recent Sales of Unregistered Equity Securities
During the year ended December 31, 2023, we issued 176,687 shares of Class A common stock as consideration in acquisitions. The issuance was deemed exempt from registration under the Securities Act pursuant to the exemption provided by Section 4(a)(2) of the Securities Act as a transaction by an issuer not involving a public offering.
Issuer Purchases of Equity Securities
None.
Stock Performance Graph
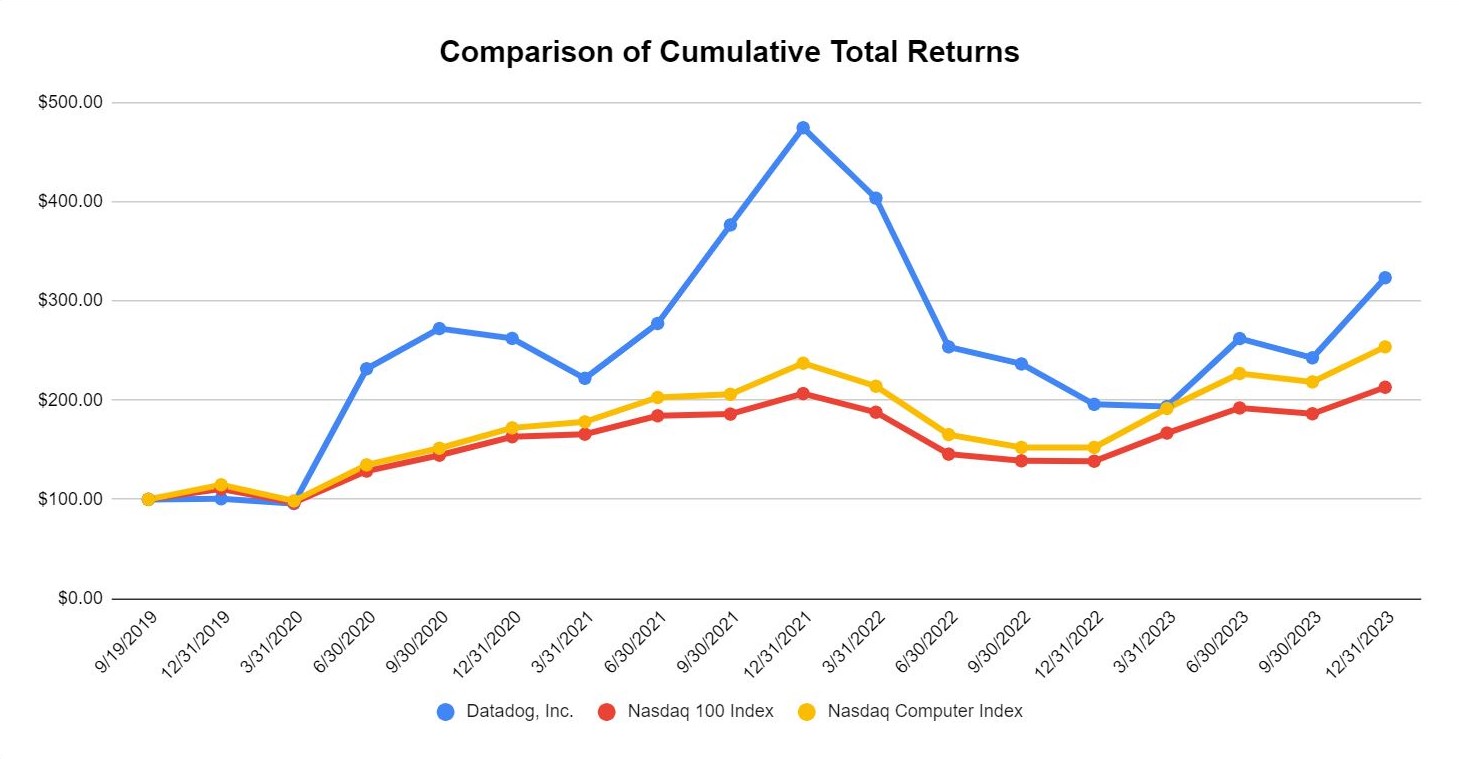
The graph below shows a comparison, from September 19, 2019 (the date our Class A common stock commenced trading on Nasdaq) through December 31, 2023, of the cumulative total return to stockholders of our Class A common stock relative to the Nasdaq-100 Index, or the Nasdaq 100, and the Nasdaq Computer Index, or the Nasdaq Computer.
The graph assumes that $100 was invested in each of our Class A common stock, the Nasdaq 100 and the Nasdaq Computer at their respective closing prices on September 19, 2019 and assumes reinvestment of gross dividends. The stock price performance shown in the graph represents past performance and should not be considered an indication of future stock price performance.
This performance graph shall not be deemed “soliciting material” or to be “filed” with the SEC for purposes of Section 18 of the Exchange Act, or otherwise subject to the liabilities under that Section, and shall not be deemed to be incorporated by reference into any filing of Datadog, Inc. under the Securities Act or the Exchange Act.
Item 6. [Reserved]
Item 7. Management’s Discussion and Analysis of Financial Condition and Results of Operations
The following discussion and analysis of our financial condition and results of operations should be read in conjunction with our audited consolidated financial statements and related notes appearing elsewhere in this Annual Report on Form 10-K. This discussion, particularly information with respect to our future results of operations or financial condition, business strategy and plans and objectives of management for future operations, includes forward-looking statements that involve risks and uncertainties as described under the heading “Special Note Regarding Forward-Looking Statements” in this Annual Report on Form 10-K. You should review the disclosure under the heading “Part I, Item 1A. Risk Factors” in this Annual Report on Form 10-K for a discussion of important factors that could cause our actual results to differ materially from those anticipated in these forward-looking statements.
This section of our Annual Report on Form 10-K discusses our financial condition and results of operations for the fiscal years ended December 31, 2023 and 2022, and year-to-year comparisons between fiscal 2023 and fiscal 2022. A discussion of our financial condition and results of operations for the fiscal year ended December 31, 2021 and year-to-year comparisons between fiscal 2022 and fiscal 2021 that are not included in this Annual Report on Form 10-K can be found in “Management’s Discussion and Analysis of Financial Condition and Results of Operations” in Part II, Item 7 of our Annual Report on Form 10-K for the fiscal year ended December 31, 2022, filed on February 24, 2023.
Overview
Datadog is the observability and security platform for cloud applications.
Our SaaS platform integrates and automates infrastructure monitoring, application performance monitoring, log management, user experience monitoring, cloud security, and many other capabilities to provide unified, real-time observability and security for our customers’ entire technology stack. Datadog is used by organizations of all sizes and across a wide range of industries to enable digital transformation and cloud migration, drive collaboration among development, operations, security and business teams, accelerate time to market for applications, reduce time to problem resolution, secure applications and infrastructure, understand user behavior and track key business metrics.
We generate revenue from the sale of subscriptions to customers using our cloud-based platform. The terms of our subscription agreements are primarily monthly or annual. Customers also have the option to purchase additional products, such as additional containers to monitor, custom metrics packages, anomaly detection and app analytics. Professional services are generally not required for the implementation of our products and revenue from such services has been immaterial to date.
We employ a land-and-expand business model centered around offering products that are easy to adopt and have a very short time to value. Our customers can expand their footprint with us on a self-service basis. Our customers often significantly increase their usage of the products they initially buy from us and expand their usage to other products we offer on our platform. We grow with our customers as they expand their workloads in the public and private cloud.
As of December 31, 2023, we had $330.3 million in cash, cash equivalents and restricted cash and $2,252.6 million in marketable securities. We have grown rapidly in recent periods, with revenues for the fiscal years ended December 31, 2023, 2022 and 2021 of $2,128.4 million, $1,675.1 million, and $1,028.8 million, respectively, representing year-over-year growth of 27% from the fiscal year ended December 31, 2022 to the fiscal year ended December 31, 2023 and 63% from the fiscal year ended December 31, 2021 to the fiscal year ended December 31, 2022. Substantially all of our revenue is from subscription software sales. We have continued to make significant expenditures and investments, including in personnel-related costs, sales and marketing, infrastructure and operations, and have incurred net income (losses) of $48.6 million, $(50.2) million and $(20.7) million for the fiscal years ended December 31, 2023, 2022 and 2021, respectively. Our operating cash flow was $660.0 million, $418.4 million and $286.5 million for the years ended December 31, 2023, 2022 and 2021, respectively. Our free cash flow was $597.5 million, $353.5 million and $250.5 million for the years ended December 31, 2023, 2022 and 2021, respectively. See the section titled “—Liquidity and Capital Resources—Non-GAAP Free Cash Flow” below.
Unfavorable conditions in the economy both in the United States and abroad may negatively affect the growth of our business and our results of operations. For example, macroeconomic events including rising inflation, the U.S. Federal Reserve raising interest rates, the Russian invasion of Ukraine, the conflict in the Middle East and the COVID-19 pandemic have led to economic uncertainty. Historically, during periods of economic uncertainty and downturns, businesses may slow spending on information technology, which may impact our business and our customers’ businesses. In recent quarters, we have seen slower usage growth from existing customers, which may be related to the uncertain macroeconomic environment.
Due to our subscription model, the effect of macroeconomic conditions may not be fully reflected in our results of operations until future periods. However, if economic uncertainty increases or the global economy worsens, our business, financial condition and results of operations may be harmed. For further discussion of the potential impacts of macroeconomic events on our business, financial condition, and operating results, see “Risk Factors” included in Part I, Item 1A of this report.
Factors Affecting Our Performance
Acquiring New Customers
We believe there is substantial opportunity to continue to grow our customer base. We intend to drive new customer acquisition by continuing to invest significantly in sales and marketing to engage our prospective customers, increase brand awareness and drive adoption of our platform and products. We also plan to continue to invest in building brand awareness within the development and operations communities. As of December 31, 2023, we had approximately 27,300 customers spanning organizations of a broad range of sizes and industries, compared to approximately 23,200 as of December 31, 2022. Customers as of December 31, 2022 exclude customers from a then-recent acquisition, which did not contribute meaningful revenue during the fiscal year. Our ability to attract new customers will depend on a number of factors, including the effectiveness and pricing of our products, offerings of our competitors, and the effectiveness of our marketing efforts.
We define the number of customers as the number of accounts with a unique account identifier for which we have an active subscription in the period indicated. Users of our free trials or tier are not included in our customer count. A single organization with multiple divisions, segments or subsidiaries is generally counted as a single customer. However, in some cases where they have separate billing terms, we may count separate divisions, segments or subsidiaries as multiple customers.
Expanding Within Our Existing Customer Base
Our base of customers represents a significant opportunity for further sales expansion. As of December 31, 2023, we had approximately 3,190 customers with annual run-rate revenue, or ARR, of $100,000 or more, representing 86% of our ARR, up from 2,780 as of December 31, 2022, representing 85% of our ARR. We monitor our number of customers with ARR of $100,000 or more, and believe it is useful to investors, as an indicator of our ability to grow the number of customers that are exceeding this ARR threshold. We define ARR as the annual run-rate revenue of subscription agreements from all customers at a point in time. We calculate ARR by taking the monthly run-rate revenue, or MRR, and multiplying it by 12. MRR for each month is calculated by aggregating, for all customers during that month, monthly revenue from committed contractual amounts, additional usage, usage from subscriptions for a committed contractual amount of usage that is delivered as used and monthly subscriptions. ARR and MRR should be viewed independently of revenue, and do not represent our revenue under GAAP on a monthly or annualized basis, as they are operating metrics that can be impacted by contract start and end dates and renewal rates. ARR and MRR are not intended to be replacements or forecasts of revenue.
A further indication of the propensity of our customer relationships to expand over time is our dollar-based net retention rate, which compares our ARR from the same set of customers in one period, relative to the year-ago period. As of December 31, 2023, our trailing 12-month dollar-based net retention rate was mid-110%'s. As of December 31, 2022, our trailing 12-month dollar-based net retention rate was mid-140%'s. The decline in our trailing 12-month dollar-based net retention rate was primarily attributable to slower usage growth from existing customers, which may be related to the uncertain macroeconomic environment. We calculate dollar-based net retention rate as of a period end by starting with the ARR from the cohort of all customers as of 12 months prior to such period-end, or the Prior Period ARR. We then calculate the ARR from these same customers as of the current period-end, or the Current Period ARR. Current Period ARR includes any expansion and is net of contraction or attrition over the last 12 months, but excludes ARR from new customers in the current period. We then divide the total Current Period ARR by the total Prior Period ARR to arrive at the point-in-time dollar-based net retention rate. We then calculate the weighted average of the trailing 12-month point-in-time dollar-based net retention rates, to arrive at the trailing 12-month dollar-based net retention rate. As the growth of our business has decelerated in recent quarters, our trailing 12-month dollar-based net retention rate has declined.
We believe that our land-and-expand business model allows us to efficiently increase revenue from our existing customer base. Our customers often expand the deployment of our platform across large teams and more broadly within the enterprise as they migrate more workloads to the cloud, find new use cases for our platform, and generally realize the benefits of our platform. We intend to continue to invest in enhancing awareness of our brand and developing more products, features and functionality, which we believe are important factors to achieve widespread adoption of our platform. Our ability to increase sales to existing customers will depend on a number of factors, including our customers’ satisfaction with our solution, competition, pricing and overall changes in our customers’ spending levels.
Sustaining Innovation and Technology Leadership
Our success is dependent on our ability to sustain innovation and technology leadership in order to maintain our competitive advantage. We believe that we have built a highly differentiated platform that will position us to further extend the adoption of our platform and products. Datadog is frequently deployed across a customer’s entire infrastructure, making it ubiquitous. Datadog is a daily part of the lives of developers, operations engineers and business leaders. We employ a land-and-expand business model centered around offering products that are easy to adopt and have a very short time to value. Our efficient go-to-market model enables us to prioritize significant investment in innovation. We have demonstrated the success of our platform approach, through expansion beyond our initial infrastructure monitoring solution to include over 19 products. As of December 31, 2023, approximately 83% of our customers were using more than one product, up from approximately 81% a year earlier. Additionally, as of December 31, 2023, approximately 47% of our customers were using more than four products, up from approximately 42% a year earlier, and approximately 22% of our customers were using more than six products, up from approximately 18% a year earlier. We believe these metrics indicate strong expansion of product adoption across our platform.
We intend to continue to invest in building additional products, features and functionality that expand our capabilities and facilitate the extension of our platform to new use cases. We also intend to continue to evaluate strategic acquisitions and investments in businesses and technologies to drive product and market expansion. Our future success is dependent on our ability to successfully develop, market and sell existing and new products to both new and existing customers.
Expanding Internationally
We believe there is a significant opportunity to expand usage of our platform outside of North America. Revenue, as determined based on the billing address of our customers, from regions outside of North America was approximately 30% and 28% of our total revenue for each of the years ended December 31, 2023 and 2022, respectively. In addition, we have made and plan to continue to make significant investments to expand geographically, particularly in EMEA and APAC. Although these investments may adversely affect our operating results in the near term, we believe that they will contribute to our long-term growth. Beyond North America, we now have sales presence internationally, primarily in Amsterdam, Dublin, London, Paris, Seoul, Singapore, Sydney, and Tokyo.
Components of Results of Operations
Revenue
We generate revenue from the sale of subscriptions to customers using our cloud-based platform. The terms of our subscription agreements are primarily monthly, annual or multi-year, with the majority of our revenue coming from annual subscriptions. Our customers can enter into a subscription for a committed contractual amount of usage that is apportioned ratably on a monthly basis over the term of the subscription period, a subscription for a committed contractual amount of usage that is delivered as used, or a monthly subscription based on usage. To the extent that our customers’ usage exceeds the committed contracted amounts under their subscriptions, either on a monthly basis in the case of a ratable subscription or once the entire commitment is used in the case of a delivered-as-used subscription, they are charged for their incremental usage.
Usage is measured primarily by the number of hosts or by the volume of data indexed. A host is generally defined as a server, either in the cloud or on-premise. Our infrastructure monitoring, APM and network performance monitoring products are priced per host, our logs product is priced primarily per log events indexed and secondarily by events ingested. Customers also have the option to purchase additional products, such as additional container or serverless monitoring, custom metrics packages, anomaly detection, synthetic monitoring and app analytics.
In the case of subscriptions for committed contractual amounts of usage, revenue is recognized ratably over the term of the subscription agreement, generally beginning on the date that our platform is made available to a customer. As a result, much of our revenue is generated from subscriptions entered into during previous periods. Consequently, any decreases in new subscriptions or renewals in any one period may not be immediately reflected as a decrease in revenue for that period, but could negatively affect our revenue in future quarters. This also makes it difficult for us to rapidly increase our revenue through the sale of additional subscriptions in any period, as revenue is recognized over the term of the subscription agreement. In the case of a subscription for a committed contractual amount of usage that is delivered as used, a monthly subscription based on usage, or usage in excess of a ratable subscription, we recognize revenue as the product is used, which may lead to fluctuations in our revenue and results of operations. In addition, historically, we have experienced seasonality in new customer bookings, as we typically enter into a higher percentage of subscription agreements with new customers in the fourth quarter of the year.
Due to ease of implementation of our products, professional services generally are not required and revenue from such services has been immaterial to date.
Cost of Revenue
Cost of revenue primarily consists of expenses related to providing our products to customers, including payments to our third-party cloud infrastructure providers for hosting our software, personnel-related expenses for operations and global support, including salaries, benefits, bonuses and stock-based compensation, payment processing fees, information technology, depreciation and amortization related to the amortization of acquired intangibles and internal-use software and other overhead costs such as allocated facilities.
We intend to continue to invest additional resources in our platform infrastructure and our customer support and success organizations to expand the capability of our platform and ensure that our customers are realizing the full benefit of our platform and products. The level, timing and relative investment in our infrastructure could affect our cost of revenue in the future.
Gross Profit and Gross Margin
Gross profit represents revenue less cost of revenue. Gross margin is gross profit expressed as a percentage of revenue. Our gross margin may fluctuate from period to period as our revenue fluctuates, and as a result of the timing and amount of investments to expand our products and geographical coverage.
Operating Expenses
Our operating expenses consist of research and development, sales and marketing, and general and administrative expenses. Personnel costs are the most significant component of operating expenses and consist of salaries, benefits, bonuses, stock-based compensation expense and sales commissions. Operating expenses also include overhead costs for facilities and shared IT-related expenses, including depreciation expense.
Research and Development
Research and development expense consists primarily of personnel costs for our engineering, service and design teams. Additionally, research and development expense includes contractor fees, depreciation and amortization and allocated overhead costs. Research and development costs are expensed as incurred. We expect that our research and development expense will increase in absolute dollars as our business grows, particularly as we incur additional costs related to continued investments in our platform.
Sales and Marketing
Sales and marketing expense consists primarily of personnel costs for our sales and marketing organization, costs of general marketing and promotional activities, including the free tier and free introductory trials of our products, travel-related expenses, amortization of acquired customer relationships, and allocated overhead costs. Sales commissions earned by our sales force are deferred and amortized on a straight-line basis over the expected period of benefit, which we have determined to be four years. We expect that our sales and marketing expense will increase in absolute dollars as we expand our sales and marketing efforts.
General and Administrative
General and administrative expense consists primarily of personnel costs and contractor fees for finance, legal, human resources, information technology and other administrative functions. In addition, general and administrative expense includes non-personnel costs, such as legal, accounting and other professional fees, hardware and software costs, certain tax, license and insurance-related expenses and allocated overhead costs.
We have incurred, and expect to continue to incur, additional expenses as a result of operating as a public company, including costs to comply with the rules and regulations applicable to companies listed on a national securities exchange, costs related to compliance and reporting obligations, and increased expenses for insurance, investor relations and professional services. We expect that our general and administrative expense will increase in absolute dollars as our business grows.
Other Income (Loss), Net
Other income (loss), net consists of interest income, primarily due to income earned on money market funds included in cash and cash equivalents and on marketable securities, partially offset by interest expense due on the 2025 Notes and amortization of premiums on our marketable securities.
Provision for Income Taxes
Provision for income taxes consists of U.S. federal and state income taxes and income taxes in certain foreign jurisdictions in which we conduct business. We recorded a full valuation allowance on our federal and state deferred tax assets as we have concluded that it is not more likely than not that the deferred tax assets will be realized.
Results of Operations
The following table sets forth our consolidated statements of operations data for the periods indicated:
| Year Ended December 31, | |||||||||||||||||
| 2023 | 2022 | 2021 | |||||||||||||||
| (in thousands) | |||||||||||||||||
| Revenue | $ | 2,128,359 | $ | 1,675,100 | $ | 1,028,784 | |||||||||||
| Cost of revenue (1)(2)(3) | 409,908 | 346,743 | 234,245 | ||||||||||||||
| Gross profit | 1,718,451 | 1,328,357 | 794,539 | ||||||||||||||
| Operating expenses: | |||||||||||||||||
| Research and development (1)(3) | 962,447 | 752,351 | 419,769 | ||||||||||||||
| Sales and marketing (1)(2)(3) | 609,276 | 495,288 | 299,497 | ||||||||||||||
| General and administrative (1)(3) | 180,192 | 139,413 | 94,429 | ||||||||||||||
| Total operating expenses | 1,751,915 | 1,387,052 | 813,695 | ||||||||||||||
| Operating loss | (33,464) | (58,695) | (19,156) | ||||||||||||||
| Other income: | |||||||||||||||||
| Interest expense (4) | (6,302) | (16,535) | (21,052) | ||||||||||||||
| Interest income and other income, net | 100,001 | 37,160 | 21,786 | ||||||||||||||
| Other income, net | 93,699 | 20,625 | 734 | ||||||||||||||
| Income (loss) before provision for income taxes | 60,235 | (38,070) | (18,422) | ||||||||||||||
| Provision for income taxes | 11,667 | 12,090 | 2,323 | ||||||||||||||
| Net income (loss) | $ | 48,568 | $ | (50,160) | $ | (20,745) |
(1)Includes stock-based compensation expense as follows:
| Year Ended December 31, | |||||||||||||||||
| 2023 | 2022 | 2021 | |||||||||||||||
| (in thousands) | |||||||||||||||||
| Cost of revenue | $ | 17,578 | $ | 10,827 | $ | 4,565 | |||||||||||
| Research and development | 313,096 | 237,120 | 101,942 | ||||||||||||||
| Sales and marketing | 101,937 | 76,735 | 35,035 | ||||||||||||||
| General and administrative | 49,689 | 38,472 | 22,195 | ||||||||||||||
| Total | $ | 482,300 | $ | 363,154 | $ | 163,737 |
(2)Includes amortization of acquired intangibles expense as follows:
| Year Ended December 31, | |||||||||||||||||
| 2023 | 2022 | 2021 | |||||||||||||||
| (in thousands) | |||||||||||||||||
| Cost of revenue | $ | 8,041 | $ | 6,750 | $ | 3,792 | |||||||||||
| Sales and marketing | 825 | 825 | 600 | ||||||||||||||
| Total | $ | 8,866 | $ | 7,575 | $ | 4,392 |
(3)Includes employer payroll taxes on employee stock transactions as follows:
| Year Ended December 31, | |||||||||||||||||
| 2023 | 2022 | 2021 | |||||||||||||||
| (in thousands) | |||||||||||||||||
| Cost of revenue | $ | 364 | $ | 266 | $ | 345 | |||||||||||
| Research and development | 21,449 | 10,384 | 8,143 | ||||||||||||||
| Sales and marketing | 5,917 | 2,766 | 6,349 | ||||||||||||||
| General and administrative | 4,811 | 830 | 1,248 | ||||||||||||||
| Total | $ | 32,541 | $ | 14,246 | $ | 16,085 |
(4)Includes amortization of debt discount and issuance costs as follows:
| Year Ended December 31, | |||||||||||||||||
| 2023 | 2022 | 2021 | |||||||||||||||
| (in thousands) | |||||||||||||||||
| Interest expense | $ | 3,388 | $ | 3,369 | $ | 3,349 |
The following table sets forth our consolidated statements of operations data expressed as a percentage of revenue for the periods indicated:
| Year Ended December 31, | |||||||||||||||||
| 2023 | 2022 | 2021 | |||||||||||||||
| (as a percentage of total revenue**(1)****)** | |||||||||||||||||
| Revenue | 100 | % | 100 | % | 100 | % | |||||||||||
| Cost of revenue | 19 | 21 | 23 | ||||||||||||||
| Gross profit | 81 | 79 | 77 | ||||||||||||||
| Operating expenses: | |||||||||||||||||
| Research and development | 45 | 45 | 41 | ||||||||||||||
| Sales and marketing | 29 | 30 | 29 | ||||||||||||||
| General and administrative | 8 | 8 | 9 | ||||||||||||||
| Total operating expenses | 82 | 83 | 79 | ||||||||||||||
| Operating loss | (2) | (4) | (2) | ||||||||||||||
| Other income: | |||||||||||||||||
| Interest expense | — | (1) | (2) | ||||||||||||||
| Interest income and other income, net | 5 | 2 | 2 | ||||||||||||||
| Other income, net | 4 | 1 | — | ||||||||||||||
| Income (loss) before provision for income taxes | 3 | (2) | (2) | ||||||||||||||
| Provision for income taxes | 1 | 1 | 0 | ||||||||||||||
| Net income (loss) | 2 | % | (3) | % | (2) | % |
(1)Certain items may not total due to rounding.
Comparison of the Years Ended December 31, 2023 and 2022
Revenue
| Year Ended December 31, | |||||||||||||||||||||||
| 2023 | 2022 | Change | % Change | ||||||||||||||||||||
| Revenue | $ | 2,128,359 | $ | 1,675,100 | $ | 453,259 | 27 | % |
Revenue increased by $453.3 million or 27%, for the year ended December 31, 2023 compared to the year ended December 31, 2022. Approximately 65% of the increase in revenue was attributable to growth from existing customers, and the remaining 35% was attributable to growth from new customers.
Cost of Revenue and Gross Margin
| Year Ended December 31, | |||||||||||||||||||||||
| 2023 | 2022 | Change | % Change | ||||||||||||||||||||
| (dollars in thousands) | |||||||||||||||||||||||
| Cost of revenue | $ | 409,908 | $ | 346,743 | $ | 63,165 | 18 | % | |||||||||||||||
| Gross margin | 81 | % | 79 | % | 2 | % |
Cost of revenue increased by $63.2 million, or 18%, for the year ended December 31, 2023 compared to the year ended December 31, 2022. This increase was primarily due to an increase of $36.8 million in third-party cloud infrastructure hosting and software costs, an increase of $16.2 million in personnel expenses as a result of increased headcount, and an increase of $6.2 million in depreciation and amortization expense.
Our gross margin increased by 2% for the year ended December 31, 2023 compared to the year ended December 31, 2022, primarily as the result of revenue growth exceeding the growth of third-party cloud infrastructure provider costs due to cost savings.
Research and Development
| Year Ended December 31, | |||||||||||||||||||||||
| 2023 | 2022 | Change | % Change | ||||||||||||||||||||
| (dollars in thousands) | |||||||||||||||||||||||
| Research and development | $ | 962,447 | $ | 752,351 | $ | 210,096 | 28 | % | |||||||||||||||
| Percentage of revenue | 45 | % | 45 | % |
Research and development expense increased by $210.1 million, or 28%, for the year ended December 31, 2023 compared to the year ended December 31, 2022. This increase was primarily due to an increase of $194.5 million in personnel costs including allocated overhead costs for our engineering, product and design teams as a result of increased headcount and an increase of $14.1 million in cloud infrastructure-related investments.
Sales and Marketing
| Year Ended December 31, | |||||||||||||||||||||||
| 2023 | 2022 | Change | % Change | ||||||||||||||||||||
| (dollars in thousands) | |||||||||||||||||||||||
| Sales and marketing | $ | 609,276 | $ | 495,288 | $ | 113,988 | 23 | % | |||||||||||||||
| Percentage of revenue | 29 | % | 30 | % |
Sales and marketing expense increased by $114.0 million, or 23%, for the year ended December 31, 2023 compared to the year ended December 31, 2022. This increase was primarily due to an increase of $107.5 million in personnel costs including allocated overhead costs for our sales and marketing organization as a result of increased headcount and increased variable compensation for our sales personnel and an increase of $5.4 million in advertising, sales, marketing and promotional activities.
General and Administrative
| Year Ended December 31, | |||||||||||||||||||||||
| 2023 | 2022 | Change | % Change | ||||||||||||||||||||
| (dollars in thousands) | |||||||||||||||||||||||
| General and administrative | $ | 180,192 | $ | 139,413 | $ | 40,779 | 29 | % | |||||||||||||||
| Percentage of revenue | 8 | % | 8 | % |
General and administrative expense increased by $40.8 million, or 29%, for the year ended December 31, 2023 compared to the year ended December 31, 2022. This increase was primarily due to an increase in personnel costs including allocated overhead costs as a result of increased headcount, legal expenses, and other professional services.
Other Income, Net
| Year Ended December 31, | |||||||||||||||||||||||
| 2023 | 2022 | Change | % Change | ||||||||||||||||||||
| (dollars in thousands) | |||||||||||||||||||||||
| Other income, net | $ | 93,699 | $ | 20,625 | $ | 73,074 | 354 | % | |||||||||||||||
| Percentage of revenue | 4 | % | 1 | % |
Other income, net increased by $73.1 million, or 354% for the year ended December 31, 2023 compared to the year ended December 31, 2022. This increase was primarily driven by an increase of $68.5 million in interest income, mainly due to income earned from investments in marketable securities.
Liquidity and Capital Resources
Our largest source of operating cash is cash collection from sales of subscriptions to our customers. Our primary uses of cash from operating activities are for personnel expenses, hosting expenses, facility expenses, and marketing expenses. We have generated positive cash flows from operations during the years ended December 31, 2023, 2022, and 2021. When assessing sources of liquidity, we also include cash and cash equivalents of $330.3 million and marketable securities of $2.3 billion as of December 31, 2023. We believe that our existing cash and cash equivalents, marketable securities and cash flow from operations will be sufficient to support our cash requirements for the next 12 months and beyond.
Our working capital requirements principally consist of workforce salaries, bonuses, commissions, and benefits and, to a lesser extent, cancellable and non-cancelable licenses and services arrangements that are integral to our business operations, and operating lease obligations. Non-cancelable purchase commitments for business operations and operating lease obligations total $485.0 million and $347.1 million, respectively, as of December 31, 2023, due primarily over the next five years. Purchase commitments for business operations are primarily related to cloud hosting and other software-based services.
We have also issued long-term debt to finance our business. In June 2020, we issued $747.5 million aggregate principal amount of the 2025 Notes in a private placement to qualified institutional buyers pursuant to Rule 144A under the Securities Act. The total net proceeds from the sale of the 2025 Notes, after deducting the initial purchasers’ discounts and debt issuance costs, were approximately $730.2 million. The principal and future interest payments related to our 2025 Notes are $749.0 million.
Cash Flows
The following table shows a summary of our cash flows for the periods presented:
| Year Ended December 31, | |||||||||||||||||
| 2023 | 2022 | ||||||||||||||||
| (in thousands) | |||||||||||||||||
| Cash provided by operating activities | $ | 659,954 | $ | 418,407 | |||||||||||||
| Cash used in investing activities | (731,365) | (384,670) | |||||||||||||||
| Cash provided by financing activities | 58,279 | 36,023 |
Operating Activities
Net cash provided by operating activities for the year ended December 31, 2023 increased $241.5 million compared to the year ended December 31, 2022, primarily driven by an increase in non-cash charges of $104.6 million, an increase in deferred revenue of $62.3 million, and an increase in accounts payable of $59.1 million. The increase in non-cash charges related primarily to an increase of $119.1 million in stock-based compensation as we continued to increase headcount to support the growth of the business. The increase in cash provided by operating activities was partially offset by a decrease in accrued expenses and other liabilities of $78.1 million.
Investing Activities
Net cash used in investing activities for the year ended December 31, 2023 increased by $346.7 million compared to the year ended December 31, 2022, primarily driven by a increase in the investment in marketable securities of $1,144.3 million, partially offset by an increase in proceeds from maturities of marketable securities of $726.8 million.
Financing Activities
Net cash provided by financing activities for the year ended December 31, 2023 increased by $22.3 million compared to the year ended December 31, 2022, primarily due to an increase in proceeds from the issuance of Class A common stock under the ESPP of $11.3 million and an increase in proceeds from the exercise of stock options of $10.9 million.
Non-GAAP Free Cash Flow
We report our financial results in accordance with U.S. GAAP. To supplement our consolidated financial statements, we provide investors with the amount of free cash flow, which is a non-GAAP financial measure. Free cash flow represents net cash provided by operating activities, reduced by capital expenditures and capitalized software development costs, if any. Free cash flow is a measure used by management to understand and evaluate our liquidity and to generate future operating plans. The reduction of capital expenditures and amounts capitalized for software development facilitates comparisons of our liquidity on a period-to-period basis and excludes items that we do not consider to be indicative of our liquidity. We believe that free cash flow is a measure of liquidity that provides useful information to our management, board of directors, investors and others in understanding and evaluating the strength of our liquidity and future ability to generate cash that can be used for strategic opportunities or investing in our business. Nevertheless, our use of free cash flow has limitations as an analytical tool, and you should not consider it in isolation or as a substitute for analysis of our financial results as reported under GAAP. Further, our definition of free cash flow may differ from the definitions used by other companies and therefore comparability may be limited. You should consider free cash flow alongside our other GAAP-based financial performance measures, such as net cash used in operating activities, and our other GAAP financial results.
The following table presents a reconciliation of free cash flow to net cash provided by operating activities, the most directly comparable financial measure calculated in accordance with GAAP, for each of the periods indicated:
| Year Ended December 31, | |||||||||||||||||
| 2023 | 2022 | 2021 | |||||||||||||||
| (in thousands) | |||||||||||||||||
| Net cash provided by operating activities | $ | 659,954 | $ | 418,407 | $ | 286,545 | |||||||||||
| Less: Purchases of property and equipment | (27,586) | (35,261) | (9,956) | ||||||||||||||
| Less: Capitalized software development costs | (34,820) | (29,628) | (26,069) | ||||||||||||||
| Free cash flow | $ | 597,548 | $ | 353,518 | $ | 250,520 |
Critical Accounting Estimates
Our financial statements are prepared in accordance with GAAP. The preparation of these financial statements requires us to make estimates and assumptions that affect the reported amounts of assets, liabilities, revenue, expenses and related disclosures. We evaluate our estimates and assumptions on an ongoing basis. Our estimates are based on historical experience and various other assumptions that we believe to be reasonable under the circumstances. Our actual results could differ from these estimates.
The significant accounting policies and methods used in the preparation of our consolidated financial statements are discussed in Note 2, Basis of Presentation and Summary of Significant Accounting Policies, to our consolidated financial statements included elsewhere in this Annual Report on Form 10-K. We believe that the accounting policies described below involve a greater degree of judgment and complexity. Accordingly, these are the policies we believe are the most critical to aid in fully understanding and evaluating our consolidated financial condition and results of operations.
Revenue Recognition
We generate revenue from the sale of subscriptions to customers using our cloud-based platform. The terms of our subscription agreements are primarily monthly or annual, with the majority of our revenue coming from annual subscriptions. Our customers can enter into a subscription for a committed contractual amount of usage that is apportioned ratably on a monthly basis over the term of the subscription period, a subscription for a committed contractual amount of usage that is delivered as used, or a monthly subscription based on usage. To the extent that our customers’ usage exceeds the committed contracted amounts under their subscriptions, either on a monthly basis in the case of a ratable subscription or once the entire commitment is used in the case of a delivered-as-used subscription, they are charged for their incremental usage.
We account for revenue contracts with customers through the following steps:
(1)identify the contract with a customer;
(2)identify the performance obligations in the contract;
(3)determine the transaction price;
(4)allocate the transaction price to the performance obligations in the contract; and
(5)recognize revenue when or as we satisfy a performance obligation.
Our subscriptions are generally non-cancellable. Once we have determined the transaction price, the total transaction price is allocated to each performance obligation in the contract on a relative stand-alone selling price basis, or SSP. The determination of a relative stand-alone SSP for each distinct performance obligation requires judgment. We determine SSP for performance obligations based on overall pricing objectives, which take into consideration market conditions and customer-specific factors. This includes a review of internal discounting tables, the service(s) being sold, and customer demographics.
Revenue is recognized when control of these services is transferred to customers, in an amount that reflects the consideration we expect to be entitled to receive in exchange for those services. We determine an output method to be the most appropriate measure of progress because it most faithfully represents when the value of the services is simultaneously received and consumed by the customer, and control is transferred.
For committed contractual amounts of usage, revenue is recognized ratably over the term of the subscription agreement generally beginning on the date that the platform is made available to a customer. For committed contractual amount of usage that is delivered as used, a monthly subscription based on usage, or usage in excess of a ratable subscription, we recognize revenue as the services are rendered.
Internal-Use Software Development Costs
We capitalize certain costs related to the development of our platform and other software applications for internal-use. In accordance with authoritative guidance, we begin to capitalize our costs to develop software when preliminary development efforts are successfully completed, management has authorized and committed project funding, and it is probable that the project will be completed and the software will be used as intended. We stop capitalizing these costs when the software is substantially complete and ready for its intended use, including the completion of all significant testing. These costs are amortized on a straight-line basis over the estimated useful life of the related asset, generally estimated to be two years. We also capitalize costs related to specific upgrades and enhancements when it is probable the expenditure will result in additional
functionality and expense costs incurred for maintenance and minor upgrades and enhancements. Costs incurred prior to meeting these criteria together with costs incurred for training and maintenance are expensed as incurred and recorded within research and development expenses in our consolidated statements of operations.
We exercise judgment in determining the point at which various projects may be capitalized, in assessing the ongoing value of the capitalized costs and in determining the estimated useful lives over which the costs are amortized. To the extent that we change the manner in which we develop and test new features and functionalities related to our platform, assess the ongoing value of capitalized assets or determine the estimated useful lives over which the costs are amortized, the amount of internal-use software development costs we capitalize and amortize could change in future periods.
Business Combinations
When we acquire a business, the purchase consideration is allocated to the tangible assets acquired, liabilities assumed, and intangible assets acquired based on their estimated respective fair values. The excess of the fair value of purchase consideration over the fair values of these identifiable assets and liabilities is recorded as goodwill. Such valuations require us to make significant estimates and assumptions, especially with respect to intangible assets. Significant estimates in valuing certain intangible assets include, but are not limited to, future expected cash flows from acquired users, acquired technology, and trade names from a market participant perspective, useful lives and discount rates. Our estimates of fair value are based upon assumptions believed to be reasonable, but which are inherently uncertain and unpredictable and, as a result, actual results may differ from estimates. During the measurement period, we may record adjustments to the assets acquired and liabilities assumed, with the corresponding offset to goodwill. Upon the conclusion of the measurement period, any subsequent adjustments are recorded to other income, net in the consolidated statement of operations.
Recently Adopted Accounting Pronouncements
See Note 2, in our Notes to Consolidated Financial Statements included in “Part II, Item 8. Financial Statements and Supplementary Data” of this Annual Report on Form 10-K for a discussion of recent accounting pronouncements.
Item 7A. Quantitative and Qualitative Disclosures About Market Risk.
We are exposed to market risks in the ordinary course of our business. Market risk represents the risk of loss that may impact our financial position due to adverse changes in financial market prices and rates. Our market risk exposure is primarily the result of fluctuations in interest rates and foreign currency exchange rates.
Interest Rate Risk
As of December 31, 2023, we had $295.4 million in cash equivalents, and $2.3 billion in marketable securities, which consisted of corporate debt securities, commercial paper, certificates of deposit, U.S. government treasury securities, and U.S. government agency securities. Our cash and cash equivalents are held for working capital purposes. We do not enter into investments for trading or speculative purposes. Our investments are exposed to market risk due to a fluctuation in interest rates, which may affect our interest income and the fair market value of our investments. As of December 31, 2023, a hypothetical 10% relative change in interest rates would not have a material impact on our consolidated financial statements.
On June 2, 2020, we issued $747.5 million aggregate principal amount of the 2025 Notes. The fair value of the 2025 Notes is subject to interest rate risk, market risk and other factors due to the conversion feature. The fair value of the 2025 Notes will generally increase as our Class A common stock price increases and will generally decrease as our Class A common stock price declines. The interest and market value changes affect the fair value of the 2025 Notes but do not impact our financial position, cash flows, or results of operations due to the fixed nature of the debt obligation. Additionally, we carry the 2025 Notes at face value less unamortized discount and unamortized issuance costs on our balance sheet, and we present the fair value for required disclosure purposes only.
Foreign Currency Exchange Risk
Our reporting currency and the functional currency of our wholly owned foreign subsidiaries is the U.S. dollar. All of our sales are denominated in U.S. dollars, and therefore our revenue is not currently subject to significant foreign currency risk. Our operating expenses are denominated in the currencies of the countries in which our operations are located, which are primarily in the United States, France, Ireland, and the United Kingdom. Our consolidated results of operations and cash flows are, therefore, subject to fluctuations due to changes in foreign currency exchange rates and may be adversely affected in the future due to changes in foreign exchange rates. To date, we have not entered into any hedging arrangements
with respect to foreign currency risk or other derivative financial instruments, although we may choose to do so in the future. A hypothetical 10% increase or decrease in the relative value of the U.S. dollar to other currencies would not have a material effect on our operating results.
Item 8. Financial Statements and Supplementary Data
DATADOG, INC.
INDEX TO CONSOLIDATED FINANCIAL STATEMENTS
REPORT OF INDEPENDENT REGISTERED PUBLIC ACCOUNTING FIRM
To the Stockholders and the Board of Directors of Datadog, Inc.
Opinion on the Financial Statements
We have audited the accompanying consolidated balance sheets of Datadog, Inc. and its subsidiaries (the “Company”) as of December 31, 2023 and 2022, the related consolidated statements of operations, comprehensive income (loss), stockholders' equity (deficit), and cash flows for each of the three years in the period ended December 31, 2023, and the related notes (collectively referred to as the “financial statements”). In our opinion, the financial statements present fairly, in all material respects, the financial position of the Company as of December 31, 2023 and 2022, and the results of its operations and its cash flows for each of the three years in the period ended December 31, 2023, in conformity with accounting principles generally accepted in the United States of America.
We have also audited, in accordance with the standards of the Public Company Accounting Oversight Board (United States) (“PCAOB”), the Company's internal control over financial reporting as of December 31, 2023, based on criteria established in Internal Control — Integrated Framework (2013) issued by the Committee of Sponsoring Organizations of the Treadway Commission and our report dated February 23, 2024, expressed an unqualified opinion on the Company's internal control over financial reporting.
Basis for Opinion
These financial statements are the responsibility of the Company's management. Our responsibility is to express an opinion on the Company's financial statements based on our audits. We are a public accounting firm registered with the PCAOB and are required to be independent with respect to the Company in accordance with the U.S. federal securities laws and the applicable rules and regulations of the Securities and Exchange Commission and the PCAOB.
We conducted our audits in accordance with the standards of the PCAOB. Those standards require that we plan and perform the audit to obtain reasonable assurance about whether the financial statements are free of material misstatement, whether due to error or fraud. Our audits included performing procedures to assess the risks of material misstatement of the financial statements, whether due to error or fraud, and performing procedures that respond to those risks. Such procedures included examining, on a test basis, evidence regarding the amounts and disclosures in the financial statements. Our audits also included evaluating the accounting principles used and significant estimates made by management, as well as evaluating the overall presentation of the financial statements. We believe that our audits provide a reasonable basis for our opinion.
Critical Audit Matter
The critical audit matter communicated below is a matter arising from the current-period audit of the financial statements that was communicated or required to be communicated to the audit committee and that (1) relates to accounts or disclosures that are material to the financial statements and (2) involved our especially challenging, subjective, or complex judgments. The communication of critical audit matters does not alter in any way our opinion on the financial statements, taken as a whole, and we are not, by communicating the critical audit matter below, providing a separate opinion on the critical audit matter or on the accounts or disclosures to which it relates.
Revenue Recognition — Identification of Performance Obligations – (Refer to Note 2 of the Financial Statements)
Critical Audit Matter Description
As described in Note 2 to the consolidated financial statements, the Company generates revenue from the sale of subscription services contracts to customers using its cloud-based platform. Subscription services contracts with certain of the Company’s customers may include non-standard terms and conditions and promises to transfer multiple services.
Contracts with customers that contain non-standard terms and conditions and promises to transfer multiple services require significant judgment by management to identify the distinct performance obligations in the arrangement. Distinct performance obligations will be accounted for as separate performance obligations, while non-distinct services are combined with others to form a single performance obligation.
Given the complexity of the Company’s subscription services contracts with certain customers, coupled with management’s judgments involved in identifying distinct performance obligations and non-standard terms and conditions, auditing the Company’s subscription services contracts with certain customers required a high degree of auditor judgment.
How the Critical Audit Matter Was Addressed in the Audit
Our audit procedures related to the Company’s subscription contracts with certain customers included, among others:
◦We obtained an understanding, evaluated the design, and tested the operating effectiveness of management’s controls over revenue recognition. This includes management’s controls over the identification of performance obligations and non-standard terms and conditions in subscription contracts, as well as the allocation of revenue to each performance obligation.
◦We evaluated a sample of subscription contracts with customers to determine if all the promises referred to in the contract were properly identified by management and accounted for as distinct performance obligations by performing the following:
-
Obtained and read the subscription contract and independently assessed the terms of the contract to identify all promises and non-standard terms and conditions.
-
For each promise identified, we evaluated whether such promise represented a distinct “performance obligation”, as prescribed by Accounting Standards Codification Topic 606, Revenue from Contracts with Customers.
-
We evaluated the completeness and accuracy of the performance obligations by comparing those identified by us to those identified by management.
/s/ Deloitte & Touche LLP
New York, New York
February 23, 2024
We have served as the Company's auditor since 2016.
DATADOG, INC.
CONSOLIDATED BALANCE SHEETS
(in thousands, except share and per share data)
| | | | |
Showing the first 8K of 134K characters. Open the full section
Item 9. Changes in and Disagreements with Accountants on Accounting and Financial Disclosure
None.
Item 9A. Controls and Procedures
Evaluation of Disclosure Controls and Procedures
We maintain “disclosure controls and procedures,” as defined in Rule 13a-15(e) and Rule 15d-15(e) under the Exchange Act, that are designed to ensure that information required to be disclosed by a company in the reports that it files or submits under the Exchange Act is recorded, processed, summarized and reported, within the time periods specified in the SEC’s rules and forms. Disclosure controls and procedures include, without limitation, controls and procedures designed to ensure that information required to be disclosed by a company in the reports that it files or submits under the Exchange Act is accumulated and communicated to our management, including our principal executive and principal financial officers, as appropriate to allow timely decisions regarding required disclosure.
Our management, with the participation of our Chief Executive Officer and our Chief Financial Officer, evaluated the effectiveness of our disclosure controls and procedures as of December 31, 2023. Based on the evaluation of our disclosure controls and procedures as of December 31, 2023, our Chief Executive Officer and Chief Financial Officer concluded that, as of such date, our disclosure controls and procedures were effective at the reasonable assurance level.
Management's Report on Internal Control over Financial Reporting
Our management is responsible for establishing and maintaining adequate “internal control over financial reporting,” as defined in Rule 13a-15(f) and Rule 15d-15(f) under the Exchange Act. Our management conducted an evaluation of the effectiveness of our internal control over financial reporting as of December 31, 2023 based on the criteria established in Internal Control - Integrated Framework (2013) issued by the Committee of Sponsoring Organizations of the Treadway Commission.
Based on the results of its evaluation, management concluded that our internal control over financial reporting was effective as of December 31, 2023. Our independent registered public accounting firm, Deloitte & Touche LLP, has issued an auditors’ report on the effectiveness of our internal control over financial reporting, which is included in Item 8 of this Annual Report on Form 10-K.
Changes in Internal Control Over Financial Reporting
There was no change in our internal control over financial reporting identified in connection with the evaluation required by Rule 13a-15(d) and Rule 15d15(d) of the Exchange Act that occurred during the fiscal quarter ended December 31, 2023 that has materially affected, or is reasonably likely to materially affect, our internal control over financial reporting.
Inherent Limitations on Effectiveness of Controls
Our management, including our Chief Executive Officer and Chief Financial Officer, believes that our disclosure controls and procedures and internal control over financial reporting are designed to provide reasonable assurance of achieving their objectives and are effective at the reasonable assurance level. However, our management does not expect that our disclosure controls and procedures or our internal control over financial reporting will prevent all errors and all fraud. A control system, no matter how well conceived and operated, can provide only reasonable, not absolute, assurance that the objectives of the control system are met. Further, the design of a control system must reflect the fact that there are resource constraints, and the benefits of controls must be considered relative to their costs. Because of the inherent limitations in all control systems, no evaluation of controls can provide absolute assurance that all control issues and instances of fraud, if any, have been detected. These inherent limitations include the realities that judgments in decision making can be faulty, and that breakdowns can occur because of a simple error or mistake. Additionally, controls can be circumvented by the individual acts of some persons, by collusion of two or more people or by management override of the controls. The design of any system of controls also is based in part upon certain assumptions about the likelihood of future events, and there can be no assurance that any design will succeed in achieving its stated goals under all potential future conditions; over time, controls may become inadequate because of changes in conditions, or the degree of compliance with policies or procedures may deteriorate. Because of the inherent limitations in a cost-effective control system, misstatements due to error or fraud may occur and not be detected.
REPORT OF INDEPENDENT REGISTERED PUBLIC ACCOUNTING FIRM
To the Stockholders and the Board of Directors of Datadog, Inc.
Opinion on Internal Control over Financial Reporting
We have audited the internal control over financial reporting of Datadog, Inc. and its subsidiaries (the “Company”) as of December 31, 2023, based on criteria established in Internal Control — Integrated Framework (2013) issued by the Committee of Sponsoring Organizations of the Treadway Commission (COSO). In our opinion, the Company maintained, in all material respects, effective internal control over financial reporting as of December 31, 2023, based on criteria established in Internal Control — Integrated Framework (2013) issued by COSO.
We have also audited, in accordance with the standards of the Public Company Accounting Oversight Board (United States) (PCAOB), the consolidated financial statements as of and for the year ended December 31, 2023, of the Company and our report dated February 23, 2024, expressed an unqualified opinion on those financial statements.
Basis for Opinion
The Company’s management is responsible for maintaining effective internal control over financial reporting and for its assessment of the effectiveness of internal control over financial reporting, included in the accompanying Management's Report on Internal Control over Financial Reporting. Our responsibility is to express an opinion on the Company’s internal control over financial reporting based on our audit. We are a public accounting firm registered with the PCAOB and are required to be independent with respect to the Company in accordance with the U.S. federal securities laws and the applicable rules and regulations of the Securities and Exchange Commission and the PCAOB.
We conducted our audit in accordance with the standards of the PCAOB. Those standards require that we plan and perform the audit to obtain reasonable assurance about whether effective internal control over financial reporting was maintained in all material respects. Our audit included obtaining an understanding of internal control over financial reporting, assessing the risk that a material weakness exists, testing and evaluating the design and operating effectiveness of internal control based on the assessed risk, and performing such other procedures as we considered necessary in the circumstances. We believe that our audit provides a reasonable basis for our opinion.
Definition and Limitations of Internal Control over Financial Reporting
A company’s internal control over financial reporting is a process designed to provide reasonable assurance regarding the reliability of financial reporting and the preparation of financial statements for external purposes in accordance with generally accepted accounting principles. A company’s internal control over financial reporting includes those policies and procedures that (1) pertain to the maintenance of records that, in reasonable detail, accurately and fairly reflect the transactions and dispositions of the assets of the company; (2) provide reasonable assurance that transactions are recorded as necessary to permit preparation of financial statements in accordance with generally accepted accounting principles, and that receipts and expenditures of the company are being made only in accordance with authorizations of management and directors of the company; and (3) provide reasonable assurance regarding prevention or timely detection of unauthorized acquisition, use, or disposition of the company’s assets that could have a material effect on the financial statements.
Because of its inherent limitations, internal control over financial reporting may not prevent or detect misstatements. Also, projections of any evaluation of effectiveness to future periods are subject to the risk that controls may become inadequate because of changes in conditions, or that the degree of compliance with the policies or procedures may deteriorate.
/s/ Deloitte & Touche LLP
New York, New York
February 23, 2024
Item 9B. Other Information
Trading Arrangements
During the three months ended December 31, 2023, the Company’s directors and officers (as defined in Rule 16a-1(f) under the Exchange Act) adopted written plans intended to satisfy the affirmative defense conditions of Securities Exchange Act Rule 10b5-1(c) for the sale of the Company’s securities as set forth in the table below.
| Name | Position | Adoption Date | Total Shares of Class A Common Stock to be Sold | Expiration Date | ||||||||||||||||||||||
| David Obstler | Chief Financial Officer | December 10, 2023 | 200,000 (1) | March 15, 2025 | ||||||||||||||||||||||
| Armelle de Madre | Chief People Officer | December 12, 2023 | Up to 72,870 (2) | March 31, 2025 | ||||||||||||||||||||||
| Dev Ittycheria | Director | December 12, 2023 | 135,000 | February 28, 2025 | ||||||||||||||||||||||
| Sean Walters | Chief Revenue Officer | December 14, 2023 | Up to 86,510 (2) | February 11, 2025 | ||||||||||||||||||||||
| (1)The amount includes 100,000 shares to be sold under the Rule 10b5-1 trading plan by the Obstler Children 2019 Trust. (2)The actual number of shares that will be sold under the Rule 10b5-1 trading plan will be reduced by the number of shares sold pursuant to the Company’s election under its equity incentive plans to require the satisfaction of tax withholding obligations realized upon the vesting of RSUs and PSUs to be funded by a sell-to-cover transaction. The number of Company shares to be sold to satisfy the Company’s tax withholding obligation is not known at this time as it is dependent on future events, including the future trading price of the Company’s shares. |
Item 9C. Disclosure Regarding Foreign Jurisdictions that Prevent Inspections.
Not applicable.
PART III
Item 10. Directors, Executive Officers and Corporate Governance
The information required by this Item (other than as set forth below) will be included in the proxy statement for our 2024 annual meeting of stockholders to be filed with the SEC within 120 days after the end of our fiscal year ended December 31, 2023, or the 2024 Proxy Statement, and is incorporated herein by reference.
We have adopted a Code of Conduct that applies to all our employees, officers and directors. The Code of Conduct is available on our website at www.investors.datadoghq.com. The nominating and corporate governance committee of our board of directors is responsible for overseeing the Code of Conduct and must approve any waivers of the Code of Conduct for employees, executive officers and directors. We expect that any amendments to the Code of Conduct, or any waivers of its requirements, will be disclosed on our website, as required by applicable law or the listing standards of Nasdaq. Our website is not incorporated by reference into this Annual Report on Form 10-K, and you should not consider information on our website to be part of this Annual Report on Form 10-K.
Item 11. Executive Compensation
The information required by this Item will be included in the 2024 Proxy Statement and is incorporated herein by reference.
Item 12. Security Ownership of Certain Beneficial Owners and Management and Related Stockholder Matters
The information required by this Item will be included in the 2024 Proxy Statement and is incorporated herein by reference.
Item 13. Certain Relationships and Related Transactions, and Director Independence
The information required by this Item will be included in the 2024 Proxy Statement and is incorporated herein by reference.
Item 14. Principal Accounting Fees and Services
The information required by this Item will be included in the 2024 Proxy Statement and is incorporated herein by reference.
PART IV
Item 15. Exhibits, Financial Statement Schedules
(a) Documents filed as part of this report
(1) All financial statements
(2) Financial Statement Schedules
All financial schedules have been omitted because the required information is either presented in the consolidated financial statements filed as part of this Annual Report on Form 10-K or the notes thereto or is not applicable or required.
(3) Exhibits
| 31.2 | Certification of Principal Financial Officer Pursuant to Rules 13a-14(a) and 15d-14(a) under the Securities Exchange Act of 1934, as Adopted Pursuant to Section 302 of the Sarbanes-Oxley Act of 2002. | X | |||||||||||||||||||||
| 32.1* | Certification of Principal Executive Officer Pursuant to 18 U.S.C. Section 1350, as Adopted Pursuant to Section 906 of the Sarbanes-Oxley Act of 2002. | X | |||||||||||||||||||||
| 32.2* | Certification of Principal Financial Officer Pursuant to 18 U.S.C. Section 1350, as Adopted Pursuant to Section 906 of the Sarbanes-Oxley Act of 2002. | X | |||||||||||||||||||||
| 97.1* | Policy Relating to Recovery of Erroneously Awarded Compensation | X | |||||||||||||||||||||
| 101.INS | XBRL Instance Document | X | |||||||||||||||||||||
| 101.SCH | XBRL Taxonomy Extension Schema Document | X | |||||||||||||||||||||
| 101.CAL | XBRL Taxonomy Extension Calculation Linkbase Document | X | |||||||||||||||||||||
| 101.DEF | XBRL Taxonomy Extension Definition Linkbase Document | X | |||||||||||||||||||||
| 101.LAB | XBRL Taxonomy Extension Label Linkbase Document | X | |||||||||||||||||||||
| 101.PRE | XBRL Taxonomy Extension Presentation Linkbase Document | X |
Indicates management contract or compensatory plan.
- This certification is deemed not filed for purposes of Section 18 of the Securities Exchange Act of 1934, as amended, or otherwise subject to the liability of that section, nor shall it be deemed incorporated by reference into any filing under the Securities Act of 1933, as amended, or the Securities Exchange Act of 1934, as amended.
Item 16. Form 10-K Summary
None.
SIGNATURES
Pursuant to the requirements of the Securities Exchange Act of 1934, the registrant has duly caused this report to be signed on its behalf by the undersigned thereunto duly authorized.
| DATADOG, INC. | ||||||||
| Date: February 23, 2024 | By: | /s/ Olivier Pomel | ||||||
| Name: | Olivier Pomel | |||||||
| Title: | Chief Executive Officer and Director |
POWER OF ATTORNEY
KNOW ALL PERSONS BY THESE PRESENTS, that each person whose signature appears below constitutes and appoints Olivier Pomel and Alexis Lê-Quôc, and each one of them, as his or her true and lawful attorneys-in-fact and agents, with full power of substitution and resubstitution, for him or her and in their name, place and stead, in any and all capacities, to sign any and all amendments to this Annual Report on Form 10-K, and to file the same, with all exhibits thereto and other documents in connection therewith, with the Securities and Exchange Commission, granting unto said attorneys-in-fact and agents, and each of them, full power and authority to do and perform each and every act and thing requisite and necessary to be done in connection therewith, as fully to all intents and purposes as he or she might or could do in person, hereby ratifying and confirming all that said attorneys-in-fact and agents or any of them, or his or her substitute or substitutes, may lawfully do or cause to be done by virtue hereof
Pursuant to the requirements of the Securities Exchange Act of 1934, this report has been signed below by the following persons on behalf of the registrant and in the capacities and on the dates indicated.
| Signature | Title | Date | ||||||||||||
| /s/ Olivier Pomel | Chief Executive Officer and Director (Principal Executive Officer) | February 23, 2024 | ||||||||||||
| Olivier Pomel | ||||||||||||||
| /s/ David Obstler | Chief Financial Officer (Principal Financial and Accounting Officer) | February 23, 2024 | ||||||||||||
| David Obstler | ||||||||||||||
| /s/ Alexis Le-Quôc | Chief Technology Officer and Director | February 23, 2024 | ||||||||||||
| Alexis Le-Quôc | ||||||||||||||
| /s/ Michael Callahan | Director | February 23, 2024 | ||||||||||||
| Michael Callahan | ||||||||||||||
| /s/ Matthew Jacobson | Director | February 23, 2024 | ||||||||||||
| Matthew Jacobson | ||||||||||||||
| /s/ Dev Ittycheria | Director | February 23, 2024 | ||||||||||||
| Dev Ittycheria | ||||||||||||||
| /s/ Julie Richardson | Director | February 23, 2024 | ||||||||||||
| Julie Richardson | ||||||||||||||
| /s/ Shardul Shah | Director | February 23, 2024 | ||||||||||||
| Shardul Shah | ||||||||||||||
| /s/ Titi Cole | Director | February 23, 2024 | ||||||||||||
| Titi Cole |