 filings.tools
Item 16. FORM 10-K SUMMARY.
406K characters. Original on sec.gov · Markdown
Item 16. FORM 10-K SUMMARY.
None.
MANAGEMENT’S DISCUSSION AND ANALYSIS
RESULTS OF OPERATIONS FOR THE YEARS ENDED
NOVEMBER 1, 2020, NOVEMBER 3, 2019, AND OCTOBER 28, 2018
OVERVIEW
Organization
The company’s equipment operations generate revenues and cash primarily from the sale of equipment to John Deere dealers and distributors. The equipment operations manufacture and distribute a full line of agricultural equipment; a variety of commercial and consumer equipment; and a broad range of equipment for construction, roadbuilding, and forestry. The company’s financial services primarily provide credit services, which mainly finance sales and leases of equipment by John Deere dealers and trade receivables purchased from the equipment operations. In addition, financial services offers extended equipment warranties. The information in the following discussion is presented in a format that includes information grouped as consolidated, equipment operations, and financial services. The equipment operations represents the enterprise without financial services. The equipment operations includes the company’s agriculture and turf operations, construction and forestry operations, and other corporate assets, liabilities, revenues and expenses not reflected within financial services. The company also views its operations as consisting of two geographic areas, the U.S. and Canada, and outside the U.S. and Canada. The company’s operating segments consist of agriculture and turf, construction and forestry, and financial services.
Trends and Economic Conditions
The company’s agriculture and turf equipment sales decreased 6 percent in 2020. Industry agricultural machinery sales in the U.S. and Canada for 2021 are forecast to increase 5 to 10 percent, compared to 2020. Industry sales in Europe are forecast to be about the same to 5 percent higher, and South American industry sales of tractors and combines are forecast to be about 5 percent higher in 2021. Asian sales are also forecast to be slightly lower. Industry sales of turf and utility equipment in the U.S. and Canada are expected to be about the same to 5 percent higher. The company’s construction and forestry sales decreased 20 percent in 2020. On an industry basis, North American construction equipment sales are expected to be down about 5 percent with sales of compact equipment up about 5 percent. Global forestry industry sales are expected to be about the same to about 5 percent higher than 2020 sales.
Items of concern include uncertainty of the effectiveness of governmental and private sector actions to address COVID, trade agreements, the uncertainty of the results of monetary and fiscal policies, the impact of elevated levels of sovereign and state debt, capital market disruptions, changes in demand and pricing for new and used equipment, and geopolitical events. Significant fluctuations in foreign currency exchange rates and volatility in the price of many commodities could also impact the company’s results. The future financial effects of COVID are unknown due to many factors. As a result, predicting the company’s forecasted financial performance is difficult and subject to many assumptions.
In the face of the ongoing challenges associated with managing the global pandemic, the company was able to complete a successful year and is positioned to continue providing differentiated solutions for customers. The company expects to benefit from improving conditions in the farm economy and stabilization in construction and forestry markets. In addition, the manufacturing location and product reviews that started in 2020 as part of the company’s transition to an updated strategy will continue in 2021.
COVID Effects and Actions
During 2020, the effects of COVID and the related actions of governments and other authorities to contain COVID, have affected the company’s operations, results, cash flows, and forecasts.
The U.S. government and many other governments in countries where the company operates have designated the company an essential critical infrastructure business. This designation allows the company to operate in support of its customers to the extent possible.
The company’s first priority in addressing the effects of COVID continues to be the health, safety, and overall welfare of its employees. The company effectively activated previously established business continuity plans and proactively implemented health and safety measures at its operations around the world.
The economic effects of COVID have reduced customer demand for some of the company’s products and services, particularly construction and forestry equipment (see Note 6), which resulted in lower shipment volumes. During most of 2020, all of the company’s factories have operated, some at reduced capacity due to component shortages or lower demand. During the year, the company broadened the supply base and increased the inventory level of certain essential materials and components to address potential supplier issues. The measures taken beginning in the second quarter to aggressively decrease operational and selling, administrative and general expenses have been effective. Additional information is presented in “Business Segment and Geographic Area Results.”
In addition, the company’s actions taken in the second quarter to increase borrowings, along with significant cash generated from operations, provided a strong financial position (see Note 20 for additional information on long-term borrowings). Cash and cash equivalents were $7,066 million at November 1, 2020 and the company’s revolving credit facilities were undrawn. The company’s share repurchase programs were suspended in the second quarter and all of the third quarter. These programs were reinstated in the fourth quarter with $487 million of shares repurchased. Additional information is presented in “Capital Resources and Liquidity.”
The company continued to work closely with distribution channel and equipment user customers during 2020, and, as necessary, provided short-term payment relief on obligations owed to the company. The payment relief provided on balances of trade receivables, financing receivables, and operating lease payments outstanding at November 1, 2020 was about 2 percent, 4 percent,
and 4 percent of the portfolio balances, respectively. Additional information is presented in Notes 13 and 25.
2020 COMPARED WITH 2019
CONSOLIDATED RESULTS
The following table provides the net income attributable to Deere & Company in millions of dollars as well as diluted and basic earnings per share in dollars:
| | | | | | | | |
|---|---|---|---|---|---|---|---|
| | | 2020 | | 2019 | | ||
| Net income attributable to Deere & Company | | $ | 2,751 | | $ | 3,253 | |
| Diluted earnings per share | | | 8.69 | | | 10.15 | |
| Basic earnings per share | | | 8.77 | | | 10.28 | |
Net income in 2020 was negatively affected by impairment charges and employee-separation costs of $458 million after-tax (see Notes 4 and 5). Annual savings from the separation programs are estimated to be approximately $250 million, of which $85 million was realized in 2020. In 2019, the similar charges were $82 million. In addition, the provision for income taxes was adversely affected by non-deductible impairments and charges in 2020 and less favorably affected by discrete adjustments in 2020 than in 2019.
The worldwide net sales and revenues, price realization, and the effect of currency translation for worldwide, U.S. and Canada, and outside U.S. and Canada in millions of dollars follows:
| | | | | | | | | | |
|---|---|---|---|---|---|---|---|---|---|
| | | 2020 | | 2019 | | % Change | | ||
| Worldwide net sales and revenues | | $ | 35,540 | | $ | 39,258 | | -9 | |
| Worldwide equipment operations net sales | | | 31,272 | | | 34,886 | | -10 | |
| Price realization | | | | | | | | +3 | |
| Currency translation (unfavorable) | | | | | | | | -2 | |
| | | | | | | | | | |
| U.S. and Canada equipment operations net sales | | | 17,954 | | | 20,264 | | -11 | |
| Price realization | | | | | | | | +3 | |
| | | | | | | | | | |
| Outside U.S. and Canada equipment operations net sales | | | 13,318 | | | 14,622 | | -9 | |
| Price realization | | | | | | | | +4 | |
| Currency translation (unfavorable) | | | | | | | | -4 | |
The company’s equipment operations operating profit and net income and financial services operations net income follow in millions of dollars:
| | | | | | | | | | |
|---|---|---|---|---|---|---|---|---|---|
| | | 2020 | | 2019 | | % Change | | ||
| Equipment operations operating profit | | $ | 3,559 | | $ | 3,721 | | -4 | |
| Equipment operations net income* | | | 2,185 | | | 2,714 | | -19 | |
| Financial services net income | | | 566 | | | 539 | | +5 | |
*Includes equity income (loss) from unconsolidated affiliates.
The discussion on net sales and operating profit is included in the Business Segment and Geographic Area Results below. The equipment operations’ provision for income taxes and net income were adversely affected by non-deductible impairments and charges in 2020 and was less favorably affected by discrete adjustments to the provision for income taxes in 2020 than in 2019.
Financial services segment net income increased compared to 2019 mainly due to lower impairments and reduced losses on operating lease residual values and income earned on a higher average portfolio, partially offset by a higher provision for credit losses, employee-separation expenses, and unfavorable financing spreads. Additional information is presented in the following discussion of the “Worldwide Financial Services Operations.”
The cost of sales to net sales ratio and other significant statement of consolidated income changes not previously discussed in millions of dollars follow:
| | | | | | | | | | |
|---|---|---|---|---|---|---|---|---|---|
| | | 2020 | | 2019 | | % Change | | ||
| Cost of sales to net sales | | | 75.7% | | | 76.8% | | | |
| | | | | | | | | | |
| Finance and interest income | | $ | 3,450 | | $ | 3,493 | | -1 | |
| Other income | | | 818 | | | 879 | | -7 | |
| Research and development expenses | | | 1,644 | | | 1,783 | | -8 | |
| Selling, administrative and general expenses | | | 3,477 | | | 3,551 | | -2 | |
| Interest expense | | | 1,247 | | | 1,466 | | -15 | |
| Other operating expenses | | | 1,612 | | | 1,578 | | +2 | |
The cost of sales to net sales ratio decreased compared to 2019 mainly due to price realization, improved production costs, and lower warranty expenses, partially offset by impairments, employee-separation expenses (see Note 5), and the unfavorable effects of foreign currency exchange. Finance and interest income decreased slightly in 2020 due to lower average interest rates, largely offset by a higher average credit portfolio. Other income declined primarily due to lower service income compared to 2019. Research and development expenses decreased compared to 2019 as a result of targeted project reductions related to COVID spending adjustments. Selling, administrative and general expenses decreased primarily due to spending reductions and the favorable effects of currency translation, mostly offset by employee-separation expenses (see Note 5) and an increase in the provision for credit losses. Interest expense decreased in 2020 due to lower average borrowing rates, partially offset by higher average borrowings. Other operating expenses increased compared to 2019 largely due to increased depreciation of equipment on operating leases, employee-separation expenses (see Note 5), and a loss on sale of a business (see Note 4). These items were mostly offset by lower impairments and reduced losses on operating lease residual values and reduced service related expenses.
The company has several funded and unfunded defined benefit pension plans and other postretirement benefit (OPEB) plans, primarily health care and life insurance plans. The company’s costs for these plans in 2020 were $341 million, compared with $235 million in 2019. The long-term expected return on plan assets, which is reflected in these costs, was an expected gain of 6.4 percent in 2020 and 6.5 percent in 2019, or $869 million and $838 million, respectively. The actual return was a gain of $1,177 million in 2020 and $2,163 million in 2019. In 2021, the expected return will be approximately 5.9 percent. The company’s costs under these plans in 2021 are expected to decrease approximately $150 million.
The company makes any required contributions to the plan assets under applicable regulations and voluntary contributions after evaluating the company’s liquidity position and ability to make tax-deductible contributions. Total company contributions to the plans were $951 million in 2020 and $518 million in 2019, which included voluntary contributions and direct benefit payments. The voluntary contributions to plan assets were $700 million in 2020 to a U.S. OPEB plan, and $306 million in 2019, which included $300 million to the same U.S. OPEB plan. Total company contributions in 2021 are expected to be approximately $950 million. The anticipated contributions include a voluntary U.S. OPEB plan contribution of $700 million. The remaining contributions primarily include direct benefit payments from company funds. The company has no significant required contributions to U.S. pension plan assets in 2021 under applicable funding regulations. See the discussion in “Critical Accounting Policies” for more information about pension and OPEB benefit obligations.
BUSINESS SEGMENT AND GEOGRAPHIC AREA RESULTS
The following discussion relates to operating results by reportable segment and geographic area. Operating profit is income before corporate expenses, certain external interest expense, certain foreign exchange gains or losses, and income taxes. However, the financial services segment operating profit includes the effect of interest expense and foreign currency exchange gains or losses.
Worldwide Agriculture and Turf Operations
The agriculture and turf segment results in millions of dollars follow:
| | | | | | | | | | |
|---|---|---|---|---|---|---|---|---|---|
| | | 2020 | | 2019 | | % Change | | ||
| Net sales | | $ | 22,325 | | $ | 23,666 | | -6 | |
| Operating profit | | | 2,969 | | | 2,506 | | +18 | |
| Operating margin | | | 13.3% | | | 10.6% | | | |
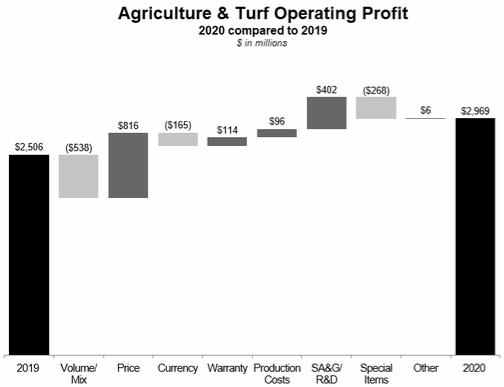
Segment sales decreased due to lower shipment volumes and the unfavorable effects of currency translation, partially offset by price realization. Operating profit increased largely due to price realization, reduced selling, administrative and general expenses, lower research and development expenses, lower warranty expenses, and improved production costs. These items were partially offset by lower sales volumes / mix, employee-separation expenses, impairments, and the unfavorable effects of currency exchange.
Worldwide Construction and Forestry Operations
The construction and forestry segment results in millions of dollars follow:
| | | | | | | | | | |
|---|---|---|---|---|---|---|---|---|---|
| | | 2020 | | 2019 | | % Change | | ||
| Net sales | | $ | 8,947 | | $ | 11,220 | | -20 | |
| Operating profit | | | 590 | | | 1,215 | | -51 | |
| Operating margin | | | 6.6% | | | 10.8% | | | |
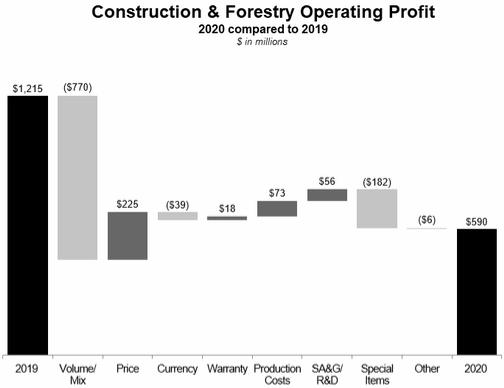
Segment sales decreased in 2020 primarily due to lower shipment volumes and the unfavorable effect of currency translation, partially offset by price realization. Operating profit declined mainly due to lower sales volume / mix, employee-separation expenses, impairments, and the unfavorable effects of currency exchange. The operating profit decrease was partially offset by price realization, lower research and development expenses, reduced selling, administrative and general expenses, and improved production costs.
Worldwide Financial Services Operations
The financial services segment revenue, interest expense, and operating profit in millions of dollars follow:
| | | | | | | | | | |
|---|---|---|---|---|---|---|---|---|---|
| | | 2020 | | 2019 | | % Change | | ||
| Revenue (including intercompany revenue) | | $ | 3,867 | | $ | 3,969 | | -3 | |
| Interest expense | | | 942 | | | 1,234 | | -24 | |
| Operating profit | | | 746 | | | 694 | | +7 | |
Operating profit in 2020 increased mainly due to lower impairments and reduced losses on operating lease residual values and income earned on a higher average portfolio, partially offset by a higher provision for credit losses, employee-separation expenses, and unfavorable financing spreads. The average balance of receivables and leases financed was 2 percent higher in 2020, compared with 2019. Interest expense decreased in 2020 as a result of lower average borrowing rates, partially offset by higher average borrowings.
Equipment Operations in U.S. and Canada
The equipment operations in the U.S. and Canada results in millions of dollars follow:
| | | | | | | | | | |
|---|---|---|---|---|---|---|---|---|---|
| | | 2020 | | 2019 | | % Change | | ||
| Net sales | | $ | 17,954 | | $ | 20,264 | | -11 | |
| Operating profit | | | 2,194 | | | 2,335 | | -6 | |
| Operating margin | | | 12.2% | | | 11.5% | | | |
The operating profit decrease was due primarily to lower sales volume / mix and employee-separation expenses, partially offset by price realization, lower research and development costs, reduced selling, general and administrative expenses, improved production costs, and lower warranty expenses. Net sales decreased in 2020 due primarily to lower sales volumes, partially offset by price realization. The physical volume of sales decreased 14 percent compared with 2019.
Equipment Operations outside U.S. and Canada
The equipment operations outside the U.S. and Canada results in millions of dollars follow:
| | | | | | | | | | |
|---|---|---|---|---|---|---|---|---|---|
| | | 2020 | | 2019 | | % Change | | ||
| Net sales | | $ | 13,318 | | $ | 14,622 | | -9 | |
| Operating profit | | | 1,365 | | | 1,386 | | -2 | |
| Operating margin | | | 10.2% | | | 9.5% | | | |
Operating profit decreased primarily due to lower sales volume / mix, impairments, employee-separation expenses, and the unfavorable effects of currency exchange, largely offset by price realization, reduced selling, general and administrative expenses, lower research and development costs, improved production costs, and lower warranty expenses. The net sales decrease in 2020 compared to 2019 was primarily the result of lower sales volume and the unfavorable effects of currency translation, partially offset by price realization. The physical volume of sales decreased 9 percent compared with 2019.
MARKET CONDITIONS
Agriculture and Turf. Industry sales of agricultural equipment in the U.S. and Canada are forecast to increase 5 to 10 percent driven by gains in larger models. Full year industry sales in Europe are forecast to be about the same as 2020 to 5 percent higher. In South America, industry sales of tractors and combines are forecast to be about 5 percent higher while Asian sales are expected to be slightly lower than 2020. Industry sales of turf and utility equipment in the U.S. and Canada are expected to be about the same to 5 percent higher for 2021.
Construction and Forestry. Full year 2021 North American construction equipment industry sales are expected to be down about 5 percent with sales of compact equipment up about 5 percent. Global forestry industry sales are forecast to be about the same to 5 percent higher in 2021.
Financial Services. Results for the full year 2021 are expected to benefit from favorable financing spreads, lower losses on operating lease residual values, and income earned on a higher average portfolio, partially offset by a higher provision for credit losses.
SAFE HARBOR STATEMENT
Safe Harbor Statement under the Private Securities Litigation Reform Act of 1995: Statements under “Overview,” “Market Conditions,” and other forward-looking statements herein that relate to future events, expectations, and trends involve factors that are subject to change, and risks and uncertainties that could cause actual results to differ materially. Some of these risks and uncertainties could affect particular lines of business, while others could affect all of the company’s businesses.
The company’s agricultural equipment business is subject to a number of uncertainties including the factors that affect farmers’ confidence and financial condition. These factors include demand for agricultural products, world grain stocks, weather conditions, soil conditions, harvest yields, prices for commodities and livestock, crop and livestock production expenses, availability of transport for crops, trade restrictions and tariffs (e.g., China), global trade agreements, the level of farm product exports (including concerns about genetically modified organisms), the growth and sustainability of non-food uses for some crops (including ethanol and biodiesel production), real estate values, available acreage for farming, the land ownership policies of governments, changes in government farm programs and policies, international reaction to such programs, changes in and effects of crop insurance programs, changes in environmental regulations and their impact on farming practices, animal diseases (e.g., African swine fever) and their effects on poultry, beef and pork consumption and prices and on livestock feed demand, and crop pests and diseases and the impact of the COVID pandemic on the agricultural industry including demand for, and production and exports of, agricultural products, and commodity prices.
Factors affecting the outlook for the company’s turf and utility equipment include consumer confidence, weather conditions, customer profitability, labor supply, consumer borrowing patterns, consumer purchasing preferences, housing starts and supply, infrastructure investment, spending by municipalities and golf courses, and consumable input costs. Many of these factors have been and may continue to be impacted by global economic effects, including the downturn resulting from the COVID pandemic and responses to the pandemic taken by governments and other authorities.
Consumer spending patterns, real estate and housing prices, the number of housing starts, interest rates, commodity prices such as oil and gas, the levels of public and non-residential construction, and investment in infrastructure are important to sales and results of the company’s construction and forestry equipment. Prices for pulp, paper, lumber and structural panels are important to sales of forestry equipment. Many of these factors affecting the outlook for the company’s construction and forestry equipment have been and may continue to be impacted by global economic effects, including the downturn resulting from the COVID pandemic and responses to the pandemic taken by governments and other authorities.
All of the company’s businesses and its results are affected by general economic conditions in the global markets and industries in which the company operates; customer confidence in general economic conditions; government spending and taxing; foreign currency exchange rates and their volatility, especially fluctuations in the value of the U.S. dollar; interest rates (including the availability of IBOR reference rates); inflation and deflation rates; changes in weather patterns; the political and social stability of the global markets in which the company operates; the effects of, or response to, terrorism and security threats; wars and other conflicts; natural disasters; and the spread of major epidemics (including the COVID pandemic) and government and industry responses to epidemics such as travel restrictions and extended shut down of businesses.
Uncertainties related to the magnitude and duration of the COVID pandemic may significantly adversely affect the company’s business and outlook. These uncertainties include: the duration and impact of the resurgence in COVID cases in any country, state, or region; prolonged reduction or closure of the company’s operations, or a delayed recovery in our operations; additional closures as mandated or otherwise made necessary by governmental authorities; disruptions in the supply chain and a prolonged delay in resumption of operations by one or more key suppliers, or the failure of any key suppliers; the company’s ability to meet commitments to customers on a timely basis as a result of increased costs and supply challenges; the ability to receive goods on a timely basis and at anticipated costs; increased logistics costs; delays in the company’s strategic initiatives as a result of reduced spending on research and development; additional operating costs due to remote working arrangements, adherence to social distancing guidelines and other COVID-related challenges; increased risk of cyber attacks on network connections used in remote working arrangements; increased privacy-related risks due to processing health-related personal information; legal claims related to personal protective equipment designed, made, or provided by the company or alleged exposure to COVID on company premises; absence of employees due to illness; the impact of the pandemic on the company’s customers and dealers, and their delays in their plans to invest in new equipment; requests by the company’s customers or dealers for payment deferrals and contract modifications; the impact of disruptions in the global capital markets and/or continued declines in the company’s financial performance, outlook or credit ratings, which could impact the company’s ability to obtain funding in the future; and the impact of the pandemic on demand for our products and services as discussed above. It is unclear when a sustained economic recovery could occur and what a recovery may look like. All of these factors could materially and adversely affect our business, liquidity, results of operations and financial position.
Significant changes in market liquidity conditions, changes in the company’s credit ratings and any failure to comply with financial covenants in credit agreements could impact access to funding and funding costs, which could reduce the company’s earnings and cash flows. Financial market conditions could also negatively
impact customer access to capital for purchases of the company’s products and customer confidence and purchase decisions, borrowing and repayment practices, and the number and size of customer loan delinquencies and defaults. A debt crisis, in Europe or elsewhere, could negatively impact currencies, global financial markets, social and political stability, funding sources and costs, asset and obligation values, customers, suppliers, demand for equipment, and company operations and results. The company’s investment management activities could be impaired by changes in the equity, bond and other financial markets, which would negatively affect earnings.
The withdrawal of the United Kingdom from the European Union and the perceptions as to the impact of the withdrawal may adversely affect business activity, political stability and economic conditions in the United Kingdom, the European Union and elsewhere. The economic conditions and outlook could be further adversely affected by (i) uncertainty regarding any new or modified trade arrangements between the United Kingdom and the European Union and/or other countries, (ii) the risk that one or more other European Union countries could come under increasing pressure to leave the European Union, or (iii) the risk that the euro as the single currency of the Eurozone could cease to exist. Any of these developments, or the perception that any of these developments are likely to occur, could affect economic growth or business activity in the United Kingdom or the European Union, and could result in the relocation of businesses, cause business interruptions, lead to economic recession or depression, and impact the stability of the financial markets, availability of credit, currency exchange rates, interest rates, financial institutions, and political, financial and monetary systems. Any of these developments could affect our businesses, liquidity, results of operations and financial position.
Additional factors that could materially affect the company’s operations, access to capital, expenses and results include changes in, uncertainty surrounding and the impact of governmental trade, banking, monetary and fiscal policies, including financial regulatory reform and its effects on the consumer finance industry, derivatives, funding costs and other areas; governmental programs, policies, and tariffs for the benefit of certain industries or sectors; sanctions in particular jurisdictions; retaliatory actions to such changes in trade, banking, monetary and fiscal policies; actions by central banks; actions by financial and securities regulators; actions by environmental, health and safety regulatory agencies, including those related to engine emissions, carbon and other greenhouse gas emissions, noise and the effects of climate change; changes to GPS radio frequency bands or their permitted uses; changes in labor and immigration regulations; changes to accounting standards; changes in tax rates, estimates, laws and regulations and company actions related thereto; changes to and compliance with privacy regulations; changes to and compliance with economic sanctions and export controls laws and regulations; compliance with U.S. and foreign laws when expanding to new markets and otherwise; and actions by other regulatory bodies.
Other factors that could materially affect results include production, design and technological innovations and difficulties, including capacity and supply constraints and prices; the loss of or challenges to intellectual property rights whether through theft, infringement, counterfeiting or otherwise; the availability and prices of strategically sourced materials, components and whole goods; delays or disruptions in the company’s supply chain or the loss of liquidity by suppliers; disruptions of infrastructures that support communications, operations or distribution; the failure of customers, dealers, suppliers or the company to comply with laws, regulations and company policy pertaining to employment, human rights, health, safety, the environment, sanctions, export controls, anti-corruption, privacy and data protection and other ethical business practices; events that damage the company’s reputation or brand; significant investigations, claims, lawsuits or other legal proceedings; start-up of new plants and products; the success of new product initiatives; changes in customer product preferences and sales mix; gaps or limitations in rural broadband coverage, capacity and speed needed to support technology solutions; oil and energy prices, supplies and volatility; the availability and cost of freight; actions of competitors in the various industries in which the company competes, particularly price discounting; dealer practices especially as to levels of new and used field inventories; changes in demand and pricing for used equipment and resulting impacts on lease residual values; labor relations and contracts; changes in the ability to attract, train and retain qualified personnel; acquisitions and divestitures of businesses; greater than anticipated transaction costs; the integration of new businesses; the failure or delay in closing or realizing anticipated benefits of acquisitions, joint ventures or divestitures; the implementation of organizational changes; the failure to realize anticipated savings or benefits of cost reduction, productivity, or efficiency efforts; difficulties related to the conversion and implementation of enterprise resource planning systems; security breaches, cybersecurity attacks, technology failures and other disruptions to the company’s and suppliers’ information technology infrastructure; changes in company declared dividends and common stock issuances and repurchases; changes in the level and funding of employee retirement benefits; changes in market values of investment assets, compensation, retirement, discount and mortality rates which impact retirement benefit costs; and significant changes in health care costs.
The liquidity and ongoing profitability of John Deere Capital Corporation and other credit subsidiaries depend largely on timely access to capital in order to meet future cash flow requirements, and to fund operations, costs, and purchases of the company’s products. If general economic conditions deteriorate or capital markets become more volatile, including as a result of the COVID pandemic, funding could be unavailable or insufficient. Additionally, customer confidence levels may result in declines in credit applications and increases in delinquencies
and default rates, which could materially impact write-offs and provisions for credit losses.
The company’s forward-looking statements are based upon assumptions relating to the factors described above, which are sometimes based upon estimates and data prepared by government agencies. Such estimates and data are often revised. The company, except as required by law, undertakes no obligation to update or revise its forward-looking statements, whether as a result of new developments or otherwise. Further information concerning the company and its businesses, including factors that could materially affect the company’s financial results, is included in the company’s other filings with the SEC (including, but not limited to, the factors discussed in Item 1A. Risk Factors of this annual report on Form 10-K and subsequent quarterly reports on Form 10-Q).
2019 COMPARED WITH 2018
The comparison of the 2019 results with 2018 can be found under the heading “2019 Compared With 2018” in the “Management’s Discussion and Analysis” section of the company’s 2019 Form 10-K, which comparison is incorporated by reference herein.
CAPITAL RESOURCES AND LIQUIDITY
The discussion of capital resources and liquidity has been organized to review separately, where appropriate, the company’s consolidated totals, equipment operations, and financial services operations.
CONSOLIDATED
Positive cash flows from consolidated operating activities in 2020 were $7,483 million. This resulted primarily from net income adjusted for non-cash provisions, a decrease in receivables related to sales, and a decrease in inventories, which were partially offset by a change in net retirement benefits (see Note 8). Cash outflows from investing activities were $3,319 million in 2020, due primarily to the cost of receivables (excluding receivables related to sales) and cost of equipment on operating leases acquired exceeding the collections of receivables and the proceeds from sales of equipment on operating leases by $2,637 million, purchases of property and equipment of $820 million, acquisition of businesses, net of cash acquired, of $66 million (see Note 4), and purchases of marketable securities exceeding proceeds from maturities and sales by $37 million, partially offset by a change in collateral on derivatives – net of $268 million. Cash outflows from financing activities were $980 million in 2020, due primarily to dividends paid of $956 million and repurchases of common stock of $750 million, partially offset by an increase in borrowings of $528 million and proceeds from the issuance of common stock (resulting from the exercise of stock options) of $331 million. Cash, cash equivalents, and restricted cash increased $3,216 million during 2020. The increase in cash was primarily to provide added liquidity due to the financial uncertainty created by COVID.
Over the last three years, operating activities have provided an aggregate of $12,717 million in cash. Cash inflows were also provided by increases in borrowings of $5,687 million, proceeds from issuance of common stock (resulting from the exercise of stock options) of $726 million, a change in collateral on derivatives
– net of $268 million, and proceeds from sales of businesses and unconsolidated affiliates of $249 million. The aggregate amount of these cash inflows was used mainly to acquire receivables (excluding receivables related to sales) and equipment on operating leases that exceeded collections of receivables and the proceeds from sales of equipment on operating leases by $7,480 million, acquire businesses of $5,311 million, repurchase common stock of $2,961 million, purchase property and equipment of $2,836 million, and pay dividends of $2,705 million. Cash, cash equivalents, and restricted cash decreased $2,295 million over the three-year period.
The company has access to most global capital markets at reasonable costs and expects to have sufficient sources of global funding and liquidity to meet its funding needs. Sources of liquidity for the company include cash and cash equivalents, marketable securities, funds from operations, the issuance of commercial paper and term debt, the securitization of retail notes (both public and private markets), and committed and uncommitted bank lines of credit. The company’s commercial paper outstanding at November 1, 2020 and November 3, 2019 was $1,238 million and $2,698 million, respectively, while the total cash and cash equivalents and marketable securities position was $7,707 million and $4,438 million, respectively. The amount of the total cash and cash equivalents and marketable securities held by foreign subsidiaries was $5,010 million and $2,731 million at November 1, 2020 and November 3, 2019, respectively.
Lines of Credit. The company also has access to bank lines of credit with various banks throughout the world. Worldwide lines of credit totaled $8,413 million at November 1, 2020, $6,801 million of which were unused. For the purpose of computing the unused credit lines, commercial paper, and short-term bank borrowings, excluding secured borrowings and the current portion of long-term borrowings, were primarily considered to constitute utilization. Included in the total credit lines at November 1, 2020 was a 364-day credit facility agreement of $3,000 million, expiring in fiscal April 2021. In addition, total credit lines included long-term credit facility agreements of $2,500 million, expiring in fiscal April 2024, and $2,500 million, expiring in fiscal April 2025. The agreements are mutually extendable and the annual facility fees are not significant. These credit agreements require John Deere Capital Corporation (Capital Corporation) to maintain its consolidated ratio of earnings to fixed charges at not less than 1.05 to 1 for each fiscal quarter and the ratio of senior debt, excluding securitization indebtedness, to capital base (total subordinated debt and stockholder’s equity excluding accumulated other comprehensive income (loss)) at not more than 11 to 1 at the end of any fiscal quarter. The credit agreements also require the equipment operations to maintain a ratio of total debt to total capital (total debt and stockholders’ equity excluding accumulated other comprehensive income (loss)) of 65 percent or less at the end of each fiscal quarter. Under this provision, the company’s excess equity capacity and retained earnings balance free of restriction at November 1, 2020 was $12,892 million. Alternatively under this provision, the equipment operations had the capacity to incur additional debt of $23,942 million at November 1, 2020. All of these
credit agreement requirements have been met during the periods included in the consolidated financial statements.
Debt Ratings. To access public debt capital markets, the company relies on credit rating agencies to assign short-term and long-term credit ratings to the company’s securities as an indicator of credit quality for fixed income investors. A security rating is not a recommendation by the rating agency to buy, sell, or hold company securities. A credit rating agency may change or withdraw company ratings based on its assessment of the company’s current and future ability to meet interest and principal repayment obligations. Each agency’s rating should be evaluated independently of any other rating. Lower credit ratings generally result in higher borrowing costs, including costs of derivative transactions, and reduced access to debt capital markets.
The senior long-term and short-term debt ratings and outlook currently assigned to unsecured company securities by the rating agencies engaged by the company are as follows:
| | | | | | | |
|---|---|---|---|---|---|---|
| | Senior | | ||||
| | | Long-Term | | Short-Term | | Outlook |
| | | | | | | |
| | | | | | | |
| Fitch Ratings | | A | | F1 | | Stable |
| Moody’s Investors Service, Inc. | A2 | Prime-1 | Stable | |||
| Standard & Poor’s | A | A-1 | Stable |
Trade accounts and notes receivable primarily arise from sales of goods to independent dealers. Trade receivables decreased by $1,059 million in 2020 due primarily to lower shipment volumes. The ratio of trade accounts and notes receivable at November 1, 2020 and November 3, 2019 to fiscal year net sales was 13 percent in 2020 and 15 percent in 2019. Total worldwide agriculture and turf receivables decreased $343 million and construction and forestry receivables decreased $716 million. The collection period for trade receivables averages less than 12 months. The percentage of trade receivables outstanding for a period exceeding 12 months was 3 percent at both November 1, 2020 and November 3, 2019.
Deere & Company’s stockholders’ equity was $12,937 million at November 1, 2020, compared with $11,413 million at November 3, 2019. The increase of $1,524 million resulted from net income attributable to Deere & Company of $2,751 million, an increase in common stock of $253 million, and a change in the cumulative translation adjustment of $55 million, which was partially offset by dividends declared of $955 million and an increase in treasury stock of $591 million.
EQUIPMENT OPERATIONS
The company’s equipment businesses are capital intensive and are subject to seasonal variations in financing requirements for inventories and certain receivables from dealers. The equipment operations sell a significant portion of their trade receivables to financial services. To the extent necessary, funds provided from operations are supplemented by external financing sources.
Cash provided by operating activities of the equipment operations during 2020, including intercompany cash flows, was $4,760 million due primarily to net income adjusted for non-cash provisions, a decrease in inventories, and a decrease in trade, notes
and financing receivables related to sales, partially offset by a change in net retirement benefits (see Note 8) and a decrease in accounts payable and accrued expenses.
Over the last three years, these operating activities, including intercompany cash flows, have provided an aggregate of $11,241 million in cash.
Trade receivables held by the equipment operations decreased by $469 million during 2020. The equipment operations sell a significant portion of their trade receivables to financial services (see previous consolidated discussion).
Inventories decreased by $976 million in 2020 due primarily to a planned reduction based on the uncertainty related to COVID and other macroeconomic issues. A majority of these inventories are valued on the last-in, first-out (LIFO) method. The ratios of inventories on a first-in, first-out (FIFO) basis (see Note 15), which approximates current cost, to fiscal year cost of sales were 28 percent and 29 percent at November 1, 2020 and November 3, 2019, respectively.
Total interest-bearing debt, excluding finance lease liabilities, of the equipment operations was $10,382 million at the end of 2020, compared with $6,446 million at the end of 2019 and $6,223 million at the end of 2018. The ratio of total debt to total capital (total interest-bearing debt and Deere & Company’s stockholders’ equity) at the end of 2020, 2019, and 2018 was 45 percent, 36 percent, and 36 percent, respectively.
In 2020, the equipment operations issued three tranches of notes in the U.S. with aggregate principal totaling $2,250 million that are due from 2025 to 2050. The equipment operations also issued Euro notes with aggregate principal totaling €2,000 million (approximately $2,170 million based on the exchange rate at the issue date) that are due from 2024 to 2032 (see Note 20). In 2020, the equipment operations issued commercial paper in the U.S. with aggregate principal totaling $466 million, of which $448 million had an original term greater than 90 days. This commercial paper was repaid in 2020 and is presented in “Increase (decrease) in total short-term borrowings” in the statement of consolidated cash flows.
Property and equipment cash expenditures for the equipment operations in 2020 were $816 million, compared with $1,118 million in 2019. Capital expenditures in 2021 are estimated to be $900 million.
FINANCIAL SERVICES
The financial services operations rely on their ability to raise substantial amounts of funds to finance their receivable and lease portfolios. Their primary sources of funds for this purpose are a combination of commercial paper, term debt, securitization of retail notes, equity capital, and borrowings from Deere & Company.
The cash provided by operating activities was used for investing and financing activities. Cash flows from the financial services’ operating activities, including intercompany cash flows, were $1,976 million in 2020. Cash used by investing activities totaled $1,216 million in 2020 due primarily to the cost of receivables (excluding trade and wholesale) and cost of equipment on operating leases acquired exceeding collections of these
receivables and the proceeds from sales of equipment on operating leases by $3,414 million, and purchases of marketable securities exceeding proceeds from maturities and sales by $33 million. Partially offsetting the use of cash was a decrease in trade receivables and wholesale notes of $1,999 million and a change in collateral on derivatives – net of $274 million. Cash used for financing activities totaled $460 million in 2020, resulting primarily from a decrease in external borrowings of $3,274 million and dividends paid to Deere & Company of $386 million, partially offset by an increase in borrowings from Deere & Company of $3,207 million. Cash, cash equivalents, and restricted cash increased $256 million.
Over the last three years, the operating activities, including intercompany cash flows, have provided $6,036 million in cash. In addition, an increase in total borrowings of $5,916 million and a change in collateral on derivatives – net of $274 million provided cash inflows. These amounts have been used mainly to fund receivables (excluding trade and wholesale) and equipment on operating lease acquisitions, which exceeded collections and the proceeds from sales of equipment on operating leases, by $10,615 million, pay dividends to Deere & Company of $1,277 million, purchase $161 million of marketable securities in excess of maturities and sales, and fund an increase in trade and wholesale receivables of $158 million. Cash, cash equivalents, and restricted cash decreased $277 million over the three-year period.
Receivables and equipment on operating leases decreased by $332 million in 2020, compared with 2019. Total acquisition volumes of receivables (excluding trade and wholesale) and cost of equipment on operating leases increased 2 percent in 2020, compared with 2019. The volume of retail notes increased approximately 9 percent. The volume of revolving charge accounts remained about the same. The volumes of operating leases and financing leases decreased 18 percent and 5 percent, respectively. During 2020, the wholesale notes and trade receivables portfolios decreased 25 percent and 17 percent, respectively.
Total external interest-bearing debt of the financial services operations was $35,556 million at the end of 2020, compared with $38,888 million at the end of 2019 and $36,033 million at the end of 2018. Total external borrowings have changed generally corresponding with the level of the receivable and lease portfolio, the level of cash and cash equivalents, the change in payables owed to Deere & Company, and the change in investment from Deere & Company. The financial services operations’ ratio of total interest-bearing debt to total stockholder’s equity was 7.8 to 1 at the end of 2020, 8.0 to 1 at the end of 2019, and 7.5 to 1 at the end of 2018.
The Capital Corporation has a revolving credit agreement to utilize bank conduit facilities to securitize retail notes (see Note 14). At November 1, 2020, the facility had a total capacity, or “financing limit,” of up to $3,500 million of secured financings at any time. The facility was renewed in November 2020 with a capacity of $2,000 million. After a two-year revolving period, unless the banks and Capital Corporation agree to renew, Capital Corporation would liquidate the secured borrowings over time as payments on the
retail notes are collected. At November 1, 2020, $1,802 million of short-term securitization borrowings was outstanding under the agreement.
During 2020, the financial services operations issued $3,274 million and retired $2,895 million of retail note securitization borrowings. During 2020, the financial services operations also issued $4,685 million and retired $6,776 million of long-term borrowings, which were primarily medium-term notes.
OFF-BALANCE-SHEET ARRANGEMENTS
At November 1, 2020, the company had approximately $380 million of guarantees issued primarily to banks outside the U.S. and Canada related to third-party receivables for the retail financing of John Deere equipment. The company may recover a portion of any required payments incurred under these agreements from repossession of the equipment collateralizing the receivables. The maximum remaining term of the receivables guaranteed at November 1, 2020 was approximately seven years.
AGGREGATE CONTRACTUAL OBLIGATIONS
The payment schedule for the company’s contractual obligations at November 1, 2020 in millions of dollars is as follows:
| | | | | | | | | | | | | | | | | |
|---|---|---|---|---|---|---|---|---|---|---|---|---|---|---|---|---|
| | | | | | Less | | | | | | | | More | | ||
| | | | | | than | | 2&3 | | 4&5 | | than | | ||||
| | Total | 1 year | years | years | 5 years | |||||||||||
| On-balance-sheet | | | | | | | | | | | | |||||
| Debt* | | | | | | | | | | | | | | | | |
| Equipment operations** | | $ | 10,441 | | $ | 292 | | $ | 1,804 | | $ | 1,635 | | $ | 6,710 | |
| Financial services** | | 34,948 | | 10,634 | | 14,215 | | | 5,444 | | | 4,655 | | |||
| Total | | 45,389 | | 10,926 | | 16,019 | | 7,079 | | 11,365 | | |||||
| Interest relating to debt*** | | | 5,937 | | | 951 | | | 1,231 | | | 781 | | | 2,974 | |
| Accounts payable | | 3,022 | | | 2,933 | | | 63 | | | 24 | | | 2 | | |
| Operating leases | | 323 | | | 90 | | | 126 | | | 66 | | | 41 | | |
| Finance leases | | | 62 | | | 22 | | | 30 | | | 8 | | | 2 | |
| Off-balance-sheet | | | | | | | | | | | | | | | | |
| Purchase obligations | | 2,708 | | | 2,640 | | | 61 | | | 5 | | | 2 | | |
| Total | | $ | 57,441 | | $ | 17,562 | | $ | 17,530 | | $ | 7,963 | | $ | 14,386 | |
| * | Principal payments. |
|---|
| ** | Payments related to securitization borrowings of $4,687 million classified as short-term on the balance sheet related to the securitization of retail notes are included in this table based on the expected payment schedule (see Note 18). |
|---|
| *** | Includes projected payments related to interest rate swaps. |
|---|
The previous table does not include unrecognized tax benefit liabilities of approximately $668 million at November 1, 2020, since the timing of future payments is not reasonably estimable at this time (see Note 9). For additional information regarding pension and OPEB obligations, short-term borrowings, long-term borrowings, and lease obligations, see Notes 8, 18, 20, and 25, respectively.
CRITICAL ACCOUNTING POLICIES
The preparation of the company’s consolidated financial statements in conformity with accounting principles generally accepted in the U.S. requires management to make estimates and assumptions that affect reported amounts of assets, liabilities, revenues, and expenses. Changes in these estimates and assumptions could have a significant effect on the financial
statements. The accounting policies below are those management believes are the most critical to the preparation of the company’s financial statements and require the most difficult, subjective, or complex judgments. The company’s other accounting policies are described in the Notes to the Consolidated Financial Statements.
Sales Incentives
At the time a sale to a dealer is recognized, the company records an estimate of the future sales incentive costs as a reduction to the sales price. These incentives may be based on a dealer’s purchase volume, or on retail sales incentive programs for allowances and financing programs that will be due when the dealer sells the equipment to a retail customer. The estimated cost of these programs is based on historical data, announced and expected incentive programs, field inventory levels, and forecasted sales volumes. The final cost of these programs is determined at the end of the measurement period for volume-based incentives or when the dealer sells the equipment to the retail customer. This is due to numerous programs available at any particular time and new programs that may be announced after the company records the equipment sale. Changes in the mix and types of programs affect these estimates, which are reviewed quarterly.
The sales incentive accruals at November 1, 2020, November 3, 2019, and October 28, 2018 were $1,718 million, $2,033 million, and $1,850 million, respectively. The total accrual is recorded $1,109 million, $1,443 million, and $1,297 million in trade accounts and notes receivable – net, and $609 million, $590 million, and $553 million in accounts payable and accrued expenses at November 1, 2020, November 3, 2019, and October 28, 2018, respectively. The decrease in 2020 primarily resulted from lower sales volume and the increase in 2019 primarily related to higher sales volume.
The estimation of the retail sales incentive accrual is impacted by many assumptions. One of the key assumptions is the predictive value of the historical percent of retail sales incentive costs to retail sales from dealers. Over the last five fiscal years, this percent has varied by an average of approximately plus or minus .6 percent, compared to the average retail sales incentive costs to retail sales percent during that period. Holding other assumptions constant, if this estimated retail incentive cost experience percent were to increase or decrease .6 percent, the sales incentive accrual at November 1, 2020 would increase or decrease by approximately $42 million.
Product Warranties
At the time a sale is recognized, the company records the estimated future warranty costs. The company generally determines its total warranty liability by applying historical claims rate experience to the estimated amount of equipment that has been sold and is still under warranty based on dealer inventories and retail sales. The historical claims rate is primarily determined by a review of five-year claims costs and consideration of current quality developments. Variances in claims experience and the type of warranty programs affect these estimates, which are reviewed quarterly.
The product warranty accruals, excluding extended warranty unamortized premiums, at November 1, 2020, November 3, 2019, and October 28, 2018 were $1,105 million, $1,218 million, and $1,146
million, respectively. The decrease in 2020 primarily related to lower sales volume and the increase in 2019 was related primarily to higher sales volume.
Estimates used to determine the product warranty accruals are significantly affected by the historical percent of warranty claims costs to sales. Over the last five fiscal years, this percent has varied by an average of approximately plus or minus .07 percent, compared to the average warranty costs to sales percent during that period. Holding other assumptions constant, if this estimated cost experience percent were to increase or decrease .07 percent, the warranty accrual at November 1, 2020 would increase or decrease by approximately $27 million.
Postretirement Benefit Obligations
Pension and other postretirement benefit, primarily health care and life insurance plans, obligations are based on various assumptions used by the company’s actuaries in calculating these amounts. These assumptions include discount rates, health care cost trend rates, expected return on plan assets, compensation increases, retirement rates, mortality rates, and other factors. Actual results that differ from the assumptions and changes in assumptions affect future expenses and obligations.
The pension liabilities, net of pension assets, recognized on the balance sheet at November 1, 2020 and November 3, 2019 were $447 million and $226 million, respectively. The pension assets, net of pension liabilities, recognized on the balance sheet at October 28, 2018 were $494 million. The increases in pension net liabilities in 2020 and 2019 were due primarily to decreases in discount rates and interest on the liabilities, largely offset by the return on plan assets. The OPEB liabilities, net of OPEB assets, at November 1, 2020, November 3, 2019, and October 28, 2018 were $3,892 million, $4,686 million, and $4,753 million, respectively. The decrease in OPEB net liabilities in 2020 was due primarily to contributions to a U.S. OPEB plan. The decrease in OPEB net liabilities in 2019 was due primarily to contributions to a U.S. OPEB plan, a decrease in health care trend rates, and company contributions for benefit payments, mostly offset by decreases in discount rates.
The effect of hypothetical changes to selected assumptions on the company’s major U.S. retirement benefit plans would be as follows in millions of dollars:
| | | | | | | | | | | |||||||||
|---|---|---|---|---|---|---|---|---|---|---|---|---|---|---|---|---|---|---|
| | | | | November 1, 2020 | | 2021 | | |||||||||||
| | | | | Increase | | Increase | | |||||||||||
| | | Percentage | | (Decrease) | | (Decrease) | | |||||||||||
| Assumptions | Change | PBO/APBO* | Expense | |||||||||||||||
| Pension | | | | | | | | | | |||||||||
| Discount rate** | +/-.5 | | $ | (840)/972 | | $ | (37)/43 | | ||||||||||
| Expected return on assets | | +/-.5 | | | | | (59)/59 | | ||||||||||
| OPEB | | | | | | | | | | |||||||||
| Discount rate** | +/-.5 | | (304)/336 | | 3/(3) | | ||||||||||||
| Expected return on assets | +/-.5 | | | | | (7)/7 | | |||||||||||
| Health care cost trend rate** | +/-1.0 | | 577/(482) | | 54/(33) | |
| * | Projected benefit obligation (PBO) for pension plans and accumulated postretirement benefit obligation (APBO) for OPEB plans. |
|---|
| ** | Pretax impact on service cost, interest cost, and amortization of gains or losses. |
|---|
Goodwill
Goodwill is not amortized and is tested for impairment annually and when events or circumstances change such that it is more likely than not that the fair value of a reporting unit is reduced below its carrying amount. The end of the fiscal third quarter is the annual measurement date. To test for goodwill impairment, the carrying value of each reporting unit is compared with its fair value. If the carrying value of the goodwill is considered impaired, a loss is measured as the excess of the reporting unit’s carrying value over the fair value, with a limit of the goodwill allocated to that reporting unit.
An estimate of the fair value of the reporting unit is determined through a combination of comparable market values for similar businesses and discounted cash flows. These estimates can change significantly based on such factors as the reporting unit’s financial performance, economic conditions, interest rates, growth rates, pricing, changes in business strategies, and competition.
Based on this testing, the company has not identified a reporting unit for which the goodwill was impaired in 2020, 2019, or 2018. For all reporting units, a 10 percent decrease in the estimated fair value would have had no effect on the carrying value of goodwill at the annual measurement date in 2020.
Allowance for Credit Losses
The allowance for credit losses represents an estimate of the losses inherent in the company’s receivable portfolio. The level of the allowance is based on many quantitative and qualitative factors, including historical net loss experience by finance product category, portfolio duration, delinquency trends, economic conditions in the company’s major markets and geographies, commodity price trends, and credit risk quality. The company has an established process to calculate a range of possible outcomes and determine the adequacy of the allowance. The adequacy of the allowance is assessed quarterly by finance product category. Different assumptions or changes in economic conditions would result in changes to the allowance for credit losses and the provision for credit losses.
The total allowance for credit losses at November 1, 2020, November 3, 2019, and October 28, 2018 was $223 million, $222 million, and $248 million, respectively. The allowance was about the same in 2020 compared to 2019 with an increase in the financing receivable allowance largely offset by a decrease in the allowance for trade accounts and notes receivable (see Note 13). The allowance decrease in 2019 was mainly due to improvement in credit loss experience in certain foreign markets.
The assumptions used in evaluating the company’s exposure to credit losses involve estimates and significant judgment. The historical loss experience on the receivable portfolio represents one factor used in determining the allowance for credit losses. Compared to the average loss experience over the last five fiscal years, this percent has varied by an average of approximately plus or minus .02 percent, compared to the average loss experience percent during that period. Holding other factors constant, if this estimated loss experience on the receivable portfolio were to increase or decrease .02 percent, the allowance for credit losses at
November 1, 2020 would increase or decrease by approximately $9 million.
Operating Lease Residual Values
The carrying value of equipment on operating leases is affected by the estimated fair values of the equipment at the end of the lease (residual values). Upon termination of the lease, the equipment is either purchased by the lessee or sold to a third party, in which case the company may record a gain or a loss for the difference between the estimated residual value and the sale price. The estimated residual values are based on several factors, including lease term, expected hours of usage, historical wholesale sales prices, return experience, intended equipment use, market dynamics and trends, and dealer residual guarantees. The company reviews residual value estimates during the lease term and tests carrying value of its operating leases when events or circumstances necessitate. Changes in residual value assumptions would affect the amount of depreciation expense and the amount of investment in equipment on operating leases.
The total operating lease residual values at November 1, 2020, November 3, 2019, and October 28, 2018 were $5,254 million, $5,259 million, and $5,089 million, respectively. The minor decrease in 2020 primarily related to a lower average operating lease portfolio and the increase in 2019 was due primarily to increasing levels of operating leases.
Estimates used in determining end of lease market values for equipment on operating leases significantly impact the amount and timing of depreciation expense. Hypothetically, if future market values for this equipment were to decrease 10 percent from the company’s present estimates, the total effect would be to increase the company’s annual depreciation for equipment on operating leases by approximately $175 million.
Income Taxes
The company’s income tax provision, deferred income tax assets and liabilities, and liabilities for uncertain tax benefits represent the company’s best estimate of current and future income taxes to be paid. The annual tax rate is based on income tax laws, statutory tax rates, taxable income levels, and tax planning opportunities available in various jurisdictions where the company operates. These tax laws are complex, and require significant judgment to determine the consolidated provision for income taxes. Changes in tax laws, regulations, statutory tax rates, and estimates of the company’s future taxable income levels could result in actual realization of deferred taxes being materially different from amounts provided for in the consolidated financial statements.
Deferred income taxes represent temporary differences between the tax and the financial reporting basis of assets and liabilities, which will result in taxable or deductible amounts in the future. Deferred tax assets also include loss carryforwards and tax credits. These assets are regularly assessed for the likelihood of recoverability from estimated future taxable income, reversal of deferred tax liabilities, and tax planning strategies. To the extent the company determines that it is more likely than not a deferred income tax asset will not be realized, a valuation allowance is established. The recoverability analysis of the deferred income tax
assets and the related valuation allowances requires significant judgment and relies on estimates.
Uncertain tax positions are determined based on whether it is more likely than not the tax positions will be sustained based on the technical merits of the position. For those positions that meet the more likely than not criteria, an estimate of the largest amount of tax benefit that is greater than 50 percent likely to be realized upon ultimate settlement with the related tax authority is recognized. The ultimate resolution of the tax position could take many years and result in a payment that is significantly different from the original estimate.
Tax reform (see Note 9) included additional requirements that became effective for the company in 2019. Those provisions include a tax on global intangible low-taxed income (GILTI), a tax determined by base erosion and anti-abuse tax benefits (BEAT) from certain payments between a U.S. corporation and foreign subsidiaries, a limitation of certain executive compensation, a deduction for foreign derived intangible income (FDII), and interest expense limitations. These provisions require interpretation and the use of estimates to determine the liability and benefits. The company’s accounting policy election is to treat the taxes due on future U.S. inclusions in taxable income under GILTI as a period cost when incurred.
A provision for foreign withholding taxes has not been recorded on undistributed profits of the company’s non-U.S. subsidiaries that are determined to be indefinitely reinvested outside the U.S. If management intentions change in the future, there may be a significant impact on the provision for income taxes in the period the change occurs. For further information on income taxes, see Note 9 to the consolidated financial statements.
SUPPLEMENTAL CONSOLIDATING INFORMATION
The supplemental consolidating data presented on the subsequent pages is presented for informational purposes. The equipment operations represents the enterprise without financial services. The equipment operations includes the company’s agriculture and turf operations, construction and forestry operations, and other corporate assets, liabilities, revenues, and expenses not reflected within financial services. Transactions between the “equipment operations” and “financial services” have been eliminated to arrive at the consolidated financial statements.
The equipment operations and financial services participate in different industries. The equipment operations primarily generate earnings and cash flows by manufacturing and distributing equipment, service parts, and technology solutions to dealers and end users. Financial services primarily finances sales and leases by dealers of new and used equipment that is largely manufactured by the company. Those earnings and cash flows generally are the difference between the finance income received from customer payments less interest expense, and depreciation on equipment subject to an operating lease. The two businesses are capitalized differently and have different performance metrics. The supplemental consolidating data is also used by management due to these differences.
SUPPLEMENTAL CONSOLIDATING DATA
| | | | | | | | | | | | | | | | | | | | | | | | | | | | | | | | | | | | | | | | |
|---|---|---|---|---|---|---|---|---|---|---|---|---|---|---|---|---|---|---|---|---|---|---|---|---|---|---|---|---|---|---|---|---|---|---|---|---|---|---|---|
| INCOME STATEMENT | | | | ||||||||||||||||||||||||||||||||||||
| For the Years Ended November 1, 2020, November 3, 2019, and October 28, 2018 | | | | ||||||||||||||||||||||||||||||||||||
| (In millions of dollars) Unaudited | | | | ||||||||||||||||||||||||||||||||||||
| | | EQUIPMENT OPERATIONS 1 | | FINANCIAL SERVICES | | ELIMINATIONS | | CONSOLIDATED | | | | ||||||||||||||||||||||||||||
| | | 2020 | | 2019 | | 2018 | | 2020 | | 2019 | | 2018 | | 2020 | | 2019 | | 2018 | | 2020 | | 2019 | | 2018 | | | | ||||||||||||
| Net Sales and Revenues | | | | | | | | | | | | | | | | | | | | | | | | | | | | | |||||||||||
| Net sales | | $ | 31,272 | | $ | 34,886 | | $ | 33,351 | | | | | | | | | | | | | | | | | | | | $ | 31,272 | | $ | 34,886 | | $ | 33,351 | | | |
| Finance and interest income | | | 112 | | | 118 | | | 126 | | $ | 3,610 | | $ | 3,735 | | $ | 3,311 | | $ | (272) | | $ | (360) | | $ | (330) | | | 3,450 | | | 3,493 | | | 3,107 | | 2 | |
| Other income | | | 808 | | | 881 | | | 875 | | | 257 | | | 234 | | | 249 | | | (247) | | | (236) | | | (224) | | | 818 | | | 879 | | | 900 | | 3 | |
| Total | | | 32,192 | | | 35,885 | | | 34,352 | | | 3,867 | | | 3,969 | | | 3,560 | | | (519) | | | (596) | | | (554) | | | 35,540 | | | 39,258 | | | 37,358 | | | |
| | | | | | | | | | | | | | | | | | | | | | | | | | | | | | | | | | | | | | | | |
| Costs and Expenses | | | | | | | | | | | | | | | | | | | | | | | | | | | | | | | | | | | | | | | |
| Cost of sales | | | 23,679 | | | 26,793 | | | 25,573 | | | | | | | | | | | | (2) | | | (1) | | | (2) | | | 23,677 | | | 26,792 | | | 25,571 | | 4 | |
| Research and development expenses | | | 1,644 | | | 1,783 | | | 1,658 | | | | | | | | | | | | | | | | | | | | | 1,644 | | | 1,783 | | | 1,658 | | | |
| Selling, administrative and general expenses | | | 2,878 | | | 3,031 | | | 2,935 | | | 606 | | | 528 | | | 528 | | | (7) | | | (8) | | | (8) | | | 3,477 | | | 3,551 | | | 3,455 | | 4 | |
| Interest expense | | | 329 | | | 256 | | | 298 | | | 942 | | | 1,234 | | | 936 | | | (24) | | | (24) | | | (30) | | | 1,247 | | | 1,466 | | | 1,204 | | 5 | |
| Interest compensation to Financial Services | | | 248 | | | 336 | | | 300 | | | | | | | | | | | | (248) | | | (336) | | | (300) | | | | | | | | | | | 5 | |
| Other operating expenses | | | 278 | | | 299 | | | 315 | | | 1,572 | | | 1,506 | | | 1,298 | | | (238) | | | (227) | | | (214) | | | 1,612 | | | 1,578 | | | 1,399 | | 6 | |
| Total | | | 29,056 | | | 32,498 | | | 31,079 | | | 3,120 | | | 3,268 | | | 2,762 | | | (519) | | | (596) | | | (554) | | | 31,657 | | | 35,170 | | | 33,287 | | | |
| | | | | | | | | | | | | | | | | | | | | | | | | | | | | | | | | | | | | | | | |
| Income before Income Taxes | | | 3,136 | | | 3,387 | | | 3,273 | | | 747 | | | 701 | | | 798 | | | | | | | | | | | | 3,883 | | | 4,088 | | | 4,071 | | | |
| Provision (credit) for income taxes | | | 899 | | | 689 | | | 1,869 | | | 183 | | | 163 | | | (142) | | | | | | | | | | | | 1,082 | | | 852 | | | 1,727 | | | |
| | | | | | | | | | | | | | | | | | | | | | | | | | | | | | | | | | | | | | | | |
| Income after Income Taxes | | | 2,237 | | | 2,698 | | | 1,404 | | | 564 | | | 538 | | | 940 | | | | | | | | | | | | 2,801 | | | 3,236 | | | 2,344 | | | |
| Equity in income (loss) of unconsolidated affiliates | | | (50) | | | 20 | | | 25 | | | 2 | | | 1 | | | 2 | | | | | | | | | | | | (48) | | | 21 | | | 27 | | | |
| | | | | | | | | | | | | | | | | | | | | | | | | | | | | | | | | | | | | | | | |
| Net Income | | | 2,187 | | | 2,718 | | | 1,429 | | | 566 | | | 539 | | | 942 | | | | | | | | | | | | 2,753 | | | 3,257 | | | 2,371 | | | |
| Less: Net income attributable to noncontrolling interests | | | 2 | | | 4 | | | 3 | | | | | | | | | | | | | | | | | | | | | 2 | | | 4 | | | 3 | | | |
| Net Income Attributable to Deere & Company | | $ | 2,185 | | $ | 2,714 | | $ | 1,426 | | $ | 566 | | $ | 539 | | $ | 942 | | | | | | | | | | | $ | 2,751 | | $ | 3,253 | | $ | 2,368 | | | |
1 The equipment operations represents the enterprise without financial services. The equipment operations includes the company’s agriculture and turf operations, construction and forestry operations, and other corporate assets, liabilities, revenues, and expenses not reflected within financial services.
2 Elimination of financial services’ interest income earned from equipment operations.
3 Elimination of equipment operations’ margin from inventory transferred to equipment on operating leases (see Note 7).
4 Elimination of intercompany service fees.
5 Elimination of equipment operations’ interest expense to financial services.
6 Elimination of financial services’ lease depreciation expense related to inventory transferred to equipment on operating leases.
SUPPLEMENTAL CONSOLIDATING DATA (continued)
| | | | | | | | | | | | | | | | | | | | | | | | | | | | |
|---|---|---|---|---|---|---|---|---|---|---|---|---|---|---|---|---|---|---|---|---|---|---|---|---|---|---|---|
| CONDENSED BALANCE SHEET | | | | ||||||||||||||||||||||||
| As of November 1, 2020 and November 3, 2019 | | | | ||||||||||||||||||||||||
| (In millions of dollars) Unaudited | | | | ||||||||||||||||||||||||
| | | EQUIPMENT OPERATIONS 1 | | FINANCIAL SERVICES | | ELIMINATIONS | | CONSOLIDATED | | | | ||||||||||||||||
| | 2020 | 2019 | | 2020 | 2019 | | 2020 | 2019 | | 2020 | 2019 | | | | |||||||||||||
| ASSETS | | | | | | | | | | | | | | | | | | | | | | | | ||||
| Cash and cash equivalents | | $ | 6,145 | | $ | 3,175 | | $ | 921 | | $ | 682 | | | | | | | | $ | 7,066 | | $ | 3,857 | | | |
| Marketable securities | | 7 | | 1 | | 634 | | 580 | | | | | | 641 | | 581 | | | | ||||||||
| Receivables from unconsolidated affiliates | | 5,290 | | 2,017 | | | | | | $ | (5,259) | | $ | (1,971) | | 31 | | 46 | | 7 | | ||||||
| Trade accounts and notes receivable - net | | 1,013 | | 1,482 | | 4,238 | | 5,153 | | (1,080) | | (1,405) | | 4,171 | | 5,230 | | 8 | | ||||||||
| Financing receivables - net | | 106 | | 65 | | 29,644 | | 29,130 | | | | | | 29,750 | | 29,195 | | | | ||||||||
| Financing receivables securitized - net | | | 26 | | | 44 | | | 4,677 | | | 4,339 | | | | | | | | | 4,703 | | | 4,383 | | | |
| Other receivables | | 1,117 | | 1,376 | | 151 | | 116 | | (48) | | (5) | | 1,220 | | 1,487 | | 8 | | ||||||||
| Equipment on operating leases - net | | | | | | | | | 7,298 | | | 7,567 | | | | | | | | | 7,298 | | | 7,567 | | | |
| Inventories | | 4,999 | | 5,975 | | | | | | | | | | 4,999 | | 5,975 | | | | ||||||||
| Property and equipment - net | | 5,778 | | 5,929 | | 39 | | 44 | | | | | | 5,817 | | 5,973 | | | | ||||||||
| Investments in unconsolidated affiliates | | 174 | | 199 | | 19 | | 16 | | | | | | 193 | | 215 | | | | ||||||||
| Goodwill | | 3,081 | | 2,917 | | | | | | | | | | 3,081 | | 2,917 | | | | ||||||||
| Other intangible assets - net | | 1,327 | | 1,380 | | | | | | | | | | 1,327 | | 1,380 | | | | ||||||||
| Retirement benefits | | 859 | | 836 | | 59 | | 58 | | (55) | | (54) | | 863 | | 840 | | 9 | | ||||||||
| Deferred income taxes | | 1,763 | | 1,896 | | 45 | | 57 | | (309) | | (487) | | 1,499 | | 1,466 | | 10 | | ||||||||
| Other assets | | 1,439 | | 1,158 | | 994 | | 741 | | (1) | | | | 2,432 | | 1,899 | | | | ||||||||
| Total Assets | | $ | 33,124 | | $ | 28,450 | | $ | 48,719 | | $ | 48,483 | | $ | (6,752) | | $ | (3,922) | | $ | 75,091 | | $ | 73,011 | | | |
| | | | | | | | | | | | | | | | | | | | | | | | | | | | |
| LIABILITIES AND STOCKHOLDERS’ EQUITY | | | | | | | | | | | | | | | | | | | | | | | | | | | |
| | | | | | | | | | | | | | | | | | | | | | | | | | | | |
| LIABILITIES | | | | | | | | | | | | | | | | | | | | | | | | | | | |
| Short-term borrowings | | $ | 292 | | $ | 987 | | $ | 8,290 | | $ | 9,797 | | | | | | | | $ | 8,582 | | $ | 10,784 | | | |
| Short-term securitization borrowings | | | 26 | | | 44 | | | 4,656 | | | 4,277 | | | | | | | | | 4,682 | | | 4,321 | | | |
| Payables to unconsolidated affiliates | | 104 | | 142 | | 5,260 | | 1,970 | | $ | (5,259) | | $ | (1,970) | | 105 | | 142 | | 7 | | ||||||
| Accounts payable and accrued expenses | | 9,114 | | 9,232 | | 2,127 | | 1,836 | | (1,129) | | (1,412) | | 10,112 | | 9,656 | | 8 | | ||||||||
| Deferred income taxes | | 385 | | 414 | | 443 | | 568 | | (309) | | (487) | | 519 | | 495 | | 10 | | ||||||||
| Long-term borrowings | | 10,124 | | 5,415 | | 22,610 | | 24,814 | | | | | | 32,734 | | 30,229 | | | | ||||||||
| Retirement benefits and other liabilities | | 5,366 | | 5,912 | | 102 | | 94 | | (55) | | (53) | | 5,413 | | 5,953 | | 9 | | ||||||||
| Total liabilities | | 25,411 | | 22,146 | | 43,488 | | 43,356 | | (6,752) | | (3,922) | | 62,147 | | 61,580 | | | | ||||||||
| | | | | | | | | | | | | | | | | | | | | | | | | | | | |
| Commitments and contingencies (Note 21) | | | | | | | | | | | | | | | | | | | | | | | | | | | |
| Redeemable noncontrolling interest (Note 5) | | | | | | 14 | | | | | | | | | | | | | | | | | | 14 | | | |
| | | | | | | | | | | | | | | | | | | | | | | | | | | | |
| STOCKHOLDERS’ EQUITY | | | | | | | | | | | | | | | | | | | | | | | | | | | |
| Total Deere & Company stockholders’ equity | | 12,937 | | 11,413 | | 5,231 | | 5,127 | | (5,231) | | (5,127) | | 12,937 | | 11,413 | | 11 | | ||||||||
| Noncontrolling interests | | 7 | | 4 | | | | | | | | | | 7 | | 4 | | | | ||||||||
| Financial Services equity | | | (5,231) | | | (5,127) | | | | | | | | | 5,231 | | | 5,127 | | | | | | | | 11 | |
| Adjusted total stockholders' equity | | 7,713 | | 6,290 | | 5,231 | | 5,127 | | | | | | 12,944 | | 11,417 | | | | ||||||||
| Total Liabilities and Stockholders’ Equity | | $ | 33,124 | | $ | 28,450 | | $ | 48,719 | | $ | 48,483 | | $ | (6,752) | | $ | (3,922) | | $ | 75,091 | | $ | 73,011 | | | |
1 The equipment operations represents the enterprise without financial services. The equipment operations includes the company’s agriculture and turf operations, construction and forestry operations, and other corporate assets, liabilities, revenues, and expenses not reflected within financial services.
7 Elimination of receivables / payables between equipment operations and financial services.
8 Reclassification of sales incentive accruals on receivables sold to financial services.
9 Reclassification of net pension assets / liabilities.
10 Reclassification of deferred tax assets / liabilities in the same taxing jurisdictions.
11 Elimination of financial services’ equity.
SUPPLEMENTAL CONSOLIDATING DATA (continued)
| | | | | | | | | | | | | | | | | | | | | | | | | | | | | | | | | | | | | | | | |
|---|---|---|---|---|---|---|---|---|---|---|---|---|---|---|---|---|---|---|---|---|---|---|---|---|---|---|---|---|---|---|---|---|---|---|---|---|---|---|---|
| STATEMENT OF CASH FLOWS | | | | ||||||||||||||||||||||||||||||||||||
| For the Years Ended November 1, 2020, November 3, 2019, and October 28, 2018 | | | | ||||||||||||||||||||||||||||||||||||
| (In millions of dollars) Unaudited | | | | ||||||||||||||||||||||||||||||||||||
| | | EQUIPMENT OPERATIONS 1 | | FINANCIAL SERVICES | | ELIMINATIONS | | CONSOLIDATED | | | | ||||||||||||||||||||||||||||
| | | 2020 | | 2019 | | 2018 | | 2020 | | 2019 | | 2018 | | 2020 | | 2019 | | 2018 | | 2020 | | 2019 | | 2018 | | | | ||||||||||||
| Cash Flows from Operating Activities | | | | | | | | | | | | | | | | | | | | | | | | | | | | | |||||||||||
| Net income | | $ | 2,187 | | $ | 2,718 | | $ | 1,429 | | $ | 566 | | $ | 539 | | $ | 942 | | | | | | | | | | | $ | 2,753 | | $ | 3,257 | | $ | 2,371 | | | |
| Adjustments to reconcile net income to net cash provided by operating activities: | | | | | | | | | | | | | | | | | | | | | | | | | | | | | | | | | | | | | | | |
| Provision for credit losses | | | 5 | | | 14 | | | 39 | | | 105 | | | 29 | | | 51 | | | | | | | | | | | | 110 | | | 43 | | | 90 | | | |
| Provision for depreciation and amortization | | | 1,016 | | | 1,015 | | | 974 | | | 1,227 | | | 1,135 | | | 1,077 | | $ | (125) | | $ | (131) | | $ | (124) | | | 2,118 | | | 2,019 | | | 1,927 | | 12 | |
| Impairment charges | | | 162 | | | | | | | | | 32 | | | 77 | | | | | | | | | | | | | | | 194 | | | 77 | | | | | | |
| Share-based compensation expense | | | | | | | | | | | | | | | | | | | | | 81 | | | 82 | | | 84 | | | 81 | | | 82 | | | 84 | | 13 | |
| (Gain) loss on sale of businesses and unconsolidated affiliates | | | 24 | | | 5 | | | (25) | | | | | | | | | | | | | | | | | | | | | 24 | | | 5 | | | (25) | | | |
| Undistributed earnings of unconsolidated affiliates | | | 381 | | | 437 | | | 439 | | | (2) | | | (2) | | | (2) | | | (386) | | | (426) | | | (463) | | | (7) | | | 9 | | | (26) | | 14 | |
| Provision (credit) for deferred income taxes | | | 105 | | | (222) | | | 1,504 | | | (116) | | | (243) | | | (24) | | | | | | | | | | | | (11) | | | (465) | | | 1,480 | | | |
| Changes in assets and liabilities: | | | | | | | | | | | | | | | | | | | | | | | | | | | | | | | | | | | | | | | |
| Trade, notes, and financing receivables related to sales | | | 373 | | | (142) | | | (239) | | | | | | | | | | | | 1,636 | | | (727) | | | (1,292) | | | 2,009 | | | (869) | | | (1,531) | | 15, 17, 18 | |
| Inventories | | | 1,011 | | | (102) | | | (917) | | | | | | | | | | | | (614) | | | (678) | | | (855) | | | 397 | | | (780) | | | (1,772) | | 16 | |
| Accounts payable and accrued expenses | | | (331) | | | 13 | | | 793 | | | (1) | | | 163 | | | 120 | | | 325 | | | (130) | | | (191) | | | (7) | | | 46 | | | 722 | | 17 | |
| Accrued income taxes payable/receivable | | | (14) | | | (355) | | | 103 | | | 22 | | | 528 | | | (569) | | | | | | | | | | | | 8 | | | 173 | | | (466) | | | |
| Retirement benefits | | | (544) | | | (235) | | | (985) | | | 7 | | | 2 | | | (41) | | | | | | | | | | | | (537) | | | (233) | | | (1,026) | | | |
| Other | | | 385 | | | 54 | | | 166 | | | 136 | | | 190 | | | 88 | | | (170) | | | (196) | | | (260) | | | 351 | | | 48 | | | (6) | | 12, 13, 16 | |
| Net cash provided by operating activities | | | 4,760 | | | 3,200 | | | 3,281 | | | 1,976 | | | 2,418 | | | 1,642 | | | 747 | | | (2,206) | | | (3,101) | | | 7,483 | | | 3,412 | | | 1,822 | | | |
| | | | | | | | | | | | | | | | | | | | | | | | | | | | | | | | | | | | | | | | |
| Cash Flows from Investing Activities | | | | | | | | | | | | | | | | | | | | | | | | | | | | | | | | | | | | | | | |
| Collections of receivables (excluding receivables related to sales) | | | | | | | | | | | | 18,829 | | | 18,190 | | | 17,032 | | | (1,448) | | | (1,484) | | | (1,443) | | | 17,381 | | | 16,706 | | | 15,589 | | 15 | |
| Proceeds from maturities and sales of marketable securities | | | | | | 12 | | | 11 | | | 93 | | | 77 | | | 65 | | | | | | | | | | | | 93 | | | 89 | | | 76 | | | |
| Proceeds from sales of equipment on operating leases | | | | | | | | | | | | 1,783 | | | 1,648 | | | 1,483 | | | | | | | | | | | | 1,783 | | | 1,648 | | | 1,483 | | | |
| Proceeds from sales of businesses and unconsolidated affiliates, net of cash sold | | | | | | 93 | | | 156 | | | | | | | | | | | | | | | | | | | | | | | | 93 | | | 156 | | | |
| Cost of receivables acquired (excluding receivables related to sales) | | | | | | | | | | | | (21,360) | | | (20,321) | | | (18,778) | | | 1,395 | | | 1,448 | | | 1,765 | | | (19,965) | | | (18,873) | | | (17,013) | | 15 | |
| Acquisitions of businesses, net of cash acquired | | | (66) | | | | | | (5,245) | | | | | | | | | | | | | | | | | | | | | (66) | | | | | | (5,245) | | | |
| Purchases of marketable securities | | | (4) | | | (3) | | | | | | (126) | | | (137) | | | (133) | | | | | | | | | | | | (130) | | | (140) | | | (133) | | | |
| Purchases of property and equipment | | | (816) | | | (1,118) | | | (893) | | | (4) | | | (2) | | | (3) | | | | | | | | | | | | (820) | | | (1,120) | | | (896) | | | |
| Cost of equipment on operating leases acquired | | | | | | | | | | | | (2,666) | | | (3,246) | | | (3,209) | | | 830 | | | 917 | | | 1,155 | | | (1,836) | | | (2,329) | | | (2,054) | | 16 | |
| Increase in investment in Financial Services | | | (21) | | | (8) | | | | | | | | | | | | | | | 21 | | | 8 | | | | | | | | | | | | | | 14 | |
| Decrease (increase) in trade and wholesale receivables | | | | | | | | | | | | 1,999 | | | (935) | | | (1,222) | | | (1,999) | | | 935 | | | 1,222 | | | | | | | | | | | 15 | |
| Collateral on derivatives - net | | | (6) | | | | | | | | | 274 | | | 59 | | | (59) | | | | | | | | | | | | 268 | | | 59 | | | (59) | | | |
| Other | | | (78) | | | 35 | | | 17 | | | (38) | | | (54) | | | (36) | | | 89 | | | (38) | | | (61) | | | (27) | | | (57) | | | (80) | | 18 | |
| Net cash used for investing activities | | | (991) | | | (989) | | | (5,954) | | | (1,216) | | | (4,721) | | | (4,860) | | | (1,112) | | | 1,786 | | | 2,638 | | | (3,319) | | | (3,924) | | | (8,176) | | | |
| | | | | | | | | | | | | | | | | | | | | | | | | | | | | | | | | | | | | | | | |
| Cash Flows from Financing Activities | | | | | | | | | | | | | | | | | | | | | | | | | | | | | | | | | | | | | | | |
| Increase (decrease) in total short-term borrowings | | | (177) | | | (149) | | | 16 | | | (1,183) | | | (768) | | | 457 | | | | | | | | | | | | (1,360) | | | (917) | | | 473 | | | |
| Change in intercompany receivables/payables | | | (3,207) | | | (305) | | | (748) | | | 3,207 | | | 305 | | | 748 | | | | | | | | | | | | | | | | | | | | | |
| Proceeds from long-term borrowings | | | 4,586 | | | 1,348 | | | 149 | | | 4,685 | | | 8,638 | | | 8,139 | | | | | | | | | | | | 9,271 | | | 9,986 | | | 8,288 | | | |
| Payments of long-term borrowings | | | (607) | | | (972) | | | (163) | | | (6,776) | | | (5,454) | | | (6,082) | | | | | | | | | | | | (7,383) | | | (6,426) | | | (6,245) | | | |
| Proceeds from issuance of common stock | | | 331 | | | 178 | | | 217 | | | | | | | | | | | | | | | | | | | | | 331 | | | 178 | | | 217 | | | |
| Repurchases of common stock | | | (750) | | | (1,253) | | | (958) | | | | | | | | | | | | | | | | | | | | | (750) | | | (1,253) | | | (958) | | | |
| Capital investment from Equipment Operations | | | | | | | | | | | | 21 | | | 8 | | | | | | (21) | | | (8) | | | | | | | | | | | | | | 14 | |
| Dividends paid | | | (956) | | | (943) | | | (806) | | | (386) | | | (427) | | | (464) | | | 386 | | | 427 | | | 464 | | | (956) | | | (943) | | | (806) | | 14 | |
| Other | | | (105) | | | (79) | | | (60) | | | (28) | | | (38) | | | (32) | | | | | | 1 | | | (1) | | | (133) | | | (116) | | | (93) | | | |
| Net cash provided by (used for) financing activities | | | (885) | | | (2,175) | | | (2,353) | | | (460) | | | 2,264 | | | 2,766 | | | 365 | | | 420 | | | 463 | | | (980) | | | 509 | | | 876 | | | |
| | | | | | | | | | | | | | | | | | | | | | | | | | | | | | | | | | | | | | | | |
| Effect of Exchange Rate Changes on Cash, Cash Equivalents, and Restricted Cash | | | 76 | | | (42) | | | 54 | | | (44) | | | (14) | | | (28) | | | | | | | | | | | | 32 | | | (56) | | | 26 | | | |
| | | | | | | | | | | | | | | | | | | | | | | | | | | | | | | | | | | | | | | | |
| Net Increase (Decrease) in Cash, Cash Equivalents, and Restricted Cash | | | 2,960 | | | (6) | | | (4,972) | | | 256 | | | (53) | | | (480) | | | | | | | | | | | | 3,216 | | | (59) | | | (5,452) | | | |
| Cash, Cash Equivalents, and Restricted Cash at Beginning of Year | | | 3,196 | | | 3,202 | | | 8,174 | | | 760 | | | 813 | | | 1,293 | | | | | | | | | | | | 3,956 | | | 4,015 | | | 9,467 | | | |
| Cash, Cash Equivalents, and Restricted Cash at End of Year | | $ | 6,156 | | $ | 3,196 | | $ | 3,202 | | $ | 1,016 | | $ | 760 | | $ | 813 | | | | | | | | | | | $ | 7,172 | | $ | 3,956 | | $ | 4,015 | | | |
1 The equipment operations represents the enterprise without financial services. The equipment operations includes the company’s agriculture and turf operations, construction and forestry operations, and other corporate assets, liabilities, revenues, and expenses not reflected within financial services.
12 Elimination of depreciation on leases related to inventory transferred to equipment on operating leases (see Note 7).
13 Reclassification of share-based compensation expense.
14 Elimination of dividends from financial services to the equipment operations, which are included in the equipment operations net cash provided by operating activities, and capital investments in financial services from the equipment operations.
15 Primarily reclassification of receivables related to the sale of equipment.
16 Reclassification of lease agreements with direct customers.
17 Reclassification of sales incentive accruals on receivables sold to financial services
18 Elimination and reclassification of the effects of financial services partial financing of the construction and forestry retail locations sales and subsequent collection of those amounts (see Note 4).
FINANCIAL INSTRUMENT MARKET RISK INFORMATION
The company is naturally exposed to various interest rate and foreign currency risks. As a result, the company enters into derivative transactions to manage certain of these exposures that arise in the normal course of business and not for the purpose of creating speculative positions or trading. The company’s financial services operations manage the relationship of the types and amounts of their funding sources to their receivable and lease portfolio in an effort to diminish risk due to interest rate and foreign currency fluctuations while responding to favorable financing opportunities. In addition, the company has interest rate exposure at certain equipment operations units for below market retail financing programs that are used as sales incentives and are offered for extended periods. Accordingly, from time to time, these operations enter into interest rate swap agreements to manage their interest rate exposure. The company also has foreign currency exposures at some of its foreign and domestic operations related to buying, selling, and financing in currencies other than the functional currencies. The company has entered into agreements related to the management of these foreign currency transaction risks.
Interest Rate Risk
Quarterly, the company uses a combination of cash flow models to assess the sensitivity of its financial instruments with interest rate exposure to changes in market interest rates. The models calculate the effect of adjusting interest rates as follows: cash flows for financing receivables are discounted at the current prevailing rate for each receivable portfolio, cash flows for marketable securities are primarily discounted at the applicable benchmark yield curve plus market credit spreads, cash flows for unsecured borrowings are discounted at the applicable benchmark yield curve plus market credit spreads for similarly rated borrowers, cash flows for securitized borrowings are discounted at the swap yield curve plus a market credit spread for similarly rated borrowers, and cash flows for interest rate swaps are projected and discounted using forward rates from the swap yield curve at the repricing dates. The net loss in these financial instruments’ fair values which would be caused by increasing the interest rates by 10 percent from the market rates at November 1, 2020 would have been approximately $50 million. The net loss from increasing the interest rates by 10 percent at November 3, 2019 would have been approximately $22 million.
Foreign Currency Risk
In the equipment operations, the company’s practice is to hedge significant currency exposures. Worldwide foreign currency exposures are reviewed quarterly. Based on the equipment operations’ anticipated and committed foreign currency cash inflows, outflows, and hedging policy for the next twelve months, the company estimates that a hypothetical 10 percent strengthening of the U.S. dollar relative to other currencies through 2021 would decrease the 2021 expected net cash inflows by approximately $90 million. At November 3, 2019, a hypothetical 10 percent weakening of the U.S. dollar under similar assumptions and calculations indicated a potential $11 million adverse effect on the 2020 net cash inflows.
In the financial services operations, the company’s policy is to hedge the foreign currency risk if the currency of the borrowings does not match the currency of the receivable portfolio. As a result, a hypothetical 10 percent adverse change in the value of the U.S. dollar relative to all other foreign currencies would not have a material effect on the financial services cash flows.
DEERE & COMPANY
STATEMENT OF CONSOLIDATED INCOM****E
For the Years Ended November 1, 2020, November 3, 2019, and October 28, 2018
(In millions of dollars and shares except per share amounts)
| | | | | | | | | | | |
|---|---|---|---|---|---|---|---|---|---|---|
| | 2020 | 2019 | 2018 | |||||||
| Net Sales and Revenues | | | | | | | | | | |
| Net sales | | $ | 31,272 | | $ | 34,886 | | $ | 33,351 | |
| Finance and interest income | | 3,450 | | 3,493 | | 3,107 | | |||
| Other income | | 818 | | 879 | | 900 | | |||
| Total | | 35,540 | | 39,258 | | 37,358 | | |||
| | | | | | | | | | | |
| Costs and Expenses | | | | | | | | | | |
| Cost of sales | | 23,677 | | 26,792 | | 25,571 | | |||
| Research and development expenses | | 1,644 | | 1,783 | | 1,658 | | |||
| Selling, administrative and general expenses | | 3,477 | | 3,551 | | 3,455 | | |||
| Interest expense | | 1,247 | | 1,466 | | 1,204 | | |||
| Other operating expenses | | 1,612 | | 1,578 | | 1,399 | | |||
| Total | | 31,657 | | 35,170 | | 33,287 | | |||
| | | | | | | | | | | |
| Income of Consolidated Group before Income Taxes | | 3,883 | | 4,088 | | 4,071 | | |||
| Provision for income taxes | | 1,082 | | 852 | | 1,727 | | |||
| | | | | | | | | | | |
| Income of Consolidated Group | | 2,801 | | 3,236 | | 2,344 | | |||
| Equity in income (loss) of unconsolidated affiliates | | (48) | | 21 | | 27 | | |||
| | | | | | | | | | | |
| Net Income | | 2,753 | | 3,257 | | 2,371 | | |||
| Less: Net income attributable to noncontrolling interests | | 2 | | 4 | | 3 | | |||
| Net Income Attributable to Deere & Company | | $ | 2,751 | | $ | 3,253 | | $ | 2,368 | |
| | | | | | | | | | | |
| Per Share Data | | | | | | | | | | |
| Basic | | $ | 8.77 | | $ | 10.28 | | $ | 7.34 | |
| Diluted | | $ | 8.69 | | $ | 10.15 | | $ | 7.24 | |
| Dividends declared | | $ | 3.04 | | $ | 3.04 | | $ | 2.58 | |
| | | | | | | | | | | |
| Average Shares Outstanding | | | | | | | | | | |
| Basic | | 313.5 | | 316.5 | | 322.6 | | |||
| Diluted | | 316.6 | | 320.6 | | 327.3 | |
The notes to consolidated financial statements are an integral part of this statement.
DEERE & COMPANY
STATEMENT OF CONSOLIDATED COMPREHENSIVE IN****COME
For the Years Ended November 1, 2020, November 3, 2019, and October 28, 2018
(In millions of dollars)
| | | | | | | | | | | |
|---|---|---|---|---|---|---|---|---|---|---|
| | 2020 | 2019 | 2018 | |||||||
| Net Income | | $ | 2,753 | | $ | 3,257 | | $ | 2,371 | |
| | | | | | | | | | | |
| Other Comprehensive Income (Loss), Net of Income Taxes | | | | | | | | | | |
| Retirement benefits adjustment | | (3) | | (678) | | 1,052 | | |||
| Cumulative translation adjustment | | 55 | | (448) | | (195) | | |||
| Unrealized gain (loss) on derivatives | | 2 | | (75) | | 9 | | |||
| Unrealized gain (loss) on debt securities | | 14 | | 29 | | (13) | | |||
| | | | | | | | | | | |
| Other Comprehensive Income (Loss), Net of Income Taxes | | 68 | | (1,172) | | 853 | | |||
| | | | | | | | | | | |
| Comprehensive Income of Consolidated Group | | 2,821 | | 2,085 | | 3,224 | | |||
| Less: Comprehensive income attributable to noncontrolling interests | | 2 | | 4 | | 2 | | |||
| Comprehensive Income Attributable to Deere & Company | | $ | 2,819 | | $ | 2,081 | | $ | 3,222 | |
The notes to consolidated financial statements are an integral part of this statement.
DEERE & COMPANY
CONSOLIDATED BALANCE SHEET
As of November 1, 2020 and November 3, 2019
(In millions of dollars)
| | | | | | | | |
|---|---|---|---|---|---|---|---|
| | 2020 | 2019 | |||||
| ASSETS | | | | | | | |
| Cash and cash equivalents | | $ | 7,066 | | $ | 3,857 | |
| Marketable securities | | 641 | | 581 | | ||
| Receivables from unconsolidated affiliates | | 31 | | 46 | | ||
| Trade accounts and notes receivable - net | | 4,171 | | 5,230 | | ||
| Financing receivables - net | | 29,750 | | 29,195 | | ||
| Financing receivables securitized - net | | 4,703 | | 4,383 | | ||
| Other receivables | | 1,220 | | 1,487 | | ||
| Equipment on operating leases - net | | 7,298 | | 7,567 | | ||
| Inventories | | 4,999 | | 5,975 | | ||
| Property and equipment - net | | 5,817 | | 5,973 | | ||
| Investments in unconsolidated affiliates | | 193 | | 215 | | ||
| Goodwill | | 3,081 | | 2,917 | | ||
| Other intangible assets - net | | 1,327 | | 1,380 | | ||
| Retirement benefits | | 863 | | 840 | | ||
| Deferred income taxes | | 1,499 | | 1,466 | | ||
| Other assets | | 2,432 | | 1,899 | | ||
| Total Assets | | $ | 75,091 | | $ | 73,011 | |
| | | | | | | | |
| LIABILITIES AND STOCKHOLDERS’ EQUITY | | | | | | | |
| | | | | | | | |
| LIABILITIES | | | | | | | |
| Short-term borrowings | | $ | 8,582 | | $ | 10,784 | |
| Short-term securitization borrowings | | 4,682 | | 4,321 | | ||
| Payables to unconsolidated affiliates | | 105 | | 142 | | ||
| Accounts payable and accrued expenses | | 10,112 | | 9,656 | | ||
| Deferred income taxes | | 519 | | 495 | | ||
| Long-term borrowings | | 32,734 | | 30,229 | | ||
| Retirement benefits and other liabilities | | 5,413 | | 5,953 | | ||
| Total liabilities | | 62,147 | | 61,580 | | ||
| | | | | | | | |
| Commitments and contingencies (Note 21) | | | | | | | |
| Redeemable noncontrolling interest (Note 5) | | | | | | 14 | |
| | | | | | | | |
| STOCKHOLDERS’ EQUITY | | | | | | | |
| Common stock, $1 par value (authorized – 1,200,000,000 shares; issued – 536,431,204 shares in 2020 and 2019), at paid-in amount | | 4,895 | | 4,642 | | ||
| Common stock in treasury, 222,775,254 shares in 2020 and 223,290,789 shares in 2019, at cost | | (18,065) | | (17,474) | | ||
| Retained earnings | | 31,646 | | 29,852 | | ||
| Accumulated other comprehensive income (loss) | | (5,539) | | (5,607) | | ||
| Total Deere & Company stockholders’ equity | | 12,937 | | 11,413 | | ||
| Noncontrolling interests | | 7 | | 4 | | ||
| Total stockholders’ equity | | 12,944 | | 11,417 | | ||
| Total Liabilities and Stockholders’ Equity | | $ | 75,091 | | $ | 73,011 | |
The notes to consolidated financial statements are an integral part of this statement.
DEERE & COMPANY
STATEMENT OF CONSOLIDATED CASH F****LOWS
For the Years Ended November 1, 2020, November 3, 2019, and October 28, 2018
(In millions of dollars)
| | | | | | | | | | | |
|---|---|---|---|---|---|---|---|---|---|---|
| | 2020 | 2019 | 2018 | |||||||
| Cash Flows from Operating Activities | | | | | | | | | | |
| Net income | | $ | 2,753 | | $ | 3,257 | | $ | 2,371 | |
| Adjustments to reconcile net income to net cash provided by operating activities: | | | | | | | | | | |
| Provision for credit losses | | 110 | | 43 | | 90 | | |||
| Provision for depreciation and amortization | | 2,118 | | 2,019 | | 1,927 | | |||
| Impairment charges | | 194 | | 77 | | | | |||
| Share-based compensation expense | | 81 | | 82 | | 84 | | |||
| (Gain) loss on sales of businesses and unconsolidated affiliates | | | 24 | | | 5 | | | (25) | |
| Undistributed earnings of unconsolidated affiliates | | (7) | | 9 | | (26) | | |||
| Provision (credit) for deferred income taxes | | (11) | | (465) | | 1,480 | | |||
| Changes in assets and liabilities: | | | | | | | | | | |
| Trade, notes, and financing receivables related to sales | | 2,009 | | (869) | | (1,531) | | |||
| Inventories | | 397 | | (780) | | (1,772) | | |||
| Accounts payable and accrued expenses | | (7) | | 46 | | 722 | | |||
| Accrued income taxes payable/receivable | | 8 | | 173 | | (466) | | |||
| Retirement benefits | | (537) | | (233) | | (1,026) | | |||
| Other | | 351 | | 48 | | (6) | | |||
| Net cash provided by operating activities | | 7,483 | | 3,412 | | 1,822 | | |||
| | | | | | | | | | | |
| Cash Flows from Investing Activities | | | | | | | | | | |
| Collections of receivables (excluding receivables related to sales) | | 17,381 | | 16,706 | | 15,589 | | |||
| Proceeds from maturities and sales of marketable securities | | 93 | | 89 | | 76 | | |||
| Proceeds from sales of equipment on operating leases | | 1,783 | | 1,648 | | 1,483 | | |||
| Proceeds from sales of businesses and unconsolidated affiliates, net of cash sold | | | | 93 | | 156 | | |||
| Cost of receivables acquired (excluding receivables related to sales) | | (19,965) | | (18,873) | | (17,013) | | |||
| Acquisitions of businesses, net of cash acquired | | | (66) | | | | (5,245) | | ||
| Purchases of marketable securities | | (130) | | (140) | | (133) | | |||
| Purchases of property and equipment | | (820) | | (1,120) | | (896) | | |||
| Cost of equipment on operating leases acquired | | (1,836) | | (2,329) | | (2,054) | | |||
| Collateral on derivatives - net | | | 268 | | | 59 | | | (59) | |
| Other | | (27) | | (57) | | (80) | | |||
| Net cash used for investing activities | | (3,319) | | (3,924) | | (8,176) | | |||
| | | | | | | | | | | |
| Cash Flows from Financing Activities | | | | | | | | | | |
| Increase (decrease) in total short-term borrowings | | (1,360) | | (917) | | 473 | | |||
| Proceeds from long-term borrowings | | 9,271 | | 9,986 | | 8,288 | | |||
| Payments of long-term borrowings | | (7,383) | | (6,426) | | (6,245) | | |||
| Proceeds from issuance of common stock | | 331 | | 178 | | 217 | | |||
| Repurchases of common stock | | (750) | | (1,253) | | (958) | | |||
| Dividends paid | | (956) | | (943) | | (806) | | |||
| Other | | (133) | | (116) | | (93) | | |||
| Net cash provided by (used for) financing activities | | (980) | | 509 | | 876 | | |||
| | | | | | | | | | | |
| Effect of Exchange Rate Changes on Cash, Cash Equivalents, and Restricted Cash | | 32 | | (56) | | 26 | | |||
| | | | | | | | | | | |
| Net Increase (Decrease) in Cash, Cash Equivalents, and Restricted Cash | | 3,216 | | (59) | | (5,452) | | |||
| Cash, Cash Equivalents, and Restricted Cash at Beginning of Year | | 3,956 | | 4,015 | | 9,467 | | |||
| Cash, Cash Equivalents, and Restricted Cash at End of Year | | $ | 7,172 | | $ | 3,956 | | $ | 4,015 | |
The notes to consolidated financial statements are an integral part of this statement.
DEERE & COMPANY
STATEMENT OF CHANGES IN CONSOLIDATED STOCKHOLDERS**’ EQUITY**
For the Years Ended October 28, 2018, November 3, 2019, and November 1, 2020
(In millions of dollars)
| | | | | | | | | | | | | | | | | | | | | | | | |
|---|---|---|---|---|---|---|---|---|---|---|---|---|---|---|---|---|---|---|---|---|---|---|---|
| | | | | | Total Stockholders’ Equity | | | | | | |||||||||||||
| | | | | | Deere & Company Stockholders | | | | | | | | | ||||||||||
| | | | | | | | | | Accumulated | | | | | | |||||||||
| | | Total | | | | | | | | | | | Other | | | | | Redeemable | |||||
| | | Stockholders’ | | Common | | Treasury | | Retained | | Comprehensive | | Noncontrolling | | | Noncontrolling | | |||||||
| | | Equity | | Stock | | Stock | | Earnings | | Income (Loss) | | Interests | | | Interest | | |||||||
| Balance October 29, 2017 | | $ | 9,560 | | $ | 4,281 | | $ | (15,461) | | $ | 25,301 | | $ | (4,564) | | $ | 3 | | | $ | 14 | |
| | | | | | | | | | | | | | | | | | | | | | | | |
| Net income | | 2,370 | | | | | | | | | 2,368 | | | | | | 2 | | | | 1 | | |
| Other comprehensive income (loss) | | 853 | | | | | | | | | | | | 854 | | | (1) | | | | | ||
| Repurchases of common stock | | (958) | | | | | | (958) | | | | | | | | | | | | | | | |
| Treasury shares reissued | | 107 | | | | | | 107 | | | | | | | | | | | | | | | |
| Dividends declared | | (836) | | | | | | | | | (834) | | | | | | (2) | | | (1) | | ||
| Acquisition (Note 4) | | | 1 | | | | | | | | | | | | | | | 1 | | | | | |
| Stock options and other | | 194 | | | 193 | | | | | | 1 | | | | | | | | | | | | |
| ASU No. 2018-02 adoption | | | | | | | | | | | | 717 | | | (717) | | | | | | | | |
| Balance October 28, 2018 | | 11,291 | | 4,474 | | (16,312) | | 27,553 | | (4,427) | | 3 | | | 14 | | |||||||
| | | | | | | | | | | | | | | | | | | | | | | | |
| ASU No. 2016-01 adoption | | | | | | | | | | | | 8 | | | (8) | | | | | | | | |
| Net income | | 3,257 | | | | | | | | | 3,253 | | | | | | 4 | | | | | | |
| Other comprehensive loss | | (1,172) | | | | | | | | | | | | (1,172) | | | | | | | | ||
| Repurchases of common stock | | (1,253) | | | | | | (1,253) | | | | | | | | | | | | | | | |
| Treasury shares reissued | | 91 | | | | | | 91 | | | | | | | | | | | | | | | |
| Dividends declared | | (965) | | | | | | | | | (963) | | | | | | (2) | | | | | ||
| Stock options and other | | 168 | | | 168 | | | | | | 1 | | | | | | (1) | | | | | | |
| Balance November 3, 2019 | | 11,417 | | 4,642 | | (17,474) | | 29,852 | | (5,607) | | 4 | | | 14 | | |||||||
| | | | | | | | | | | | | | | | | | | | | | | | |
| Net income | | 2,752 | | | | | | | | | 2,751 | | | | | | 1 | | | | 1 | | |
| Other comprehensive income | | 68 | | | | | | | | | | | | 68 | | | | | | | | ||
| Repurchases of common stock | | (750) | | | | | | (750) | | | | | | | | | | | | | | | |
| Treasury shares reissued | | 159 | | | | | | 159 | | | | | | | | | | | | | | | |
| Dividends declared | | (956) | | | | | | | | | (955) | | | | | | (1) | | | (1) | | ||
| Noncontrolling interest redemption (Note 5) | | | | | | | | | | | | | | | | | | | | | | (14) | |
| Stock options and other | | 254 | | | 253 | | | | | | (2) | | | | | | 3 | | | | | | |
| Balance November 1, 2020 | | $ | 12,944 | | $ | 4,895 | | $ | (18,065) | | $ | 31,646 | | $ | (5,539) | | $ | 7 | | | | | |
The notes to consolidated financial statements are an integral part of this statement.
NOTES TO CONSOLIDATED FINANCIAL STATEMENTS
1. ORGANIZATION AND CONSOLIDATION
Structure of Operations
The information in the notes and related commentary are presented in a format that includes data grouped as follows:
Equipment Operations – Represents the enterprise without financial services, while including the company’s agriculture and turf operations, construction and forestry operations, and other corporate assets, liabilities, revenues, and expenses not reflected within financial services.
Financial Services – Includes primarily the company’s financing operations.
Consolidated – Represents the consolidation of the equipment operations and financial services. References to “Deere & Company” or “the company” refer to the entire enterprise.
Principles of Consolidation
The consolidated financial statements represent primarily the consolidation of all companies in which Deere & Company has a controlling interest. Certain variable interest entities (VIEs) are consolidated since the company is the primary beneficiary. The primary beneficiary has both the power to direct the activities that most significantly impact the VIEs’ economic performance and the obligation to absorb losses or the right to receive benefits that could potentially be significant to the VIEs. Deere & Company records its investment in each unconsolidated affiliated company (generally 20 to 50 percent ownership) at its related equity in the net assets of such affiliate (see Note 11). Other investments (less than 20 percent ownership) are recorded at cost.
Fiscal Year
The company uses a 52/53 week fiscal year ending on the last Sunday in the reporting period. The fiscal year ends for 2020, 2019, and 2018 were November 1, 2020, November 3, 2019, and October 28, 2018, respectively. Fiscal years 2020 and 2018 contained 52 weeks compared to 53 weeks in fiscal year 2019.
Variable Interest Entities
The company consolidates certain VIEs related to retail note securitizations (see Note 14).
The company also has an interest in a joint venture that manufactures construction equipment in Brazil for local and overseas markets. The joint venture is a VIE; however, the company is not the primary beneficiary. Therefore, the entity’s financial results are not fully consolidated in the company’s consolidated financial statements but are included on the equity basis. During 2019, the company made an additional contribution to the joint venture in exchange for non-voting preferred stock and terminated a loan guarantee. In 2020, the investment in the joint venture was impaired (see Note 5). The maximum exposure to loss was $5 million and $22 million at November 1, 2020 and November 3, 2019, respectively.
2. SUMMARY OF SIGNIFICANT ACCOUNTING POLICIES
The following are significant accounting policies in addition to those included in other notes to the consolidated financial statements.
Use of Estimates in Financial Statements
The preparation of financial statements in conformity with accounting principles generally accepted in the U.S. requires management to make estimates and assumptions that affect the reported amounts and related disclosures. The COVID pandemic has resulted in uncertainties in the company’s business, which may result in actual results differing from those estimates.
Revenue Recognition
Sales of equipment and service parts are recognized when each of the following criteria are met: (1) the company and an independent customer approve a contract with commercial substance, (2) the sales price is determinable and collectability of the payments are probable based on the terms outlined in the contract, and (3) control of the goods has transferred to the customer. Transfer of control generally occurs for equipment and service parts when the good is delivered as specified in the contract and the risks and rewards of ownership are transferred. In the U.S. and most international locations, this transfer occurs primarily when goods are shipped. In Canada and some other international locations, certain goods are shipped to dealers on a consignment basis under which the risks and rewards of ownership are not transferred to the dealer at the time the goods are shipped. Accordingly, in these locations, sales are not recorded until a retail customer has purchased the goods. Generally, no right of return exists on sales of equipment.
In limited instances, equipment is transferred to a customer or a financial institution with an obligation to repurchase the equipment for a specified amount, which is exercisable at the customer’s option. When the equipment is expected to be repurchased, those arrangements are accounted for as leases. When the operating lease criteria are met, no sale is recorded at the time of the equipment transfer and the difference between sale price and the specified repurchase amount is recognized as revenue on a straight-line basis until the customer’s option expires. When this equipment is not expected to be repurchased, a sale is recorded with a return obligation.
Under the terms of sales agreements with dealers, interest-free periods are determined based on the type of equipment sold and the time of year of the sale. These periods range from one to twelve months for most equipment. Interest-free periods may not be extended. Interest is primarily charged to dealers on outstanding balances, from the earlier of the date when goods are sold to a retail customer by the dealer or the expiration of the interest-free period granted at the time of the sale to the dealer, until payment is received by the company. Interest charged may not be forgiven and the past due interest rates exceed market rates. In 2020, short-term payment relief was provided to dealers due to the economic effects of COVID (see Note 13). Dealers cannot cancel purchases after the company recognizes a sale and are responsible for payment even if the equipment is not sold to retail customers. If the interest-free or below market interest rate period exceeds one year, the company adjusts the expected sales revenue for the effects of the time value of money using a current market interest rate. The revenue related to the financing
component is recognized in “Finance and interest income” using the interest method. The company does not adjust the sales price to account for a financing component if the expected interest-free or below market period is one year or less.
Service parts and certain attachments returns are estimable and accrued at the time a sale is recognized. The estimated parts returns are recorded in “Other assets” for the inventory value of estimated part returns, adjusted for restocking fees. The estimated dealer refund liability, adjusted for restocking fees, is recorded in “Accounts payable and accrued expenses.” The estimated returns are based on historical return rates, current dealer inventory levels, and current economic conditions.
The company remanufactures used engines and components (cores) that are sold to dealers and end customers for maintenance and repair parts. Revenue for remanufactured components is recognized using the same criteria as other parts sales. When a remanufactured part is sold, the company collects a deposit that is repaid if the customer returns a core that meets certain specifications within a defined time period. The deposit received from the customer is recognized as a liability in “Accounts payable and accrued expenses” and the used component that is expected to be returned is recognized in “Other assets” in the consolidated balance sheet. When a customer returns a core, the deposit is repaid, the liability reversed, and the returned core is recorded in inventory to be remanufactured and sold to another customer. If a core is not returned within the required time as estimated, the deposit is recognized as revenue in “Net sales,” and the estimated core return is recorded as an expense in “Cost of sales” in the statement of consolidated income.
Certain equipment is sold with precision guidance, telematics, and other information gathering and analyzing capabilities. The solutions require hardware, software, and include an obligation to provide telematic services for a specific period of time. These solutions are generally bundled with the sale of the equipment, but can also be purchased or renewed separately. The revenue related to the hardware and embedded software is generally recognized at the time of the equipment sale and recorded in “Net sales” in the statement of consolidated income. The revenue for the future services is generally deferred and recognized over the service period. The deferred revenue is recorded as a contract liability in “Accounts payable and accrued expenses” in the consolidated balance sheet and is recognized in “Other income” with the associated expenses recognized in “Other operating expenses” in the statement of consolidated income.
Financing revenue is recorded over the lives of the related receivables using the interest method. Deferred costs on the origination of financing receivables are recognized as a reduction in “Finance and interest income” over the expected lives of the receivables using the interest method. Income and deferred costs on the origination of operating leases are recognized on a straight-line basis over the scheduled lease terms in “Finance and interest income.”
Sales Incentives
In certain markets, the company provides sales incentives to dealers. These incentives may be based on a dealer’s purchase volume or on retail sales incentive programs for allowances and financing programs that will be due when the dealer sells the equipment to a retail customer. At the time of the sale to a dealer, the company records an estimated cost of these programs as a reduction to the sales price. The estimated cost is based on historical data, announced and expected incentive programs, field inventory levels, and forecasted sales volumes. The final cost of these programs is determined at the end of the measurement period for volume-based incentives or when the dealer sells the equipment to a retail customer. Actual cost differences from the original cost estimate are recognized in “Net sales.”
Product Warranties
For most equipment and parts sales, the company provides a standard warranty to provide assurance that the equipment will function as intended for a specified period. At the time a sale is recognized, the estimated future warranty costs are recorded. The company generally determines its total warranty liability by applying historical warranty claims rate experience to the estimated amount of equipment that has been sold and is still under warranty based on dealer inventories and retail sales. The historical claims rate is primarily determined by a review of five-year claims costs with consideration of current quality developments. The company also offers extended warranty arrangements for purchase at the customer’s option. The premiums for extended warranties are recognized in “Other income” in the statement of consolidated income primarily in proportion to the costs expected to be incurred over the contract period. The unamortized extended warranty premiums (deferred revenue) are recorded in “Accounts payable and accrued expenses” in the consolidated balance sheet (see Note 21).
Sales and Transaction Taxes
The company collects and remits taxes assessed by different governmental authorities that are both imposed on and concurrent with revenue producing transactions between the company and its customers. These taxes include sales, use, value-added, and some excise taxes. The company elected to exclude these taxes from the determination of the sales price (excluded from revenues).
Shipping and Handling Costs
Shipping and handling costs related to the sales of the company’s equipment after a customer obtains control of the equipment are accrued at the time of the sale in “Cost of sales.”
Contract Costs
Incremental costs of obtaining a revenue contract are recognized as an expense when incurred since the amortization period would be one year or less.
Advertising Costs
Advertising costs are charged to expense as incurred. This expense was $196 million in 2020, $215 million in 2019, and $188 million in 2018.
Depreciation and Amortization
Property and equipment, capitalized software, and other intangible assets are generally stated at cost less accumulated depreciation or amortization. These assets are depreciated over their estimated useful lives generally using the straight-line method. Equipment on operating leases is depreciated over the terms of the leases using the straight-line method. Property and equipment expenditures for new and revised products, increased capacity, and the replacement or major renewal of significant items are capitalized. Expenditures for maintenance, repairs, and minor renewals are generally charged to expense as incurred.
Securitization of Receivables
Certain financing receivables are periodically transferred to special purpose entities (SPEs) in securitization transactions (see Note 14). These securitizations qualify as collateral for secured borrowings and no gains or losses are recognized at the time of securitization. The receivables remain on the balance sheet and are classified as “Financing receivables securitized - net.” The company recognizes finance income over the lives of these receivables using the interest method.
Receivables and Allowances
All financing and trade receivables are reported on the balance sheet at outstanding principal adjusted for any charge-offs, the allowance for credit losses, and any deferred fees or costs on originated financing receivables. The company also records an allowance and provision for credit losses related to the receivables from sales (trade receivables and certain financing receivables). The allowance is a reduction to the receivable balances and the provision is recorded in “Selling, administrative and general expenses.” The allowance represents an estimate of the losses inherent in the receivable portfolio. The level of the allowance is based on many qualitative and quantitative factors, including historical net loss experience by finance product category, portfolio duration, delinquency trends, economic conditions in the company’s major markets and geographies, commodity price trends, and credit risk quality. The adequacy of the allowance is assessed quarterly by finance product category. Receivables are written-off to the allowance when the account is considered uncollectible (see Note 13).
Impairment of Long-Lived Assets, Goodwill, and Other Intangible Assets
The company evaluates the carrying value of long-lived assets (including equipment on operating leases, property and equipment, goodwill, and other intangible assets) when events or circumstances warrant such a review. Goodwill and intangible assets with indefinite lives are tested for impairment annually at the end of the third quarter of each fiscal year, and more often if events or circumstances indicate a reduction in the fair value below the carrying value. Goodwill is allocated and reviewed for impairment by reporting units, which consist primarily of the operating segments and certain other reporting units. Goodwill is allocated to the reporting unit in which the business that created the goodwill resides. To test for goodwill impairment, the carrying value of each reporting unit is compared with its fair value. If the carrying value of the goodwill is considered impaired, the
impairment is measured as the excess of the reporting unit’s carrying value over the fair value, with a limit of the goodwill allocated to that reporting unit. If the carrying value of the long-lived asset is considered impaired, a loss is recognized based on the amount by which the carrying value exceeds the fair value of the asset (see Notes 5 and 26).
Derivative Financial Instruments
The company’s policy is derivative transactions are executed only to manage exposures arising in the normal course of business and not for the purpose of creating speculative positions or trading. The company’s financial services operations manage the relationship of the types and amounts of their funding sources to their receivable and lease portfolio in an effort to diminish risk due to interest rate and foreign currency fluctuations, while responding to favorable financing opportunities. The company also has foreign currency exposures at some of its foreign and domestic operations related to buying, selling, and financing in currencies other than the functional currencies. In addition, the company has interest rate exposure at certain equipment operations units for below market retail financing programs that are used as sales incentives and are offered for extended periods.
All derivatives are recorded at fair value on the balance sheet. Cash collateral received or paid is not offset against the derivative fair values on the balance sheet. Each derivative is designated as a cash flow hedge, fair value hedge, or remains undesignated. Changes in the fair value of derivatives that are designated and effective as cash flow hedges are recorded in other comprehensive income (OCI) and reclassified to the income statement when the effects of the item being hedged are recognized in the income statement. Changes in the fair value of derivatives that are designated and effective as fair value hedges are recognized currently in net income. These changes are offset in net income by fair value changes related to the risk being hedged on the hedged item. Changes in the fair value of undesignated hedges are recognized currently in the income statement.
All designated hedges are formally documented as to the relationship with the hedged item as well as the risk-management strategy. Both at inception and on an ongoing basis the hedging instrument is assessed as to its effectiveness. If and when a derivative is determined not to be highly effective as a hedge, the underlying hedged transaction is no longer likely to occur, the hedge designation is removed, or the derivative is terminated, hedge accounting is discontinued (see Note 27).
Foreign Currency Translation
The functional currencies for most of the company’s foreign operations are their respective local currencies. The assets and liabilities of these operations are translated into U.S. dollars at the end of the period exchange rates. The revenues and expenses are translated at weighted-average rates for the period. The gains or losses from these translations are recorded in OCI. Gains or losses from transactions denominated in a currency other than the functional currency of the subsidiary involved and foreign exchange derivative contracts are included in net income. The
pretax net gain (loss) for foreign exchange in 2020, 2019, and 2018 was $18 million, $(13) million, and $(8) million, respectively.
3. NEW ACCOUNTING STANDARDS
New Accounting Standards Adopted
In the first quarter of 2020, the company adopted Financial Accounting Standards Board (FASB) Accounting Standards Update (ASU) No. 2016-02, Leases (Topic 842), which supersedes Accounting Standards Codification (ASC) 840, Leases. This ASU was adopted using a modified-retrospective approach. The ASU’s primary change is the requirement for lessee entities to recognize a lease liability for payments and a right of use asset during the term of operating lease arrangements. The ASU did not significantly change the lessee’s recognition, measurement, and presentation of expenses and cash flows from the previous accounting standard. Lessors’ accounting under the ASC is largely unchanged from the previous accounting standard. The ASU adds new disclosures about the company’s leasing activities. The company elected the optional practical expedients to not reassess whether existing contracts contain leases, not reassess lease classification, and not reassess initial direct costs for existing leases. The company did not elect the hindsight practical expedient. In addition, the company elected to combine lease and nonlease components for all asset classes and to not recognize a right of use asset or lease liability for arrangements that qualify as short-term leases.
The operating lease liabilities are recorded in “Accounts payable and accrued expenses” and the operating lease right of use assets are recorded in “Other assets.” The finance lease liabilities are recorded in “Short-term borrowings” or “Long-term borrowings” based on the remaining lease term, and the finance lease right of use assets are recorded in “Property and equipment - net.” In addition to the lease liabilities and right of use assets, land use rights were reclassified from “Other intangible assets - net” to “Other assets” and finance lease liabilities were reclassified from “Accounts payable and accrued expenses” to “Short-term borrowings” and “Long-term borrowings.” The effect of adopting the ASU on the consolidated balance sheet follows in millions of dollars:
| | | | | | | | | | | |
|---|---|---|---|---|---|---|---|---|---|---|
| | | November 3 | | Cumulative Effect | | November 4 | | |||
| | | 2019 | | from Adoption | | 2019 | | |||
| Assets | | | | | | | | | | |
| Other intangible assets - net | | $ | 1,380 | | $ | (23) | | $ | 1,357 | |
| Other assets | | | 1,899 | | | 402 | | | 2,301 | |
| Liabilities | | | | | | | | | | |
| Short-term borrowings | | $ | 10,784 | | $ | 11 | | $ | 10,795 | |
| Accounts payable and accrued expenses | | | 9,656 | | | 348 | | | 10,004 | |
| Long-term borrowings | | | 30,229 | | | 20 | | | 30,249 | |
The company implemented a new system for lessee accounting with new processes and controls at the time of adopting the ASU. The adoption did not have a material effect on the company’s operating results or cash flows. See Note 25 for additional information.
The company also adopted the following standards in 2020, none of which had a material effect on the company’s consolidated financial statements:
| | |
|---|---|
| Accounting Standards Updates | |
| No. 2017-08—Premium Amortization on Purchased Callable Debt Securities, which amends ASC 310-20, Receivables – Nonrefundable Fees and Other Costs | |
| No. 2018-07—Improvements to Nonemployee Share-Based Payment Accounting, which amends ASC 718, Compensation – Stock Compensation | |
| No. 2019-04—Codification Improvements to Topic 326, Financial Instruments – Credit Losses, Topic 815, Derivatives and Hedging, and Topic 825, Financial Instruments. The adoption was for clarifications to ASU No. 2017-12, Targeted Improvements to Accounting for Hedging Activities | |
| No. 2020-04—Facilitation of the Effects of Reference Rate Reform on Financial Reporting, which establishes ASC 848, Reference Rate Reform | |
New Accounting Standards to be Adopted
In June 2016, the FASB issued ASU No. 2016-13, Measurement of Credit Losses on Financial Instruments, which establishes ASC 326, Financial Instruments – Credit Losses. The ASU, along with related amendments, revises the measurement of credit losses for financial assets measured at amortized cost from an incurred loss to an expected loss methodology. The ASU affects receivables, debt securities, net investment in leases, and most other financial assets that represent a right to receive cash.
The company holds deposits from dealers (dealer deposits) to absorb certain credit losses. Prior to adopting this ASU, the allowance for credit losses was estimated on probable credit losses incurred after consideration of dealer deposits. The ASU considers dealer deposits and certain credit insurance contracts as freestanding credit enhancements. As a result, after adoption, credit losses recovered from dealer deposits and credit insurance contracts will be presented in “Other income” and no longer as part of the allowance for credit losses or the provision for credit losses. The ASU will also modify the treatment of the estimated write-off of delinquent receivables by no longer including the estimated benefit of charges to the dealer deposit in the write-off amount (see Note 13). This change will increase the estimated write-offs on delinquent financing receivables with the benefit of credit losses recovered from dealer deposits also presented in “Other income.” This benefit, in both situations, will be recorded when the dealer deposits are charged and no longer based on estimated recoveries.
The ASU also requires additional disclosures about significant estimates and credit quality. The effective date is the first quarter of fiscal year 2021. The ASU will be adopted using a modified-retrospective approach resulting in an estimated after-tax reduction to “Retained earnings” of $30 million.
The company will also adopt the following standards in future periods, none of which are expected to have a material effect on the company’s consolidated financial statements:
| | |
|---|---|
| Accounting Standards Updates | |
| No. 2018-15—Customer’s Accounting for Implementation Costs Incurred in a Cloud Computing Arrangement That Is a Service Contract, which amends ASC 350-40, Intangibles – Goodwill and Other – Internal-Use Software | |
| No. 2019-04—Codification Improvements to Topic 326, Financial Instruments-Credit Losses, Topic 815, Derivatives and Hedging, and Topic 825, Financial Instruments | |
| No. 2019-12—Simplifying the Accounting for Income Taxes, which amends ASC 740, Income Taxes | |
| No. 2020-08—Codification Improvements to Subtopic 310-20, Receivables – Nonrefundable Fees and Other Costs | |
4. ACQUISITIONS AND DISPOSITIONS
Acquisitions
Unimil
In September 2020, the company acquired Unimil, a leading Brazilian company in the after-sales service parts business for sugarcane harvesters, which is based in Piracicaba, Brazil. The total cash purchase price before final adjustments, net of cash acquired of $5 million, was $66 million, with $6 million funded to an escrow to secure certain indemnity obligations. In addition to the cash purchase price, $14 million of liabilities were assumed. The preliminary asset and liability fair values at the acquisition date in millions of dollars follow:
| | | | | |
|---|---|---|---|---|
| | | September 2020 | | |
| Trade accounts and notes receivable | | $ | 5 | |
| Other receivables | | | 2 | |
| Inventories | | | 10 | |
| Property and equipment | | | 22 | |
| Goodwill | | | 28 | |
| Other intangible assets | | | 13 | |
| Total assets | | $ | 80 | |
| | | | | |
| Accounts payable and accrued expenses | | $ | 5 | |
| Deferred income taxes | | | 9 | |
| Total liabilities | | $ | 14 | |
The identified intangibles were primarily related to customer relationships, trade name, and a non-compete agreement. The weighted-average amortization period is approximately nine years. The goodwill is not expected to be deductible for tax purposes.
PLA
On September 26, 2018, the company acquired PLA, a privately-held manufacturer of sprayers, planters, and specialty products for agriculture. PLA is based in Argentina, with manufacturing facilities in Las Rosas, Argentina and Canoas, Brazil. The total cash purchase price, net of cash acquired of $1 million, was $69 million with $4 million retained by the company as escrow to secure indemnity obligations. In addition to the cash purchase price, the company assumed $30 million of liabilities. The asset and liability fair values at the acquisition date in millions of dollars follow:
| | | | | |
|---|---|---|---|---|
| | | September 2018 | | |
| Trade accounts and notes receivable | | $ | 3 | |
| Other receivables | | | 14 | |
| Inventories | | 15 | | |
| Property and equipment | | | 6 | |
| Goodwill | | 38 | | |
| Other intangible assets | | 22 | | |
| Other assets | | | 1 | |
| Total assets | | $ | 99 | |
| | | | | |
| Short-term borrowings | | $ | 8 | |
| Accounts payable and accrued expenses | | | 17 | |
| Deferred income taxes | | | 5 | |
| Total liabilities | | $ | 30 | |
The identified intangible assets were primarily related to technology, trademarks, and customer relationships, which have a weighted-average amortization period of five years. The goodwill is not deductible for tax purposes.
King Agro
In March 2018, the company acquired King Agro, a privately held manufacturer of carbon fiber technology products with headquarters in Valencia, Spain and a production facility in Campana, Argentina. The total cash purchase price, net of cash acquired of $3 million, was $40 million, excluding a loan to King Agro of $4 million that was forgiven on the acquisition date. In addition to the cash purchase price, the company assumed $11 million of liabilities. The asset and liability fair values at the acquisition date in millions of dollars follow:
| | | | | |
|---|---|---|---|---|
| | | March 2018 | | |
| Trade accounts and notes receivable | | $ | 2 | |
| Other receivables | | | 2 | |
| Inventories | | 5 | | |
| Property and equipment | | | 5 | |
| Goodwill | | 28 | | |
| Other intangible assets | | 13 | | |
| Total assets | | $ | 55 | |
| | | | | |
| Short-term borrowings | | $ | 2 | |
| Accounts payable and accrued expenses | | | 4 | |
| Deferred income taxes | | | 4 | |
| Long-term borrowings | | | 1 | |
| Total liabilities | | $ | 11 | |
The identifiable intangibles were primarily related to trade name and technology, which have a weighted-average amortization period of ten years. The goodwill is not deductible for tax purposes.
Wirtgen
In December 2017, the company acquired Wirtgen, which was a privately-held international company and is the leading manufacturer worldwide of road construction equipment. Headquartered in Germany, Wirtgen has six brands across the roadbuilding sector spanning processing, mixing, paving, compaction, and rehabilitation. Wirtgen sells products in more than 100 countries and had approximately 8,200 employees at the acquisition date.
The total cash purchase price, net of cash acquired of $191 million, was $5,136 million, a portion of which is held in escrow to secure certain indemnity obligations of Wirtgen. In addition to the cash purchase price, the company assumed $1,641 million in liabilities, which represented substantially all of Wirtgen’s liabilities. The company financed the acquisition and associated transaction expenses from a combination of cash and new debt financing, which consisted of medium-term notes, including €850 million issued in September 2017. The asset and liability fair values at the acquisition date in millions of dollars follow:
| | | | | |
|---|---|---|---|---|
| | | December 2017 | | |
| Receivables from unconsolidated affiliates | | $ | 5 | |
| Trade accounts and notes receivable | | | 449 | |
| Financing receivables | | | 43 | |
| Financing receivables securitized | | | 125 | |
| Other receivables | | | 98 | |
| Inventories | | 1,536 | | |
| Property and equipment | | | 752 | |
| Investments in unconsolidated affiliates | | | 19 | |
| Goodwill | | 2,068 | | |
| Other intangible assets | | 1,442 | | |
| Deferred income taxes | | | 26 | |
| Other assets | | 215 | | |
| Total assets | | $ | 6,778 | |
| | | | | |
| Short-term borrowings | | $ | 285 | |
| Short-term securitization borrowings | | | 127 | |
| Accounts payable and accrued expenses | | | 719 | |
| Deferred income taxes | | | 430 | |
| Long-term borrowings | | | 50 | |
| Retirement benefits and other liabilities | | | 30 | |
| Total liabilities | | $ | 1,641 | |
| Noncontrolling interests | | $ | 1 | |
The identifiable intangible assets’ fair values in millions of dollars and weighted-average useful lives in years follows:
| | | | | | | |
|---|---|---|---|---|---|---|
| | | Weighted-Average Useful Lives | | Fair Values | | |
| Customer lists and relationships | | 16 | | $ | 519 | |
| Technology, patents, trademarks, and other | | 19 | | $ | 923 | |
The goodwill is not deductible for tax purposes.
Wirtgen’s results are incorporated in the company’s consolidated financial statements using a one-month lag period and are included in the construction and forestry segment. The net sales and revenues and operating profit included in the company’s statement of consolidated income in 2018 was $3,181 million and $116 million, respectively. During 2018, the company recognized $56 million of acquisition related costs, which were recorded $30 million in “Selling, administrative and general expenses” and $26 million in “Other operating expenses.”
The unaudited pro forma consolidated net sales and revenues and net income for 2018 were prepared as if the acquisition closed at the beginning of fiscal year 2017 and follow in millions of dollars:
| | | | | |
|---|---|---|---|---|
| | | 2018 | | |
| Net sales and revenues | | $ | 37,822 | |
| Net income attributable to Deere & Company | | $ | 2,637 | |
The pro forma amounts were calculated using policies consistent with the company’s accounting policies and included the additional expense from the amortization from the allocated purchase price adjustments. The pro forma results excluded acquisition related costs incurred in 2017 and 2018 and assumed the medium-term notes used to fund the acquisition were issued in fiscal year 2016 at the interest rate of the actual notes. Anticipated synergies or other expected benefits of the acquisition were not included in the pro forma results. As a result, the unaudited pro forma financial information may not have been indicative of the results for future operations or the results if the acquisition closed at the beginning of fiscal year 2017.
For the acquisitions, the goodwill was the result of future cash flows and related fair value exceeding the fair value of the identified assets and liabilities. For the acquisitions other than Wirtgen, the results of these operations have been included in the company’s consolidated financial statements in the agriculture and turf operating segment and the pro forma results of operations as if these acquisitions had occurred at the beginning of the current or comparative fiscal year would not differ significantly from the reported results.
Dispositions
In September 2020, the company sold its German lawn mower business. At the time of the sale, total assets were $26 million, which were recorded in “Other assets” and total liabilities were $5 million, which were recorded in “Accounts payable and accrued expenses.” No cash proceeds were received, resulting in a loss on sale, including transaction costs, of $24 million pretax and after-tax. The loss was recorded with a pretax and after-tax accrual recognized in the third quarter of 2020 when a definitive sale agreement was finalized. The loss was recorded in “Other operating expenses” in the agriculture and turf segment.
In October 2019, the company sold its construction and forestry retail locations in Canada. At the time of the sale, total assets were $187 million consisting of inventory of $138 million, property and equipment – net of $24 million, other assets of $3 million, and goodwill of $22 million. The liabilities consisted of $10 million of accounts payable and accrued expenses. In addition, the company accrued $15 million for transaction expenses and related costs. The total proceeds from the sale were approximately $187 million, with $93 million received in 2019 and $67 million received in 2020. The remaining sales price was due based on standard payment terms of new equipment sales to independent dealers and separately negotiated terms ranging from 12 months to five years. A pretax loss of approximately $5 million was recorded in “Other operating expenses” in the construction and forestry segment.
In May 2018, the company sold construction and forestry retail locations in Michigan, Minnesota, and Wisconsin. At the time of the sale, total assets were $74 million and liabilities were approximately $2 million. The assets consisted of trade accounts and notes receivable – net of $3 million, inventory of $52 million, property and equipment – net of $11 million, and goodwill of $8 million. The liabilities consisted of $2 million of accounts payable and accrued expenses. The total proceeds from the sale were approximately $84 million, with $67 million received in 2018. The remaining sales price was due based on standard payment terms of new equipment sales to independent dealers or refinanced wholesale terms. A pretax gain of $12 million was recorded in “Other income” in the construction and forestry segment.
In November 2017, the company sold its construction and forestry retail locations in Florida. At the time of the sale, total assets were $93 million and liabilities were $1 million. The assets consisted of inventory of $61 million, property and equipment – net of $21 million, goodwill of $10 million, and $1 million of other assets. The liabilities consisted of $1 million of accounts payable and accrued expenses. The total proceeds from the sale were approximately $105 million, with $89 million received in 2018. The remaining sales price was due based on standard payment terms of new equipment sales to independent dealers or refinanced wholesale terms. A pretax gain of $13 million was recorded in “Other income” in the construction and forestry segment.
For the retail location dispositions, the company sells equipment, service parts, and provides other services to the purchasers as independent dealers.
5. SPECIAL ITEMS
Impairments and Other Charges
In 2020, the company recorded impairments and other charges as follows:
| | | | | | | | | | | | | | |
|---|---|---|---|---|---|---|---|---|---|---|---|---|---|
| | | Agriculture | | Construction | | Financial | | Total | | ||||
| | | and Turf | | and Forestry | | Services | | Pretax | | ||||
| Factory closure | | | | | | | | | | ||||
| China - agricultural equipment | | | | | | | | | | | | | |
| Non-cash impairments | | | | | | | | | | | | | |
| Other receivables, property, and intangible assets * | | $ | 15 | | | | | | | | $ | 15 | |
| Severance payments * | | | 5 | | | | | | | | | 5 | |
| Factory closure | | | 20 | | | | | | | | | 20 | |
| | | | | | | | | | | | | | |
| Non-cash fixed asset and lease impairments | | | | | | | | | | | | | |
| German asphalt plant factory * 1 | | | | | $ | 62 | | | | | | 62 | |
| Brazil construction equipment factory * 1 | | | | | | 16 | | | | | | 16 | |
| Other international fixed assets * 1 | | | 13 | | | 2 | | | | | | 15 | |
| Other international fixed assets ** 1 | | | 4 | | | | | | | | | 4 | |
| Equipment on operating leases *** 2 | | | | | | | | $ | 22 | | | 22 | |
| Operating lease inventory *** 2 | | | | | | | | | 10 | | | 10 | |
| Fixed asset and lease - non-cash impairments | | | 17 | | | 80 | | | 32 | | | 129 | |
| | | | | | | | | | | | | | |
| Non-cash affiliate company impairments | | | | | | | | | | | | | |
| Minority investment in construction equipment company headquartered in South Africa **** 3 | | | | | | 43 | | | | | | 43 | |
| Construction equipment joint venture located in Brazil **** 3 | | | | | | 7 | | | | | | 7 | |
| Affiliate impairments | | | | | | 50 | | | | | | 50 | |
| Total impairments and closure costs 4, 5 | | $ | 37 | | $ | 130 | | $ | 32 | | $ | 199 | |
- Recorded in "Cost of sales"
** Recorded in "Selling, administrative, and general expenses"
*** Recorded in "Other operating expenses"
****Recorded in "Equity in income (loss) of unconsolidated affiliate"
1 The impairment was the result of a decline in forecasted financial performance that indicated it was probable future cash flows would not cover the carrying amount of net assets.
2 The impairments were the result of a higher expected equipment return rates and lower estimated values of used construction equipment than originally estimated with the probable effect that future cash flows would not cover the carrying amount of the asset.
3 The impairment was the result of an other-than-temporary decline in value.
4 The after-tax effect was $180 million.
5 See Note 26 for a description of the valuation methodologies used to measure these impairments.
In the fourth quarter of 2019, the company recorded non-cash charges in “Other operating expenses” of approximately $59 million pretax for the impairment of equipment on operating leases and approximately $18 million pretax on matured operating lease inventory recorded in “Other assets.” The impairment was the result of lower estimated values of used agriculture and construction equipment than originally estimated with the probable effect that the future cash flows would not cover the carrying amount of the net assets. The assets are part of the financial services operations (see Note 26).
Employee-Separation Programs
During 2020, the company implemented employee-separation programs for the company’s salaried workforce in several geographic areas, including the United States, Europe, Asia, and Latin America. The programs’ main purpose was to improve efficiency through a leaner, more flexible organization. The programs were largely voluntary in nature with the expense recorded primarily in the period in which the employees irrevocably accepted a separation offer. For the limited involuntary employee-separation programs, the expense was recorded when management committed to a plan, the plan was communicated to the employees, and the employees were not required to provide service beyond the legal notification period. The programs provided for cash payments based on years of service, and in some countries subsidized healthcare for a limited period and outplacement services.
The programs’ total pretax expenses in 2020 were as follows:
| | | | | | | | | | | | | | |
|---|---|---|---|---|---|---|---|---|---|---|---|---|---|
| | | Agriculture | | Construction | | Financial | | | | ||||
| | | and Turf | | and Forestry | | Services | | Total | | ||||
| Cost of sales | | $ | 82 | $ | 22 | | | $ | 104 | | |||
| Research and development expenses | | | 47 | | | 8 | | | | | | 55 | |
| Selling, administrative and general expenses | | | 96 | | | 24 | | $ | 15 | | | 135 | |
| Other operating expenses* | | | | | | | | | | | | 41 | |
| Total | | $ | 225 | | $ | 54 | | $ | 15 | | $ | 335 | |
- Relates primarily to non-cash charges of $34 million from curtailments in certain OPEB plans (see Note 8) and other corporate expenses, both of which were recorded outside of operating profit. Approximately $6 million of the curtailment charge was recorded by financial services.
Total program payments will be $301 million with $166 million paid in 2020 and $135 million to be disbursed over two years. Annual savings from these programs are estimated to be approximately $250 million, of which $85 million was realized in 2020.
During 2019, the company also completed certain employee-separation programs designed for specific functions and geographic areas as part of its on-going efforts to create a more efficient organizational structure. These programs provided for cash payments based on years of service. The expenses were
recorded in the period the employees irrevocably accepted the separation offer with the following total pretax expenses:
| | | | | | | | | | | | | | |
|---|---|---|---|---|---|---|---|---|---|---|---|---|---|
| | | Agriculture | | Construction | | Financial | | | | ||||
| | | and Turf | | and Forestry | | Services | | Total | | ||||
| Cost of sales | | $ | 5 | | | | | $ | 5 | | |||
| Research and development expenses | | | 1 | | | | | | | | | 1 | |
| Selling, administrative and general expenses | | | 13 | | $ | 2 | | $ | 9 | | | 24 | |
| Total | | $ | 19 | | $ | 2 | | $ | 9 | | $ | 30 | |
Redeemable Noncontrolling Interest
In 2020, the minority interest holder in Hagie Manufacturing Company, LLC exercised its right to sell the remaining 20 percent interest to the company for $14 million. The arrangement was accounted for as an equity transaction with no gain or loss recorded in the statement of consolidated income. This operation is included in the company’s agriculture and turf segment.
6. REVENUE RECOGNITION
The company’s net sales and revenues by primary geographical market, major product line, and timing of revenue recognition in millions of dollars follow:
| | | | | | | | | | | | | | |
|---|---|---|---|---|---|---|---|---|---|---|---|---|---|
| | | Agriculture and Turf | | Construction and Forestry | | Financial Services | | Total | | ||||
| 2020 | | | | | | | | | | | | | |
| Primary geographical markets: | | | | | | | | | | | | | |
| United States | | $ | 11,948 | | $ | 4,548 | | $ | 2,500 | | $ | 18,996 | |
| Canada | | | 990 | | | 802 | | | 598 | | | 2,390 | |
| Western Europe | | | 3,764 | | | 1,479 | | | 90 | | | 5,333 | |
| Central Europe and CIS | | | 1,391 | | | 646 | | | 35 | | | 2,072 | |
| Latin America | | | 2,236 | | | 553 | | | 234 | | | 3,023 | |
| Asia, Africa, Australia, New Zealand, and Middle East | | | 2,441 | | | 1,153 | | | 132 | | | 3,726 | |
| Total | | $ | 22,770 | | $ | 9,181 | | $ | 3,589 | | $ | 35,540 | |
| | | | | | | | | | | | | | |
| Major product lines: | | | | | | | | | | | | | |
| Large Agriculture | | $ | 11,387 | | | | | | | | $ | 11,387 | |
| Small Agriculture | | | 8,102 | | | | | | | | | 8,102 | |
| Turf | | | 2,390 | | | | | | | | | 2,390 | |
| Construction | | | | | $ | 3,521 | | | | | | 3,521 | |
| Compact Construction | | | | | | 1,269 | | | | | | 1,269 | |
| Roadbuilding | | | | | | 2,924 | | | | | | 2,924 | |
| Forestry | | | | | | 1,100 | | | | | | 1,100 | |
| Financial Products | | | 106 | | | 25 | | $ | 3,589 | | | 3,720 | |
| Other | | | 785 | | | 342 | | | | | | 1,127 | |
| Total | | $ | 22,770 | | $ | 9,181 | | $ | 3,589 | | $ | 35,540 | |
| | | | | | | | | | | | | | |
| Timing of revenue recognition: | | | | | | | | | | | | | |
| Revenue recognized at a point in time | | $ | 22,545 | | $ | 9,071 | | $ | 106 | | $ | 31,722 | |
| Revenue recognized over time | | | 225 | | | 110 | | | 3,483 | | | 3,818 | |
| Total | | $ | 22,770 | | $ | 9,181 | | $ | 3,589 | | $ | 35,540 | |
| | | | | | | | | | | | | | |
|---|---|---|---|---|---|---|---|---|---|---|---|---|---|
| | | Agriculture and Turf | | Construction and Forestry | | Financial Services | | Total | | ||||
| 2019 | | | | | | | | | | | | | |
| Primary geographical markets: | | | | | | | | | | | | | |
| United States | | $ | 12,362 | | $ | 6,082 | | $ | 2,482 | | $ | 20,926 | |
| Canada | | | 1,096 | | | 1,107 | | | 617 | | | 2,820 | |
| Western Europe | | | 3,866 | | | 1,586 | | | 87 | | | 5,539 | |
| Central Europe and CIS | | | 1,423 | | | 749 | | | 37 | | | 2,209 | |
| Latin America | | | 2,894 | | | 719 | | | 272 | | | 3,885 | |
| Asia, Africa, Australia, New Zealand, and Middle East | | | 2,488 | | | 1,265 | | | 126 | | | 3,879 | |
| Total | | $ | 24,129 | | $ | 11,508 | | $ | 3,621 | | $ | 39,258 | |
| | | | | | | | | | | | | | |
| Major product lines: | | | | | | | | | | | | | |
| Large Agriculture | | $ | 11,727 | | | | | | | | $ | 11,727 | |
| Small Agriculture | | | 8,696 | | | | | | | | | 8,696 | |
| Turf | | | 2,650 | | | | | | | | | 2,650 | |
| Construction | | | | | $ | 5,188 | | | | | | 5,188 | |
| Compact Construction | | | | | | 1,279 | | | | | | 1,279 | |
| Roadbuilding | | | | | | 3,193 | | | | | | 3,193 | |
| Forestry | | | | | | 1,403 | | | | | | 1,403 | |
| Financial Products | | | 100 | | | 30 | | $ | 3,621 | | | 3,751 | |
| Other | | | 956 | | | 415 | | | | | | 1,371 | |
| Total | | $ | 24,129 | | $ | 11,508 | | $ | 3,621 | | $ | 39,258 | |
| | | | | | | | | | | | | | |
| Timing of revenue recognition: | | | | | | | | | | | | | |
| Revenue recognized at a point in time | | $ | 23,915 | | $ | 11,391 | | $ | 111 | | $ | 35,417 | |
| Revenue recognized over time | | | 214 | | | 117 | | | 3,510 | | | 3,841 | |
| Total | | $ | 24,129 | | $ | 11,508 | | $ | 3,621 | | $ | 39,258 | |
Following is a description of the company’s major product lines:
Large Agriculture – Includes net sales of tractors with more than approximately 200 horsepower and associated attachments, combines, cotton pickers, cotton strippers, and sugarcane harvesters; harvesting front-end equipment; sugarcane loaders and pull behind scrapers; tillage, seeding, and application equipment, including sprayers, nutrient management and soil preparation machinery; self-propelled forage harvesters, and related attachments and service parts.
Small Agriculture – Includes net sales of medium and utility tractors with less than approximately 200 horsepower, hay and forage equipment, balers, mowers, and related attachments and service parts.
Turf – Includes net sales of turf and utility equipment, including riding lawn equipment, golf course equipment, utility vehicles, and commercial mowing equipment, along with a broad line of associated implements, other outdoor power products, and related service parts.
Construction – Includes net sales of a broad range of machines used in construction, earthmoving, and material handling, including backhoe loaders, crawler dozers and loaders, four-wheel-drive loaders, excavators, motor graders, articulated dump trucks, and related attachments and service parts.
Compact Construction – Includes net sales of smaller construction equipment, including compact excavators, compact track loaders,
compact wheel loaders, skid steers, landscape loaders, and related attachments and service parts.
Roadbuilding – Includes net sales of equipment used in roadbuilding and renovation, including milling machines, recyclers, slipform pavers, surface miners, asphalt pavers, compactors, tandem and static rollers, mobile crushers and screens, mobile and stationary asphalt plants, and related attachments and service parts.
Forestry – Includes net sales of equipment used in timber harvesting, including log skidders, feller bunchers, log loaders, log forwarders, log harvesters, and related attachments and service parts.
Financial Products – Includes finance and interest income primarily from retail notes related to sales of John Deere equipment to end customers, wholesale financing to dealers of John Deere equipment, and revolving charge accounts; lease income from retail leases of John Deere equipment; and revenue from extended warranties.
Other – Includes sales of certain components to other equipment manufacturers, revenue earned over time from precision guidance, telematics, and other information enabled solutions, revenue from service performed at company owned dealerships and service centers, gains on disposition of property and businesses, trademark licensing revenue, and other miscellaneous revenue items.
The company invoices in advance of recognizing the sale of certain products and the revenue for certain services. These items are primarily for premiums for extended warranties, advance payments for future equipment sales, and subscription and service revenue related to precision guidance and telematic services. These advanced customer payments are presented as deferred revenue, a contract liability, in “Accounts payable and accrued expenses” in the consolidated balance sheet. The deferred revenue received, but not recognized in revenue, including extended warranty premiums also shown in Note 21, was $1,090 million and $1,010 million at November 1, 2020 and November 3, 2019, respectively. The contract liability is reduced as the revenue is recognized. Revenue recognized from deferred revenue that was recorded as a contract liability at the beginning of the fiscal year was $425 million in 2020 and $444 million in 2019.
The company entered into contracts with customers to deliver equipment and services that have not been recognized at November 1, 2020 because the equipment or services have not been provided. These contracts primarily relate to extended warranty and certain precision guidance and telematic services. The amount of unsatisfied performance obligations for contracts with an original duration greater than one year is $912 million at November 1, 2020. The estimated revenue to be recognized by fiscal year follows in millions of dollars: 2021 - $337, 2022 - $265, 2023 - $172, 2024 - $88, 2025 - $45, and later years - $5. As permitted, the company elected only to disclose remaining performance obligations with an original contract duration greater than one year. The contracts with an expected duration of one
year or less are generally for sales to dealers and end customers for equipment, service parts, repair services, and certain telematics services.
7. CASH FLOW INFORMATION
For purposes of the statement of consolidated cash flows, the company considers investments with purchased maturities of three months or less to be cash equivalents. Substantially all of the company’s short-term borrowings, excluding the current maturities of finance lease obligations and long-term borrowings, mature or may require payment within three months or less.
The equipment operations sell a significant portion of their trade receivables to financial services. These intercompany cash flows are eliminated in the consolidated cash flows.
All cash flows from the changes in trade accounts and notes receivable (see Note 13) are classified as operating activities in the statement of consolidated cash flows as these receivables arise from sales to the company’s customers. Cash flows from financing receivables that are related to sales to the company’s customers (see Note 13) are also included in operating activities. The remaining financing receivables are related to the financing of equipment sold by independent dealers and are included in investing activities.
The company had the following non-cash operating and investing activities that were not included in the statement of consolidated cash flows. The company transferred inventory to equipment on operating leases of $614 million, $678 million, and $855 million in 2020, 2019, and 2018, respectively. The company also had accounts payable related to purchases of property and equipment of $98 million, $152 million, and $183 million at November 1, 2020, November 3, 2019, and October 28, 2018, respectively.
The company’s restricted cash held at November 1, 2020, November 3, 2019, October 28, 2018, and October 29, 2017 was as follows in millions of dollars:
| | | | | | | | | | | | | | |
|---|---|---|---|---|---|---|---|---|---|---|---|---|---|
| | | 2020 | | 2019 | | 2018 | | 2017 | | ||||
| Equipment operations | | $ | 11 | | $ | 21 | | $ | 7 | | $ | 6 | |
| Financial services | | | 95 | | | 78 | | | 104 | | | 126 | |
| Total | | $ | 106 | | $ | 99 | | $ | 111 | | $ | 132 | |
The equipment operations restricted cash relates to miscellaneous operational activities. The financial services restricted cash primarily relates to securitization of financing receivables (see Note 14). The restricted cash is recorded in “Other assets” in the consolidated balance sheet.
Cash payments for interest and income taxes consisted of the following in millions of dollars:
| | | | | | | | | | | |
|---|---|---|---|---|---|---|---|---|---|---|
| | 2020 | 2019 | 2018 | |||||||
| Interest: | | | | | | | | | | |
| Equipment operations | | $ | 553 | | $ | 666 | | $ | 581 | |
| Financial services | | 998 | | 1,154 | | 925 | | |||
| Intercompany eliminations | | (272) | | (360) | | (330) | | |||
| Consolidated | | $ | 1,279 | | $ | 1,460 | | $ | 1,176 | |
| Income taxes: | | | | | | | | | | |
| Equipment operations | | $ | 1,000 | | $ | 1,018 | | $ | 625 | |
| Financial services | | 297 | | (57) | | 387 | | |||
| Intercompany eliminations | | (228) | | 150 | | (300) | | |||
| Consolidated | | $ | 1,069 | | $ | 1,111 | | $ | 712 | |
8. PENSION AND OTHER POSTRETIREMENT BENEFITS
The company has several funded and unfunded defined benefit pension plans and other postretirement benefit (OPEB) plans, primarily health care and life insurance plans, covering its U.S. employees and employees in certain foreign countries. The company uses an October 31 measurement date for these plans.
The components of net periodic pension cost and the assumptions related to the cost consisted of the following in millions of dollars and in percents:
| | | | | | | | | | | |
|---|---|---|---|---|---|---|---|---|---|---|
| | 2020 | 2019 | 2018 | |||||||
| Pensions | | | | | | | | | | |
| Service cost | $ | 321 | | $ | 261 | | $ | 293 | | |
| Interest cost | | 347 | | 447 | | 390 | | |||
| Expected return on plan assets | | (819) | | (802) | | (775) | | |||
| Amortization of actuarial loss | | 256 | | 148 | | 226 | | |||
| Amortization of prior service cost | | 13 | | 11 | | 12 | | |||
| Settlements/curtailments | | 25 | | 5 | | 8 | | |||
| Net cost | | $ | 143 | | $ | 70 | | $ | 154 | |
| Weighted-average assumptions | | | | | | | | | | |
| Discount rates - service cost | | | 2.9% | | | 4.0% | | | 3.5% | |
| Discount rates - interest cost | | | 2.7% | | | 4.0% | | | 3.2% | |
| Rate of compensation increase | | | 3.8% | | | 3.8% | | | 3.8% | |
| Expected long-term rates of return | | | 6.4% | | | 6.5% | | | 6.9% | |
| Interest crediting rate - U.S. cash balance plan | | | 2.1% | | | 3.3% | | | 2.6% | |
The components of net periodic OPEB cost and the assumptions related to the cost consisted of the following in millions of dollars and in percents:
| | | | | | | | | | | |
|---|---|---|---|---|---|---|---|---|---|---|
| | 2020 | 2019 | 2018 | |||||||
| OPEB | | | | | | | | | | |
| Service cost | | $ | 49 | | $ | 41 | | $ | 45 | |
| Interest cost | | 140 | | 216 | | 191 | | |||
| Expected return on plan assets | | (50) | | (36) | | (22) | | |||
| Amortization of actuarial loss | | 29 | | 16 | | 62 | | |||
| Amortization of prior service credit | | (4) | | (72) | | (77) | | |||
| Curtailments | | 34 | | | | | | | | |
| Net cost | | $ | 198 | | $ | 165 | | $ | 199 | |
| Weighted-average assumptions | | | | | | | | | | |
| Discount rates - service cost | | | 3.7% | | | 4.8% | | | 4.3% | |
| Discount rates - interest cost | | | 2.7% | | | 4.2% | | | 3.3% | |
| Expected long-term rates of return | | | 5.7% | | | 5.7% | | | 5.7% | |
The OPEB curtailments are a result of the employee-separation programs (see Note 5).
The spot yield curve approach is used to estimate the service and interest cost components of the net periodic pension and OPEB costs by applying the specific spot rates along the yield curve used to determine the benefit plan obligations to relevant projected cash outflows. The components of net periodic pension and OPEB cost excluding the service component are primarily included in the line item “Other operating expenses” in the statement of consolidated income.
The previous pension cost in net income and other changes in plan assets and benefit obligations in other comprehensive income in millions of dollars were as follows:
| | | | | | | | | | | |
|---|---|---|---|---|---|---|---|---|---|---|
| | 2020 | 2019 | 2018 | |||||||
| Pensions | | | | | | | | | | |
| Net cost | | $ | 143 | | $ | 70 | | $ | 154 | |
| Retirement benefit adjustments included in other comprehensive (income) loss: | | | | | | | | | | |
| Net actuarial (gain) loss | | 438 | | 887 | | (553) | | |||
| Amortization of actuarial loss | | (249) | | (143) | | (226) | | |||
| Amortization of prior service cost | | (11) | | (11) | | (12) | | |||
| Settlements | | (26) | | (3) | | (8) | | |||
| Total (gain) loss recognized in other comprehensive (income) loss | | 152 | | 730 | | (799) | | |||
| Total recognized in comprehensive (income) loss | | $ | 295 | | $ | 800 | | $ | (645) | |
The previous OPEB cost in net income and other changes in plan assets and benefit obligations in other comprehensive income in millions of dollars were as follows:
| | | | | | | | | | | |
|---|---|---|---|---|---|---|---|---|---|---|
| | 2020 | 2019 | 2018 | |||||||
| OPEB | | | | | | | | | | |
| Net cost | | $ | 198 | | $ | 165 | | $ | 199 | |
| Retirement benefit adjustments included in other comprehensive (income) loss: | | | | | | | | | | |
| Net actuarial (gain) loss | | (136) | | 141 | | (608) | | |||
| Prior service cost | | | | | | 5 | | |||
| Amortization of actuarial loss | | (29) | | (16) | | (62) | | |||
| Amortization of prior service credit | | 4 | | 72 | | 77 | | |||
| Total (gain) loss recognized in other comprehensive (income) loss | | (161) | | 197 | | (588) | | |||
| Total recognized in comprehensive (income) loss | | $ | 37 | | $ | 362 | | $ | (389) | |
The benefit plan obligations, funded status, and the assumptions related to the obligations at November 1, 2020 and November 3, 2019, respectively, in millions of dollars follow:
| | | | | | | | | | | | | | |
|---|---|---|---|---|---|---|---|---|---|---|---|---|---|
| | | Pensions | | OPEB | | ||||||||
| | | 2020 | | 2019 | | 2020 | | 2019 | | ||||
| Change in benefit obligations | | | | | | | |||||||
| Beginning of year balance | | $ | (14,250) | | $ | (12,108) | | $ | (5,622) | | $ | (5,472) | |
| Service cost | | (321) | | (261) | | (49) | | (41) | | ||||
| Interest cost | | (347) | | (447) | | (140) | | (216) | | ||||
| Actuarial gain (loss) | | (771) | | (2,174) | | 119 | | (187) | | ||||
| Benefits paid | | 749 | | 705 | | 297 | | 316 | | ||||
| Health care subsidies | | | | | | | | (28) | | (22) | | ||
| Settlements/curtailments | | 15 | | | | | | | | | | ||
| Foreign exchange and other | | (96) | | 35 | | 13 | | | | ||||
| End of year balance | | (15,021) | | (14,250) | | (5,410) | | (5,622) | | ||||
| | | | | | | | | | | | | | |
| Change in plan assets (fair value) | | | | | | | | | | | | | |
| Beginning of year balance | | 14,024 | | 12,602 | | 936 | | 719 | | ||||
| Actual return on plan assets | | 1,144 | | 2,081 | | 33 | | 82 | | ||||
| Employer contribution | | 108 | | 70 | | 843 | | 448 | | ||||
| Benefits paid | | (749) | | (705) | | (297) | | (316) | | ||||
| Settlements | | (12) | | | | | | | | | | ||
| Foreign exchange and other | | 59 | | (24) | | 3 | | 3 | | ||||
| End of year balance | | 14,574 | | 14,024 | | 1,518 | | 936 | | ||||
| Funded status | | $ | (447) | | $ | (226) | | $ | (3,892) | | $ | (4,686) | |
| | | | | | | | | | | | | | |
| Weighted-average assumptions | | | | | | | | | | | | | |
| Discount rates | | | 2.5% | | | 3.0% | | | 2.7% | | | 3.2% | |
| Rate of compensation increase | | | 3.7% | | | 3.8% | | | | | | | |
| Interest crediting rate - U.S. cash balance plan | | | 1.7% | | | 2.1% | | | | | | | |
The company made voluntary contributions of $700 million and $300 million to a U.S. OPEB plan in 2020 and 2019, respectively.
The actuarial loss for pension for 2020 was primarily due to a decrease in discount rates partially offset by a decrease in mortality assumptions. The actuarial gain for OPEB for 2020 was primarily due to the U.S. enactment of the Setting Every Community Up for Retirement Enhancement Act (SECURE Act) that repealed the health insurance provider fee effective in 2021, a decrease in mortality assumptions, and a decrease in health care trend rates, partially offset by a decrease in discount rates. The actuarial loss for pension for 2019 was primarily due to a decrease in discount rates. The actuarial loss for OPEB for 2019 was primarily due to a decrease in discount rates partially offset by a decrease in health care trend rates.
The mortality assumptions for the 2020 and 2019 benefit plan obligations reflect the most recent tables and scales issued by the Society of Actuaries at that time.
The amounts recognized at November 1, 2020 and November 3, 2019, respectively, in millions of dollars consist of the following:
| | | | | | | | | | | | | | |
|---|---|---|---|---|---|---|---|---|---|---|---|---|---|
| | | Pensions | | OPEB | | ||||||||
| | | 2020 | | 2019 | | 2020 | | 2019 | | ||||
| Amounts recognized in balance sheet | | | | | | | | ||||||
| Noncurrent asset | | $ | 863 | $ | 840 | | | | | | | ||
| Current liability | | (72) | | (56) | | $ | (36) | | $ | (35) | | ||
| Noncurrent liability | | (1,238) | | (1,010) | | (3,856) | | (4,651) | | ||||
| Total | | $ | (447) | | $ | (226) | | $ | (3,892) | | $ | (4,686) | |
| Amounts recognized in accumulated other comprehensive income – pretax | | | | | | | | | | | | | |
| Net actuarial loss | | $ | 4,475 | | $ | 4,312 | | $ | 747 | | $ | 912 | |
| Prior service cost (credit) | | 21 | | 32 | | (24) | | (28) | | ||||
| Total | | $ | 4,496 | | $ | 4,344 | | $ | 723 | | $ | 884 | |
The total accumulated benefit obligations for all pension plans at November 1, 2020 and November 3, 2019, were $14,257 million and $13,430 million, respectively.
The accumulated benefit obligations and fair value of plan assets for pension plans with accumulated benefit obligations in excess of plan assets were $2,107 million and $1,100 million, respectively, at November 1, 2020 and $1,836 million and $924 million, respectively, at November 3, 2019. The projected benefit obligations and fair value of plan assets for pension plans with projected benefit obligations in excess of plan assets were $10,792 million and $9,482 million, respectively, at November 1, 2020 and $10,097 million and $9,031 million, respectively, at November 3, 2019.
Actuarial gains and losses are recorded in accumulated other comprehensive income (loss). To the extent unamortized gains and losses exceed 10% of the higher of the market-related value of assets or the benefit obligation, the excess is amortized as a component of net periodic cost over the remaining service period of the active participants. For plans in which all or almost all of the plan’s participants are inactive, the amortization period is the remaining life expectancy of the inactive participants.
The company expects to contribute approximately $105 million to its pension plans and approximately $845 million to its OPEB plans in 2021. The anticipated OPEB contributions include a voluntary $700 million to a U.S. plan in the fourth quarter, which will increase plan assets. The pension and remaining OPEB contributions primarily include direct benefit payments from company funds.
The benefits expected to be paid from the benefit plans, which reflect expected future years of service, are as follows in millions of dollars:
| | | | | | | | |
|---|---|---|---|---|---|---|---|
| | Pensions | OPEB* | |||||
| 2021 | | $ | 765 | | $ | 297 | |
| 2022 | | 724 | | 297 | | ||
| 2023 | | 711 | | 297 | | ||
| 2024 | | 707 | | 297 | | ||
| 2025 | | 699 | | 298 | | ||
| 2026 to 2030 | | 3,450 | | 1,461 | |
- Net of prescription drug group benefit subsidy under Medicare Part D.
The annual rates of increase in the per capita cost of covered health care benefits (the health care cost trend rates) used to determine accumulated postretirement benefit obligations were based on the trends for medical and prescription drug claims for pre- and post-65 age groups due to the effects of Medicare. For the 2020 actuarial valuation, the weighted-average composite trend rates for these obligations were assumed to be a 4.0 percent increase from 2020 to 2021, followed by an increase of 7.6 percent from 2021 to 2022, gradually decreasing to 4.7 from 2027 to 2028 and all future years. The lower estimated increase from 2021 to 2022 resulted from the SECURE Act that repealed the health insurance provider fee effective in 2021. The 2019 obligations and the cost in 2020 assumed an 8.6 percent increase from 2019 to 2020, gradually decreasing to 4.7 percent from 2027 to 2028 and all future years.
The discount rate assumptions used to determine the pension and OPEB obligations for all periods presented were primarily based on hypothetical AA yield curves represented by a series of annualized individual discount rates. These discount rates represent the rates at which the company’s benefit obligations could effectively be settled at the October 31 measurement dates.
Fair value measurement levels in the following tables are defined in Note 26.
The fair values of the pension plan assets at November 1, 2020 follow in millions of dollars:
| | | | | | | | | | | |
|---|---|---|---|---|---|---|---|---|---|---|
| | Total | Level 1 | Level 2 | |||||||
| Cash and short-term investments | | $ | 309 | | $ | 276 | | $ | 33 | |
| Equity: | | | | | | | | | | |
| U.S. equity securities | | 1,184 | | 1,135 | | | 49 | | ||
| International equity securities | | 947 | | 937 | | | 10 | | ||
| Fixed Income: | | | | | | | | | | |
| Government and agency securities | | 1,133 | | 824 | | 309 | | |||
| Corporate debt securities | | 3,534 | | | | 3,534 | | |||
| Mortgage-backed securities | | 136 | | | | 136 | | |||
| Real estate | | 49 | | 48 | | 1 | | |||
| Derivative contracts – assets* | | 94 | | 2 | | 92 | | |||
| Derivative contracts – liabilities** | | (79) | | (43) | | (36) | | |||
| Receivables, payables, and other | | (163) | | (184) | | | 21 | | ||
| Securities lending collateral | | 449 | | | 90 | | 359 | | ||
| Securities lending liability | | (449) | | | (90) | | (359) | | ||
| Securities sold short | | (149) | | (144) | | | (5) | | ||
| Total of Level 1 and Level 2 assets | | | 6,995 | | $ | 2,851 | | $ | 4,144 | |
| Investments at net asset value: | | | | | | | | | | |
| Short-term investments | | | 510 | | | | | | | |
| U.S. equity funds | | | 1,246 | | | | | | | |
| International equity funds | | | 674 | | | | | | | |
| Fixed income funds | | | 1,321 | | | | | | | |
| Real estate | | | 618 | | | | | | | |
| Hedge funds | | | 750 | | | | | | | |
| Private equity/venture capital | | | 2,038 | | | | | | | |
| Other investments | | | 422 | | | | | | | |
| Total net assets | | $ | 14,574 | | | | | | | |
- Includes contracts for interest rates of $67 million, foreign currency of $25 million, and other of $2 million.
** Includes contracts for equity of $30 million, foreign currency of $24 million, interest rates of $23 million, and other of $2 million.
The fair values of the health care assets at November 1, 2020 follow in millions of dollars:
| | | | | | | | | | | |
|---|---|---|---|---|---|---|---|---|---|---|
| | Total | Level 1 | Level 2 | |||||||
| Cash and short-term investments | | $ | 117 | | $ | 117 | | | | |
| Equity: | | | | | | | | | | |
| U.S. equity securities and funds | | 34 | | 33 | | $ | 1 | | ||
| International equity securities | | 10 | | 10 | | | | | ||
| Fixed Income: | | | | | | | | | | |
| Government and agency securities | | 180 | | 168 | | | 12 | | ||
| Corporate debt securities | | 66 | | | | | 66 | | ||
| Mortgage-backed securities | | 13 | | | | | 13 | | ||
| Other | | (1) | | (1) | | | | | ||
| Securities lending collateral | | 49 | | | 8 | | 41 | | ||
| Securities lending liability | | (49) | | | (8) | | (41) | | ||
| Securities sold short | | (3) | | (3) | | | | | ||
| Total of Level 1 and Level 2 assets | | | 416 | | $ | 324 | | $ | 92 | |
| Investments at net asset value: | | | | | | | | | | |
| Short-term investments | | | 9 | | | | | | | |
| U.S. equity funds | | | 539 | | | | | | | |
| International equity funds | | | 320 | | | | | | | |
| Fixed income funds | | | 185 | | | | | | | |
| Hedge funds | | | 12 | | | | | | | |
| Private equity/venture capital | | | 25 | | | | | | | |
| Other investments | | | 12 | | | | | | | |
| Total net assets | | $ | 1,518 | | | | | | | |
The fair values of the pension plan assets at November 3, 2019 follow in millions of dollars:
| | | | | | | | | | | |
|---|---|---|---|---|---|---|---|---|---|---|
| | Total | Level 1 | Level 2 | |||||||
| Cash and short-term investments | | $ | 587 | | $ | 353 | | $ | 234 | |
| Equity: | | | | | | | | | | |
| U.S. equity securities | | 1,192 | | 1,156 | | | 36 | | ||
| International equity securities | | 981 | | 974 | | | 7 | | ||
| Fixed Income: | | | | | | | | | | |
| Government and agency securities | | 1,257 | | 970 | | 287 | | |||
| Corporate debt securities | | 2,416 | | | 1 | | 2,415 | | ||
| Mortgage-backed securities | | 90 | | | | 90 | | |||
| Real estate | | 69 | | 63 | | 6 | | |||
| Derivative contracts – assets* | | 208 | | 17 | | 191 | | |||
| Derivative contracts – liabilities** | | (47) | | (13) | | (34) | | |||
| Receivables, payables, and other | | (106) | | (107) | | | 1 | | ||
| Securities lending collateral | | 476 | | | | | 476 | | ||
| Securities lending liability | | (476) | | | | | (476) | | ||
| Securities sold short | | (279) | | (275) | | | (4) | | ||
| Total of Level 1 and Level 2 assets | | | 6,368 | | $ | 3,139 | | $ | 3,229 | |
| Investments at net asset value: | | | | | | | | | | |
| Short-term investments | | | 398 | | | | | | | |
| U.S. equity funds | | | 1,250 | | | | | | | |
| International equity funds | | | 764 | | | | | | | |
| Fixed income funds | | | 1,529 | | | | | | | |
| Real estate | | | 648 | | | | | | | |
| Hedge funds | | | 679 | | | | | | | |
| Private equity/venture capital | | | 1,913 | | | | | | | |
| Other investments | | | 475 | | | | | | | |
| Total net assets | | $ | 14,024 | | | | | | | |
- Includes contracts for interest rates of $171 million, foreign currency of $20 million, equity of $10 million, and other of $7 million.
** Includes contracts for foreign currency of $26 million, interest rates of $20 million, and other of $1 million.
The fair values of the health care assets at November 3, 2019 follow in millions of dollars:
| | | | | | | | | | | |
|---|---|---|---|---|---|---|---|---|---|---|
| | Total | Level 1 | Level 2 | |||||||
| Cash and short-term investments | | $ | 81 | | $ | 77 | | $ | 4 | |
| Equity: | | | | | | | | | | |
| U.S. equity securities and funds | | 41 | | 41 | | | | | ||
| International equity securities | | 9 | | 9 | | | | | ||
| Fixed Income: | | | | | | | | | | |
| Government and agency securities | | 112 | | 101 | | 11 | | |||
| Corporate debt securities | | 43 | | | | | 43 | | ||
| Mortgage-backed securities | | 15 | | | | | 15 | | ||
| Other | | | | | | (2) | | 2 | | |
| Securities lending collateral | | 20 | | | | | 20 | | ||
| Securities lending liability | | (20) | | | | | (20) | | ||
| Securities sold short | | (4) | | (4) | | | | | ||
| Total of Level 1 and Level 2 assets | | | 297 | | $ | 222 | | $ | 75 | |
| Investments at net asset value: | | | | | | | | | | |
| Short-term investments | | | 4 | | | | | | | |
| U.S. equity funds | | | 311 | | | | | | | |
| International equity funds | | | 197 | | | | | | | |
| Fixed income funds | | | 84 | | | | | | | |
| Hedge funds | | | 9 | | | | | | | |
| Private equity/venture capital | | | 22 | | | | | | | |
| Other investments | | | 12 | | | | | | | |
| Total net assets | | $ | 936 | | | | | | | |
Investments at net asset value in the preceding tables are measured at fair value using the net asset value per share practical expedient, and therefore, are not classified in the fair value hierarchy.
Fair values are determined as follows:
Cash and Short-Term Investments – Include accounts that are valued based on the account value, which approximates fair value, and investment funds that are valued based on a constant fund net asset value (NAV) using the NAV per share practical expedient or on the fund’s NAV based on the fair value of the underlying securities. Also included are securities that are valued using a market approach (matrix pricing model) in which all significant inputs are observable or can be derived from or corroborated by observable market data.
Equity Securities, Equity Funds, and Other Funds – The values are determined by closing prices in the active market in which the equity investment trades, or the fund’s NAV, based on the fair value of the underlying securities.
Fixed Income Securities and Funds – The securities are valued using either a market approach (matrix pricing model) in which all significant inputs are observable or can be derived from or corroborated by observable market data such as interest rates, yield curves, volatilities, credit risk, and prepayment speeds, or they are valued using the closing prices in the active market in which the fixed income investment trades. Fixed income funds are valued using the fund’s NAV, based on the fair value of the underlying securities.
Real Estate, Venture Capital, Private Equity, and Hedge Funds – The investments that are structured as limited partnerships are valued
at estimated fair value based on their proportionate share of the limited partnership’s fair value that is determined by the respective general partner. These investments are valued using a combination of NAV, an income approach (primarily estimated cash flows discounted over the expected holding period), or market approach (primarily the valuation of similar securities and properties). Real estate investment trusts are primarily valued at the closing prices in the active markets in which the investment trades.
Derivative Instruments – The derivatives are valued using either an income approach (discounted cash flow) using market observable inputs, including swap curves and both forward and spot exchange rates, or a market approach (closing prices in the active market in which the derivative instrument trades).
The primary investment objective for the pension and health care plans assets is to maximize the growth of these assets to support the projected obligations to the beneficiaries over a long period of time, and to do so in a manner that is consistent with the company’s risk tolerance. The asset allocation policy is the most important decision in managing the assets and it is reviewed regularly. The asset allocation policy considers the company’s long-term asset class risk/return expectations for each plan since the obligations are long-term in nature. The current target allocations for pension assets are approximately 32 percent for equities, 46 percent for debt, 4 percent for real estate, and 18 percent for other investments. The target allocations for health care assets are approximately 61 percent for equities, 34 percent for debt, and 5 percent for other investments. The allocation percentages above include the effects of combining derivatives with other investments to manage asset allocations and exposures to interest rates and foreign currency exchange. The assets are well diversified and are managed by professional investment firms as well as by investment professionals who are company employees. As a result of the company’s diversified investment policy, there were no significant concentrations of risk.
The expected long-term rate of return on plan assets reflects management’s expectations of long-term average rates of return on funds invested to provide for benefits included in the projected benefit obligations. A market related value of plan assets is used to calculate the expected return on assets. The market related value recognizes changes in the fair value of pension plan assets systematically over a five-year period. The market related value of the health care plan assets equals fair value. The expected return is based on the outlook for inflation and for returns in multiple asset classes, while also considering historical returns, asset allocation, and investment strategy. The company’s approach has emphasized the long-term nature of the return estimate such that the return assumption is not changed significantly unless there are fundamental changes in capital markets that affect the company’s expectations for returns over an extended period of time (i.e., 10 to 20 years). The average annual return of the company’s U.S. pension fund was approximately 9.2 percent during the past ten years and approximately 7.2 percent during the past 20 years. Since return premiums over inflation and total returns for major asset classes vary widely even over ten-year periods, recent history is not
necessarily indicative of long-term future expected returns. The company’s systematic methodology for determining the long-term rate of return for the company’s investment strategies supports its long-term expected return assumptions.
The company has created certain Voluntary Employees’ Beneficiary Association trusts (VEBAs) for the funding of postretirement health care benefits. The future expected asset returns for these VEBAs are lower than the expected return on the other pension and health care plan assets due to investment in a higher proportion of liquid securities. These assets are in addition to the other postretirement health care plan assets that have been funded under Section 401(h) of the U.S. Internal Revenue Code and maintained in a separate account in the company’s pension plan trust.
The company has defined contribution plans related to employee investment and savings plans primarily in the U.S. The company’s contributions and costs under these plans were $160 million in 2020, $192 million in 2019, and $206 million in 2018. The contribution rate varies primarily based on the company’s performance in the prior year and employee participation in the plans.
9. INCOME TAXES
The provision for income taxes by taxing jurisdiction and by significant component consisted of the following in millions of dollars:
| | | | | | | | | | | |
|---|---|---|---|---|---|---|---|---|---|---|
| | 2020 | 2019 | 2018 | |||||||
| Current: | | | | | | | | |||
| U.S.: | | | | | | | | | | |
| Federal | | $ | 400 | | $ | 545 | | $ | (268) | |
| State | | 53 | | 72 | | 123 | | |||
| Foreign | | 640 | | 700 | | 392 | | |||
| Total current | | 1,093 | | 1,317 | | 247 | | |||
| Deferred: | | | | | | | | | | |
| U.S.: | | | | | | | | | | |
| Federal | | (68) | | (345) | | 1,233 | | |||
| State | | 9 | | (26) | | (40) | | |||
| Foreign | | 48 | | (94) | | 287 | | |||
| Total deferred | | (11) | | (465) | | 1,480 | | |||
| Provision for income taxes | | $ | 1,082 | | $ | 852 | | $ | 1,727 | |
Based upon the location of the company’s operations, the consolidated income before income taxes in the U.S. in 2020, 2019, and 2018 was $2,082 million, $2,166 million, and $2,275 million, respectively, and in foreign countries was $1,801 million, $1,922 million, and $1,796 million, respectively. Certain foreign operations are branches or partnerships of Deere & Company and are subject to U.S. as well as foreign income tax regulations. The pretax income by location and the preceding analysis of the income tax provision by taxing jurisdiction are not directly related.
On December 22, 2017, the U.S. government enacted tax reform. The primary provisions of tax reform affecting the company in 2018 were a reduction to the corporate income tax rate from 35 percent to 21 percent and a transition from a worldwide corporate tax system to a primarily territorial tax system. The reduction in
the corporate income tax rate required the company to remeasure its U.S. net deferred tax assets to the new corporate tax rate and the transition to a territorial tax system required payment of a one-time tax on the deemed repatriation of undistributed and previously untaxed non-U.S. earnings (repatriation tax). The repatriation tax was paid in 2019. The company’s U.S. statutory corporate income tax rate was 21 percent for 2020 and 2019, and approximately 23.3 percent for 2018.
Beginning in 2019, the company was subject to additional provisions of the U.S. tax reform legislation. The main provisions of tax reform affecting the company beginning in 2019 include a tax on global intangible low-taxed income (GILTI), a tax determined by base erosion and anti-abuse tax benefits (BEAT) for certain payments between a U.S. corporation and foreign subsidiaries, a limitation on the deductibility of certain executive compensation, a deduction for foreign derived intangible income (FDII), and interest expense limitations. The combined effects of these provisions did not have a significant effect on the 2020 or 2019 provision for income taxes.
In 2019 and 2018, the company recorded discrete tax adjustments related to the remeasurement of the company’s net deferred tax assets to the new corporate income tax rate and for the repatriation tax. The income tax expense (benefit) for the net deferred tax asset remeasurement and the repatriation tax adjustments in millions of dollars follow:
| | | | | | | | | | | |
|---|---|---|---|---|---|---|---|---|---|---|
| | | Equipment | | Financial | | | | |||
| | | Operations | | Services | | Total | | |||
| 2019 | | | | | | | | | | |
| Net deferred tax asset remeasurement | | $ | 1 | | $ | 5 | | $ | 6 | |
| Deemed earnings repatriation tax | | | (66) | | | (8) | | | (74) | |
| Total discrete tax expense (benefit) | | $ | (65) | | $ | (3) | | $ | (68) | |
| 2018 | | | | | | | | | | |
| Net deferred tax asset remeasurement | $ | 768 | $ | (354) | $ | 414 | | |||
| Deemed earnings repatriation tax | | | 277 | | | 13 | | 290 | | |
| Total discrete tax expense (benefit) | | $ | 1,045 | | $ | (341) | | $ | 704 | |
Included in the equipment operations’ repatriation tax amount was an accrual of approximately $63 million for 2018, which was reduced to $31 million for 2019 for foreign withholding taxes on earnings of subsidiaries outside the U.S. The repatriation tax expense is based on interpretations of existing laws, regulations, and certain assumptions. The company continues to analyze the repatriation tax provisions, and monitor legislative and regulatory developments.
A comparison of the statutory and effective income tax provision and reasons for related differences in millions of dollars follow:
| | | | | | | | | | | |
|---|---|---|---|---|---|---|---|---|---|---|
| | 2020 | 2019 | 2018 | |||||||
| U.S. federal income tax provision at the U.S. statutory rate (2020 and 2019 – 21 percent, 2018 – 23.3 percent) | | $ | 815 | | $ | 859 | | $ | 950 | |
| Increase (decrease) resulting from: | | | | | | | | |||
| Net deferred tax asset remeasurement | | | | | | 6 | | | 414 | |
| Deemed earnings repatriation tax | | | | | | (74) | | | 290 | |
| Effects of GILTI and FDII | | | 39 | | | (33) | | | | |
| Other effects of tax reform | | | | | | | | | 42 | |
| Differences in taxability of foreign earnings | | 38 | | (94) | | (92) | | |||
| Valuation allowance on deferred taxes | | 139 | | 28 | | 50 | | |||
| Research and business tax credits | | (50) | | (85) | | (43) | | |||
| State and local income taxes, net of federal income tax benefit | | 59 | | 47 | | 59 | | |||
| Excess tax benefits on equity compensation | | | (87) | | | (40) | | | (49) | |
| Tax rates on foreign earnings | | 68 | | 183 | | 44 | | |||
| Unrecognized tax benefits | | | (32) | | | (28) | | | 30 | |
| Other—net | | 93 | | 83 | | 32 | | |||
| Provision for income taxes | | $ | 1,082 | | $ | 852 | | $ | 1,727 | |
At November 1, 2020, accumulated earnings in certain subsidiaries outside the U.S. totaled $2,579 million, of which a portion were subject to the repatriation tax in 2018 and are not subject to additional U.S. income tax. A provision for foreign withholding taxes has not been made since these earnings are expected to remain indefinitely reinvested outside the U.S. Determination of the amount of a foreign withholding tax liability on these unremitted earnings is not practicable.
Deferred income taxes arise because there are certain items that are treated differently for financial accounting than for income tax reporting purposes. An analysis of the deferred income tax assets and liabilities at November 1, 2020 and November 3, 2019 in millions of dollars follows:
| | | | | | | | | | | | | | |
|---|---|---|---|---|---|---|---|---|---|---|---|---|---|
| | | 2020 | | 2019 | | ||||||||
| | | Deferred | | Deferred | | Deferred | | Deferred | | ||||
| | | Tax | | Tax | | Tax | | Tax | | ||||
| | Assets | Liabilities | Assets | Liabilities | |||||||||
| OPEB liabilities | | $ | 804 | | | | | $ | 1,015 | | | | |
| Lessor lease transactions | | | | | $ | 489 | | | | | $ | 599 | |
| Tax loss and tax credit carryforwards | | 937 | | | | | 781 | | | | | ||
| Accrual for sales allowances | | 362 | | | | | 518 | | | | | ||
| Tax over book depreciation | | | | | | 196 | | | | | | 339 | |
| Goodwill and other intangible assets | | | | | 368 | | | | | 378 | | ||
| Pension liability – net | | 316 | | | | | | 186 | | | | | |
| Allowance for credit losses | | 81 | | | | | 70 | | | | | ||
| Accrual for employee benefits | | 249 | | | | | 207 | | | | | ||
| Share-based compensation | | 41 | | | | | 68 | | | | | ||
| Deferred compensation | | 40 | | | | | 39 | | | | | ||
| Lessee lease transactions | | | 56 | | | 56 | | | | | | | |
| Other items | | 366 | | 305 | | 375 | | 311 | | ||||
| Less valuation allowances | | (858) | | | | | (661) | | | | | ||
| Deferred income tax assets and liabilities | | $ | 2,394 | | $ | 1,414 | | $ | 2,598 | | $ | 1,627 | |
Deere & Company files a consolidated federal income tax return in the U.S., which includes the wholly-owned financial services subsidiaries. These subsidiaries account for income taxes generally as if they filed separate income tax returns, with a modification for realizability of certain tax benefits.
At November 1, 2020, tax loss and tax credit carryforwards of $937 million were available with $446 million expiring from 2021 through 2040 and $491 million with an indefinite carryforward period.
A reconciliation of the total amounts of unrecognized tax benefits at November 1, 2020, November 3, 2019, and October 28, 2018 in millions of dollars follows:
| | | | | | | | | | | |
|---|---|---|---|---|---|---|---|---|---|---|
| | 2020 | 2019 | 2018 | |||||||
| Beginning of year balance | | $ | 553 | | $ | 279 | | $ | 221 | |
| Increases to tax positions taken during the current year | | 63 | | 30 | | 36 | | |||
| Increases to tax positions taken during prior years | | 95 | | 357 | | 62 | | |||
| Decreases to tax positions taken during prior years | | (30) | | (30) | | (39) | | |||
| Decreases due to lapse of statute of limitations | | (9) | | (6) | | (15) | | |||
| Acquisitions* | | | | | | | | | 31 | |
| Settlements | | (1) | | (75) | | (5) | | |||
| Foreign exchange | | (3) | | (2) | | (12) | | |||
| End of year balance | | $ | 668 | | $ | 553 | | $ | 279 | |
- See Note 4.
The amount of unrecognized tax benefits at November 1, 2020 and November 3, 2019 that would affect the effective tax rate if the tax benefits were recognized was $134 million and $153 million, respectively. The increase during 2019 primarily relates to the interpretation of a repatriation tax regulation for companies that do not have a calendar fiscal year end. The increase was partially offset by the settlement of U.S. income tax positions related to the 2008 through 2014 tax years. The remaining liability was related to tax positions for which there are offsetting tax receivables, or the uncertainty was only related to timing. The company expects that any reasonably possible change in the amounts of unrecognized tax benefits in the next twelve months would not be significant.
The company files its tax returns according to the tax laws of the jurisdictions in which it operates, which includes the U.S. federal jurisdiction and various state and foreign jurisdictions. The U.S. Internal Revenue Service (IRS) has completed the examination of the company’s federal income tax returns for periods prior to 2015. The years 2015, 2016, and 2017 federal income tax return are currently under examination. Various state and foreign income tax returns, including major tax jurisdictions in Argentina, Australia, Brazil, Canada, China, Finland, France, Germany, India, Mexico, Russia, Singapore, and Spain also remain subject to examination by taxing authorities.
The company’s policy is to recognize interest related to income taxes in interest expense and interest income and recognize penalties in selling, administrative and general expenses. During 2020, interest and penalties previously recorded were reversed when tax positions were effectively settled resulting in a $3 million net benefit. During 2019 and 2018, the total amount of expense from interest and penalties was $13 million and $23 million. The interest income in 2020, 2019, and 2018 was $11 million, $25
million, and $12 million, respectively. At November 1, 2020 and November 3, 2019, the liability for accrued interest and penalties totaled $72 million and $76 million, respectively, and the receivable for interest was $6 million and $4 million, respectively.
10. OTHER INCOME AND OTHER OPERATING EXPENSES
The major components of other income and other operating expenses consisted of the following in millions of dollars:
| | | | | | | | | | | |
|---|---|---|---|---|---|---|---|---|---|---|
| | 2020 | 2019 | 2018 | |||||||
| Other income | | | | | | | | |||
| Revenues from services | | $ | 314 | | $ | 348 | | $ | 347 | |
| Insurance premiums and fees earned* | | | 223 | | | 214 | | | 217 | |
| Investment income | | 26 | | 25 | | 14 | | |||
| Other | | 255 | | 292 | | 322 | | |||
| Total | | $ | 818 | | $ | 879 | | $ | 900 | |
| | | | | | | | | | | |
| Other operating expenses | | | | | | | | | | |
| Depreciation of equipment on operating leases | | $ | 1,083 | | $ | 981 | | $ | 928 | |
| Insurance claims and expenses* | | 231 | | 210 | | 175 | | |||
| Cost of services | | 188 | | 228 | | 211 | | |||
| Operating lease residual losses and impairments | | | 52 | | | 159 | | | 26 | |
| Pension and OPEB (benefit) cost, excluding service cost component | | | (31) | | | (67) | | | 15 | |
| Other | | 89 | | 67 | | 44 | | |||
| Total | | $ | 1,612 | | $ | 1,578 | | $ | 1,399 | |
- Primarily related to extended warranties (see Note 21).
11. UNCONSOLIDATED AFFILIATED COMPANIES
Unconsolidated affiliated companies are companies in which Deere & Company generally owns 20 percent to 50 percent of the outstanding voting shares. Deere & Company does not control these companies and accounts for its investments in them on the equity basis. The investments in these companies primarily consist of Bell Equipment Limited (31 percent ownership), Deere-Hitachi Construction Machinery Corporation (50 percent ownership), and Deere-Hitachi Maquinas de Construcao do Brasil S.A. (50 percent ownership). The unconsolidated affiliated companies primarily manufacture or market equipment. Deere & Company’s share of the income or loss of these companies is reported in the consolidated income statement under “Equity in income (loss) of unconsolidated affiliates.” In 2020, the company recorded impairments on certain of these unconsolidated affiliates. The impairments were the result of an other-than-temporary decline in value (see Note 5). The investment in these companies is reported in the consolidated balance sheet under “Investments in unconsolidated affiliates.”
Combined financial information of the unconsolidated affiliated companies in millions of dollars follows:
| | | | | | | | | | | |
|---|---|---|---|---|---|---|---|---|---|---|
| Operations | 2020 | 2019 | 2018 | |||||||
| Sales | | $ | 1,793 | | $ | 2,483 | | $ | 2,313 | |
| Net income | | 7 | | 50 | | 91 | | |||
| Deere & Company’s equity in net income (loss) | | (48) | | | 21 | | 27 | |
| | | | | | | | |
|---|---|---|---|---|---|---|---|
| Financial Position | 2020 | 2019 | |||||
| Total assets | | $ | 1,541 | | $ | 1,694 | |
| Total external borrowings | | 540 | | 488 | | ||
| Total net assets | | 598 | | 563 | | ||
| Deere & Company’s share of the net assets | | 193 | | 215 | |
Consolidated retained earnings at November 1, 2020 include undistributed earnings of the unconsolidated affiliates of $138 million. Dividends from unconsolidated affiliates were none in 2020, $30 million in 2019, and $12 million in 2018.
In the ordinary course of business, the company purchases and sells components and finished goods to the unconsolidated affiliated companies. Transactions with unconsolidated affiliated companies reported in the statement of consolidated income in millions of dollars follow:
| | | | | | | | | | | |
|---|---|---|---|---|---|---|---|---|---|---|
| | | 2020 | 2019 | 2018 | | |||||
| Net sales | | $ | 81 | | $ | 143 | | $ | 161 | |
| Purchases | | | 1,288 | | | 1,937 | | | 1,682 | |
12. MARKETABLE SECURITIES
All marketable securities are classified as available-for-sale. Prior to 2019, all unrealized gains and losses on marketable securities were shown as a component of stockholders’ equity. Beginning in 2019 with the adoption of ASU No. 2016-01, unrealized gains and losses on equity securities are shown as a component of net income. Realized gains or losses from the sales of marketable securities are based on the specific identification method.
The amortized cost and fair value of marketable securities at November 1, 2020 and November 3, 2019 in millions of dollars follow:
| | | | | | | | | | | | | | |
|---|---|---|---|---|---|---|---|---|---|---|---|---|---|
| | | | Gross | Gross | | | |||||||
| | | Amortized | | Unrealized | | Unrealized | | Fair | |||||
| | | Cost | | Gains | | Losses | | Value | |||||
| 2020 | | | | | | | | | | | | | |
| U.S. equity fund | | | | | | | | | | | $ | 62 | |
| International equity securities | | | | | | | | | | | | 2 | |
| Total equity securities | | | | | | | | | | | | 64 | |
| U.S. government debt securities | | $ | 159 | | $ | 10 | | $ | 1 | | 168 | | |
| Municipal debt securities | | 63 | | 5 | | | | | 68 | | |||
| Corporate debt securities | | 173 | | 15 | | | | | 188 | | |||
| International debt securities | | | 9 | | | | | | 3 | | | 6 | |
| Mortgage-backed securities* | | 140 | | 7 | | | | 147 | | ||||
| Total debt securities | | $ | 544 | | $ | 37 | | $ | 4 | | | 577 | |
| Marketable securities | | | | | | | | | | | $ | 641 | |
| 2019 | | | | | | | | | | | | | |
| Equity fund | | | | | | | | | | | $ | 59 | |
| Total equity securities | | | | | | | | | | | | 59 | |
| U.S. government debt securities | | $ | 128 | | $ | 4 | | $ | 1 | | 131 | | |
| Municipal debt securities | | 57 | | 3 | | | | | 60 | | |||
| Corporate debt securities | | 157 | | 8 | | | | | 165 | | |||
| International debt securities | | | 9 | | | | | | 3 | | | 6 | |
| Mortgage-backed securities* | | 155 | | 5 | | | | 160 | | ||||
| Total debt securities | | $ | 506 | | $ | 20 | | $ | 4 | | | 522 | |
| Marketable securities | | | | | | | | | | | $ | 581 | |
- Primarily issued by U.S. government sponsored enterprises.
Equity Securities
Proceeds and realized gains on equity securities sold during 2020, 2019, and 2018 were not material. Unrealized gains on equity securities during 2020 and 2019 in millions of dollars follow:
| | | | | | | | |
|---|---|---|---|---|---|---|---|
| | | 2020 | 2019 | | |||
| Net gain recognized on equity securities | $ | 8 | | $ | 7 | | |
| Less: Net gain on equity securities sold | | | 1 | | | | |
| Unrealized gains on equity securities | | $ | 7 | | $ | 7 | |
Debt Securities
The contractual maturities of debt securities at November 1, 2020 in millions of dollars follow:
| | | | | | | | |
|---|---|---|---|---|---|---|---|
| | Amortized | Fair | |||||
| | Cost | Value | | ||||
| Due in one year or less | | $ | 18 | | $ | 18 | |
| Due after one through five years | | 90 | | 94 | | ||
| Due after five through 10 years | | 113 | | 121 | | ||
| Due after 10 years | | 183 | | 197 | | ||
| Mortgage-backed securities | | 140 | | 147 | | ||
| Debt securities | | $ | 544 | | $ | 577 | |
Actual maturities may differ from contractual maturities because some securities may be called or prepaid. Because of the potential for prepayment on mortgage-backed securities, they are not categorized by contractual maturity. Proceeds from the sales of debt securities were $28 million in 2020, $31 million in 2019, and $40 million in 2018. Realized gains, realized losses, the increase (decrease) in net unrealized gains or losses, and unrealized losses that have been continuous for over twelve months were not significant in 2020, 2019, and 2018. Unrealized losses at November 1, 2020 and November 3, 2019 were not recognized in income due to the ability and intent to hold to maturity. There were no significant impairment write-downs in the periods reported.
13. RECEIVABLES
Trade Accounts and Notes Receivable
Trade accounts and notes receivable at November 1, 2020 and November 3, 2019 in millions of dollars follows:
| | | | | | | | |
|---|---|---|---|---|---|---|---|
| | 2020 | 2019 | |||||
| Trade accounts and notes: | | | | | | | |
| Agriculture and turf | | $ | 2,881 | | $ | 3,224 | |
| Construction and forestry | | 1,290 | | 2,006 | | ||
| Trade accounts and notes receivable – net | | $ | 4,171 | | $ | 5,230 | |
The allowance for credit losses on trade accounts and notes receivable at November 1, 2020, November 3, 2019, and October 28, 2018, as well as the related activity, in millions of dollars follow:
| | | | | | | | | | | |
|---|---|---|---|---|---|---|---|---|---|---|
| | | 2020 | | 2019 | | 2018 | | |||
| Beginning of year balance | | $ | 72 | | $ | 70 | | $ | 56 | |
| Provision | | | | | | 8 | | | 36 | |
| Write-offs | | | (23) | | | (14) | | | (16) | |
| Recoveries | | | 1 | | | 4 | | | | |
| Translation adjustments | | | (11) | | | 4 | | | (6) | |
| End of year balance | | $ | 39 | | $ | 72 | | $ | 70 | |
The equipment operations sell a significant portion of their trade receivables to financial services and provide compensation to these operations at approximate market rates of interest.
Trade accounts and notes receivable primarily arise from sales of goods to independent dealers. Under the terms of the sales to dealers, interest is primarily charged to dealers on outstanding balances, from the earlier of the date when goods are sold to retail customers by the dealer or the expiration of certain interest-free periods granted at the time of the sale to the dealer, until payment is received by the company. Dealers cannot cancel purchases after the company recognizes a sale and are responsible for payment even if the equipment is not sold to retail customers. The interest-free periods are determined based on the type of equipment sold and the time of year of the sale. These periods range from one to twelve months for most equipment. Interest-free periods may not be extended. Interest charged may not be forgiven and the past due interest rates exceed market rates. The company evaluates and assesses dealers on an ongoing basis as to their creditworthiness and generally secures the receivables by retaining a security interest in the goods associated with the trade receivables or with other financial instruments. In certain jurisdictions, the company is obligated to repurchase goods sold to a dealer upon cancellation or termination of the dealer’s contract for such causes as change in ownership and closeout of the business.
During 2020, the company provided short-term payment relief on trade accounts and notes receivables to independent dealers and certain other customers (customers) that were negatively affected by the economic effects of COVID. The relief was provided both in regional programs and case-by-case situations with creditworthy customers. This relief generally included payment deferrals not exceeding three months, extending interest-free periods for up to an additional three months with the total interest-free period not to exceed one year, or reducing interest rates for a maximum of three months. The trade receivable balance granted relief that remained outstanding at November 1, 2020 was $75 million, or approximately 2 percent of the trade receivable portfolio. These actions were taken in response to the economic effects of COVID on customers. Outside of these actions, the company is not modifying its normal sales terms with customers that are outlined in Note 2.
For customers who obtained payment relief, subsequent sales transactions are evaluated to confirm the revenue recognition criteria are met, including the sales price is determinable and collectability of the payments is probable based on the terms outlined in the contract.
Trade accounts and notes receivable include receivables from sales to certain retail customers with payment terms less than twelve months. The customer cannot cancel purchases or return the equipment after delivery. The company evaluates and assesses retail customers at the time of purchase as to their creditworthiness and generally retains a security interest in the goods associated with the receivables.
Trade accounts and notes receivable have significant concentrations of credit risk in the agriculture and turf sector and
construction and forestry sector as shown in the previous table. On a geographic basis, there is not a disproportionate concentration of credit risk in any area.
Financing Receivables
Financing receivables at November 1, 2020 and November 3, 2019 in millions of dollars follow:
| | | | | | | | | | | | | | |
|---|---|---|---|---|---|---|---|---|---|---|---|---|---|
| | | 2020 | | 2019 | |||||||||
| | Unrestricted/Securitized | Unrestricted/Securitized | | ||||||||||
| Retail notes: | | | | | | | | ||||||
| Agriculture and turf | | $ | 17,780 | | $ | 4,134 | | $ | 16,712 | | $ | 3,799 | |
| Construction and forestry | | 3,629 | | 680 | | 3,134 | | 697 | | ||||
| Total | | 21,409 | | 4,814 | | 19,846 | | 4,496 | | ||||
| Wholesale notes | | 3,547 | | | | | 4,645 | | | | | ||
| Revolving charge accounts | | 3,962 | | | | | 4,004 | | | | | ||
| Financing leases (direct and sales-type) | | 2,364 | | | | | 2,263 | | | | | ||
| Total financing receivables | | 31,282 | | 4,814 | | 30,758 | | 4,496 | | ||||
| Less: | | | | | | | | | | | | | |
| Unearned finance income: | | | | | | | | | | | | | |
| Retail notes | | 1,066 | | 98 | | 1,141 | | 101 | | ||||
| Wholesale notes | | | 18 | | | | | | 11 | | | | |
| Revolving charge accounts | | | 60 | | | | | | 61 | | | | |
| Financing leases | | 217 | | | | | 212 | | | | | ||
| Total | | 1,361 | | 98 | | 1,425 | | 101 | | ||||
| Allowance for credit losses | | 171 | | 13 | | 138 | | 12 | | ||||
| Financing receivables – net | | $ | 29,750 | | $ | 4,703 | | $ | 29,195 | | $ | 4,383 | |
Financing receivables have significant concentrations of credit risk in the agriculture and turf sector and construction and forestry sector as shown in the previous table. On a geographic basis, there is not a disproportionate concentration of credit risk in any area. The company generally retains as collateral a security interest in the equipment associated with retail notes, wholesale notes, and financing leases.
Financing receivables at November 1, 2020 and November 3, 2019 related to the company’s sales of equipment that were included in the table above consisted of the following in millions of dollars:
| | | | | | | | | | | | | | |
|---|---|---|---|---|---|---|---|---|---|---|---|---|---|
| | | 2020 | | 2019 | |||||||||
| | Unrestricted/Securitized | Unrestricted/Securitized | | ||||||||||
| Retail notes*: | | | | | | | | | | | | | |
| Agriculture and turf | | $ | 1,971 | | | | | $ | 2,164 | | | | |
| Construction and forestry | | | 335 | | $ | 27 | | 374 | | $ | 45 | | |
| Total | | | 2,306 | | 27 | | 2,538 | | | 45 | | ||
| Wholesale notes | | | 3,547 | | | | 4,645 | | | | |||
| Sales-type leases | | | 1,045 | | | | 1,064 | | | | |||
| Total | | | 6,898 | | | 27 | | | 8,247 | | | 45 | |
| Less: | | | | | | | | | | | | | |
| Unearned finance income: | | | | | | | | | | | | | |
| Retail notes | | | 178 | | | | | | 242 | | | | |
| Wholesale notes | | | 18 | | | | | | 11 | | | | |
| Sales-type leases | | | 82 | | | | 83 | | | | |||
| Total | | 278 | | | | 336 | | | | | |||
| Financing receivables related to the company’s sales of equipment | | $ | 6,620 | | $ | 27 | | $ | 7,911 | | $ | 45 | |
- These retail notes generally arise from sales of equipment by company-owned dealers or through direct sales.
Financing receivable installments, including unearned finance income, at November 1, 2020 and November 3, 2019 were scheduled as follows in millions of dollars:
| | | | | | | | | | | | | | |
|---|---|---|---|---|---|---|---|---|---|---|---|---|---|
| | | 2020 | | 2019 | |||||||||
| | | Unrestricted/Securitized | Unrestricted/Securitized | ||||||||||
| Due in months: | | | | | | ||||||||
| 0 – 12 | | $ | 14,983 | | $ | 1,971 | | $ | 16,174 | | $ | 2,067 | |
| 13 – 24 | | 6,180 | | 1,354 | | 5,639 | | 1,214 | | ||||
| 25 – 36 | | 4,556 | | 889 | | 4,133 | | 777 | | ||||
| 37 – 48 | | 3,145 | | 460 | | 2,759 | | 369 | | ||||
| 49 – 60 | | 1,794 | | 129 | | 1,555 | | 67 | | ||||
| Thereafter | | 624 | | 11 | | 498 | | 2 | | ||||
| Total | | $ | 31,282 | | $ | 4,814 | | $ | 30,758 | | $ | 4,496 | |
The maximum terms for retail notes are generally seven years for agriculture and turf equipment, and five years for construction and forestry equipment. The maximum term for financing leases is generally seven years. The average term for wholesale notes is less than twelve months.
Past due balances of financing receivables still accruing finance income represent the total balance held (principal plus accrued interest) with any payment amounts 30 days or more past the contractual payment due date. Non-performing financing receivables represent loans for which the company has ceased accruing finance income. The company ceases accruing finance income when these receivables are generally 90 days delinquent. Generally, when receivables are 120 days delinquent the estimated uncollectible amount, after charging the dealer’s deposit account, if any, is written off to the allowance for credit losses. Finance income for non-performing receivables is recognized on a cash basis. Accrual of finance income is generally resumed when the receivable becomes contractually current and collections are reasonably assured.
Due to the significant, negative effects of COVID on dealers and retail customers, the company provided short-term payment relief to dealers and retail customers on financing receivables, which includes retail notes, wholesale notes, revolving charge accounts, and sales-type and direct financing leases. The relief was provided in regional programs and case-by-case situations with customers that were generally current in their payment obligations. This relief generally included payment deferrals or reduced financing rates of three months or less. The balance of financing receivables granted relief was approximately 4 percent of the total financing receivable balance at November 1, 2020. The delinquency status of receivables granted relief is based on the modified payment schedule.
An age analysis of past due financing receivables that are still accruing interest and non-performing financing receivables at November 1, 2020 and November 3, 2019 follows in millions of dollars:
| | | | | | | | | | | | | | |
|---|---|---|---|---|---|---|---|---|---|---|---|---|---|
| | | 30-59 | | 60-89 | | 90 Days | | | | ||||
| | | Days | | Days | | or Greater | | Total | |||||
| | Past Due | Past Due | Past Due | Past Due | |||||||||
| 2020 | | | | | | | | | | | | | |
| Retail Notes: | | | | | | | |||||||
| Agriculture and turf | | $ | 122 | | $ | 59 | | | | | $ | 181 | |
| Construction and forestry | | 89 | | 48 | | $ | 14 | | 151 | | |||
| Other: | | | | | | | | | | | | | |
| Agriculture and turf | | 26 | | 9 | | 2 | | 37 | | ||||
| Construction and forestry | | 24 | | 8 | | | | 32 | | ||||
| Total | | $ | 261 | | $ | 124 | | $ | 16 | | $ | 401 | |
| | | | | | | | | | | | | | |
|---|---|---|---|---|---|---|---|---|---|---|---|---|---|
| | | | | | Total | | | | | Total | |||
| | | Total | | Non- | | | | | Financing | ||||
| | Past Due | Performing | Current | Receivables | |||||||||
| Retail Notes: | | | | | | | |||||||
| Agriculture and turf | | $ | 181 | | $ | 242 | | $ | 20,454 | | $ | 20,877 | |
| Construction and forestry | | 151 | | 86 | | 3,945 | | 4,182 | | ||||
| Other: | | | | | | | | | | | | | |
| Agriculture and turf | | 37 | | 74 | | 7,940 | | 8,051 | | ||||
| Construction and forestry | | 32 | | 21 | | 1,474 | | 1,527 | | ||||
| Total | | $ | 401 | | $ | 423 | | $ | 33,813 | | 34,637 | | |
| Less allowance for credit losses | | 184 | | ||||||||||
| Total financing receivables - net | | $ | 34,453 | |
| | | | | | | | | | | | | | |
|---|---|---|---|---|---|---|---|---|---|---|---|---|---|
| | | 30-59 | | 60-89 | | 90 Days | | | | ||||
| | | Days | | Days | | or Greater | | Total | |||||
| | Past Due | Past Due | Past Due | Past Due | |||||||||
| 2019 | | | | | | | | | | | | | |
| Retail Notes: | | | | | | | |||||||
| Agriculture and turf | | $ | 138 | | $ | 73 | | $ | 1 | | $ | 212 | |
| Construction and forestry | | 79 | | 29 | | 4 | | 112 | | ||||
| Other: | | | | | | | | | | | | | |
| Agriculture and turf | | 39 | | 19 | | 1 | | 59 | | ||||
| Construction and forestry | | 26 | | 7 | | | | 33 | | ||||
| Total | | $ | 282 | | $ | 128 | | $ | 6 | | $ | 416 | |
| | | | | | | | | | | | | | |
|---|---|---|---|---|---|---|---|---|---|---|---|---|---|
| | | | | | Total | | | | | Total | |||
| | | Total | | Non- | | | | | Financing | ||||
| | Past Due | Performing | Current | Receivables | |||||||||
| Retail Notes: | | | | | | | |||||||
| Agriculture and turf | | $ | 212 | | $ | 268 | | $ | 18,931 | | $ | 19,411 | |
| Construction and forestry | | 112 | | 127 | | 3,450 | | 3,689 | | ||||
| Other: | | | | | | | | | | | | | |
| Agriculture and turf | | 59 | | 28 | | 8,986 | | 9,073 | | ||||
| Construction and forestry | | 33 | | 26 | | 1,496 | | 1,555 | | ||||
| Total | | $ | 416 | | $ | 449 | | $ | 32,863 | | 33,728 | | |
| Less allowance for credit losses | | 150 | | ||||||||||
| Total financing receivables - net | | $ | 33,578 | |
An analysis of the allowance for credit losses and investment in financing receivables follows in millions of dollars:
| | | | | | | | | | | | | | |
|---|---|---|---|---|---|---|---|---|---|---|---|---|---|
| | | | | | Revolving | | | | | ||||
| | | Retail | | Charge | | | | | |||||
| | Notes | Accounts | Other | Total | |||||||||
| 2020 | | | | | | | | | | ||||
| Allowance: | | | | | | | | | | | | | |
| Beginning of year balance | | $ | 89 | | $ | 40 | | $ | 21 | | $ | 150 | |
| Provision | | 69 | | 26 | | 15 | | 110 | | ||||
| Write-offs | | (57) | | (53) | | (8) | | (118) | | ||||
| Recoveries | | 15 | | 30 | | | 2 | | 47 | | |||
| Translation adjustments | | (7) | | | | | 2 | | (5) | | |||
| End of year balance* | | $ | 109 | | $ | 43 | | $ | 32 | | $ | 184 | |
| | | | | | | | | | | | | | |
| Financing receivables: | | | | | | | | | | | | | |
| End of year balance | | $ | 25,059 | | $ | 3,902 | | $ | 5,676 | | $ | 34,637 | |
| | | | | | | | | | | | | | |
| Balance individually evaluated | | $ | 137 | | $ | 1 | | $ | 117 | | $ | 255 | |
| | | | | | | | | | | | | | |
|---|---|---|---|---|---|---|---|---|---|---|---|---|---|
| 2019 | | | | | | | | ||||||
| Allowance: | | | | | | | | | | | | | |
| Beginning of year balance | | $ | 113 | | $ | 43 | | $ | 22 | | $ | 178 | |
| Provision (credit) | | (2) | | 29 | | 8 | | 35 | | ||||
| Write-offs | | (40) | | (58) | | (7) | | (105) | | ||||
| Recoveries | | 22 | | 26 | | | 1 | | 49 | | |||
| Translation adjustments | | (4) | | | | | (3) | | (7) | | |||
| End of year balance* | | $ | 89 | | $ | 40 | | $ | 21 | | $ | 150 | |
| | | | | | | | | | | | | | |
| Financing receivables: | | | | | | | | | | | | | |
| End of year balance | | $ | 23,100 | | $ | 3,943 | | $ | 6,685 | | $ | 33,728 | |
| | | | | | | | | | | | | | |
| Balance individually evaluated | | $ | 156 | | | | | $ | 13 | | $ | 169 | |
| | | | | | | | | | | | | | |
|---|---|---|---|---|---|---|---|---|---|---|---|---|---|
| 2018 | | | | | | | | | | | | | |
| Allowance: | | | | | | | | | | | | | |
| Beginning of year balance | | $ | 121 | | $ | 40 | | $ | 26 | | $ | 187 | |
| Provision | | 14 | | 38 | | 2 | | 54 | | ||||
| Write-offs | | (33) | | (55) | | (6) | | (94) | | ||||
| Recoveries | | 17 | | 20 | | | 1 | | 38 | | |||
| Translation adjustments | | (6) | | | | | (1) | | (7) | | |||
| End of year balance* | | $ | 113 | | $ | 43 | | $ | 22 | | $ | 178 | |
| | | | | | | | | | | | | | |
| Financing receivables: | | | | | | | | | | | | | |
| End of year balance | | $ | 21,624 | | $ | 3,862 | | $ | 5,768 | | $ | 31,254 | |
| | | | | | | | | | | | | | |
| Balance individually evaluated | | $ | 122 | | $ | 2 | | $ | 12 | | $ | 136 | |
- Individual allowances were not significant.
The negative economic effects related to COVID and other macroeconomic issues have significantly affected certain retail borrowers, particularly of construction equipment.
Past-due amounts over 30 days represented 1.16 percent and 1.23 percent of the receivables financed at November 1, 2020 and November 3, 2019, respectively. The allowance for credit losses represented .53 percent and .44 percent of financing receivables outstanding at November 1, 2020 and November 3, 2019, respectively. In addition, at November 1, 2020 and November 3, 2019, the company’s financial services operations had $136 million and $152 million, respectively, of deposits primarily withheld from dealers and merchants available for potential credit losses.
Financing receivables are considered impaired when it is probable the company will be unable to collect all amounts due according to
the contractual terms. Receivables reviewed for impairment generally include those that are past due, have provided bankruptcy notification, or require significant collection efforts. Receivables that are impaired are generally classified as non-performing.
An analysis of the impaired financing receivables at November 1, 2020 and November 3, 2019 follows in millions of dollars:
| | | | | | | | | | | | | | |
|---|---|---|---|---|---|---|---|---|---|---|---|---|---|
| | | | | | Unpaid | | | | | Average | |||
| | | Recorded | | Principal | | Specific | | Recorded | |||||
| | | Investment | Balance | Allowance | Investment | ||||||||
| 2020* | | | | | | ||||||||
| Receivables with specific allowance** | | $ | 136 | | $ | 136 | | $ | 22 | | $ | 151 | |
| Receivables without a specific allowance*** | | 36 | | 34 | | | | | 40 | | |||
| Total | | $ | 172 | | $ | 170 | | $ | 22 | | $ | 191 | |
| Agriculture and turf | | $ | 161 | | $ | 160 | | $ | 18 | | $ | 177 | |
| Construction and forestry | | $ | 11 | | $ | 10 | | $ | 4 | | $ | 14 | |
| | | | | | | | | | | | | | |
|---|---|---|---|---|---|---|---|---|---|---|---|---|---|
| 2019* | | | | | | ||||||||
| Receivables with specific allowance*** | | $ | 40 | | $ | 39 | | $ | 13 | | $ | 40 | |
| Receivables without a specific allowance*** | | 32 | | 31 | | | | | 37 | | |||
| Total | | $ | 72 | | $ | 70 | | $ | 13 | | $ | 77 | |
| Agriculture and turf | | $ | 49 | | $ | 48 | | $ | 8 | | $ | 52 | |
| Construction and forestry | | $ | 23 | | $ | 22 | | $ | 5 | | $ | 25 | |
- Finance income recognized was not material.
** Primarily financing leases, wholesale receivables, and retail notes.
*** Primarily retail notes.
A troubled debt restructuring is generally the modification of debt in which a creditor grants a concession it would not otherwise consider to a debtor that is experiencing financial difficulties. These modifications may include a reduction of the stated interest rate, an extension of the maturity dates, a reduction of the face amount or maturity amount of the debt, or a reduction of accrued interest. During 2020, 2019, and 2018, the company identified 574, 522, and 587 receivable contracts, primarily wholesale receivables in Argentina, as troubled debt restructurings with aggregate balances of $108 million, $36 million, and $34 million pre-modification and $95 million, $35 million, and $34 million post-modification, respectively. In 2020 and 2019, there were no significant troubled debt restructurings that subsequently defaulted and were written off. At November 1, 2020, the company had commitments to lend approximately $10 million to borrowers whose accounts were modified in troubled debt restructurings.
Other Receivables
Other receivables at November 1, 2020 and November 3, 2019 consisted of the following in millions of dollars:
| | | | | | | | |
|---|---|---|---|---|---|---|---|
| | 2020 | 2019 | |||||
| Taxes receivable | | $ | 931 | | $ | 1,231 | |
| Other | | 289 | | 256 | | ||
| Other receivables | $ | 1,220 | $ | 1,487 | |
14. SECURITIZATION OF FINANCING RECEIVABLES
The company, as a part of its overall funding strategy, periodically transfers certain financing receivables (retail notes) into VIEs that are SPEs, or non-VIE banking operations, as part of its asset-backed securities programs (securitizations). The structure of these transactions is such that the transfer of the retail notes does not meet the accounting criteria for sales of receivables, and is, therefore, accounted for as a secured borrowing. SPEs utilized in securitizations of retail notes differ from other entities included in the company’s consolidated statements because the assets they hold are legally isolated. Use of the assets held by the SPEs or the non-VIEs is restricted by terms of the documents governing the securitization transactions.
In these securitizations, the retail notes are transferred to certain SPEs or to non-VIE banking operations, which in turn issue debt to investors. The debt securities issued to the third-party investors result in secured borrowings, which are recorded as “Short-term securitization borrowings” on the balance sheet. The securitized retail notes are recorded as “Financing receivables securitized - net” on the balance sheet. The total restricted assets on the balance sheet related to these securitizations include the financing receivables securitized less an allowance for credit losses, and other assets primarily representing restricted cash. Restricted cash results from contractual requirements in securitized borrowing arrangements and serves as a credit enhancement. The restricted cash is used to satisfy payment deficiencies, if any, in the required payments on secured borrowings. The balance of restricted cash is contractually stipulated and is either a fixed amount as determined by the initial balance of the financing receivables securitized or a fixed percentage of the outstanding balance of the securitized financing receivables. The restriction is removed either after all secured borrowing payments are made or proportionally as these receivables are collected and borrowing obligations reduced. For those securitizations in which retail notes are transferred into SPEs, the SPEs supporting the secured borrowings are consolidated unless the company does not have both the power to direct the activities that most significantly impact the SPEs’ economic performance and the obligation to absorb losses or the right to receive benefits that could potentially be significant to the SPEs. No additional support to these SPEs beyond what was previously contractually required has been provided during the reporting periods.
In certain securitizations, the company consolidates the SPEs since it has both the power to direct the activities that most significantly impact the SPEs’ economic performance through its role as servicer of all the receivables held by the SPEs, and the obligation through variable interests in the SPEs to absorb losses or receive benefits that could potentially be significant to the SPEs. The restricted assets (retail notes securitized, allowance for credit losses, and other assets) of the consolidated SPEs totaled $2,898 million and $2,895 million at November 1, 2020 and November 3, 2019, respectively. The liabilities (short-term securitization borrowings and accrued interest) of these SPEs totaled $2,856 million and $2,847 million at November 1, 2020 and November 3,
2019, respectively. The credit holders of these SPEs do not have legal recourse to the company’s general credit.
In certain securitizations, the company transfers retail notes to non-VIE banking operations, which are not consolidated since the company does not have a controlling interest in the entities. The company’s carrying values and interests related to the securitizations with the unconsolidated non-VIEs were restricted assets (retail notes securitized, allowance for credit losses and other assets) of $576 million and $491 million at November 1, 2020 and November 3, 2019, respectively. The liabilities (short-term securitization borrowings and accrued interest) were $554 million and $465 million at November 1, 2020 and November 3, 2019, respectively.
In certain securitizations, the company transfers retail notes into bank-sponsored, multi-seller, commercial paper conduits, which are SPEs that are not consolidated. The company does not service a significant portion of the conduits’ receivables, and therefore, does not have the power to direct the activities that most significantly impact the conduits’ economic performance. These conduits provide a funding source to the company (as well as other transferors into the conduit) as they fund the retail notes through the issuance of commercial paper. The company’s carrying values and variable interest related to these conduits were restricted assets (retail notes securitized, allowance for credit losses, and other assets) of $1,327 million and $1,079 million at November 1, 2020 and November 3, 2019, respectively. The liabilities (short-term securitization borrowings and accrued interest) related to these conduits were $1,275 million and $1,015 million at November 1, 2020 and November 3, 2019, respectively.
The company’s carrying amount of the liabilities to the unconsolidated conduits, compared to the maximum exposure to loss related to these conduits, which would only be incurred in the event of a complete loss on the restricted assets, was as follows at November 1, 2020 in millions of dollars:
| | | | | |
|---|---|---|---|---|
| | 2020 | |||
| Carrying value of liabilities | | $ | 1,275 | |
| Maximum exposure to loss | | 1,327 | |
The total assets of unconsolidated VIEs related to securitizations were approximately $33 billion at November 1, 2020.
The components of consolidated restricted assets related to secured borrowings in securitization transactions at November 1, 2020 and November 3, 2019 were as follows in millions of dollars:
| | | | | | | | |
|---|---|---|---|---|---|---|---|
| | 2020 | 2019 | |||||
| Financing receivables securitized (retail notes) | | $ | 4,716 | | $ | 4,395 | |
| Allowance for credit losses | | (13) | | (12) | | ||
| Other assets | | 98 | | 82 | | ||
| Total restricted securitized assets | $ | 4,801 | $ | 4,465 | |
The components of consolidated secured borrowings and other liabilities related to securitizations at November 1, 2020 and November 3, 2019 were as follows in millions of dollars:
| | | | | | | | |
|---|---|---|---|---|---|---|---|
| | 2020 | 2019 | |||||
| Short-term securitization borrowings | | $ | 4,682 | | $ | 4,321 | |
| Accrued interest on borrowings | | 3 | | 6 | | ||
| Total liabilities related to restricted securitized assets | $ | 4,685 | $ | 4,327 | |
The secured borrowings related to these restricted securitized retail notes are obligations that are payable as the retail notes are liquidated. Repayment of the secured borrowings depends primarily on cash flows generated by the restricted assets. Due to the company’s short-term credit rating, cash collections from these restricted assets are not required to be placed into a segregated collection account until immediately prior to the time payment is required to the secured creditors. At November 1, 2020, the maximum remaining term of all securitized retail notes was approximately six years.
15. INVENTORIES
A majority of inventory owned by Deere & Company and its U.S. equipment subsidiaries are valued at cost, on the “last-in, first-out” (LIFO) basis. Remaining inventories are generally valued at the lower of cost, on the “first-in, first-out” (FIFO) basis, or net realizable value. The value of gross inventories on the LIFO basis at November 1, 2020 and November 3, 2019 represented 52 percent and 55 percent, respectively, of worldwide gross inventories at FIFO value. The pretax favorable income effect from the liquidation of LIFO inventory during 2020 was $33 million. If all inventories had been valued on a FIFO basis, estimated inventories by major classification at November 1, 2020 and November 3, 2019 in millions of dollars would have been as follows:
| | | | | | | | |
|---|---|---|---|---|---|---|---|
| | 2020 | 2019 | |||||
| Raw materials and supplies | $ | 1,995 | $ | 2,285 | |||
| Work-in-process | | 648 | | 747 | | ||
| Finished goods and parts | | 4,006 | | 4,613 | | ||
| Total FIFO value | | 6,649 | | 7,645 | | ||
| Less adjustment to LIFO value | | 1,650 | | 1,670 | | ||
| Inventories | $ | 4,999 | $ | 5,975 | |
16. PROPERTY AND DEPRECIATION
A summary of property and equipment at November 1, 2020 and November 3, 2019 in millions of dollars follows:
| | | | | | | | | | |
|---|---|---|---|---|---|---|---|---|---|
| | | Useful Lives* | | | | | | | |
| | (Years) | 2020 | 2019 | ||||||
| Equipment Operations | | | | | | | | | |
| Land | | | | $ | 282 | | $ | 274 | |
| Buildings and building equipment | 22 | | 4,114 | | 3,976 | | |||
| Machinery and equipment | 11 | | 5,936 | | 5,710 | | |||
| Dies, patterns, tools, etc. | 8 | | 1,662 | | 1,531 | | |||
| All other | 4 | | 1,115 | | 1,065 | | |||
| Construction in progress | | | | 440 | | 733 | | ||
| Total at cost | | | | 13,549 | | 13,289 | | ||
| Less accumulated depreciation | | | | 7,771 | | 7,360 | | ||
| Total | | | | 5,778 | | 5,929 | | ||
| Financial Services | | | | | | | | | |
| Land | | | | 4 | | 4 | | ||
| Buildings and building equipment | 25 | | 65 | | 75 | | |||
| All other | 6 | | 34 | | 34 | | |||
| Total at cost | | | | 103 | | 113 | | ||
| Less accumulated depreciation | | | | 64 | | 69 | | ||
| Total | | | | 39 | | 44 | | ||
| Property and equipment - net | | | $ | 5,817 | $ | 5,973 | |
- Weighted-averages
Total property and equipment additions in 2020, 2019, and 2018 were $815 million, $1,107 million, and $985 million and depreciation was $800 million, $779 million, and $754 million, respectively. Capitalized interest was $6 million, $7 million, and $4 million in the same periods, respectively. The cost of leased property and equipment under finance leases of $99 million and $62 million and accumulated depreciation of $36 million and $27 million at November 1, 2020 and November 3, 2019, respectively, is included in property and equipment.
Capitalized software has an estimated useful life of three years. The amounts of total capitalized software costs, including purchased and internally developed software, classified as “Other assets” at November 1, 2020 and November 3, 2019 were $1,339 million and $1,305 million, less accumulated amortization of $1,070 million and $1,023 million, respectively. Capitalized interest on software was $3 million and $5 million at November 1, 2020 and November 3, 2019, respectively. Amortization of these software costs in 2020, 2019, and 2018 was $133 million, $150 million, and $145 million, respectively.
The cost of compliance with foreseeable environmental requirements has been accrued and did not have a material effect on the company’s consolidated financial statements.
17. GOODWILL AND OTHER INTANGIBLE ASSETS – NET
The changes in amounts of goodwill by operating segments were as follows in millions of dollars:
| | | | | | | | | | | |
|---|---|---|---|---|---|---|---|---|---|---|
| | | Agriculture | | Construction | | | | |||
| | | and | | and | | | | |||
| | Turf | Forestry | Total | |||||||
| Goodwill at October 28, 2018 | | $ | 583 | | $ | 2,518 | | $ | 3,101 | |
| Divestitures* | | | | | | (22) | | | (22) | |
| Translation adjustments and other | | | (9) | | | (153) | | (162) | | |
| Goodwill at November 3, 2019 | | | 574 | | | 2,343 | | 2,917 | | |
| Acquisition* | | | 28 | | | | | | 28 | |
| Translation adjustments and other | | | (1) | | | 137 | | 136 | | |
| Goodwill at November 1, 2020 | | $ | 601 | | $ | 2,480 | | $ | 3,081 | |
- See Note 4.
There were no accumulated goodwill impairment losses in the reported periods.
The components of other intangible assets are as follows in millions of dollars:
| | | | | | | | |
|---|---|---|---|---|---|---|---|
| | 2020 | 2019 | |||||
| Amortized intangible assets: | | | | | | | |
| Customer lists and relationships | | $ | 535 | | $ | 511 | |
| Technology, patents, trademarks, and other | | 1,056 | | 1,028 | | ||
| Total at cost | | 1,591 | | 1,539 | | ||
| Less accumulated amortization* | | 387 | | 282 | | ||
| Total | | 1,204 | | | 1,257 | | |
| Unamortized intangible assets: | | | | | | | |
| In-process research and development | | 123 | | | 123 | | |
| Other intangible assets - net | $ | 1,327 | $ | 1,380 | |
- Accumulated amortization at 2020 and 2019 for customer lists and relationships was $113 million and $77 million and technology, patents, trademarks, and other was $274 million and $205 million, respectively.
Other intangible assets are stated at cost less accumulated amortization. The amortization of other intangible assets in 2020, 2019, and 2018 was $102 million, $109 million, and $100 million, respectively. The estimated amortization expense for the next five years is as follows in millions of dollars: 2021 - $105, 2022 - $105, 2023 - $103, 2024 - $99, and 2025 - $96.
18. TOTAL SHORT-TERM BORROWINGS
Total short-term borrowings at November 1, 2020 and November 3, 2019 consisted of the following in millions of dollars:
| | | | | | | | |
|---|---|---|---|---|---|---|---|
| | 2020 | 2019 | |||||
| Equipment Operations | | | | | | ||
| Notes payable to banks | | $ | 192 | $ | 345 | | |
| Finance lease obligations due within one year | | | 21 | | | | |
| Long-term borrowings due within one year | | 79 | | 642 | | ||
| Total | | 292 | | 987 | | ||
| Financial Services | | | | | | | |
| Commercial paper | | 1,238 | | 2,698 | | ||
| Notes payable to banks | | 182 | | 313 | | ||
| Long-term borrowings due within one year* | | 6,870 | | 6,786 | | ||
| Total | | 8,290 | | 9,797 | | ||
| Short-term borrowings | | 8,582 | | 10,784 | | ||
| Short-term securitization borrowings | | | | | | ||
| Equipment Operations | | | 26 | | | 44 | |
| Financial Services | | | 4,656 | | | 4,277 | |
| Total | | | 4,682 | | 4,321 | | |
| Total short-term borrowings | $ | 13,264 | $ | 15,105 | |
- Includes unamortized fair value adjustments related to interest rate swaps.
The short-term securitization borrowings are secured by financing receivables (retail notes) on the balance sheet (see Note 14). Although these securitization borrowings are classified as short-term since payment is required if the retail notes are liquidated early, the payment schedule for these borrowings, which are net of debt acquisition costs, at November 1, 2020 based on the expected liquidation of the retail notes in millions of dollars is as follows: 2021 - $2,367, 2022 - $1,366, 2023 - $681, 2024 - $217, 2025 - $50, and 2026 - $6.
The weighted-average interest rates on total short-term borrowings, excluding current maturities of finance lease obligations and long-term borrowings, at November 1, 2020 and November 3, 2019 were 1.6 percent and 2.9 percent, respectively.
Lines of credit available from U.S. and foreign banks were $8,413 million at November 1, 2020. At November 1, 2020, $6,801 million of these worldwide lines of credit were unused. For the purpose of computing the unused credit lines, commercial paper, and short-term bank borrowings, excluding secured borrowings and the current portion of long-term borrowings, were primarily considered to constitute utilization. Included in the total credit lines at November 1, 2020 was a 364-day credit facility agreement of $3,000 million, expiring in fiscal April 2021. In addition, total credit lines included long-term credit facility agreements of $2,500 million, expiring in fiscal April 2024, and $2,500 million, expiring in fiscal April 2025. The agreements are mutually extendable and the annual facility fees are not significant. These credit agreements require Capital Corporation to maintain its consolidated ratio of earnings to fixed charges at not less than 1.05 to 1 for each fiscal quarter and the ratio of senior debt, excluding securitization indebtedness, to capital base (total subordinated debt and stockholder’s equity excluding accumulated other comprehensive income (loss)) at not more than 11 to 1 at the end of any fiscal quarter. The credit agreements also require the equipment
operations to maintain a ratio of total debt to total capital (total debt and stockholders’ equity excluding accumulated other comprehensive income (loss)) of 65 percent or less at the end of each fiscal quarter. Under this provision, the company’s excess equity capacity and retained earnings balance free of restriction at November 1, 2020 was $12,892 million. Alternatively under this provision, the equipment operations had the capacity to incur additional debt of $23,942 million at November 1, 2020. All of these credit agreement requirements have been met during the periods included in the consolidated financial statements.
Deere & Company has an agreement with Capital Corporation pursuant to which it has agreed to continue to own, directly or through one or more wholly-owned subsidiaries, at least 51 percent of the voting shares of capital stock of Capital Corporation and to maintain Capital Corporation’s consolidated tangible net worth at not less than $50 million. This agreement also obligates Deere & Company to make payments to Capital Corporation such that its consolidated ratio of earnings to fixed charges is not less than 1.05 to 1 for each fiscal quarter. Deere & Company’s obligations to make payments to Capital Corporation under the agreement are independent of whether Capital Corporation is in default on its indebtedness, obligations or other liabilities. Further, Deere & Company’s obligations under the agreement are not measured by the amount of Capital Corporation’s indebtedness, obligations or other liabilities. Deere & Company’s obligations to make payments under this agreement are expressly stated not to be a guaranty of any specific indebtedness, obligation or liability of Capital Corporation and are enforceable only by or in the name of Capital Corporation. No payments were required under this agreement during the periods included in the consolidated financial statements.
19. ACCOUNTS PAYABLE AND ACCRUED EXPENSES
Accounts payable and accrued expenses at November 1, 2020 and November 3, 2019 consisted of the following in millions of dollars:
| | | | | | | | |
|---|---|---|---|---|---|---|---|
| | 2020 | 2019 | |||||
| Equipment Operations | | | | | | ||
| Accounts payable: | | | | | | | |
| Trade payables | $ | 1,926 | $ | 1,996 | |||
| Dividends payable | | 244 | | 244 | | ||
| Operating lease liabilities | | | 297 | | | | |
| Other | | 251 | | 284 | | ||
| Accrued expenses: | | | | | | | |
| Dealer sales discounts | | 1,682 | | 1,990 | | ||
| Product warranties | | 1,105 | | 1,218 | | ||
| Employee benefits | | 1,086 | | 1,001 | | ||
| Accrued taxes | | | 730 | | | 734 | |
| Unearned revenue | | 679 | | 657 | | ||
| Other | | 1,114 | | 1,108 | | ||
| Total | | $ | 9,114 | | $ | 9,232 | |
(continued)
| | | | | | | | |
|---|---|---|---|---|---|---|---|
| | 2020 | 2019 | | ||||
| Financial Services | | | | | | | |
| Accounts payable: | | | | | | | |
| Deposits withheld from dealers and merchants | | $ | 141 | | $ | 164 | |
| Collateral on derivatives | | | 274 | | | | |
| Other | | 194 | | 163 | | ||
| Accrued expenses: | | | | | | | |
| Unearned revenue | | 968 | | 978 | | ||
| Accrued interest | | 181 | | 211 | | ||
| Employee benefits | | 60 | | 61 | | ||
| Other | | 309 | | 259 | | ||
| Total | | 2,127 | | 1,836 | | ||
| Eliminations* | | 1,129 | | 1,412 | | ||
| Accounts payable and accrued expenses | $ | 10,112 | $ | 9,656 | |
- Primarily trade receivable valuation accounts related to sales incentive accruals of $1,073 million, which are reclassified as accrued expenses by the equipment operations as a result of their trade receivables being sold to financial services.
20. LONG-TERM BORROWINGS
Long-term borrowings at November 1, 2020 and November 3, 2019 consisted of the following in millions of dollars:
| | | | | | | | |
|---|---|---|---|---|---|---|---|
| | 2020 | 2019 | |||||
| Equipment Operations | | | | | | ||
| U.S. dollar notes and debentures: | | | | | | | |
| 8-1/2% debentures due 2022 | | $ | 105 | | $ | 105 | |
| 2.60% notes due 2022 | | 1,000 | | 1,000 | | ||
| 2.75% notes due 2025 | | | 700 | | | | |
| 6.55% debentures due 2028 | | 200 | | 200 | | ||
| 5.375% notes due 2029 | | 500 | | 500 | | ||
| 3.10% notes due 2030 | | | 700 | | | | |
| 8.10% debentures due 2030 | | 250 | | 250 | | ||
| 7.125% notes due 2031 | | 300 | | 300 | | ||
| 3.90% notes due 2042 | | 1,250 | | 1,250 | | ||
| 2.875% notes due 2049 | | | 500 | | | 500 | |
| 3.75% notes due 2050 | | | 850 | | | | |
| Euro notes: | | | | | | | |
| .5% notes due 2023 (€500 principal) | | | 584 | | | 558 | |
| 1.375% notes due 2024 (€800 principal) | | | 934 | | | | |
| 1.85% notes due 2028 (€600 principal) | | | 700 | | | | |
| 2.20% notes due 2032 (€600 principal) | | | 700 | | | | |
| 1.65% notes due 2039 (€650 principal) | | | 759 | | | 725 | |
| Finance lease obligations and other notes | | 135 | | 51 | | ||
| Less debt issuance costs | | | 43 | | | 24 | |
| Total | | 10,124 | | 5,415 | | ||
| Financial Services | | | | | | ||
| Notes and debentures: | | | | | | | |
| Medium-term notes due 2021 - 2030: (principal $20,996 - 2020, $23,265 - 2019) Average interest rates of 1.7% - 2020, 2.7% - 2019 | | 21,661 | * | | 23,528 | * | |
| Other notes | | 992 | | 1,335 | | ||
| Less debt issuance costs | | | 43 | | | 49 | |
| Total | | 22,610 | | 24,814 | | ||
| Long-term borrowings** | $ | 32,734 | | $ | 30,229 | |
- Includes unamortized fair value adjustments related to interest rate swaps.
** All interest rates are as of year end.
The approximate principal amounts of the equipment operations’ long-term borrowings maturing in each of the next five years in millions of dollars are as follows: 2021 - $79, 2022 - $1,212, 2023 - $587, 2024 - $935, and 2025 - $700. The approximate principal amounts of the financial services’ long-term borrowings maturing in each of the next five years in millions of dollars are as follows: 2021 - $6,867, 2022 - $6,945, 2023 - $5,228, 2024 - $3,011, and 2025 - $2,166.
21. COMMITMENTS AND CONTINGENCIES
The company generally determines its total warranty liability by applying historical claims rate experience to the estimated amount of equipment that has been sold and is still under warranty based on dealer inventories and retail sales. The historical claims rate is primarily determined by a review of five-year claims costs and current quality developments.
The premiums for extended warranties are primarily recognized in income in proportion to the costs expected to be incurred over the contract period. The unamortized extended warranty premiums (deferred revenue) included in the following table totaled $638 million and $582 million at November 1, 2020 and November 3, 2019, respectively.
A reconciliation of the changes in the warranty liability and unearned premiums in millions of dollars follows:
| | | | | | | | |
|---|---|---|---|---|---|---|---|
| | | Warranty Liability/ | |||||
| | | Unearned Premiums | |||||
| | 2020 | 2019 | |||||
| Beginning of year balance | $ | 1,800 | $ | 1,652 | |||
| Payments | | (942) | | (985) | | ||
| Amortization of premiums received | | (222) | | (214) | | ||
| Accruals for warranties | | 851 | | 1,066 | | ||
| Premiums received | | 276 | | 292 | | ||
| Foreign exchange | | (20) | | (11) | | ||
| End of year balance | $ | 1,743 | $ | 1,800 | |
At November 1, 2020, the company had approximately $380 million of guarantees issued primarily to banks outside the U.S. and Canada related to third-party receivables for the retail financing of John Deere equipment. The company may recover a portion of any required payments incurred under these agreements from repossession of the equipment collateralizing the receivables. At November 1, 2020, the company had accrued losses of approximately $18 million under these agreements. The maximum remaining term of the receivables guaranteed at November 1, 2020 was approximately seven years.
At November 1, 2020, the company had commitments of approximately $159 million for the construction and acquisition of property and equipment. Also at November 1, 2020, the company had restricted assets of $71 million, classified as “Other assets.” See Note 14 for additional restricted assets associated with borrowings related to securitizations.
The company also had other miscellaneous contingent liabilities totaling approximately $40 million at November 1, 2020. The accrued liability for these contingencies was not material at November 1, 2020.
The company is subject to various unresolved legal actions which arise in the normal course of its business, the most prevalent of which relate to product liability (including asbestos related liability), retail credit, employment, patent, and trademark matters. The company believes the reasonably possible range of losses for these unresolved legal actions would not have a material effect on its financial statements.
22. CAPITAL STOCK
Changes in the common stock account in millions were as follows:
| | | | | | | |
|---|---|---|---|---|---|---|
| | | Number of | | | | |
| | Shares Issued | Amount | ||||
| Balance at October 29, 2017 | 536.4 | $ | 4,281 | |||
| Stock options and other | | | | 193 | | |
| Balance at October 28, 2018 | | 536.4 | | 4,474 | | |
| Stock options and other | | | | 168 | | |
| Balance at November 3, 2019 | | 536.4 | | 4,642 | | |
| Stock options and other | | | | 253 | | |
| Balance at November 1, 2020 | | 536.4 | | $ | 4,895 | |
The number of common shares the company is authorized to issue is 1,200 million. The number of authorized preferred shares, none of which has been issued, is nine million.
The Board of Directors at its meeting in December 2013 authorized the repurchase of up to $8,000 million of common stock. In December 2019, the Board of Directors approved a share repurchase plan authorizing the repurchase of up to an additional $8,000 million of shares of the company’s common stock. At the end of the fiscal year, these repurchase programs had $8,339 million (36.9 million shares based on the fiscal year end closing common stock price of $225.91 per share) remaining to be repurchased. Repurchases of the company’s common stock under these plans will be made from time to time, at the company’s discretion, in the open market.
A reconciliation of basic and diluted net income per share attributable to Deere & Company follows in millions, except per share amounts:
| | | | | | | | | | | |
|---|---|---|---|---|---|---|---|---|---|---|
| | 2020 | 2019 | 2018 | |||||||
| Net income attributable to Deere & Company | $ | 2,751 | $ | 3,253 | $ | 2,368 | | |||
| Average shares outstanding | | 313.5 | | 316.5 | | 322.6 | | |||
| Basic per share | $ | 8.77 | $ | 10.28 | $ | 7.34 | | |||
| Average shares outstanding | | 313.5 | | 316.5 | | 322.6 | | |||
| Effect of dilutive stock options | | 3.1 | | 4.1 | | 4.7 | | |||
| Total potential shares outstanding | | 316.6 | | 320.6 | | 327.3 | | |||
| Diluted per share | $ | 8.69 | $ | 10.15 | $ | 7.24 | |
All stock options outstanding were included in the computation except .6 million in 2020, .7 million in 2019, and .4 million in 2018 that had an antidilutive effect under the treasury stock method.
23. STOCK OPTION AND RESTRICTED STOCK AWARDS
The company issues stock options and restricted stock awards to key employees under plans approved by stockholders. Restricted stock is also issued to nonemployee directors for their services as directors under a plan approved by stockholders. Options are
awarded with the exercise price equal to the market price and become exercisable in one to three years after grant. Options expire ten years after the date of grant. Restricted stock awards generally vest after three years. The compensation cost for stock options and service based restricted stock units, which is based on the fair value at the grant date, is recognized on a straight-line basis over the requisite period the employee is required to render service. The compensation cost for performance/service based units, which is based on the fair value at the grant date, is recognized over the employees’ requisite service period and periodically adjusted for the probable number of shares to be awarded. The company recognizes the effect of award forfeitures as an adjustment to compensation expense in the period the forfeiture occurs. According to these plans at November 1, 2020, the company is authorized to grant an additional 18.5 million shares related to stock options or restricted stock.
The fair value of each option award was estimated on the date of grant using a binomial lattice option valuation model. Expected volatilities are based on implied volatilities from traded call options on the company’s stock. The expected volatilities are constructed from the following three components: the starting implied volatility of short-term call options traded within a few days of the valuation date; the predicted implied volatility of long-term call options; and the trend in implied volatilities over the span of the call options’ time to maturity. The company uses historical data to estimate option exercise behavior. The expected term of options granted is derived from the output of the option valuation model based on the underlying distribution of historical exercise behavior and represents the weighted-average period of time that options granted are expected to be outstanding. The risk-free rates utilized for periods throughout the contractual life of the options are based on U.S. Treasury security yields at the time of grant.
The assumptions used for the binomial lattice model to determine the fair value of options follow:
| | | | | | | | |
|---|---|---|---|---|---|---|---|
| | 2020 | 2019 | 2018 | ||||
| Risk-free interest rate* | 1.67% | 2.85% | 2.34% | | |||
| Expected dividends | | 1.8% | | 2.0% | | 1.6% | |
| Volatility* | | 26.0% | | 30.0% | | 22.8% | |
| Expected term (in years)* | 5.7 | 8.2 | 8.4 | |
- Weighted-averages
Stock option activity at November 1, 2020 and changes during 2020 in millions of dollars and shares follow:
| | | | | | | | | | | | |
|---|---|---|---|---|---|---|---|---|---|---|---|
| | | | | | | | Remaining | | | | |
| | | | | | | | Contractual | | Aggregate | ||
| | | | | Exercise | | Term | | Intrinsic | |||
| | | Shares | Price* | (Years) | Value | ||||||
| Outstanding at beginning of year | 7.0 | | $ | 92.85 | | | | | | | |
| Granted | .5 | | 169.70 | | | | | | | ||
| Exercised | (3.7) | | 88.36 | | | | | | | ||
| Expired or forfeited | (.1) | | 169.70 | | | | | | | ||
| Outstanding at end of year | 3.7 | | 107.30 | 5.51 | $ | 437.5 | | ||||
| Exercisable at end of year | 3.0 | | 93.79 | 4.76 | | 391.0 | |
- Weighted-averages
The weighted-average grant-date fair values of options granted during 2020, 2019, and 2018 were $35.83, $46.96, and $39.11, respectively. The total intrinsic values of options exercised during 2020, 2019, and 2018 were $398 million, $186 million, and $229 million, respectively. During 2020, 2019, and 2018, cash received from stock option exercises was $331 million, $178 million, and $217 million, respectively, with tax benefits of $93 million, $44 million, and $54 million, respectively.
The company granted 364 thousand, 447 thousand, and 415 thousand restricted stock units to employees and nonemployee directors in 2020, 2019, and 2018, of which 297 thousand, 355 thousand, and 330 thousand are subject to service-only based conditions, and 67 thousand, 92 thousand, and 85 thousand are subject to performance/service based conditions, respectively. The service-only based units award one share of common stock for each unit at the end of the vesting period and include dividend equivalent payments.
The performance/service based units are subject to a performance metric based on the company’s compound annual revenue growth rate, compared to a benchmark group of companies over the vesting period. The performance/service based units award common stock in a range of zero to 200 percent for each unit granted based on the level of the metric achieved and do not include dividend equivalent payments over the vesting period. The weighted-average fair values of the service-only based units at the grant dates during 2020, 2019, and 2018 were $168.94, $149.54, and $151.67 per unit, respectively, based on the market price of a share of underlying common stock. The fair value of the performance/service based units at the grant date during 2020, 2019, and 2018 were $160.81, $140.49, and $145.33 per unit, respectively, based on the market price of a share of underlying common stock excluding dividends.
The company’s restricted shares at November 1, 2020 and changes during 2020 in millions of shares follow:
| | | | | | | |
|---|---|---|---|---|---|---|
| | | | | Grant-Date | ||
| | | Shares | | Fair Value* | ||
| Service-only based | | | | | | |
| Nonvested at beginning of year | 1.1 | | $ | 130.72 | | |
| Granted | .3 | | 168.94 | | ||
| Vested | (.4) | | 102.34 | | ||
| Forfeited | | (.1) | | | 162.62 | |
| Nonvested at end of year | .9 | | 155.47 | | ||
| Performance/service based | | | | | | |
| Nonvested at beginning of year | .3 | | $ | 130.78 | | |
| Granted | .1 | | 160.81 | | ||
| Vested | (.2) | | 111.78 | | ||
| Nonvested at end of year | .2 | | 147.55 | |
- Weighted-averages
During 2020, 2019, and 2018, the total share-based compensation expense was $81 million, $82 million, and $84 million, respectively, with recognized income tax benefits of $19 million, $20 million, and $20 million, respectively. At November 1, 2020, there was $55 million of total unrecognized compensation cost from share-based compensation arrangements granted under the plans, which is
related to restricted shares and options. This compensation is expected to be recognized over a weighted-average period of approximately two years. The total grant-date fair values of stock options and restricted shares vested during 2020, 2019, and 2018 were $79 million, $66 million, and $63 million, respectively.
The company currently uses shares that have been repurchased through its stock repurchase programs to satisfy share option exercises. At fiscal year end, the company had 223 million shares in treasury stock and 37 million shares remaining to be repurchased under its publicly announced repurchase programs (see Note 22).
24. OTHER COMPREHENSIVE INCOME ITEMS
The after-tax changes in accumulated other comprehensive income at October 29, 2017, October 28, 2018, November 3, 2019, and November 1, 2020 in millions of dollars follow:
| | | | | | | | | | | | | | | | | |
|---|---|---|---|---|---|---|---|---|---|---|---|---|---|---|---|---|
| | | | | | | | | | | | | Total | | |||
| | | | | | | | | Unrealized | | Unrealized | | Accumulated | | |||
| | | Retirement | | Cumulative | | Gain (Loss) | | Gain (Loss) | | Other | | |||||
| | | Benefits | | Translation | | on | | on | | Comprehensive | | |||||
| | Adjustment | Adjustment | Derivatives | Debt Securities | Income (Loss) | |||||||||||
| 2017 | | $ | (3,580) | | $ | (999) | | $ | 5 | | $ | 10 | | $ | (4,564) | |
| Period Change | | 1,052 | | | (194) | | | 9 | | | (13) | | 854 | | ||
| ASU No. 2018-02 | | | (709) | | (10) | | 1 | | 1 | | | (717) | | |||
| 2018 | | (3,237) | | (1,203) | | 15 | | (2) | | (4,427) | | |||||
| ASU No. 2016-01 | | | | | | | | (8) | | (8) | | |||||
| Period Change | | | (678) | | | (448) | | | (75) | | | 29 | | | (1,172) | |
| 2019 | | (3,915) | | (1,651) | | (60) | | 19 | | (5,607) | | |||||
| Period Change | | | (3) | | | 55 | | | 2 | | | 14 | | | 68 | |
| 2020 | | $ | (3,918) | | $ | (1,596) | | $ | (58) | | $ | 33 | | $ | (5,539) | |
Following are amounts recorded in and reclassifications out of other comprehensive income (loss), and the income tax effects, in millions of dollars:
| | | | | | | | | | | |
|---|---|---|---|---|---|---|---|---|---|---|
| | | Before | | Tax | | After | ||||
| | | Tax | | (Expense) | | Tax | ||||
| | Amount | Credit | Amount | |||||||
| 2020 | | | | | | | | | | |
| Cumulative translation adjustment: | | | | | | | | | | |
| Unrealized translation gain (loss) | $ | 18 | | $ | 1 | | $ | 19 | | |
| Reclassification of realized (gain) loss to: | | | | | | | | | | |
| Other operating expenses | | | 13 | | | | | | 13 | |
| Equity in (income) loss of unconsolidated affiliates | | | 23 | | | | | | 23 | |
| Net unrealized translation gain (loss) | | | 54 | | | 1 | | | 55 | |
| Unrealized gain (loss) on derivatives: | | | | | | | | | | |
| Unrealized hedging gain (loss) | | (18) | | 2 | | (16) | | |||
| Reclassification of realized (gain) loss to: | | | | | | | | | | |
| Interest rate contracts – Interest expense | | 21 | | (3) | | 18 | | |||
| Net unrealized gain (loss) on derivatives | | 3 | | (1) | | 2 | | |||
| Unrealized gain (loss) on debt securities: | | | | | | | | | | |
| Unrealized holding gain (loss) | | 17 | | (3) | | 14 | | |||
| Net unrealized gain (loss) on debt securities | | 17 | | (3) | | 14 | | |||
| Retirement benefits adjustment: | | | | | | | | | | |
| Pensions | | | | | | | | | | |
| Net actuarial gain (loss) | | (438) | | 99 | | (339) | | |||
| Reclassification primarily to other operating expenses through amortization of: * | | | | | | | | | | |
| Actuarial (gain) loss | | 249 | | (61) | | 188 | | |||
| Prior service (credit) cost | | 11 | | (3) | | 8 | | |||
| Settlements | | 26 | | (7) | | 19 | | |||
| OPEB | | | | | | | | | | |
| Net actuarial gain (loss) | | 136 | | (34) | | 102 | | |||
| Reclassification to other operating expenses through amortization of: * | | | | | | | | | | |
| Actuarial (gain) loss | | 29 | | (7) | | 22 | | |||
| Prior service (credit) cost | | (4) | | 1 | | (3) | | |||
| Net unrealized gain (loss) on retirement benefits adjustment | | 9 | | (12) | | (3) | | |||
| Total other comprehensive income (loss) | $ | 83 | $ | (15) | $ | 68 | |
- These accumulated other comprehensive income amounts are primarily included in net periodic pension and OPEB costs. See Note 8 for additional detail.
| | | | | | | | | | | |
|---|---|---|---|---|---|---|---|---|---|---|
| | | Before | | Tax | | After | ||||
| | | Tax | | (Expense) | | Tax | ||||
| | Amount | Credit | Amount | |||||||
| 2019 | | | | | | | | |||
| Cumulative translation adjustment | | $ | (447) | $ | (1) | | $ | (448) | | |
| Unrealized gain (loss) on derivatives: | | | | | | | | | | |
| Unrealized hedging gain (loss) | | (92) | | 21 | | (71) | | |||
| Reclassification of realized (gain) loss to: | | | | | | | | | | |
| Interest rate contracts – Interest expense | | (5) | | 1 | | (4) | | |||
| Net unrealized gain (loss) on derivatives | | (97) | | 22 | | (75) | | |||
| Unrealized gain (loss) on debt securities: | | | | | | | | | | |
| Unrealized holding gain (loss) | | 36 | | (7) | | 29 | | |||
| Net unrealized gain (loss) on debt securities | | 36 | | (7) | | 29 | | |||
| Retirement benefits adjustment: | | | | | | | | | | |
| Pensions | | | | | | | | | | |
| Net actuarial gain (loss) | | (887) | | 236 | | (651) | | |||
| Reclassification to other operating expenses through amortization of: * | | | | | | | | | | |
| Actuarial (gain) loss | | 143 | | (35) | | 108 | | |||
| Prior service (credit) cost | | 11 | | (2) | | 9 | | |||
| Settlements | | 3 | | (1) | | 2 | | |||
| OPEB | | | | | | | | | | |
| Net actuarial gain (loss) | | (141) | | 38 | | (103) | | |||
| Reclassification to other operating expenses through amortization of: * | | | | | | | | | | |
| Actuarial (gain) loss | | 16 | | (4) | | 12 | | |||
| Prior service (credit) cost | | | (72) | | 17 | | | (55) | | |
| Net unrealized gain (loss) on retirement benefits adjustment | | (927) | | 249 | | (678) | | |||
| Total other comprehensive income (loss) | $ | (1,435) | $ | 263 | $ | (1,172) | |
- These accumulated other comprehensive income amounts are included in net periodic pension and OPEB costs. See Note 8 for additional detail.
| | | | | | | | | | | |
|---|---|---|---|---|---|---|---|---|---|---|
| | | Before | | Tax | | After | ||||
| | | Tax | | (Expense) | | Tax | ||||
| | Amount | Credit | Amount | |||||||
| 2018 | | | | | | | | | | |
| Cumulative translation adjustment | $ | (188) | $ | (6) | | $ | (194) | | ||
| Unrealized gain (loss) on derivatives: | | | | | | | | | | |
| Unrealized hedging gain (loss) | | 18 | | (4) | | 14 | | |||
| Reclassification of realized (gain) loss to: | | | | | | | | | | |
| Interest rate contracts – Interest expense | | (5) | | 1 | | (4) | | |||
| Foreign exchange contracts – Other operating expenses | | (1) | | | | (1) | | |||
| Net unrealized gain (loss) on derivatives | | 12 | | (3) | | 9 | | |||
| Unrealized gain (loss) on investments: | | | | | | | | | | |
| Unrealized holding gain (loss) | | (17) | | 5 | | (12) | | |||
| Reclassification of realized (gain) loss – Other income | | | (1) | | | | | (1) | | |
| Net unrealized gain (loss) on investments | | (18) | | 5 | | (13) | | |||
| Retirement benefits adjustment: | | | | | | | | | | |
| Pensions | | | | | | | | | | |
| Net actuarial gain (loss) | | 553 | | (128) | | 425 | | |||
| Reclassification to other operating expenses through amortization of: * | | | | | | | | | | |
| Actuarial (gain) loss | | 226 | | (63) | | 163 | | |||
| Prior service (credit) cost | | 12 | | (4) | | 8 | | |||
| Settlements | | 8 | | (2) | | 6 | | |||
| OPEB | | | | | | | | | | |
| Net actuarial gain (loss) and prior service credit (cost) | | 603 | | (142) | | 461 | | |||
| Reclassification to other operating expenses through amortization of: * | | | | | | | | | | |
| Actuarial (gain) loss | | 62 | | (17) | | 45 | | |||
| Prior service (credit) cost | | | (77) | | 21 | | | (56) | | |
| Net unrealized gain (loss) on retirement benefits adjustment | | 1,387 | | (335) | | 1,052 | | |||
| Total other comprehensive income (loss) | $ | 1,193 | $ | (339) | $ | 854 | |
- These accumulated other comprehensive income amounts are included in net periodic pension and OPEB costs. See Note 8 for additional detail.
The noncontrolling interests’ comprehensive income was $2 million in 2020, $4 million in 2019, and $2 million in 2018, which consisted of net income of $2 million in 2020, $4 million in 2019, and $3 million in 2018 and cumulative translation adjustments of none in 2020 and 2019, and $(1) million in 2018.
25. LEASES
The company is both a lessee and a lessor. The company leases for its own use primarily warehouse facilities, office space, production equipment, information technology equipment, and vehicles. The expected use periods generally ranging from less than one year to 20 years. The company’s financial services segment leases to users equipment produced or sold by the company, and a limited amount of other equipment. These leases are usually written for periods of less than one year to seven years. The company determines if an arrangement is or contains a lease at the contract inception.
Lessee
The company recognizes on the balance sheet a lease liability and a right of use asset for leases with a term greater than one year for both operating and finance leases.
The amounts of the lease liability and right of use asset are determined at lease commencement and are based on the present value of the lease payments over the lease term. The lease payments are discounted using the company’s incremental borrowing rate since the rate implicit in the lease is generally not readily determinable. The company determines the incremental borrowing rate for each lease based primarily on the lease term and the economic environment of the country where the asset will be used, adjusted as if the borrowings were collateralized. Leases with contractual periods greater than one year and that do not meet the finance lease criteria are classified as operating leases.
Certain real estate leases contain one or more options to terminate or renew, with terms that can generally extend the lease term from one to ten years. Options that the company is reasonably certain to exercise are included in the lease term.
The company has elected to combine lease and nonlease components, such as maintenance and utilities costs included in a lease contract, for all asset classes. Leases with an initial term of one year or less are expensed on a straight-line basis over the lease term and recorded in short-term lease expense. Variable lease expense primarily includes warehouse facilities leases with payments based on utilization exceeding contractual minimum amounts and leases with payments indexed to inflation when the index changes after lease commencement.
The lease expense by type consisted of the following in millions of dollars:
| | | | | |
|---|---|---|---|---|
| | | | 2020 | |
| Operating lease expense | | $ | 126 | |
| Short-term lease expense | | | 23 | |
| Variable lease expense | | | 41 | |
| Finance lease: | | | | |
| Depreciation expense | | | 20 | |
| Interest on lease liabilities | | | 2 | |
| Total lease expense | | $ | 212 | |
Operating and finance lease right of use assets and lease liabilities follow in millions of dollars:
| | | | | |
|---|---|---|---|---|
| | | | 2020 | |
| Operating leases: | | | | |
| Other assets | | $ | 324 | |
| Accounts payable and accrued expenses | | | 305 | |
| | | | | |
| Finance leases: | | | | |
| Property and equipment — net | | $ | 63 | |
| | | | | |
| Short-term borrowings | | | 21 | |
| Long-term borrowings | | | 39 | |
| Total finance lease liabilities | | $ | 60 | |
The weighted-average remaining lease terms in years and discount rates follows:
| | | | | |
|---|---|---|---|---|
| | | | 2020 | |
| Weighted-average remaining lease terms: | | | | |
| Operating leases | | | 5 | |
| Finance leases | | | 3 | |
| | | | | |
| Weighted-average discount rates: | | | | |
| Operating leases | | | 2.1% | |
| Finance leases | | | 2.2% | |
Lease payment amounts in each of the next five years at November 1, 2020 follow in millions of dollars:
| | | | | | | | |
|---|---|---|---|---|---|---|---|
| | | Operating | | Finance | | ||
| Due in: | | Leases | | Leases | | ||
| 2021 | | $ | 90 | | $ | 22 | |
| 2022 | | | 74 | | | 18 | |
| 2023 | | | 52 | | | 12 | |
| 2024 | | | 42 | | | 5 | |
| 2025 | | | 24 | | | 3 | |
| Later years | | | 41 | | | 2 | |
| Total lease payments | | | 323 | | | 62 | |
| Less imputed interest | | | 18 | | | 2 | |
| Total lease liabilities | | $ | 305 | | $ | 60 | |
Future minimum lease payments under the previous lease standard for operating and capital leases at November 3, 2019 follow in millions of dollars:
| | | | | | | | |
|---|---|---|---|---|---|---|---|
| | | Operating | | Capital | | ||
| Due in: | | Leases | | Leases | | ||
| 2020 | | $ | 111 | | $ | 12 | |
| 2021 | | | 77 | | | 10 | |
| 2022 | | | 56 | | | 6 | |
| 2023 | | | 39 | | | 2 | |
| 2024 | | | 28 | | | 1 | |
| Later years | | | 26 | | | 1 | |
| Total minimum lease payments | | $ | 337 | | $ | 32 | |
Cash paid for amounts included in the measurement of lease liabilities follows in millions of dollars:
| | | | | |
|---|---|---|---|---|
| | | | 2020 | |
| Operating cash flows from operating leases | | $ | 124 | |
| Operating cash flows from finance leases | | | 2 | |
| Financing cash flows from finance leases | | | 17 | |
Right of use assets obtained in exchange for lease liabilities follow in millions of dollars:
| | | | | |
|---|---|---|---|---|
| | | | 2020 | |
| Operating leases | | $ | 40 | |
| Finance leases | | | 46 | |
Lessor
The company leases equipment manufactured or sold by the company and a limited amount of non-Deere equipment to retail customers through sales-type, direct financing, and operating leases. Sales-type and direct financing leases are reported in “Financing receivables - net” on the consolidated balance sheet. Operating leases are reported in “Equipment on operating leases - net” on the consolidated balance sheet.
Leases offered by the company may include early termination and renewal options. At the end of a lease, the lessee generally has the option to purchase the underlying equipment for a fixed price or return it to the dealer. If the equipment is returned to the dealer, the dealer also has the option to purchase the equipment or return it to the company for remarketing.
The company estimates the residual values for operating leases at lease inception based on several factors, including lease term, expected hours of usage, historical wholesale sale prices, return experience, intended use of the equipment, market dynamics and trends, and dealer residual guarantees. The company reviews residual value estimates during the lease term and tests the carrying value of its operating lease assets for impairment when events or circumstances necessitate. The depreciation is adjusted on a straight-line basis over the remaining lease term if residual value estimates decline. Lease agreements include usage limits and specifications on machine condition, which allow the company to assess lessees for excess use or damages to the underlying equipment. In 2020 and 2019, the company recorded impairment losses on operating leases of $22 million and $59 million, respectively, due to higher expected equipment return rates and lower estimated values. Operating lease impairments are recorded in “Other operating expenses.”
The company has elected to combine lease and nonlease components. The nonlease components primarily relate to preventative maintenance and extended warranty agreements financed by the retail customer. The company has also elected to report consideration related to sales and value added taxes net of the related tax expense. Property taxes on leased assets are recorded on a gross basis in “Finance and interest income” and “Other operating expenses” on the statement of consolidated income. Variable lease revenues primarily relate to property taxes on leased assets in certain markets and late fees.
Due to the significant, negative effects of COVID, the company provided short-term relief to lessees during 2020. The relief, which included payment deferrals of three months or less, was provided in regional programs and on a case-by-case basis and primarily related to construction accounts. The operating leases granted relief represented approximately 4 percent of the company’s
operating lease portfolio at November 1, 2020. See Note 13 for sales-type and direct financing leases provided payment relief.
Lease revenues earned by the company follow in millions of dollars:
| | | | | |
|---|---|---|---|---|
| | | | 2020 | |
| Sales-type and direct finance lease revenues | | $ | 135 | |
| Operating lease revenues | | | 1,469 | |
| Variable lease revenues | | | 23 | |
| Total lease revenues | | $ | 1,627 | |
At the time of accepting a lease that qualifies as a sales-type or direct financing lease, the company records the gross amount of lease payments receivable, estimated residual value of the leased equipment, and unearned finance income. The unearned finance income is recognized as revenue over the lease term using the interest method.
Sales-type and direct financing lease receivables by product category follow in millions of dollars:
| | | | | | | | |
|---|---|---|---|---|---|---|---|
| | | | 2020 | | | 2019 | |
| Agriculture and turf | | $ | 985 | | $ | 897 | |
| Construction and forestry | | | 1,030 | | | 1,033 | |
| Total | | | 2,015 | | | 1,930 | |
| Guaranteed residual values | | | 278 | | | 232 | |
| Unguaranteed residual values | | | 71 | | | 101 | |
| Less unearned finance income | | | 217 | | | 212 | |
| Financing lease receivables | | $ | 2,147 | | $ | 2,051 | |
Scheduled payments, including guaranteed residual values, on sales-type and direct financing lease receivables at November 1, 2020 follow in millions of dollars:
| | | | | |
|---|---|---|---|---|
| Due in: | | 2020 | | |
| 2021 | | $ | 1,055 | |
| 2022 | | | 595 | |
| 2023 | | | 361 | |
| 2024 | | | 191 | |
| 2025 | | | 74 | |
| Later years | | | 17 | |
| Total | | $ | 2,293 | |
Scheduled payments on financing lease receivables under the previous lease standard at November 3, 2019 follow in millions of dollars:
| | | | | |
|---|---|---|---|---|
| Due in: | | 2019 | | |
| 2020 | | $ | 833 | |
| 2021 | | | 557 | |
| 2022 | | | 321 | |
| 2023 | | | 153 | |
| 2024 | | | 53 | |
| Later years | | | 13 | |
| Total | | $ | 1,930 | |
Lease payments from operating leases are recorded as income on a straight-line method over the lease terms. Operating lease assets are recorded at cost and depreciated to their estimated residual value on a straight-line method over the terms of the leases.
The cost of equipment on operating leases by product category follow in millions of dollars:
| | | | | | | | |
|---|---|---|---|---|---|---|---|
| | | | 2020 | | | 2019 | |
| Agriculture and turf | | $ | 7,366 | | $ | 7,257 | |
| Construction and forestry | | | 1,921 | | | 2,165 | |
| Total | | | 9,287 | | | 9,422 | |
| Less accumulated depreciation | | | 1,989 | | | 1,855 | |
| Equipment on operating leases - net | | $ | 7,298 | | $ | 7,567 | |
The total operating lease residual values at November 1, 2020 and November 3, 2019 were $5,254 million and $5,259 million, respectively. Certain operating leases are subject to residual value guarantees. The total residual value guarantees were $757 million and $647 million at November 1, 2020 and November 3, 2019, respectively. The residual value guarantees at November 1, 2020 and November 3, 2019 include $5 million and $12 million, respectively, of dealer deposits available for potential losses on residual values.
The equipment is depreciated on a straight-line basis over the term of the lease. The corresponding depreciation expense was $1,083 million in 2020, $981 million in 2019, and $928 million in 2018.
Lease payments for equipment on operating leases at November 1, 2020 were scheduled as follows in millions of dollars:
| | | | | |
|---|---|---|---|---|
| Due in: | | 2020 | | |
| 2021 | | $ | 1,073 | |
| 2022 | | | 731 | |
| 2023 | | | 404 | |
| 2024 | | | 197 | |
| 2025 | | | 42 | |
| Later years | | | 4 | |
| Total | | $ | 2,451 | |
Rental payments for equipment on operating leases under the previous lease standard at November 3, 2019 were scheduled as follows in millions of dollars:
| | | | | |
|---|---|---|---|---|
| Due in: | | 2019 | | |
| 2020 | | $ | 1,086 | |
| 2021 | | | 759 | |
| 2022 | | | 419 | |
| 2023 | | | 193 | |
| 2024 | | | 41 | |
| Total | | $ | 2,498 | |
Past due balances of operating leases represent the total balance held (net book value plus accrued lease payments) and still accruing financing income with any payment amounts 30 days or more past the contractual payment due date. These amounts were $87 million and $112 million at November 1, 2020 and November 3, 2019, respectively. The delinquency status of operating leases granted relief due to COVID is based on the modified payment schedule.
The company discusses with lessees and dealers options to purchase the equipment or extend the lease prior to lease maturity. Equipment returned to the company upon termination of leases is remarketed by the company and recorded in “Other assets” at the lower of net book value or estimated fair value of the equipment less costs to sell and is not depreciated. The matured operating lease inventory balances at November 1, 2020 and November 3, 2019 were $70 million and $163 million, respectively. In 2020 and 2019, the company recorded impairment losses on matured operating lease inventory of $10 million and $18 million, respectively. Impairment losses on matured operating lease inventory are included in “Other operating expenses.”
26. FAIR VALUE MEASUREMENTS
Fair value is defined as the price that would be received to sell an asset or paid to transfer a liability in an orderly transaction between market participants at the measurement date. To determine fair value, the company uses various methods including market and income approaches. The company utilizes valuation models and techniques that maximize the use of observable inputs. The models are industry-standard models that consider various assumptions including time values and yield curves as well as other economic measures. These valuation techniques are consistently applied.
Level 1 measurements consist of quoted prices in active markets for identical assets or liabilities. Level 2 measurements include significant other observable inputs such as quoted prices for similar assets or liabilities in active markets; identical assets or liabilities in inactive markets; observable inputs such as interest rates and yield curves; and other market-corroborated inputs. Level 3 measurements include significant unobservable inputs.
The fair values of financial instruments that do not approximate the carrying values at November 1, 2020 and November 3, 2019 in millions of dollars follow:
| | | | | | | | | | | | | | |
|---|---|---|---|---|---|---|---|---|---|---|---|---|---|
| | | 2020 | | 2019 | | ||||||||
| | | Carrying | | Fair | | Carrying | | Fair | | ||||
| | Value | Value* | Value | Value* | |||||||||
| Financing receivables – net: | | | | | | | | | | ||||
| Equipment operations | | $ | 105 | | $ | 103 | | $ | 65 | | $ | 61 | |
| Financial services | | | 29,645 | | | 29,838 | | | 29,130 | | | 29,106 | |
| Total | | $ | 29,750 | | $ | 29,941 | | $ | 29,195 | | $ | 29,167 | |
| Financing receivables securitized – net: | | | | | | | | | | ||||
| Equipment operations | | $ | 26 | | $ | 26 | | $ | 44 | | $ | 43 | |
| Financial services | | | 4,677 | | | 4,773 | | | 4,339 | | | 4,362 | |
| Total | | $ | 4,703 | | $ | 4,799 | | $ | 4,383 | | $ | 4,405 | |
| Short-term securitization borrowings: | | | | | | | | | | ||||
| Equipment operations | | $ | 26 | | $ | 26 | | $ | 44 | | $ | 45 | |
| Financial services | | | 4,656 | | | 4,698 | | | 4,277 | | | 4,302 | |
| Total | | $ | 4,682 | | $ | 4,724 | | $ | 4,321 | | $ | 4,347 | |
| Long-term borrowings due within one year:** | | | | | | | | | | | | | |
| Equipment operations | $ | 79 | $ | 78 | $ | 642 | $ | 645 | | ||||
| Financial services | | 6,870 | | 6,936 | | 6,786 | | 6,788 | | ||||
| Total | $ | 6,949 | $ | 7,014 | $ | 7,428 | $ | 7,433 | | ||||
| Long-term borrowings:** | | | | | | | | | | | | | |
| Equipment operations | $ | 10,085 | $ | 11,837 | $ | 5,415 | $ | 6,138 | | ||||
| Financial services | | 22,610 | | 23,170 | | 24,814 | | 25,122 | | ||||
| Total | $ | 32,695 | $ | 35,007 | $ | 30,229 | $ | 31,260 | |
- Fair value measurements above were Level 3 for all financing receivables, Level 3 for equipment operations short-term securitization borrowings, and Level 2 for all other borrowings.
| ** | Values exclude finance lease liabilities that are presented as borrowings beginning in 2020 (see Note 25). |
|---|
Fair values of the financing receivables that were issued long-term were based on the discounted values of their related cash flows at interest rates currently being offered by the company for similar financing receivables. The fair values of the remaining financing receivables approximated the carrying amounts.
Fair values of long-term borrowings and short-term securitization borrowings were based on current market quotes for identical or similar borrowings and credit risk, or on the discounted values of their related cash flows at current market interest rates. Certain long-term borrowings have been swapped to current variable interest rates. The carrying values of these long-term borrowings included adjustments related to fair value hedges.
Assets and liabilities measured at November 1, 2020 and November 3, 2019 at fair value on a recurring basis in millions of dollars follow*:
| | | | | | | | |
|---|---|---|---|---|---|---|---|
| | 2020 | 2019 | |||||
| Level 1: | | | | | | | |
| Marketable securities | | | | | | | |
| U.S. equity fund | $ | 62 | $ | 59 | | ||
| International equity securities | | | 2 | | | | |
| U.S. government debt securities | | 55 | | 50 | | ||
| Total Level 1 marketable securities | | | 119 | | | 109 | |
| | | | | | | | |
| Level 2: | | | | | | | |
| Marketable securities | | | | | | | |
| U.S. government debt securities | | | 113 | | | 81 | |
| Municipal debt securities | | 68 | | 60 | | ||
| Corporate debt securities | | 188 | | 165 | | ||
| International debt securities | | | 2 | | | 5 | |
| Mortgage-backed securities** | | 147 | | 160 | | ||
| Total Level 2 marketable securities | | 518 | | 471 | | ||
| Other assets | | | | | | | |
| Derivatives: | | | | | | | |
| Interest rate contracts | | 669 | | 363 | | ||
| Foreign exchange contracts | | 48 | | 20 | | ||
| Cross-currency interest rate contracts | | 8 | | 1 | | ||
| Total Level 2 other assets | | | 725 | | | 384 | |
| Accounts payable and accrued expenses | | | | | | | |
| Derivatives: | | | | | | | |
| Interest rate contracts | | 88 | | 65 | | ||
| Foreign exchange contracts | | 26 | | 71 | | ||
| Cross-currency interest rate contracts | | | 1 | | 3 | | |
| Total Level 2 accounts payable and accrued expenses | | | 115 | | | 139 | |
| | | | | | | | |
| Level 3: | | | | | | | |
| Marketable securities | | | | | | | |
| International debt securities | | 4 | | 1 | |
- Excluded from this table were the company’s cash equivalents, which were carried at cost that approximates fair value. The cash equivalents consist primarily of money market funds and time deposits.
** Primarily issued by U.S. government sponsored enterprises.
Fair value, recurring Level 3 measurements from available-for-sale marketable securities at November 1, 2020, November 3, 2019, and October 28, 2018 in millions of dollars follow:
| | | | | | | | | | | | |
|---|---|---|---|---|---|---|---|---|---|---|---|
| | 2020 | 2019 | 2018 | | | ||||||
| Beginning of year balance | | $ | 1 | | $ | 8 | $ | 17 | | | |
| Purchases | | | 9 | | | | | | | | |
| Principal payments | | | (1) | | | (8) | | | (9) | | |
| Change in unrealized gain | | | | | | | | | 1 | | |
| Other | | | (5) | | | 1 | | | (1) | | |
| End of year balance | | $ | 4 | | $ | 1 | | $ | 8 | | |
Fair value, nonrecurring Level 3 measurements from impairments at November 1, 2020 and November 3, 2019 in millions of dollars follow:
| | | | | | | | | | | | | | | | | |
|---|---|---|---|---|---|---|---|---|---|---|---|---|---|---|---|---|
| | | Fair Value | | Losses | | |||||||||||
| | 2020 | 2019 | 2020 | 2019 | 2018 | | ||||||||||
| Other receivables 1 | | $ | 1 | | | $ | 2 | | | | | | | |||
| Equipment on operating leases – net 2 | $ | 371 | $ | 855 | $ | 22 | $ | 59 | | | | | ||||
| Property and equipment – net 3 | $ | 135 | | | $ | 102 | | | | | | | ||||
| Investments in unconsolidated affiliates 4 | | $ | 19 | | | | | $ | 50 | | | | | | | |
| Other intangible assets – net | | | | | | | | $ | 2 | | | | | | | |
| Other assets 2 | $ | 59 | | $ | 142 | $ | 16 | | $ | 18 | | | | |
1 Fair value as of August 2, 2020.
2 Fair value as of May 3, 2020.
3 Fair value of $70 million at May 3, 2020, $8 million at August 2, 2020, and $57 million at November 1, 2020.
4 Fair value as of November 1, 2020.
The following is a description of the valuation methodologies the company uses to measure certain financial instruments on the balance sheet at fair value:
Marketable Securities – The portfolio of investments, except for the Level 3 measurement international debt securities, is primarily valued on a market approach (matrix pricing model) in which all significant inputs are observable or can be derived from or corroborated by observable market data such as interest rates, yield curves, volatilities, credit risk, and prepayment speeds. Funds are primarily valued using the fund’s net asset value, based on the fair value of the underlying securities. The Level 3 measurement international debt securities are primarily valued using an income approach based on discounted cash flows using yield curves derived from limited, observable market data.
Derivatives – The company’s derivative financial instruments consist of interest rate swaps and caps, foreign currency futures, forwards and swaps, and cross-currency interest rate swaps. The portfolio is valued based on an income approach (discounted cash flow) using market observable inputs, including swap curves and both forward and spot exchange rates for currencies.
Financing Receivables – Specific reserve impairments are based on the fair value of the collateral, which is measured using a market approach (appraisal values or realizable values). Inputs include a selection of realizable values (see Note 13).
Other Receivables – The impairment was based on the expected realization of value-added tax receivables related to a closed factory operation (see Note 5).
Equipment on Operating Leases – Net – The impairments are based on an income approach (discounted cash flow), using the contractual payments, plus an estimate of return rates and equipment sale price at lease maturity. Inputs include realized sales values (see Note 5).
Property and Equipment – Net – The impairments are measured at the lower of the carrying amount, or fair value. The valuations were based on a cost approach. The inputs include replacement cost estimates adjusted for physical deterioration and economic obsolescence (see Note 5).
Investment in Unconsolidated Affiliates – Other than temporary impairments for investments are measured as the difference between the implied fair value and the carrying value of the investments or the estimated realization amount (see Note 5).
Other Intangible Assets – Net – The impairment was measured at the remaining net book value of customer relationships related to a closed factory operation (see Note 5).
Other Assets – The impairments of the matured operating lease inventory were measured at the fair value of that inventory. The inputs include sales of comparable assets (see Note 5).
27. DERIVATIVE INSTRUMENTS
Cash Flow Hedges
Certain interest rate and cross-currency interest rate contracts (swaps) were designated as hedges of future cash flows from borrowings. The total notional amounts of the receive-variable/pay-fixed interest rate contracts at November 1, 2020 and November 3, 2019 were $1,550 million and $3,150 million, respectively. During 2019, the company hedged a portion of its exposure to interest rate changes on a forecasted debt issuance using an interest rate contract with a term of 30 years. The hedge was terminated upon issuance of the debt, resulting in a fair value loss of $70 million. Fair value gains or losses on cash flow hedges were recorded in OCI and are subsequently reclassified into interest expense or other operating expenses (foreign exchange) in the same periods during which the hedged transactions impact earnings. These amounts offset the effects of interest rate or foreign currency exchange rate changes on the related borrowings. The cash flows from these contracts were recorded in operating activities in the statement of consolidated cash flows.
The amount of loss recorded in OCI at November 1, 2020 that is expected to be reclassified to interest expense or other operating expenses in the next twelve months if interest rates or exchange rates remain unchanged is approximately $9 million after-tax. There were no gains or losses reclassified from OCI to earnings based on the probability that the original forecasted transaction would not occur.
Fair Value Hedges
Certain interest rate contracts (swaps) were designated as fair value hedges of borrowings. The total notional amounts of the receive-fixed/pay-variable interest rate contracts at November 1, 2020 and November 3, 2019 were $7,239 million and $8,717 million, respectively. The fair value gains or losses on these contracts were generally offset by fair value gains or losses on the hedged items (fixed-rate borrowings) with both items recorded in interest expense.
The amounts recorded, at November 1, 2020 and November 3, 2019, in the consolidated balance sheet related to borrowings designated in fair value hedging relationships in millions of dollars follow:
| | | | | | | | | | | | | | |
|---|---|---|---|---|---|---|---|---|---|---|---|---|---|
| | | | | | Cumulative Increase (Decrease) of | | |||||||
| | | | | | Fair Value Hedging Adjustments | | |||||||
| | | Carrying | | Included in the Carrying Amount | | ||||||||
| | | Amount of | | Active | | | | | | | |||
| | | Hedged | | Hedging | | Discontinued | | | | | |||
| | | Item | | Relationships | | Relationships | | Total | | ||||
| 2020 | | | | | | | | | | | | | |
| Long-term borrowings due within one year* | | $ | 155 | | $ | 2 | | $ | 3 | | $ | 5 | |
| Long-term borrowings | | | 7,725 | | | 543 | | | 122 | | | 665 | |
| 2019 | | | | | | | | | | | | | |
| Long-term borrowings due within one year* | | $ | 412 | | $ | (1) | | $ | (4) | | $ | (5) | |
| Long-term borrowings | | | 8,532 | | | 295 | | | (32) | | | 263 | |
- Presented in short-term borrowings.
Derivatives Not Designated as Hedging Instruments
The company has certain interest rate contracts (swaps and caps), foreign exchange contracts (futures, forwards, and swaps), and cross-currency interest rate contracts (swaps), which were not formally designated as hedges. These derivatives were held as economic hedges for underlying interest rate or foreign currency exposures primarily for certain borrowings, purchases or sales of inventory, and below market retail financing programs. The total notional amounts of the interest rate swaps at November 1, 2020 and November 3, 2019 were $8,514 million and $9,166 million, the foreign exchange contracts were $4,903 million and $4,962 million, and the cross-currency interest rate contracts were $113 million and $92 million, respectively. The fair value gains or losses from the interest rate contracts were recognized currently in interest expense and the gains or losses from foreign exchange contracts in cost of sales or other operating expenses, generally offsetting over time the expenses on the exposures being hedged. The cash flows from these non-designated contracts were recorded in operating activities in the statement of consolidated cash flows.
Fair values of derivative instruments in the consolidated balance sheet at November 1, 2020 and November 3, 2019 in millions of dollars follow:
| | | | | | | | |
|---|---|---|---|---|---|---|---|
| | 2020 | 2019 | |||||
| Other Assets | | | | | | | |
| Designated as hedging instruments: | | | | | | | |
| Interest rate contracts | $ | 586 | $ | 332 | | ||
| Total designated | | 586 | | | 332 | | |
| Not designated as hedging instruments: | | | | | | | |
| Interest rate contracts | | 83 | | | 31 | | |
| Foreign exchange contracts | | 48 | | | 20 | | |
| Cross-currency interest rate contracts | | 8 | | | 1 | | |
| Total not designated | | 139 | | | 52 | | |
| Total derivative assets | $ | 725 | $ | 384 | | ||
| Accounts Payable and Accrued Expenses | | | | | | | |
| Designated as hedging instruments: | | | | | | | |
| Interest rate contracts | $ | 14 | $ | 28 | | ||
| Total designated | | 14 | | | 28 | | |
| Not designated as hedging instruments: | | | | | | | |
| Interest rate contracts | | | 74 | | | 37 | |
| Foreign exchange contracts | | 26 | | | 71 | | |
| Cross-currency interest rate contracts | | | 1 | | | 3 | |
| Total not designated | | 101 | | | 111 | | |
| Total derivative liabilities | $ | 115 | $ | 139 | |
The classification and gains (losses) including accrued interest expense related to derivative instruments on the statement of consolidated income consisted of the following in millions of dollars:
| | | | | | | | | | | |
|---|---|---|---|---|---|---|---|---|---|---|
| | 2020 | 2019 | 2018 | |||||||
| Fair Value Hedges | | | | | | | | | | |
| Interest rate contracts – Interest expense | $ | 496 | $ | 589 | $ | (283) | | |||
| | | | | | | | | | | |
| Cash Flow Hedges | | | | | | | | | | |
| Recognized in OCI | | | | | | | | | | |
| Interest rate contracts – OCI (pretax)* | | (18) | | (92) | | 17 | | |||
| Foreign exchange contracts – OCI (pretax)* | | | | | | 2 | | |||
| | | | | | | | | | | |
| Reclassified from OCI | | | | | | | | | | |
| Interest rate contracts – Interest expense* | | (21) | | 5 | | 5 | | |||
| Foreign exchange contracts – Other expense* | | | | | | 1 | | |||
| | | | | | | | | | | |
| Not Designated as Hedges | | | | | | | | | | |
| Interest rate contracts – Net sales | | $ | (23) | | $ | (23) | | $ | 3 | |
| Interest rate contracts – Interest expense* | | (2) | | (32) | | (4) | | |||
| Foreign exchange contracts – Cost of sales | | 93 | | (18) | | (24) | | |||
| Foreign exchange contracts – Other expense* | | 122 | | 97 | | 195 | | |||
| Total not designated | $ | 190 | $ | 24 | $ | 170 | |
- Includes interest and foreign exchange gains (losses) from cross-currency
interest rate contracts.
Counterparty Risk and Collateral
Derivative instruments are subject to significant concentrations of credit risk to the banking sector. The company manages individual counterparty exposure by setting limits that consider the credit rating of the counterparty, the credit default swap spread of the counterparty, and other financial commitments and exposures between the company and the counterparty banks. All interest rate derivatives are transacted under International Swaps and
Derivatives Association (ISDA) documentation. Some of these agreements include credit support provisions. Each master agreement permits the net settlement of amounts owed in the event of default or termination.
Certain of the company’s derivative agreements contain credit support provisions that may require the company to post collateral based on the size of the net liability positions and credit ratings. The aggregate fair value of all derivatives with credit-risk-related contingent features that were in a net liability position at November 1, 2020 and November 3, 2019, was $89 million and $68 million, respectively. In accordance with the limits established in these agreements, the company posted no cash collateral at November 1, 2020 or November 3, 2019. In addition, the company paid $8 million of collateral either in cash or pledged securities that was outstanding at November 1, 2020 to participate in an international futures market to hedge currency exposure, not included in the table below.
Derivatives are recorded without offsetting for netting arrangements or collateral. The impact on the derivative assets and liabilities related to netting arrangements and collateral at November 1, 2020 and November 3, 2019 in millions of dollars follows:
| | | | | | | | | | | | | | |
|---|---|---|---|---|---|---|---|---|---|---|---|---|---|
| | | Gross Amounts | | Netting | | | | Net | | ||||
| | Recognized | Arrangements | Collateral | Amount | |||||||||
| 2020 | | | | | | | | | | | | | |
| Assets | $ | 725 | $ | (93) | $ | (274) | $ | 358 | | ||||
| Liabilities | | 115 | | (93) | | | | | | 22 | | ||
| 2019 | | | | | | | | | | | | | |
| Assets | $ | 384 | $ | (70) | | | $ | 314 | | ||||
| Liabilities | | 139 | | (70) | | | | | | 69 | |
28. SEGMENT AND GEOGRAPHIC AREA DATA
The company’s operations are presently organized and reported in three major business segments described as follows:
The agriculture and turf segment primarily manufactures and distributes a full line of agriculture and turf equipment and related service parts, including: large, medium, and utility tractors; tractor loaders; combines, cotton pickers, cotton strippers, and sugarcane harvesters; harvesting front-end equipment; sugarcane loaders and pull-behind scrapers; tillage, seeding, and application equipment, including sprayers, nutrient management, and soil preparation machinery; hay and forage equipment, including self-propelled forage harvesters and attachments, balers and mowers; turf and utility equipment, including riding lawn equipment, golf course equipment, utility vehicles, and commercial mowing equipment, along with a broad line of associated implements; integrated agricultural solutions and precision technologies; and other outdoor power products.
The construction and forestry segment primarily manufactures and distributes a broad range of machines and service parts used in construction, earthmoving, roadbuilding, material handling, and timber harvesting, including: backhoe loaders; crawler dozers and loaders; four-wheel-drive loaders; excavators; motor graders; articulated dump trucks; landscape loaders; skid-steer loaders; milling machines; recyclers; slipform pavers; surface miners; asphalt pavers; compactors; tandem and static rollers; mobile crushers and screens; mobile and stationary asphalt plants; log skidders; feller bunchers; log loaders; log forwarders; log harvesters; and related logging attachments; and precision technologies.
The products and services produced by the segments above are marketed primarily through independent retail dealer networks and major retail outlets, and, as it relates to roadbuilding products, primarily through company-owned sales and service subsidiaries.
The financial services segment primarily finances sales and leases by John Deere dealers of new and used agriculture and turf equipment and construction and forestry equipment. In addition, the financial services segment provides wholesale financing to dealers of the foregoing equipment, finances retail revolving charge accounts, and offers extended equipment warranties.
Because of integrated manufacturing operations and common administrative and marketing support, a substantial number of allocations must be made to determine operating segment and geographic area data. Intersegment sales and revenues represent sales of components and finance charges, which are generally based on market prices.
Information relating to operations by operating segment in millions of dollars follows for the years ended November 1, 2020, November 3, 2019, and October 28, 2018. In addition to the following unaffiliated sales and revenues by segment, intersegment sales and revenues in 2020, 2019, and 2018 were as follows: agriculture and turf net sales of $24 million, $34 million, and $47 million, construction and forestry net sales of $1 million, $1 million, and none, and financial services revenues of $278 million, $348 million, and $308 million, respectively.
| | | | | | | | | | | |
|---|---|---|---|---|---|---|---|---|---|---|
| OPERATING SEGMENTS | | 2020 | 2019 | 2018 | ||||||
| Net sales and revenues | | | | | | | ||||
| Unaffiliated customers: | | | | | | | | | | |
| Agriculture and turf net sales | | $ | 22,325 | | $ | 23,666 | | $ | 23,191 | |
| Construction and forestry net sales | | 8,947 | | 11,220 | | 10,160 | | |||
| Total net sales | | 31,272 | | 34,886 | | 33,351 | | |||
| Financial services revenues | | 3,589 | | 3,621 | | 3,252 | | |||
| Other revenues* | | 679 | | 751 | | 755 | | |||
| Total | | $ | 35,540 | | $ | 39,258 | | $ | 37,358 | |
- Other revenues are primarily the equipment operations’ revenues for finance and interest income, and other income.
(continued)
| | | | | | | | | | | |
|---|---|---|---|---|---|---|---|---|---|---|
| OPERATING SEGMENTS | 2020 | 2019 | 2018 | |||||||
| Operating profit | | | | | | | ||||
| Agriculture and turf | | $ | 2,969 | | $ | 2,506 | | $ | 2,816 | |
| Construction and forestry | | 590 | | 1,215 | | 868 | | |||
| Financial services* | | 746 | | 694 | | 792 | | |||
| Total operating profit* | | 4,305 | | 4,415 | | 4,476 | | |||
| Interest income | | 62 | | 85 | | 80 | | |||
| Interest expense | | (329) | | (256) | | (298) | | |||
| Foreign exchange gains (losses) from equipment operations’ financing activities | | 17 | | (22) | | 36 | | |||
| Pension and OPEB benefit (cost), excluding service cost component | | | 31 | | | 67 | | | (15) | |
| Corporate expenses – net | | (251) | | (180) | | (181) | | |||
| Income taxes | | (1,082) | | (852) | | (1,727) | | |||
| Total | | (1,552) | | (1,158) | | (2,105) | | |||
| Net income | | 2,753 | | 3,257 | | 2,371 | | |||
| Less: Net income attributable to noncontrolling interests | | 2 | | | 4 | | | 3 | | |
| Net income attributable to Deere & Company | | $ | 2,751 | | $ | 3,253 | | $ | 2,368 | |
- Operating profit of the financial services business segment includes the effect of its interest expense and foreign exchange gains or losses.
| | | | | | | | | | | |
|---|---|---|---|---|---|---|---|---|---|---|
| Interest income* | | | | | | | ||||
| Agriculture and turf | | $ | 38 | | $ | 22 | | $ | 14 | |
| Construction and forestry | | 12 | | 11 | | 33 | | |||
| Financial services | | 2,122 | | 2,316 | | 1,997 | | |||
| Corporate | | 62 | | 85 | | 80 | | |||
| Intercompany | | (272) | | (360) | | (330) | | |||
| Total | | $ | 1,962 | | $ | 2,074 | | $ | 1,794 | |
- Does not include finance rental income for equipment on operating leases.
| | | | | | | | | | | |
|---|---|---|---|---|---|---|---|---|---|---|
| Interest expense | | | | | | | ||||
| Agriculture and turf | | $ | 187 | | $ | 245 | | $ | 229 | |
| Construction and forestry | | 61 | | 91 | | 71 | | |||
| Financial services | | 942 | | 1,234 | | 936 | | |||
| Corporate | | 329 | | 256 | | 298 | | |||
| Intercompany | | (272) | | (360) | | (330) | | |||
| Total | | $ | 1,247 | | $ | 1,466 | | $ | 1,204 | |
| | | | | | | | | | | |
| Depreciation and amortization expense* | | | | | | | ||||
| Agriculture and turf | | $ | 727 | | $ | 723 | | $ | 723 | |
| Construction and forestry | | 289 | | 292 | | 251 | | |||
| Financial services | | 1,227 | | 1,135 | | 1,077 | | |||
| Intercompany | | | (125) | | | (131) | | | (124) | |
| Total | | $ | 2,118 | | $ | 2,019 | | $ | 1,927 | |
- Includes depreciation for equipment on operating leases.
(continued)
| | | | | | | | | | | |
|---|---|---|---|---|---|---|---|---|---|---|
| OPERATING SEGMENTS | 2020 | 2019 | 2018 | |||||||
| Equity in income (loss) of unconsolidated affiliates | | | | | | | ||||
| Agriculture and turf | | $ | 2 | | $ | 6 | | $ | 6 | |
| Construction and forestry | | (52) | | | 14 | | | 19 | | |
| Financial services | | 2 | | 1 | | 2 | | |||
| Total | | $ | (48) | | $ | 21 | | $ | 27 | |
| | | | | | | | | | | |
| | | | | | | | | | | |
| Identifiable operating assets | | | | | | | ||||
| Agriculture and turf | | $ | 9,575 | | $ | 10,379 | | $ | 10,161 | |
| Construction and forestry | | 8,802 | | 9,387 | | 9,855 | | |||
| Financial services | | 48,719 | | 48,483 | | 45,720 | | |||
| Corporate* | | 7,995 | | 4,762 | | 4,372 | | |||
| Total | | $ | 75,091 | | $ | 73,011 | | $ | 70,108 | |
- Corporate assets are primarily the equipment operations’ retirement benefits, deferred income tax assets, marketable securities, and cash and cash equivalents.
| | | | | | | | | | | |
|---|---|---|---|---|---|---|---|---|---|---|
| Capital additions | | | | | | |||||
| Agriculture and turf | | $ | 654 | | $ | 859 | | $ | 675 | |
| Construction and forestry | | 157 | | 245 | | 308 | | |||
| Financial services | | 4 | | 3 | | 2 | | |||
| Total | | $ | 815 | | $ | 1,107 | | $ | 985 | |
| | | | | | | | | | | |
| | | | | | | | | | | |
| Investments in unconsolidated affiliates | | | | | | | ||||
| Agriculture and turf | | $ | 30 | | $ | 28 | | $ | 26 | |
| Construction and forestry | | 144 | | 171 | | 166 | | |||
| Financial services | | 19 | | 16 | | 15 | | |||
| Total | | $ | 193 | | $ | 215 | | $ | 207 | |
The company views and has historically disclosed its operations as consisting of two geographic areas, the U.S. and Canada, and outside the U.S. and Canada, shown below in millions of dollars. No individual foreign country’s net sales and revenues were material for disclosure purposes.
| | | | | | | | | | | |
|---|---|---|---|---|---|---|---|---|---|---|
| GEOGRAPHIC AREAS | | 2020 | | 2019 | | 2018 | ||||
| Net sales and revenues | | | | | | | ||||
| Unaffiliated customers: | | | | | | | | | | |
| U.S. and Canada: | | | | | | | | | | |
| Equipment operations net sales and revenues* | | $ | 18,288 | | $ | 20,647 | | $ | 18,847 | |
| Financial services revenues* | | 3,098 | | 3,099 | | 2,785 | | |||
| Total | | 21,386 | | 23,746 | | 21,632 | | |||
| Outside U.S. and Canada: | | | | | | | | | | |
| Equipment operations net sales and revenues | | 13,663 | | 14,990 | | 14,504 | | |||
| Financial services revenues | | 491 | | 522 | | 467 | | |||
| Total | | 14,154 | | 15,512 | | 14,971 | | |||
| Other revenues | | | | | | 755 | | |||
| Total | | $ | 35,540 | | $ | 39,258 | | $ | 37,358 | |
- The 2018 equipment operations’ amounts are only for net sales and approximate the proportion of each amount that relates to the U.S. only based on a three-year average. The equipment operations’ percentage for 2018 was 88%. The financial services’ U.S. only percentages was 79% for 2018. See Note 6 for additional 2020 and 2019 geographic net sales and revenues information.
(continued)
| | | | | | | | | | | |
|---|---|---|---|---|---|---|---|---|---|---|
| GEOGRAPHIC AREAS | 2020 | 2019 | 2018 | | ||||||
| Operating profit | | | | | | | | |||
| U.S. and Canada: | | | | | | | | | | |
| Equipment operations | | $ | 2,194 | | $ | 2,335 | | $ | 2,356 | |
| Financial services | | 581 | | 506 | | 604 | | |||
| Total | | 2,775 | | 2,841 | | 2,960 | | |||
| Outside U.S. and Canada: | | | | | | | | | | |
| Equipment operations | | 1,365 | | 1,386 | | 1,328 | | |||
| Financial services | | 165 | | 188 | | 188 | | |||
| Total | | 1,530 | | 1,574 | | 1,516 | | |||
| Total | | $ | 4,305 | | $ | 4,415 | | $ | 4,476 | |
| | | | | | | | | | | |
|---|---|---|---|---|---|---|---|---|---|---|
| Property and equipment | | | | | | | ||||
| U.S. | | $ | 3,150 | | $ | 3,169 | | $ | 3,031 | |
| Germany | | 1,113 | | 1,137 | | 1,164 | | |||
| Other countries | | 1,554 | | 1,667 | | 1,673 | | |||
| Total | | $ | 5,817 | | $ | 5,973 | | $ | 5,868 | |
29. SUPPLEMENTAL INFORMATION (UNAUDITED)
The $1 par value common stock of Deere & Company is listed on the New York Stock Exchange under the symbol “DE”. At November 1, 2020, there were 19,226 holders of record of the company’s $1 par value common stock.
Quarterly information with respect to net sales and revenues and earnings is shown in the following schedule. The company uses a 52/53 week fiscal year ending on the last Sunday in the reporting period (see Note 1). Fiscal year 2020 contained 52 weeks and the fourth quarter contained 13 weeks compared to 53 weeks and 14 weeks in the respective periods in fiscal year 2019. The interim periods (quarters) end in January, April, and July. Such information is shown in millions of dollars except for per share amounts.
| | | | | | | | | | | | | | |
|---|---|---|---|---|---|---|---|---|---|---|---|---|---|
| | First | Second | Third | Fourth | |||||||||
| | Quarter | Quarter | Quarter | Quarter | |||||||||
| 2020* | | | | | | | | | | | | | |
| Net sales and revenues | | $ | 7,631 | | $ | 9,253 | | $ | 8,925 | | $ | 9,731 | |
| Net sales | | 6,530 | | 8,224 | | 7,859 | | 8,659 | | ||||
| Gross profit | | 1,452 | | 1,930 | | 2,024 | | 2,189 | | ||||
| Income before income taxes | | 569 | | 929 | | 1,270 | | 1,115 | | ||||
| Net income attributable to Deere & Company | | 517 | | 666 | | 811 | | 757 | | ||||
| Per share data: | | | | | | | | | | | | | |
| Basic | | 1.65 | | 2.13 | | 2.59 | | 2.41 | | ||||
| Diluted | | 1.63 | | 2.11 | | 2.57 | | 2.39 | | ||||
| Dividends declared | | .76 | | .76 | | .76 | | .76 | | ||||
| Dividends paid | | .76 | | .76 | | .76 | | .76 | | ||||
| 2019* | | | | | | | | | | | | | |
| Net sales and revenues | | $ | 7,984 | | $ | 11,342 | | $ | 10,036 | | $ | 9,896 | |
| Net sales | | 6,941 | | 10,273 | | 8,969 | | 8,703 | | ||||
| Gross profit | | 1,509 | | 2,518 | | 2,099 | | 1,968 | | ||||
| Income before income taxes | | 677 | | 1,473 | | 1,113 | | 825 | | ||||
| Net income attributable to Deere & Company | | 498 | | 1,135 | | 899 | | 721 | | ||||
| Per share data: | | | | | | | | | | | | | |
| Basic | | 1.56 | | 3.57 | | 2.84 | | 2.30 | | ||||
| Diluted | | 1.54 | | 3.52 | | 2.81 | | 2.27 | | ||||
| Dividends declared | | .76 | | .76 | | .76 | | .76 | | ||||
| Dividends paid | | .69 | | .76 | | .76 | | .76 | |
Net income per share for each quarter must be computed independently. As a result, their sum may not equal the total net income per share for the year.
- See Note 5 for “Special Items.”
30. SUBSEQUENT EVENT
A quarterly dividend of $.76 per share was declared at the Board of Directors meeting on December 2, 2020, payable on February 8, 2021 to stockholders of record on December 31, 2020.
DEERE & COMPANY
SELECTED FINANCIAL DATA
(Dollars in millions except per share amounts)
| | | | | | | | | | | | | | | | | | | | | | | | | | | | | | | | |
|---|---|---|---|---|---|---|---|---|---|---|---|---|---|---|---|---|---|---|---|---|---|---|---|---|---|---|---|---|---|---|---|
| | 2020 | | 2019 | | 2018 | | 2017 | | 2016 | | 2015 | | 2014 | | 2013 | | 2012 | | 2011 | ||||||||||||
| Net sales and revenues | | $ | 35,540 | | $ | 39,258 | | $ | 37,358 | | $ | 29,738 | | $ | 26,644 | | $ | 28,863 | | $ | 36,067 | | $ | 37,795 | | $ | 36,157 | | $ | 32,013 | |
| Net sales | | 31,272 | | 34,886 | | 33,351 | | 25,885 | | 23,387 | | 25,775 | | 32,961 | | 34,998 | | 33,501 | | 29,466 | | ||||||||||
| Finance and interest income | | 3,450 | | 3,493 | | 3,107 | | 2,732 | | 2,511 | | 2,381 | | 2,282 | | 2,115 | | 1,981 | | 1,923 | | ||||||||||
| Research and development expenses | | 1,644 | | 1,783 | | 1,658 | | 1,373 | | 1,394 | | 1,410 | | 1,437 | | 1,445 | | 1,409 | | 1,192 | | ||||||||||
| Selling, administrative and general expenses | | 3,477 | | 3,551 | | 3,455 | | 3,098 | | 2,791 | | 2,868 | | 3,266 | | 3,558 | | 3,369 | | 3,143 | | ||||||||||
| Interest expense | | 1,247 | | 1,466 | | 1,204 | | 899 | | 764 | | 680 | | 664 | | 741 | | 783 | | 759 | | ||||||||||
| Net income* | | 2,751 | | 3,253 | | 2,368 | | 2,159 | | 1,524 | | 1,940 | | 3,162 | | 3,537 | | 3,065 | | 2,800 | | ||||||||||
| Return on net sales | | | 8.8% | | | 9.3% | | | 7.1% | | | 8.3% | | | 6.5% | | | 7.5% | | | 9.6% | | | 10.1% | | | 9.1% | | | 9.5% | |
| Return on beginning Deere & Company stockholders’ equity | | | 24.1% | | | 28.8% | | | 24.8% | | | 33.1% | | | 22.6% | | | 21.4% | | | 30.8% | | | 51.7% | | | 45.1% | | | 44.5% | |
| Comprehensive income* | | 2,819 | | 2,081 | | 3,222 | | 3,221 | | 627 | | 994 | | 2,072 | | 5,416 | | 2,171 | | 2,502 | | ||||||||||
| | | | | | | | | | | | | | | | | | | | | | | | | | | | | | | | |
| | | | | | | | | | | | | | | | | | | | | | | | | | | | | | | | |
| Net income per share – basic* | | $ | 8.77 | | $ | 10.28 | | $ | 7.34 | | $ | 6.76 | | $ | 4.83 | | $ | 5.81 | | $ | 8.71 | | $ | 9.18 | | $ | 7.72 | | $ | 6.71 | |
| – diluted* | | 8.69 | | 10.15 | | 7.24 | | 6.68 | | 4.81 | | 5.77 | | 8.63 | | 9.09 | | 7.63 | | 6.63 | | ||||||||||
| Dividends declared per share | | 3.04 | | 3.04 | | 2.58 | | 2.40 | | 2.40 | | 2.40 | | 2.22 | | 1.99 | | 1.79 | | 1.52 | | ||||||||||
| Dividends paid per share | | 3.04 | | 2.97 | | 2.49 | | 2.40 | | 2.40 | | 2.40 | | 2.13 | | 1.94 | | 1.74 | | 1.41 | | ||||||||||
| Average number of common shares outstanding (in millions) – basic | | | 313.5 | | 316.5 | | 322.6 | | 319.5 | | 315.2 | | 333.6 | | 363.0 | | 385.3 | | 397.1 | | 417.4 | | |||||||||
| – diluted | | 316.6 | | 320.6 | | 327.3 | | 323.3 | | 316.6 | | 336.0 | | 366.1 | | 389.2 | | 401.5 | | 422.4 | | ||||||||||
| | | | | | | | | | | | | | | | | | | | | | | | | | | | | | | | |
| | | | | | | | | | | | | | | | | | | | | | | | | | | | | | | | |
| Total assets | | $ | 75,091 | | $ | 73,011 | | $ | 70,108 | | $ | 65,786 | | $ | 57,918 | | $ | 57,883 | | $ | 61,267 | | $ | 59,454 | | $ | 56,193 | | $ | 48,146 | |
| Trade accounts and notes receivable – net | | 4,171 | | 5,230 | | 5,004 | | 3,925 | | 3,011 | | 3,051 | | 3,278 | | 3,758 | | 3,799 | | 3,295 | | ||||||||||
| Financing receivables – net | | 29,750 | | 29,195 | | 27,054 | | 25,104 | | 23,702 | | 24,809 | | 27,422 | | 25,633 | | 22,159 | | 19,924 | | ||||||||||
| Financing receivables securitized – net | | 4,703 | | 4,383 | | 4,022 | | 4,159 | | 5,127 | | 4,835 | | 4,602 | | 4,153 | | 3,618 | | 2,905 | | ||||||||||
| Equipment on operating leases – net | | 7,298 | | 7,567 | | 7,165 | | 6,594 | | 5,902 | | 4,970 | | 4,016 | | 3,152 | | 2,528 | | 2,150 | | ||||||||||
| Inventories | | 4,999 | | 5,975 | | 6,149 | | 3,904 | | 3,341 | | 3,817 | | 4,210 | | 4,935 | | 5,170 | | 4,371 | | ||||||||||
| Property and equipment – net | | 5,817 | | 5,973 | | 5,868 | | 5,068 | | 5,171 | | 5,181 | | 5,578 | | 5,467 | | 5,012 | | 4,352 | | ||||||||||
| Short-term borrowings: | | | | | | | | | | | | | | | | | | | | | | | | | | | | | | | |
| Equipment operations | | 292 | | 987 | | 1,434 | | 375 | | 249 | | 464 | | 434 | | 1,080 | | 425 | | 529 | | ||||||||||
| Financial services | | 8,290 | | 9,797 | | 9,628 | | 9,660 | | 6,662 | | 7,961 | | 7,584 | | 7,707 | | 5,966 | | 6,307 | | ||||||||||
| Total | | 8,582 | | 10,784 | | 11,062 | | 10,035 | | 6,911 | | 8,425 | | 8,018 | | 8,787 | | 6,391 | | 6,836 | | ||||||||||
| Short-term securitization borrowings: | | | | | | | | | | | | | | | | | | | | | | | | | | | | | | | |
| Equipment operations | | | 26 | | | 44 | | | 75 | | | | | | | | | | | | | | | | | | | | | | |
| Financial services | | 4,656 | | 4,277 | | 3,882 | | 4,119 | | 4,998 | | 4,585 | | 4,553 | | 4,103 | | 3,569 | | 2,773 | | ||||||||||
| Total | | | 4,682 | | | 4,321 | | | 3,957 | | | 4,119 | | | 4,998 | | | 4,585 | | | 4,553 | | | 4,103 | | | 3,569 | | | 2,773 | |
| Long-term borrowings: | | | | | | | | | | | | | | | | | | | | | | | | | | | | | | | |
| Equipment operations | | 10,124 | | 5,415 | | 4,714 | | 5,491 | | 4,565 | | 4,439 | | 4,619 | | 4,845 | | 5,418 | | 3,155 | | ||||||||||
| Financial services | | 22,610 | | 24,814 | | 22,523 | | 20,400 | | 19,138 | | 19,336 | | 19,699 | | 16,673 | | 16,970 | | 13,764 | | ||||||||||
| Total | | 32,734 | | 30,229 | | 27,237 | | 25,891 | | 23,703 | | 23,775 | | 24,318 | | 21,518 | | 22,388 | | 16,919 | | ||||||||||
| Total Deere & Company stockholders’ equity | | 12,937 | | 11,413 | | 11,288 | | 9,557 | | 6,520 | | 6,743 | | 9,063 | | 10,266 | | 6,842 | | 6,800 | | ||||||||||
| | | | | | | | | | | | | | | | | | | | | | | | | | | | | | | | |
| | | | | | | | | | | | | | | | | | | | | | | | | | | | | | | | |
| Book value per share* | | $ | 41.25 | | $ | 36.45 | | $ | 35.45 | | $ | 29.70 | | $ | 20.71 | | $ | 21.29 | | $ | 26.23 | | $ | 27.46 | | $ | 17.64 | | $ | 16.75 | |
| Capital expenditures | | $ | 762 | | $ | 1,084 | | $ | 969 | | $ | 586 | | $ | 668 | | $ | 655 | | $ | 1,004 | | $ | 1,132 | | $ | 1,360 | | $ | 1,050 | |
| Number of employees (at year end) | | 69,634 | | 73,489 | | 74,413 | | 60,476 | | 56,767 | | 57,180 | | 59,623 | | 67,044 | | 66,859 | | 61,278 | |
- Attributable to Deere & Company.
REPORT OF INDEPENDENT REGISTERED PUBLIC ACCOUNTING FIRM
To the stockholders and the Board of Directors of Deere & Company:
Opinion on the Financial Statements
We have audited the accompanying consolidated balance sheets of Deere & Company and subsidiaries (the "Company") as of November 1, 2020 and November 3, 2019, the related statements of consolidated income, consolidated comprehensive income, changes in consolidated stockholders' equity, and consolidated cash flows for each of the three years in the period ended November 1, 2020, and the related notes (collectively referred to as the "financial statements”). In our opinion, the financial statements present fairly, in all material respects, the financial position of the Company as of November 1, 2020, and November 3, 2019, and the results of its operations and its cash flows for each of the three years in the period ended November 1, 2020, in conformity with accounting principles generally accepted in the United States of America.
We have also audited, in accordance with the standards of the Public Company Accounting Oversight Board (United States) (PCAOB), the Company's internal control over financial reporting as of November 1, 2020, based on criteria established in Internal Control — Integrated Framework (2013) issued by the Committee of Sponsoring Organizations of the Treadway Commission and our report dated December 17, 2020, expressed an unqualified opinion on the Company's internal control over financial reporting.
Basis for Opinion
These financial statements are the responsibility of the Company's management. Our responsibility is to express an opinion on the Company's financial statements based on our audits. We are a public accounting firm registered with the PCAOB and are required to be independent with respect to the Company in accordance with the U.S. federal securities laws and the applicable rules and regulations of the Securities and Exchange Commission and the PCAOB.
We conducted our audits in accordance with the standards of the PCAOB. Those standards require that we plan and perform the audit to obtain reasonable assurance about whether the financial statements are free of material misstatement, whether due to error or fraud. Our audits included performing procedures to assess the risks of material misstatement of the financial statements, whether due to error or fraud, and performing procedures that respond to those risks. Such procedures included examining, on a test basis, evidence regarding the amounts and disclosures in the financial statements. Our audits also included evaluating the accounting principles used and significant estimates made by management, as well as evaluating the overall presentation of the financial statements. We believe that our audits provide a reasonable basis for our opinion.
Critical Audit Matters
The critical audit matters communicated below are matters arising from the current-period audit of the financial statements that were communicated or required to be communicated to the audit committee and that (1) relate to accounts or disclosures that are material to the financial statements and (2) involved our especially challenging, subjective, or complex judgments. The communication of critical audit matters does not alter in any way our opinion on the financial statements, taken as a whole, and we are not, by communicating the critical audit matters below, providing separate opinions on the critical audit matters or on the accounts or disclosures to which they relate.
Sales Incentives — Refer to Note 2 to the financial statements
Critical Audit Matter Description
The sales incentive accrual at November 1, 2020 was $1,718 million, of which $1,109 million is recorded within trade accounts and notes receivable – net and $609 million is recorded within accounts payable and accrued expenses. At the time a sale to a dealer is recognized, the Company records an estimate of the future sales incentive costs as a reduction to the sales price. These incentives may be based on a dealer’s purchase volume, or on retail sales incentive programs for allowances and financing programs that will be due when the dealer sells the equipment to a retail customer. The estimated cost of these programs is based on historical data, announced and expected incentive programs, field inventory levels and forecasted sales volumes. The final cost of these programs is determined at the end of the measurement period for volume-based incentives or when the dealer sells the equipment to the retail customer. This is due to numerous programs available at any particular time and new programs that may be announced after the Company records the equipment sale. Changes in the mix and types of programs affect these estimates, which are reviewed quarterly. The estimation of the sales incentive accrual is impacted by many assumptions. One of the key assumptions is the predictive value of the historical percentage of sales incentive costs to retail sales from dealers.
We identified the sales incentive accrual as a critical audit matter because estimating sales incentive costs requires significant judgment by management and changes in historical percentage of sales incentive costs to retails sales from dealers could have a material impact on the sales incentive accrual. Auditing management’s assumptions about the predictive nature of historical sales incentive costs involves a high degree of auditor judgment and an increased extent of effort to evaluate the reasonableness of management’s estimates.
How the Critical Audit Matter Was Addressed in the Audit
Our audit procedures related to testing management’s assumption that historical sales incentive costs are predictive of future incentive costs included the following, among others:
| ● | We tested the effectiveness of management’s controls over the assumptions used to estimate the sales incentive accrual. |
|---|
| ● | We evaluated management’s ability to accurately forecast future incentive costs performing a retrospective review that involved comparing actual incentive costs to management’s historical forecasts. |
|---|
| ● | We evaluated the reasonableness of management’s assumption that historical sales incentive costs are predictive of future incentive costs by: |
|---|
| ● | Considering the impact of changes in the current economic conditions and competitive environment. |
|---|
| ● | Testing the completeness of the population used in the calculation by inspecting a sample of incentive program communications to dealers to ensure all sales incentive programs offered were included in the calculation and by confirming sales incentive payments with a sample of dealers. |
|---|
| ● | Comparing historical and current sales incentive costs in the following manner: |
|---|
| ● | Type and number of programs |
|---|
| ● | Geography |
|---|
| ● | Program size and duration |
|---|
| ● | Eligible products |
|---|
Allowance for Credit Losses – Refer to Notes 2 and 13 to the financial statements
Critical Audit Matter Description
The allowance for credit losses as of November 1, 2020 was $223 million. The allowance for credit losses represents an estimate of the losses inherent in the Company’s receivable portfolio. The level of the allowance is based on many quantitative and qualitative factors, including historical net loss experience by product category, portfolio duration, delinquency trends, economic conditions in the Company’s major markets and geographies, commodity price trends, and credit risk quality. The Company has an established process to calculate a range of possible outcomes and determine the adequacy of the allowance. Historical receivable write-offs and recoveries are considered as part of the loss experience by product category. The adequacy of the allowance is assessed quarterly.
The allowance for credit losses specific to the revolving charge accounts portfolio of $3,902 million as of November 1, 2020 was $43 million. The assumptions used in evaluating the Company’s exposure to revolving credit losses involve estimates and require significant judgments, as no single statistic, measurement or assumption determines the adequacy of the allowance for credit losses for the revolving charge accounts portfolio. Additionally, the revolving charge accounts portfolio is more susceptible to losses as the loans within this portfolio are unsecured. Losses in this portfolio are expected to follow poor economic conditions prior to losses in the other portfolios. Losses in the revolving charge accounts portfolio could grow to material levels before the full extent of losses is observable in the historical loss data. Therefore, historical loss experience is not the sole predicting factor of anticipated losses. Consequently, qualitative factors (which consider overall economic conditions, the agricultural market, commodity price trends, and delinquency trends) are considered when adjusting historical loss experience for the purpose of determining the level of the allowance for credit losses for the revolving charge accounts portfolio.
We identified the allowance for credit losses specific to the revolving charge accounts portfolio as a critical audit matter because of the significant judgment required by management in determining these qualitative adjustments. Given the subjective nature and judgment applied by management to determine the allowance for credit losses related to the revolving charge accounts portfolio, auditing the allowance for credit losses required a high degree of auditor judgment and an increased extent of effort.
How the Critical Audit Matter Was Addressed in the Audit
Our audit procedures related to testing the allowance for credit losses for the revolving charge accounts portfolio included the following:
| ● | We tested the effectiveness of controls over the determination of the allowance for credit losses for the revolving charge accounts portfolio, including the qualitative factors considered. |
|---|
| ● | We evaluated the accuracy and relevance of the underlying historical data used in the Company’s model which included: |
|---|
| ● | Historical write-off experience |
|---|
| ● | Other historical loss metrics |
|---|
| ● | Portfolio duration |
|---|
| ● | Delinquency trends |
|---|
| ● | Trends in non-performing loans |
|---|
| ● | Trends in portfolio quality |
|---|
| ● | We tested the computational accuracy of the Company’s model. |
|---|
| ● | We evaluated the various qualitative adjustment factors considered in the Company’s determination of the allowance for credit losses. Our evaluation included: |
|---|
| ● | Comparison of the qualitative factors used by the Company to source data provided by the Company and/or to externally |
|---|
available data
| ● | Consideration and evaluation of contradictory evidence |
|---|
| ● | Consideration of specific revolving charge accounts portfolio delinquency trends within particular geographic locations |
|---|
| ● | We evaluated management’s ability to accurately estimate the losses inherent in the revolving charge accounts portfolio by comparing management’s historical estimates to actual losses incurred. |
|---|
/s/ DELOITTE & TOUCHE LLP Chicago, Illinois
December 17, 2020
We have served as the Company’s auditor since 1910.
REPORT OF INDEPENDENT REGISTERED PUBLIC ACCOUNTING FIRM
To the stockholders and the Board of Directors of Deere & Company:
Opinion on Internal Control over Financial Reporting
We have audited the internal control over financial reporting of Deere & Company and subsidiaries (the “Company”) as of November 1, 2020, based on criteria established in Internal Control — Integrated Framework (2013) issued by the Committee of Sponsoring Organizations of the Treadway Commission (COSO). In our opinion, the Company maintained, in all material respects, effective internal control over financial reporting as of November 1, 2020, based on criteria established in Internal Control — Integrated Framework (2013) issued by COSO.
We have also audited, in accordance with the standards of the Public Company Accounting Oversight Board (United States) (PCAOB), the consolidated financial statements as of and for the year ended November 1, 2020, of the Company and our report dated December 17, 2020, expressed an unqualified opinion on those financial statements.
Basis for Opinion
The Company’s management is responsible for maintaining effective internal control over financial reporting and for its assessment of the effectiveness of internal control over financial reporting, included in the accompanying Management’s Report on Internal Control over Financial Reporting. Our responsibility is to express an opinion on the Company’s internal control over financial reporting based on our audit. We are a public accounting firm registered with the PCAOB and are required to be independent with respect to the Company in accordance with the U.S. federal securities laws and the applicable rules and regulations of the Securities and Exchange Commission and the PCAOB.
We conducted our audit in accordance with the standards of the PCAOB. Those standards require that we plan and perform the audit to obtain reasonable assurance about whether effective internal control over financial reporting was maintained in all material respects. Our audit included obtaining an understanding of internal control over financial reporting, assessing the risk that a material weakness exists, testing and evaluating the design and operating effectiveness of internal control based on the assessed risk, and performing such other procedures as we considered necessary in the circumstances. We believe that our audit provides a reasonable basis for our opinion.
Definition and Limitations of Internal Control over Financial Reporting
A company’s internal control over financial reporting is a process designed to provide reasonable assurance regarding the reliability of financial reporting and the preparation of financial statements for external purposes in accordance with generally accepted accounting principles. A company’s internal control over financial reporting includes those policies and procedures that (1) pertain to the maintenance of records that, in reasonable detail, accurately and fairly reflect the transactions and dispositions of the assets of the company; (2) provide reasonable assurance that transactions are recorded as necessary to permit preparation of financial statements in accordance with generally accepted accounting principles, and that receipts and expenditures of the company are being made only in accordance with authorizations of management and directors of the company; and (3) provide reasonable assurance regarding prevention or timely detection of unauthorized acquisition, use, or disposition of the company’s assets that could have a material effect on the financial statements.
Because of its inherent limitations, internal control over financial reporting may not prevent or detect misstatements. Also, projections of any evaluation of effectiveness to future periods are subject to the risk that controls may become inadequate because of changes in conditions, or that the degree of compliance with the policies or procedures may deteriorate.
/s/ DELOITTE & TOUCHE LLP Chicago, Illinois
December 17, 2020
Index to Exhibits
*Incorporated by reference. Copies of these exhibits are available from the Company upon request.
| ** | Schedules have been omitted pursuant to Item 601(b)(2) of Regulation S-K. Deere hereby undertakes to furnish supplemental copies of any of the omitted schedules upon request by the U.S. Securities and Exchange Commission. |
|---|
SIGNATURES
Pursuant to the requirements of Section 13 or 15(d) of the Securities Exchange Act of 1934, the registrant has duly caused this report to be signed on its behalf by the undersigned, thereunto duly authorized.
| | | |
|---|---|---|
| | | DEERE & COMPANY |
| | | |
| | By: | /s/ John C. May |
| | | John C. May |
| | | Chairman and Chief Executive Officer |
| | | (Principal Executive Officer) |
Date: December 17, 2020
Pursuant to the requirements of the Securities Exchange Act of 1934, this report has been signed below by the following persons on behalf of the registrant and in the capacities and on the date indicated.
Each person signing below also hereby appoints John C. May, Ryan D. Campbell, and Todd E. Davies, and each of them singly, his or her lawful attorney-in-fact with full power to execute and file any and all amendments to this report together with exhibits thereto and generally to do all such things as such attorney-in-fact may deem appropriate to enable Deere & Company to comply with the provisions of the Securities Exchange Act of 1934 and all requirements of the Securities and Exchange Commission.
| | | | | | |
|---|---|---|---|---|---|
| Signature | | Title | | Date | |
| | | | | | |
| | | | | | |
| /s/ Ryan D. Campbell | | Senior Vice President and | ) | | December 17, 2020 |
| Ryan D. Campbell | | Chief Financial Officer | ) | | |
| | | (Principal Financial Officer and Principal | ) | | |
| | | Accounting Officer) | ) | | |
| | | | ) | | |
| | | | ) | | |
| /s/ Tamra A. Erwin | | Director | ) | | |
| Tamra A. Erwin | | | ) | | |
| | | | ) | | |
| | | | ) | | |
| /s/ Alan C. Heuberger | | Director | ) | | |
| Alan C. Heuberger | | | ) | | |
| | | | ) | | |
| | | | ) | | |
| /s/ Charles O. Holliday, Jr. | | Director | ) | | |
| Charles O. Holliday, Jr. | | | ) | | |
| | | | ) | | |
| | | | ) | | |
| /s/ Dipak C. Jain | | Director | ) | | |
| Dipak C. Jain | | | ) | | |
| | | | ) | | |
| | | | ) | | |
| /s/ Michael O. Johanns | | Director | ) | | |
| Michael O. Johanns | | | ) | | |
| | | | ) | | |
| | | | ) | | |
| /s/ Clayton M. Jones | | Director | ) | | |
| Clayton M. Jones | | | ) | | |
| | | | ) | | |
| | | | ) | | |
| /s/ John C. May | | Chairman and Chief Executive Officer | ) | | |
| John C. May | | (Principal Executive Officer) | ) | | |
| | | | ) | | |
| /s/ Gregory R. Page | | Director | ) | | |
|---|---|---|---|---|---|
| Gregory R. Page | | | ) | | |
| | | | ) | | |
| | | | ) | | |
| /s/ Sherry M. Smith | | Director | ) | | |
| Sherry M. Smith | | | ) | | |
| | | | ) | | |
| | | | ) | | |
| /s/ Dmitri L. Stockton | | Director | ) | | |
| Dmitri L. Stockton | | | ) | | |
| | | | ) | | |
| | | | ) | | |
| /s/ Sheila G. Talton | | Director | ) | | |
| Sheila G. Talton | | | ) | | |
| | | | | | |
| | | | | | |
Previous: Item 15. EXHIBITS AND FINANCIAL STATEMENT SCHEDULES.