 filings.tools
Digital Realty Trust 10-K 2017-12-31
Filed 2018-03-01. 22 sections, 852K characters. Original on sec.gov · Markdown · JSON
Cover and table of contents
10-K 1 dlr12311710k.htm 10-K
UNITED STATES
SECURITIES AND EXCHANGE COMMISSION
WASHINGTON, D.C. 20549
FORM 10-K
| x | Annual Report Pursuant to Section 13 or 15(d) of the Securities Exchange Act of 1934 |
For the fiscal year ended December 31, 2017
| ¨ | Transition Report Pursuant to Section 13 or 15(d) of the Securities Exchange Act of 1934 |
For the Transition Period From to .
| Commission file number | 001-32336 (Digital Realty Trust, Inc.) | |
| 000-54023 (Digital Realty Trust, L.P.) |
DIGITAL REALTY TRUST, INC.
DIGITAL REALTY TRUST, L.P.
(Exact name of registrant as specified in its charter)
| Maryland (Digital Realty Trust, Inc.) Maryland (Digital Realty Trust, L.P.) | 26-0081711 20-2402955 |
| (State or other jurisdiction of incorporation or organization) | (IRS employer identification number) |
| Four Embarcadero Center, Suite 3200 San Francisco, CA | 94111 |
| (Address of principal executive offices) | (Zip Code) |
(415) 738-6500
(Registrant’s telephone number, including area code)
Securities registered pursuant to Section 12(b) of the Act:
| Title of each class | Name of each exchange on which registered | |
| Digital Realty Trust, Inc. | Common Stock, $0.01 par value per share | New York Stock Exchange |
| Series C Cumulative Redeemable Perpetual Preferred Stock, $0.01 par value per share | New York Stock Exchange | |
| Series G Cumulative Redeemable Preferred Stock, $0.01 par value per share | New York Stock Exchange | |
| Series H Cumulative Redeemable Preferred Stock, $0.01 par value per share | New York Stock Exchange | |
| Series I Cumulative Redeemable Preferred Stock, $0.01 par value per share | New York Stock Exchange | |
| Series J Cumulative Redeemable Preferred Stock, $0.01 par value per share | New York Stock Exchange | |
| Digital Realty Trust, L.P. | None | None |
Securities registered pursuant to Section 12(g) of the Act:
| Digital Realty Trust, Inc. | None | |
| Digital Realty Trust, L.P. | Common Units of Partnership Interest |
Indicate by check mark if the registrant is a well-known seasoned issuer, as defined in Rule 405 of the Securities Act.
| Digital Realty Trust, Inc. | Yes x No o |
| Digital Realty Trust, L.P. | Yes o No x |
Indicate by check mark if the registrant is not required to file reports pursuant to Section 13 or Section 15(d) of the Act.
| Digital Realty Trust, Inc. | Yes o No x |
| Digital Realty Trust, L.P. | Yes o No x |
Indicate by check mark whether the registrant (1) has filed all reports required to be filed by Section 13 or 15(d) of the Securities Exchange Act of 1934 during the preceding 12 months (or for such shorter period that the registrant was required to file such reports), and (2) has been subject to such filing requirements for the past 90 days.
| Digital Realty Trust, Inc. | Yes x No o |
| Digital Realty Trust, L.P. | Yes x No o |
Indicate by check mark whether the registrant has submitted electronically and posted on its corporate Web site, if any, every Interactive Data File required to be submitted and posted pursuant to Rule 405 of Regulation S-T (§232.405 of this chapter) during the preceding 12 months (or for such shorter period that the registrant was required to submit and post such files).
| Digital Realty Trust, Inc. | Yes x No o |
| Digital Realty Trust, L.P. | Yes x No o |
Indicate by check mark if disclosure of delinquent filers pursuant to Item 405 of Regulation S-K (§ 229.405 of this chapter) is not contained herein, and will not be contained, to the best of registrant’s knowledge, in definitive proxy or information statements incorporated by reference in Part III of this Form 10-K or any amendment to this Form 10-K. o
Indicate by check mark whether the registrant is a large accelerated filer, an accelerated filer, a non-accelerated filer, a smaller reporting company, or emerging growth company. See the definitions of “large accelerated filer,” “accelerated filer,” “smaller reporting company,” and “emerging growth company” in Rule 12b-2 of the Exchange Act.
Digital Realty Trust, Inc.:
| Large accelerated filer | x | Accelerated filer | o |
| Non-accelerated filer | o(Do not check if a smaller reporting company) | Smaller reporting company | o |
| Emerging growth company | o |
Digital Realty Trust, L.P.:
| Large accelerated filer | o | Accelerated filer | o |
| Non-accelerated filer | x (Do not check if a smaller reporting company) | Smaller reporting company | o |
| Emerging growth company | o |
If an emerging growth company, indicate by check mark if the registrant has elected not to use the extended transition period for complying with any new or revised financial accounting standards provided pursuant to Section 13(a) of the Exchange Act.
| Digital Realty Trust, Inc. | o |
| Digital Realty Trust, L.P. | o |
Indicate by check mark whether the registrant is a shell company (as defined in Rule 12b-2 of the Act).
| Digital Realty Trust, Inc. | Yes o No x |
| Digital Realty Trust, L.P. | Yes o No x |
The aggregate market value of the common equity held by non-affiliates of Digital Realty Trust, Inc. as of June 30, 2017 totaled approximately $18 billion based on the closing price for Digital Realty Trust, Inc.’s common stock on that day as reported by the New York Stock Exchange. Such value excludes common stock held by executive officers, directors and 10% or greater stockholders as of June 30, 2017. The identification of 10% or greater stockholders as of June 30, 2017 is based on Schedule 13G and amended Schedule 13G reports publicly filed before June 30, 2017. This calculation does not reflect a determination that such parties are affiliates for any other purposes.
There is no public trading market for the common units of Digital Realty Trust, L.P. As a result, the aggregate market value of the common units held by non-affiliates of Digital Realty Trust, L.P. cannot be determined.
Indicate the number of shares outstanding of each of the registrant’s classes of common stock, as of the latest practicable date.
Digital Realty Trust, Inc.:
| Class | Outstanding at February 26, 2018 | |
| Common Stock, $.01 par value per share | 205,743,377 |
DOCUMENTS INCORPORATED BY REFERENCE
Part III incorporates by reference portions of Digital Realty Trust, Inc.’s Proxy Statement for its 2018 Annual Meeting of Stockholders which the registrants anticipate will be filed no later than 120 days after the end of its fiscal year pursuant to Regulation 14A.
EXPLANATORY NOTE
This report combines the annual reports on Form 10-K for the year ended December 31, 2017 of Digital Realty Trust, Inc., a Maryland corporation, and Digital Realty Trust, L.P., a Maryland limited partnership, of which Digital Realty Trust, Inc. is the sole general partner. Unless otherwise indicated or unless the context requires otherwise, all references in this report to “we,” “us,” “our,” “our Company” or “the Company” refer to Digital Realty Trust, Inc. together with its consolidated subsidiaries, including Digital Realty Trust, L.P. Unless otherwise indicated or unless the context requires otherwise, all references to “our Operating Partnership” or “the Operating Partnership” refer to Digital Realty Trust, L.P. together with its consolidated subsidiaries.
Digital Realty Trust, Inc. is a real estate investment trust, or REIT, and the sole general partner of Digital Realty Trust, L.P. As of December 31, 2017, Digital Realty Trust, Inc. owned an approximate 96.0% common general partnership interest in Digital Realty Trust, L.P. The remaining approximate 4.0% of the common limited partnership interests of Digital Realty Trust, L.P. are owned by non-affiliated third parties and certain directors and officers of Digital Realty Trust, Inc. As of December 31, 2017, Digital Realty Trust, Inc. owned all of the preferred limited partnership interests of Digital Realty Trust, L.P. As the sole general partner of Digital Realty Trust, L.P., Digital Realty Trust, Inc. has the full, exclusive and complete responsibility for the operating partnership’s day-to-day management and control.
We believe combining the annual reports on Form 10-K of Digital Realty Trust, Inc. and Digital Realty Trust, L.P. into this single report results in the following benefits:
| • | enhancing investors’ understanding of our Company and our Operating Partnership by enabling investors to view the business as a whole in the same manner as management views and operates the business; |
| • | eliminating duplicative disclosure and providing a more streamlined and readable presentation since a substantial portion of the disclosure applies to both our Company and our Operating Partnership; and |
| • | creating time and cost efficiencies through the preparation of one combined report instead of two separate reports. |
There are a few differences between our Company and our Operating Partnership, which are reflected in the disclosure in this report. We believe it is important to understand the differences between our Company and our Operating Partnership in the context of how we operate as an interrelated consolidated company. Digital Realty Trust, Inc. is a REIT, whose only material asset is its ownership of partnership interests of Digital Realty Trust, L.P. As a result, Digital Realty Trust, Inc. does not conduct business itself, other than acting as the sole general partner of Digital Realty Trust, L.P., issuing public equity from time to time and guaranteeing certain unsecured debt of Digital Realty Trust, L.P. and certain of its subsidiaries. Digital Realty Trust, Inc. itself does not issue any indebtedness but guarantees the unsecured debt of Digital Realty Trust, L.P. and certain of its subsidiaries and affiliates, as disclosed in this report. Digital Realty Trust, L.P. holds substantially all the assets of the Company and holds the ownership interests in the Company’s joint ventures. Digital Realty Trust, L.P. conducts the operations of the business and is structured as a partnership with no publicly traded equity. Except for net proceeds from public equity issuances by Digital Realty Trust, Inc., which are generally contributed to Digital Realty Trust, L.P. in exchange for partnership units, Digital Realty Trust, L.P. generates the capital required by the Company’s business through Digital Realty Trust, L.P.’s operations, by Digital Realty Trust, L.P.’s direct or indirect incurrence of indebtedness or through the issuance of partnership units.
The presentation of noncontrolling interests in operating partnership, stockholders’ equity and partners’ capital are the main areas of difference between the consolidated financial statements of Digital Realty Trust, Inc. and those of Digital Realty Trust, L.P. The common limited partnership interests held by the limited partners in Digital Realty Trust, L.P. are presented as limited partners’ capital within partners’ capital in Digital Realty Trust, L.P.’s consolidated financial statements and as noncontrolling interests in operating partnership within equity in Digital Realty Trust, Inc.’s consolidated financial statements. The common and preferred partnership interests held by Digital Realty Trust, Inc. in Digital Realty Trust, L.P. are presented as general partner’s capital within partners’ capital in Digital Realty Trust, L.P.’s consolidated financial statements and as preferred stock, common stock, additional paid-in capital and accumulated dividends in excess of earnings within stockholders’ equity in Digital Realty Trust, Inc.’s consolidated financial statements. The differences in the presentations between stockholders’ equity and partners’ capital result from the differences in the equity issued at the Digital Realty Trust, Inc. and the Digital Realty Trust, L.P. levels.
To help investors understand the significant differences between the Company and the Operating Partnership, this report presents the following separate sections for each of the Company and the Operating Partnership:
| • | consolidated financial statements; |
| • | the following notes to the consolidated financial statements: |
| • | Debt of the Company and Debt of the Operating Partnership; |
| • | Income per Share and Income per Unit; |
| • | Equity and Accumulated Other Comprehensive Loss, Net of the Company and Capital and Accumulated Other Comprehensive Income (Loss) of the Operating Partnership; and |
| • | Quarterly Financial Information; |
| • | Liquidity and Capital Resources in Management’s Discussion and Analysis of Financial Condition and Results of Operations; |
| • | Market for Registrant’s Common Equity, Related Stockholder Matters and Issuer Purchases of Equity Securities; and |
| • | Selected Financial Data. |
This report also includes separate Item 9A. Controls and Procedures sections and separate Exhibit 31 and 32 certifications for each of the Company and the Operating Partnership in order to establish that the Chief Executive Officer and Chief Financial Officer of each entity has made the requisite certification and that the Company and the Operating Partnership are compliant with Rule 13a-15 or Rule 15d-15 of the Securities Exchange Act of 1934 and 18 U.S.C. §1350.
In order to highlight the differences between the Company and the Operating Partnership, the separate sections in this report for the Company and the Operating Partnership specifically refer to the Company and the Operating Partnership. In the sections that combine disclosure of the Company and the Operating Partnership, this report refers to actions or holdings as being actions or holdings of the Company. Although the Operating Partnership is generally the entity that enters into contracts and joint ventures and holds assets and debt, reference to the Company is appropriate because the business is one enterprise and the Company operates the business through the Operating Partnership.
As general partner with control of the Operating Partnership, Digital Realty Trust, Inc. consolidates the Operating Partnership for financial reporting purposes, and it does not have significant assets other than its investment in the Operating Partnership. Therefore, the assets and liabilities of Digital Realty Trust, Inc. and Digital Realty Trust, L.P. are the same on their respective consolidated financial statements. The separate discussions of Digital Realty Trust, Inc. and Digital Realty Trust, L.P. in this report should be read in conjunction with each other to understand the results of the Company on a consolidated basis and how management operates the Company.
In this report, “properties” and “buildings” refer to all or any of the buildings in our portfolio, including data centers and non-data centers, and “data centers” refers only to the properties or buildings in our portfolio that contain data center space.
DIGITAL REALTY TRUST, INC. AND DIGITAL REALTY TRUST, L.P.
FORM 10-K
FOR THE YEAR ENDED DECEMBER 31, 2017
TABLE OF CONTENTS
PART I
Item 1. BUSINESS
General
Digital Realty Trust, Inc. through its controlling interest in Digital Realty Trust, L.P. and its subsidiaries is a leading global provider of data center, colocation and interconnection solutions for customers across a variety of industry verticals ranging from cloud and information technology services, communications and social networking to financial services, manufacturing, energy, healthcare, and consumer products. Digital Realty Trust, L.P., a Maryland limited partnership, is the entity through which Digital Realty Trust, Inc., a Maryland corporation, conducts its business of owning, acquiring, developing and operating data centers. Digital Realty Trust, Inc. operates as a REIT for federal income tax purposes.
On September 14, 2017, we completed the acquisition of DuPont Fabros Technology, Inc., or DFT, in an all-stock merger, which we refer to as the DFT Merger, for equity consideration of approximately $6.2 billion. We believe this transaction expanded our reach with a complementary portfolio in top U.S. metropolitan areas while enhancing our ability to meet the growing demand for hyper-scale and public cloud solutions and solidifying our blue-chip customer base.
On July 5, 2016, we completed the acquisition of a portfolio of eight high-quality, carrier-neutral data centers in Europe, which we refer to as the European Portfolio Acquisition, for a total purchase price of $818.9 million (based on the exchange rate at the date of acquisition). We believe the acquisition of these highly strategic assets in Amsterdam, Frankfurt and London enhanced our colocation and interconnection platform globally.
On October 9, 2015, we acquired Telx Holdings, Inc., or Telx, a leading U.S. provider of data center colocation, interconnection and cloud enablement solutions, which we refer to as the Telx Acquisition, for approximately $1.9 billion. We believe this acquisition established us as a leading provider of colocation and interconnection solutions in the U.S., complementing our existing business.
As of December 31, 2017, our portfolio consisted of 205 data centers, including seven held-for-sale data centers and 18 data centers held as investments in unconsolidated joint ventures, of which 152 are located throughout the United States, 38 are located in Europe, seven are located in Asia, five are located in Australia and three are located in Canada.
We are diversified across 33 major metropolitan areas throughout 12 countries where data center and technology customers are concentrated, including the Atlanta, Boston, Chicago, Dallas, Los Angeles, New York, Northern Virginia, Phoenix, San Francisco, Seattle and Silicon Valley metropolitan areas in the United States; the Amsterdam, Dublin, Frankfurt and London metropolitan areas in Europe; and the Hong Kong, Melbourne, Osaka, Singapore, Sydney and Tokyo metropolitan areas in the Asia Pacific region. Our portfolio contains a total of approximately 32.1 million square feet, including approximately 2.7 million square feet of space under active development, which includes current base building and data center projects in progress, as well as approximately 1.7 million square feet of space held for future development, which includes space held for future data center development and excludes space under active development. The 18 data centers held as investments in unconsolidated joint ventures have an aggregate of approximately 2.2 million rentable square feet. The 21 parcels of developable land we own comprise approximately 539 acres. A significant component of our current and future growth is expected to be generated through the development of our existing space held for development and acquisition of new properties. As of December 31, 2017, our portfolio, including the 18 data centers held as investments in unconsolidated joint ventures and excluding space under active development and space held for future development, was approximately 90.2% leased.
Our portfolio is comprised of data centers, which provide secure, continuously available environments for the exchange, processing and storage of critical electronic information. Data centers are used for digital communication, disaster recovery purposes, transaction processing and housing mission-critical corporate IT applications. Certain of our data centers, which we refer to as Internet gateways, are highly interconnected, network-dense facilities that serve as hubs for Internet and data communications within and between major metropolitan areas. We believe Internet gateways are highly valuable and would be extremely difficult to replicate.
The locations of and improvements to our data centers, the network density, interconnection infrastructure and connectivity-centric customers in certain of our facilities, and our comprehensive product offerings are critical to our customers’ businesses, which we believe results in high occupancy levels, longer average lease terms and customer relationships, as well as lower turnover. In addition, many of our data centers contain significant improvements that have been installed at our customers’ expense. The tenant improvements in our data centers are generally readily adaptable for use by similar customers.
Digital Realty Trust, Inc. was incorporated in the state of Maryland on March 9, 2004. Digital Realty Trust, L.P. was organized in the state of Maryland on July 21, 2004. Our principal executive offices are located at Four Embarcadero Center, Suite 3200, San Francisco, California 94111. Our telephone number at that location is (415) 738-6500. Our website is located at www.digitalrealty.com. The information found on, or otherwise accessible through, our website is not incorporated into, and does not form a part of, this annual report or any other report or document we file with or furnish to the U.S. Securities and Exchange Commission, or the SEC.
Our Competitive Strengths
We believe we distinguish ourselves from other owners, acquirers, developers and operators of data centers through our competitive strengths, which include:
| • | Global Platform. We believe that a high-quality, highly interconnected global portfolio such as ours could not be easily replicated today on a cost-competitive basis. |
| • | Presence in Key Metropolitan Areas. Our portfolio comprises a network of 205 state-of-the-art, interconnected data centers, which are concentrated in 33 major metropolitan areas across 12 countries on four continents. Our portfolio is geographically diversified, so that no single metropolitan area represented more than approximately 21.6% of the aggregate annualized rent of our portfolio as of December 31, 2017. Through strategic investments, we have grown our presence in key metropolitan areas throughout North American, Europe, Asia and Australia. The DFT Merger in 2017 enhanced our data center offerings in strategic and complementary U.S. metropolitan areas. The Telx Acquisition in 2015 established our colocation and interconnection platform in the U.S. and the European Portfolio Acquisition in 2016 expanded our colocation and interconnection platform in Europe, each transaction enhancing our presence in top-tier locations throughout the U.S. and Europe. |
| • | Secure and Network-Rich Data Centers. Our data centers are physically secure, network-rich and equipped to meet the power and cooling requirements of smaller footprints up to the most demanding IT applications. Many of our data centers are located on major aggregation points formed by the physical presence of multiple major telecommunications service providers, which reduces our customers’ costs and operational risks and enhances the attractiveness of our properties. In addition, our strategically located global data center campuses offer our customers the ability to expand their global footprint as their businesses grow, while our connectivity offerings on our campuses enhance the capabilities and attractiveness of these facilities. Further, the network density, interconnection infrastructure and connectivity-centric customers in certain of our data centers has led to the organic formation of densely interconnected ecosystems that are difficult for others to replicate and deliver added value to our customers. |
| • | Comprehensive Product Offering. We provide flexible, customer-centric data center solutions designed to meet the needs of companies of all sizes across multiple industry verticals around the world. Our data centers and comprehensive suite of product offerings are scalable to meet our customers’ needs, from a single rack or cabinet, up to multi-megawatt deployments, along with connectivity, interconnection and solutions to support their hybrid cloud architecture requirements. |
| • | Colocation, Scale and Hyper-Scale Platform. Our colocation and Turn-Key Flex® data centers are move-in ready, physically secure facilities with the power and cooling capabilities to support customers requiring a single rack or cabinet up to mission-critical IT enterprise applications. We believe our colocation and Turn-Key Flex® facilities are effective solutions for customers who may lack the bandwidth, capital budget, |
expertise or desire to provide their own extensive data center infrastructure, management and security. For customers who possess the ability to build and operate their own facility, our Powered Base Building® solution provides the physical location, requisite power and network access necessary to support a state-of-the-art data center. Our data center campuses offer our customers the opportunity to expand in or near their existing deployments within our data center campuses. Our Critical Facilities Management® services and team of technical engineers and data center operations experts provide 24/7 support for these mission-critical facilities.
| • | Interconnection and Cloud-Enablement Platform. Through our recent investments and strategic partnerships, we have significantly expanded our capabilities as a leading provider of interconnection and cloud-enablement services globally. We believe interconnection is an attractive line of business that would be difficult to build organically and enhances the overall value proposition of our colocation, scale and hyper-scale data center product offerings. Furthermore, through new product offerings, such as our Service Exchange, and partnerships with cloud service providers, we are able to support our customers’ hybrid cloud architecture requirements. Over the past few years, we have expanded our product mix to appeal to a broader spectrum of data center customers, especially those seeking to support a greater portion of their data center requirements through a single provider. |
| • | Global and Diverse Customer Base. Our portfolio has attracted a high-quality, diversified mix of customers. We have more than 2,300 customers in total, and no single customer represented more than approximately 6.5% of the aggregate annualized rent of our portfolio as of December 31, 2017. |
| • | Global Customer Base across a Wide Variety of Industry Sectors. We use our in-depth knowledge of requirements for and trends impacting cloud and information technology service providers, content providers, network and communications providers, and other data center users, including enterprise customers, to market our data centers to meet these customers’ specific technology needs. At December 31, 2017, our customers represented a variety of industry verticals, ranging from cloud and information technology services, communications and social networking to financial services, manufacturing, energy, gaming, life sciences and consumer products. Our customers are increasingly launching multi-regional deployments and growing with us internationally. Our largest customer, IBM, accounted for approximately 6.5% of the aggregate annualized rent as of December 31, 2017 and no other single customer accounted for more than approximately 6.2% of the aggregate annualized rent of our portfolio. |
| • | Proven Experience Attracting and Retaining Customers. Our specialized data center salesforce, which is aligned to meet our customers’ needs for global, enterprise and network solutions, provides a robust pipeline of new customers, while existing customers continue to grow and expand their utilization of our services to support a greater portion of their IT needs. During the year ended December 31, 2017, we commenced new leases totaling approximately 1.2 million square feet, which represent approximately $184.1 million in annualized GAAP rent, and renewal leases totaling approximately 2.1 million square feet, which represent approximately $241.3 million in annualized GAAP rent. During the year ended December 31, 2017, we signed new leases totaling approximately 1.1 million square feet, which represent approximately $168.5 million in annualized GAAP rent, and renewal leases totaling approximately 2.0 million square feet, which represent approximately $234.2 million in annualized GAAP rent. During the year ended December 31, 2017, we signed new leases with existing customers totaling approximately 1.0 million square feet, which represent approximately $152.6 million in annualized GAAP rent. |
| • | Demonstrated Investment Acumen. We have developed detailed, standardized procedures for evaluating acquisitions and investments, including income-producing properties as well as vacant buildings and land suitable for development, to ensure that they meet our strategic, financial, technical and other criteria. These procedures, together with our in-depth knowledge of the technology, data center and real estate industries, allow us to identify strategically located properties and evaluate investment opportunities efficiently and, as appropriate, commit and close quickly. Our investment-grade ratings, along with our broad network of contacts within the data center industry, enable us to effectively capitalize on acquisition and investment opportunities. |
| • | Differentiating Development Advantages. Our extensive development activity, operating scale and process-based approach to data center design, construction and operations result in significant cost savings and added value for our customers. We have leveraged our purchasing power by securing global purchasing agreements and developing relationships with major equipment manufacturers, reducing costs and shortening delivery timeframes on key components, including major mechanical and electrical equipment. Utilizing our innovative modular data center design, we deliver what we believe to be a technically superior data center environment at significant cost savings. In addition, by utilizing our POD Architecture® to develop new Turn-Key Flex® facilities in our existing Powered Base Building® facilities, on average we can deliver a fully commissioned facility in under 30 weeks. Finally, our access to capital and investment-grade ratings allow us to provide data center solutions for customers who do not want to invest their own capital. |
| • | Experienced and Committed Management Team and Organization. Our senior management team has many years of experience in the technology and/or real estate industries, including experience as investors in and advisors to technology companies. We believe that our senior management team’s extensive knowledge of both the technology and the real estate industries provides us with a key competitive advantage. Further, a significant portion of compensation for our senior management team and directors is in the form of common equity interests in our Company. We also maintain minimum stock ownership requirements for our senior management team and directors, further aligning their interests with those of external stockholders, as well as an employee stock purchase plan, which encourages our employees to increase their ownership in the Company. |
Business and Growth Strategies
Our primary business objectives are to maximize: (i) sustainable long-term growth in earnings and funds from operations per share and unit, (ii) cash flow and returns to our stockholders and our Operating Partnership’s unitholders through the payment of distributions and (iii) return on invested capital, which we expect to accomplish by achieving superior risk-adjusted returns, prudently allocating capital, diversifying our product offerings and driving revenue growth and operating efficiencies.
| • | Achieve Superior Returns. We believe that achieving appropriate risk-adjusted returns on our business, including on our development pipeline and leasing transactions, will deliver superior stockholder returns. At December 31, 2017, we had approximately 2.7 million square feet of space under active development for Turn-Key Flex® and Powered Base Building® products in seven U.S. metropolitan areas, four European metropolitan areas, two Australian metropolitan areas, one Canadian metropolitan area and one Asian metropolitan area, consisting of approximately 1.3 million square feet of base building construction and 1.4 million square feet of data center construction. We may continue to build out our development pipeline when justified by anticipated returns. We also believe that providing an even stronger value proposition to our customers, including through new and more comprehensive product offerings, as well as continuing to improve operational efficiencies, will further drive improved returns for our business. |
| • | Prudently Allocate Capital. We believe that the accretive deployment of capital at sufficiently positive spreads above our cost of capital enables us to increase cash flow and create long-term stockholder value. |
| • | Strategic and Complementary Investments. We have developed significant expertise at underwriting, financing and executing data center investment opportunities. We employ a collaborative approach to deal analysis, risk management and asset allocation, focusing on key elements, such as market fundamentals, accessibility to fiber and power, and the local regulatory environment. In addition, the specialized nature of data centers makes these investment opportunities more difficult for traditional real estate investors to underwrite, resulting in reduced competition for investments relative to other property types. We believe this dynamic creates an opportunity for us to generate attractive risk-adjusted returns on our capital. |
| • | Preserve the Flexibility of Our Balance Sheet. We are committed to maintaining a conservative capital structure. We target a debt-to-adjusted EBITDA ratio at or less than 5.5x, fixed charge coverage of greater than three times, and floating rate debt at less than 20% of total outstanding debt. In addition, we strive to maintain a well-laddered debt maturity schedule, and we seek to maximize the menu of our available sources of capital, while minimizing the related cost. Since Digital Realty Trust Inc.’s initial public offering in 2004, we have raised approximately $27.3 billion of capital through common, preferred and convertible preferred equity offerings, exchangeable debt offerings, non-exchangeable bond offerings, our global revolving credit facility, our term loan facility, a senior notes shelf facility, secured mortgage financings and re-financings, |
joint venture partnerships and the sale of non-core assets. We endeavor to maintain financial flexibility while using our liquidity and access to capital to support operations, including our acquisition, investment, leasing and development programs and global campus expansion, which are important sources of our growth.
| • | Offer Comprehensive and Diverse Products. We have diversified our product offering, through acquisitions and organically, and believe that we have one of the most comprehensive suites of global data center solutions available to customers from a single provider. |
| • | Global Service Infrastructure Platform. With the recent DFT Merger, which enhanced our portfolio of scale and hyper-scale data centers, the European Portfolio Acquisition and the Telx Acquisition, which established us as a leading provider of colocation, interconnection and cloud-enablement services globally, we are able to offer a broader range of data center solutions to meet our customers’ needs, from a single rack or cabinet to multi-megawatt deployments. We believe our products like Service Exchange and our partnerships with managed services and cloud service providers further enhance the attractiveness of our data centers. |
| • | Provide Foundational Services to Enable Customers and Partners. We believe that the real estate platform, through which we offer the foundational services of space, power and connectivity, will enable our customers and partners to serve their customers and grow their businesses. We believe our Internet gateway data centers, individual data centers and data center campuses are attractive to a wide variety of customers and partners of all sizes. Furthermore, we believe our colocation and interconnection offerings, as well as the densely connected ecosystems that have developed within our facilities, and the availability and scalability of our comprehensive suite of products are valuable and critical to our customers and partners. |
| • | Drive Revenue Growth and Operating Efficiencies. We aggressively manage our properties to maximize cash flow and control costs by leveraging our scale to drive operating efficiencies. |
| • | Leverage Strong Industry Relationships. We use our strong industry relationships with national and regional corporate enterprise information technology groups and technology-intensive companies to identify and solve their data center needs. Our sales professionals are technology and real estate industry specialists who can develop complex facility solutions for the most demanding data center and other technology customers. |
| • | Maximize Cash Flow. We often acquire properties with substantial in-place cash flow and some vacancy, which enables us to create upside through lease-up. We control our costs by negotiating expense pass-through provisions in customer agreements for operating expenses, including power costs and certain capital expenditure. We have also focused on centralizing functions and optimizing operations as well as improving processes and technologies. We believe that expanding our global data center campuses will also contribute to operating efficiencies because we expect to achieve economies of scale on our campus environments. |
Sustainability
We believe that addressing sustainability by driving environmental efficiency through the implementation of cost-effective design and use of renewable energy serves as a key differentiator enabling us to deliver products that help attract and retain customers, generate cash flow, and manage operational risks. Our sustainability platform includes the following:
| • | We manage our data centers so that they offer high degrees of operational efficiencies for our customers. We benchmark and certify certain data centers in accordance with the U.S. Environmental Protection Agency, or EPA, Energy Star program, LEEDTM, BREEAM, as well as other recognized third-party rating standards. A portion of our U.S. portfolio is enrolled in the U.S. Department of Energy’s Better Buildings Challenge for Data Centers. |
| • | We have developed solutions to help our customers efficiently utilize energy and water, and to help them procure renewable energy. |
In 2017, we received Nareit’s “Leader in the Light” award for data centers, recognizing our sustainability and energy-efficiency achievements, and we ranked 6th on the EPA’s Top 30 Tech and Telecom list of the largest green power users.
Energy and resource management considerations are integrated into our business decisions. For the operating portfolio, annual capital expense investment planning identifies and evaluates resource efficiency project opportunities in a parallel but distinct process from non-resource-impacting capital investments. For acquisitions and new development activity, resiliency risks, resource availability, and renewable energy access are considered. Our design and construction process incorporates sustainable features that support resource efficiency during both construction as well as during eventual operational activity at the sites. We consider water availability, cost, and alternate supply solutions to potable water such as municipally supplied reclaimed water. We also consider cooling system designs to maximize ‘free cooling’ and reduce or eliminate the site’s reliance on access to water for cooling.
Sustainable Data Center Ratings
Data centers receiving third-party sustainable ratings in 2017 totaled 830,729 square feet, or approximately 62% of our total shell completions in 2017. We received the following sustainable data center ratings for all, or a portion of, the following sites:
| Data Center | Metropolitan Area | Rating Framework | Level Attained | |||
| 9377 W Grand Avenue | Chicago | LEED (1) | Silver | |||
| 2299 Busse Road | Chicago | LEED (1)(2) | Silver | |||
| 21745 Sir Timothy Drive | Northern Virginia | LEED (1)(3) | Gold |
| (1) | LEEDTM: Leadership in Energy and Environmental Design. |
| (2) | Received by DFT in February 2017. |
| (3) | Received by DFT in August 2017. |
In 2017, we achieved Energy Star for Data Centers recognition for all, or a portion of, the following sites, representing 16.9% of our U.S. operating portfolio (1):
| Data Center | Metropolitan Area | |
| 375 Riverside Parkway | Atlanta | |
| 950 E Collins Boulevard | Dallas | |
| 2260 E El Segundo Boulevard | Los Angeles | |
| 1201 Comstock Street | Santa Clara | |
| 1525 Comstock Street | Santa Clara | |
| 1725 Comstock Street | Santa Clara | |
| 2805 Lafayette Street | Santa Clara | |
| 3105 Alfred Street | Santa Clara | |
| 4040 Lafayette Center Drive | Northern Virginia | |
| 4050 Lafayette Center Drive | Northern Virginia | |
| 44060 Digital Loudoun Plaza | Northern Virginia |
| (1) | Percentage is based on U.S. stabilized assets, excluding Powered Base Building space, space under active development, space held for development, and space held in unconsolidated joint ventures. |
Resource Conservation
We seek to proactively identify and support opportunities to efficiently utilize resources, such as energy and water, throughout our operating portfolio. In 2017, the following sites completed conservation projects primarily focusing on energy and water conservation:
| Property | Metropolitan Area | |
| 100 Delawanna | New York | |
| 111 8th Avenue | New York | |
| 120 E. Van Buren Street | Phoenix | |
| 128 First Avenue | Boston | |
| 200 Paul Avenue | San Francisco | |
| 2121 S. Price Road | Phoenix | |
| 2323 Bryan Street | Dallas | |
| 250 Williams Street | Atlanta | |
| 2501 S. State Highway | Dallas | |
| 350 E. Cermak Road | Chicago | |
| 56 Marietta | Atlanta | |
| 60 Hudson Street | New York |
In 2017, we verified attainment of our energy intensity target under the U.S. Department of Energy’s Better Buildings Challenge, an initiative to reduce non-IT energy intensity 20% by 2024 across a 0.79 million square foot portion of our portfolio compared to a 2013 baseline. Energy savings have been achieved by implementing HVAC upgrades, including variable frequency drive implementations, containment deployments and controls optimizations. Other energy savings initiatives include air management improvements and modifications to our SLAs with customers to allow for enhanced economizer operation. Our properties enrolled in the Better Buildings Challenge demonstrated cumulative reductions in non-IT energy intensity of 25% compared to a 2013 baseline, as reviewed via the U.S. Department of Energy’s Better Buildings Challenge.
Renewable Energy
In 2017, we entered into power purchase agreements to secure the renewable energy attributes from a wind farm in Illinois and a solar farm in North Carolina. Our previously disclosed Texas wind farm power purchase agreement produced 365,184 MWh of renewable energy credits in 2017.
SASB
The Sustainability Accounting Standards Board (“SASB”) issued the Real Estate Owners, Developers & Investment Trusts Sustainability Accounting Standard guidance, which outlines proposed disclosure topics and accounting metrics for the real estate industry. We provide data on energy and water management metrics that best correlate with our business and industry as indicated in the following sections. The energy and water data we use is primarily collected and reviewed by third parties who compile the data from property utility statements. These metrics enable us to better manage our portfolio, track our progress on resource efficiency improvements, and track renewable energy sourcing.
Energy Data
| Year (1) | Energy Consumption Data Coverage as % of Floor Area | Total Energy Consumed by Portfolio Area with Data Coverage (MWh) (2) | Grid electricity consumption as a % of Energy Consumption | % of Energy Generated From Renewable Resources (3) | Like-for-Like Change in Energy Consumption of Portfolio Area with Data Coverage (4) | MWh per Occupied kW (5) | MWh per Occupied kW Year over Year % Change | ||
| 2016 | 84 | % | 3,699,472 | 95% | 23.4% | 2.5% | 6.50 | (5.8)% | |
| 2015 | 77 | % | 3,252,836 | 95% | 9.5% | n/a | 6.90 | n/a |
| (1) | Full-year 2017 energy data is not currently available. The most recent full year for which energy data is available is 2016. |
| (2) | The scope of energy includes: energy purchased from sources external to the Company and its customers; energy produced by the Company and its customers (i.e., self-generated); and energy from all other sources, including direct fuel usage, purchased electricity, and purchased chilled water. |
| (3) | Excludes renewable energy supplied by standard baseline utility fuel mix. Includes above-baseline utility renewables (e.g., green tariffs), Renewable Energy Credit (REC) purchases and RECs generated by the Company. |
| (4) | Data reported in MWh on a like-for-like comparison excludes properties which were acquired, disposed, under development or have been largely refurbished during the reported year. |
| (5) | We provide a “MWh per occupied kW” metric to assess relative resource use intensity. Excludes kW associated with Powered Base Building space. |
Water Data
| Year (1) | Water Consumption Data Coverage as % of Floor Area | Total Water Consumed by Portfolio Area with Data Coverage (kGal) (2) | Like-for-Like Change in Water Consumption of Portfolio Area with Data Coverage (3) | kGal per Occupied kW (4) | Gal per Occupied kW Year over Year % Change | ||
| 2016 | 64 | % | 459,127 | (2.0)% | 0.81 | (5.8)% | |
| 2015 | 60 | % | 403,373 | n/a | 0.86 | n/a |
| (1) | Full-year 2017 water data is not currently available. The most recent full year for which water data is available is 2016. |
| (2) | Data reported in kilo-gallons (kGal). The scope of water consumed includes potable and non-potable water purchased from third-party suppliers. |
| (3) | The like-for-like comparison excludes properties which were acquired, disposed, under development or largely refurbished during the reported year. |
| (4) | We provide a “kGal per occupied kW” metric to assess relative resource use intensity. Excludes kGal associated with Powered Base Building space. |
Competition
We compete with numerous data center developers, owners and operators, many of whom own or operate properties similar to ours in some of the same metropolitan areas where our data centers are located, including CoreSite Realty Corporation, CyrusOne Inc., Equinix, Inc., QTS Realty Trust, Inc., Switch, Inc. and various local developers in the U.S., as well as Global Switch Holdings Limited and various regional operators in Europe, Asia and Australia. If our competitors offer space that our customers or potential customers perceive to be superior to ours based on numerous factors, including available power, security considerations, location, or connectivity, or if they offer rental rates below current market rates, or below the rental rates we are offering, we may lose customers or potential customers or be required to incur costs to improve our properties or lower our rental rates. In addition, several of our competitors have the financial and technical ability to develop competitive data centers. If the supply of competitive data centers were to increase significantly, rental rates may be reduced or we may face delays in leasing, or be unable to lease our vacant space, including space that we develop. Finally, if customers or potential customers require products or services that we do not offer, we may not be able to meet those customers’ needs. Our financial condition, results of operations, cash flow, cash available for distribution and ability to satisfy our debt service obligations could be materially adversely affected as a result of any or all of these factors.
Geographic Information
Operating revenues from properties in the United States were $1.9 billion, $1.7 billion and $1.4 billion and outside the United States were $0.5 billion, $0.4 billion and $0.4 billion for the years ended December 31, 2017, 2016 and 2015, respectively. We had investments in real estate located in the United States of $10.5 billion, $6.3 billion and $6.1 billion and outside the United States of $3.1 billion, $2.6 billion and $2.6 billion as of December 31, 2017, 2016 and 2015, respectively.
Operating revenues from properties located in the United Kingdom were $0.3 billion, $0.2 billion and $0.2 billion, or 11.2%, 11.1% and 12.3% of total operating revenues, for the years ended December 31, 2017, 2016 and 2015, respectively. No other foreign country comprised more than 10% of total operating revenues for each of these years. We had investments in real estate located in the United Kingdom of $1.7 billion, $1.5 billion and $1.6 billion, or 12.1%, 16.6% and 18.8% of total
investments in real estate, as of December 31, 2017, 2016 and 2015, respectively. No other foreign country comprised more than 10% of total investments in real estate as of each of December 31, 2017, 2016 and 2015. See “Risk Factors—Ownership of data centers located outside of the United States subjects us to foreign currency and related risks which may adversely impact our ability to make distributions”, “—Our international activities are subject to unique risks different than those faced by us in the United States and we may not be able to effectively manage our international business” and “—We face risks with our international acquisitions associated with investing in unfamiliar metropolitan areas” for risks relating to our international operations.
Regulation
General
Our properties are subject to various laws, ordinances and regulations, including regulations relating to common areas. We believe that each of our properties as of December 31, 2017 has the necessary permits and approvals to operate.
Americans with Disabilities Act
Our properties must comply with Title III of the Americans with Disabilities Act of 1990, or the ADA, to the extent that such properties are “public accommodations” as defined by the ADA. The ADA may require removal of structural barriers to access by persons with disabilities in certain public areas of our properties where such removal is readily achievable. We believe that our properties are in substantial compliance with the ADA and that we will not be required to make substantial capital expenditures to address the requirements of the ADA. However, noncompliance with the ADA could result in imposition of fines or an award of damages to private litigants. The obligation to make readily achievable accommodations is an ongoing one, and we will continue to assess our properties and to make alterations as appropriate in this respect.
Environmental Matters
Under various laws relating to the protection of the environment in the United States, as well as in many jurisdictions in Europe and Asia, a current or previous owner or operator of real estate may be liable for contamination resulting from the presence or discharge of hazardous or toxic substances at that property, and may be required to investigate and clean up such contamination at or emanating from that property. Such laws often impose liability without regard to whether the owner or operator knew of, or was responsible for, the presence of the contaminants, and the liability may be joint and several. In the United States, the Comprehensive Environmental Response, Compensation, and Liability Act of 1980, or CERCLA, established a regulatory and remedial program intended to provide for the investigation and clean-up of facilities where, or from which, a release of any hazardous substance into the environment has occurred or is threatened. CERCLA’s primary mechanism for remedying such problems is to impose strict joint and several liability for clean-up of facilities on current owners and operators of the site, former owners and operators of the site at the time of the disposal of the hazardous substances, any person who arranges for the transportation, disposal or treatment of the hazardous substances, and the transporters who select the disposal and treatment facilities, regardless of the care exercised by such persons. CERCLA also imposes liability for the cost of evaluating and remedying any damage to natural resources. The costs of CERCLA investigation and clean-up can be very substantial. CERCLA also authorizes the imposition of a lien in favor of the United States on all real property subject to, or affected by, a remedial action for all costs for which a party is liable. Subject to certain procedural restrictions, CERCLA gives a responsible party the right to bring a contribution action against other responsible parties for their allocable shares of investigative and remedial costs. Our ability to obtain reimbursement from others for their allocable shares of such costs would be limited by our ability to find other responsible parties and prove the extent of their responsibility, their financial resources, and other procedural requirements. Various state laws, as well as laws in many jurisdictions in Europe and Asia, such as the Environmental Liability Directive (2004/35/EC) in Europe, also impose in certain cases strict joint and several liability for investigation, clean-up and other damages associated with hazardous substance releases.
Previous owners used some of our properties for industrial and retail purposes, and those properties may contain some level of environmental contamination. Independent environmental consultants have conducted Phase I or similar environmental site assessments on all of the properties in our portfolio. Site assessments are intended to discover and evaluate information regarding the environmental condition of the surveyed property and surrounding properties. These assessments do not generally include soil samplings, subsurface investigations or an asbestos survey and the assessments may have failed to reveal all material environmental conditions, liabilities or compliance concerns. In addition, material environmental conditions, liabilities or compliance concerns may have arisen after these reviews were completed or may arise in the future. We could be held jointly and severally liable under CERCLA and various state, local and national laws for the investigation and remediation of environmental contamination on our properties caused by previous owners or operators. Fuel storage tanks are present at most of our properties, and if releases were to occur, we may be liable for the costs of cleaning any resulting contamination. The presence of contamination or the failure to remediate contamination at our properties may expose us to third-party liability or materially adversely affect our ability to sell, lease or develop the real estate or to borrow using the real estate as collateral.
In addition, some of our customers, particularly those in the biotechnology and life sciences industry and those in the technology manufacturing industry, routinely handle hazardous substances and wastes as part of their operations at our properties. Environmental laws and regulations subject our customers, and potentially us, to liability resulting from these activities or from previous industrial or retail uses of those properties. We could be held jointly and severally liable under CERCLA and various state, local and national laws for the investigation and remediation of hazardous substances released by our customers on our properties. Environmental liabilities could also affect a customer’s ability to make rental payments to us. We cannot assure you that costs of investigation and remediation of environmental matters will not affect our ability to pay dividends to Digital Realty Trust, Inc.’s stockholders and distributions to Digital Realty Trust, L.P.’s unitholders or that such costs or other remedial measures will not have a material adverse effect on our business, assets or results of operations or our competitive position.
Our properties and their uses often require permits from various government agencies, including permits related to zoning and land use. Certain permits from environmental regulatory agencies, including regulators of air quality, are usually required to install and operate diesel-powered generators, which provide emergency back-up power at most of our facilities. These permits often set emissions limits for certain air pollutants, including oxides of nitrogen. In addition, various federal, state, and local environmental, health and safety requirements, such as fire requirements and treated and storm water discharge requirements, apply to some of our properties. Changes to applicable regulations, such as air quality regulations, or the permit requirements for equipment at our facilities, could hinder or prevent our construction or operation of data center facilities.
The environmental laws and regulations to which our properties are subject may change in the future, and new laws and regulations may be created. Future laws, ordinances or regulations may impose additional material environmental liability. Such laws include those directly regulating our climate change impacts and those which regulate the climate change impacts of companies with which we do business, such as utilities providing our facilities with electricity. See “Management’s Discussion and Analysis of Financial Condition and Results of Operations—Factors Which May Influence Future Results of Operations—Climate change legislation.” We do not know if or how the requirements will change, but changes may require that we make significant unanticipated expenditures, and such expenditures may materially adversely impact our financial condition, cash flow, results of operations, cash available for distributions, common stock’s per share trading price, competitive position and ability to satisfy our debt service obligations.
Insurance
We carry commercial general liability, property, and business interruption insurance, including rental income loss coverage, covering all of the properties in our portfolio under a blanket program. We select policy specifications and insured limits which we believe to be appropriate given the relative risk of loss, the cost of the coverage and industry practice and, in the opinion of our Company’s management, the properties in our portfolio are currently adequately insured. We do not carry insurance for generally uninsured exposures such as loss from war or nuclear reaction. In addition, we carry earthquake insurance on our properties in an amount and with deductibles which we believe are commercially reasonable. We intend to partially fund the earthquake insurance deductibles through a captive insurance company we established in May 2014. Certain of the properties in our portfolio are located in areas known to be seismically active. See “Risk Factors-Risks Related to Our Business and Operations-Potential losses may not be covered by insurance.”
Employees
As of December 31, 2017, we had 1,436 employees.
How to Obtain Our SEC Filings
All reports we file with the SEC are available free of charge via EDGAR through the SEC website at www.sec.gov. In addition, the public may read and copy materials we file with the SEC at the SEC’s public reference room located at 100 F Street, N.E., Washington, D.C. 20549. The public may obtain information on the operation of the public reference room by calling the SEC at 1-800-SEC-0330. We will also provide copies of our Forms 8-K, 10-K, 10-Q, Proxy Statement and amendments to those documents at no charge to investors upon request and make electronic copies of such reports available through our website at www.digitalrealty.com as soon as reasonably practicable after filing such material with the SEC. The information found on, or otherwise accessible through, our website is not incorporated by reference into, nor does it form a part of, this report or any other document that we file with the SEC.
Offices
Our headquarters are located in San Francisco. We have regional U.S. offices in Boston, Chicago, Dallas, Los Angeles, New York, Northern Virginia and Phoenix and regional international offices in Amsterdam, Dublin, London, Singapore, Sydney and Hong Kong.
Reports to Security Holders
Digital Realty Trust, Inc. is required to send an annual report to its securityholders and to our Operating Partnership’s unitholders.
Item 1A. RISK FACTORS
For purposes of this section, the term “stockholders” means the holders of shares of Digital Realty Trust, Inc.’s common stock and preferred stock. Set forth below are the risks that we believe are material to Digital Realty Trust, Inc.’s stockholders and Digital Realty Trust, L.P.’s unitholders. You should carefully consider the following factors in evaluating our Company, our properties and our business. The occurrence of any of the following risks might cause Digital Realty Trust, Inc.’s stockholders and Digital Realty Trust, L.P.’s unitholders to lose all or a part of their investment. Some statements in this report, including statements in the following risk factors, constitute forward-looking statements. Please refer to the section entitled “Forward-Looking Statements” starting on page 36.
Risks Related to Our Business and Operations
Our business depends upon the demand for data centers.
Our portfolio is comprised primarily of data centers. A reduction in the demand for data center space, power or connectivity would have a greater adverse effect on our business and financial condition than if we owned a portfolio with a more diversified customer base or less specialized use. Our substantial development activities make us particularly susceptible to general economic slowdowns as well as adverse developments in the data center, Internet and data communications and broader technology industries. Any such slowdown or adverse development could lead to reduced corporate IT spending or reduced demand for data center space. Reduced demand could also result from business relocations, including to metropolitan areas that we do not currently serve. Changes in industry practice or in technology, such as virtualization technology, more efficient or miniaturization of computing or networking devices, or devices that require higher power densities than today’s devices, could also reduce demand for the physical data center space we provide or make the tenant improvements in our facilities obsolete or in need of significant upgrades to remain viable.
We face significant competition, which may adversely affect the occupancy and rental rates of our data centers.
We compete with numerous data center developers, owners and operators, many of whom own properties similar to ours in some of the same metropolitan areas where our data centers are located, including CoreSite Realty Corporation, CyrusOne Inc., Equinix, Inc., QTS Realty Trust, Inc., Switch, Inc. and various local developers in the U.S., as well as Global Switch Holdings Limited and various regional operators in Europe, Asia and Australia. In addition, we may in the future face competition from new entrants into the data center market, including new entrants who may acquire our current competitors. Some of our competitors and potential competitors have significant advantages over us, including greater name recognition, longer operating histories, pre-existing relationships with current or potential customers, significantly greater financial, marketing and other resources and more ready access to capital which allow them to respond more quickly to new or changing opportunities.
If our competitors offer space that our customers or potential customers perceive to be superior to ours based on numerous factors, including available power, security considerations, location, or connectivity, or if they offer rental rates below current market rates, or below the rental rates we are offering, we may lose customers or potential customers or be required to incur costs to improve our data centers or reduce our rental rates. In addition, recently many of our competitors have developed and continue to develop additional data center space. If the supply of data center space continues to increase as a result of these activities or otherwise, rental rates may be reduced or we may face delays in leasing or be unable to lease our vacant space, including space that we develop. Further, if customers or potential customers desire services that we do not offer, we may not be able to lease our space to those customers. Our financial condition, results of operations, cash flow, cash available for distribution and ability to satisfy our debt service obligations could be materially adversely affected as a result of any or all of these factors.
Any failure of our physical infrastructure or services could lead to significant costs and disruptions that could harm our business reputation and could adversely affect our earnings and financial condition.
Our business depends on providing customers with highly reliable service, including with respect to power supply, physical security and maintenance of environmental conditions. We may fail to provide such service as a result of numerous factors, including mechanical failure, power outage, human error, physical or electronic security breaches, war, terrorism and related conflicts or similar events worldwide, fire, earthquake, hurricane, flood and other natural disasters, sabotage and vandalism.
Problems at one or more of our data centers, whether or not within our control, could result in service interruptions or equipment damage. Substantially all of our customer leases include terms requiring us to meet certain service level commitments to our customers. Any failure to meet these or other commitments or any equipment damage in our data centers, including as a result of mechanical failure, power outage, human error or other reasons, could subject us to liability under our lease terms, including service level credits against customer rent payments, monetary damages, or, in certain cases of repeated failures, the right by the customer to terminate the lease. Service interruptions, equipment failures or security breaches may also expose us to additional legal liability and monetary damages and damage our brand and reputation, and could cause our customers to terminate or not renew their leases. In addition, we may be unable to attract new customers if we have a reputation for service disruptions, equipment failures or physical or electronic security breaches in our data centers. Any such failures could materially adversely affect our business, financial condition and results of operations.
We may be vulnerable to breaches, or unauthorized access to, or disruption of our physical and information security infrastructure and systems, any of which could disrupt our operations and have a material adverse effect on our financial condition and results of operations.
Security breaches, or disruption, of our or our customers’ physical or information technology infrastructure, networks and related management systems could result in, among other things, unauthorized access to our facilities, a breach of our and our customers’ networks and information technology infrastructure, the misappropriation of our or our customers’ or their customers’ proprietary or confidential information, interruptions or malfunctions in our or our customers’ operations, delays or interruptions to our ability to meet customer needs, breach of our legal, regulatory or contractual obligations, inability to access or rely upon critical business records or other disruptions in our operations. We may be required to expend significant financial resources to protect against or to remediate such security breaches. We may not be able to implement security measures in a timely manner or, if and when implemented, these measures could be circumvented. Any breaches that may occur could expose us to increased risk of lawsuits, material monetary damages, potential violations of applicable privacy and other laws, penalties and fines, loss of existing or potential customers, harm to our reputation and increases in our security and insurance costs, which could have a material adverse effect on our business, financial condition and results of operations.
Although ou
Showing the first 8K of 145K characters. Open the full section
Item 1B. UNRESOLVED STAFF COMMENTS
None.
Item 2. PROPERTIES
General
In addition to the information in this Item 2, certain information regarding our portfolio is contained in Schedule III (Financial Statement Schedule) under Part IV, Item 15(a) (2) and which is included in Part II, Item 8.
Our Portfolio
As of December 31, 2017, our portfolio consisted of 205 data centers, including seven held-for-sale data centers and 18 data centers held as investments in unconsolidated joint ventures, and contain a total of approximately 32.1 million rentable square feet, including 2.7 million square feet of space under active development and 1.7 million square feet of space held for development. The following table presents an overview of our portfolio of properties, including the seven data centers held-for-sale and 18 data centers held as investments in unconsolidated joint ventures and developable land, based on information as of December 31, 2017 (dollar amounts in thousands). All data centers are held in fee simple except as otherwise indicated. Please refer to Note 8 in the Notes to the Consolidated Financial Statements included in Part II, Item 8 of this Annual Report on Form 10-K for a description of all applicable encumbrances as of December 31, 2017.
| Metropolitan Area | Data Center Buildings | Net Rentable Square Feet (1) | Space Under Active Development (2) | Space Held for Development (3) | Annualized Rent (4) | Occupancy Percentage (5) | |||||||||||||
| North America | |||||||||||||||||||
| Northern Virginia | 29 | 4,810,736 | 692,187 | 90,998 | $ | 459,124 | 94.9 | % | |||||||||||
| Chicago | 9 | 2,691,942 | 305,003 | 197,160 | 268,460 | 95.2 | % | ||||||||||||
| New York | 12 | 1,907,645 | 34,821 | 278,089 | 195,401 | 84.1 | % | ||||||||||||
| Silicon Valley | 19 | 2,185,341 | 65,680 | — | 191,508 | 96.8 | % | ||||||||||||
| Dallas | 21 | 3,304,082 | 56,126 | 150,152 | 178,981 | 88.2 | % | ||||||||||||
| Phoenix | 4 | 990,385 | — | 108,926 | 90,538 | 67.3 | % | ||||||||||||
| San Francisco | 5 | 989,743 | 13,500 | — | 72,812 | 67.8 | % | ||||||||||||
| Atlanta | 5 | 775,606 | — | 313,581 | 54,031 | 94.5 | % | ||||||||||||
| Boston | 5 | 528,029 | — | 50,649 | 44,380 | 85.0 | % | ||||||||||||
| Los Angeles | 4 | 818,479 | — | — | 41,528 | 90.1 | % | ||||||||||||
| Houston | 6 | 392,816 | — | 13,969 | 21,311 | 87.9 | % | ||||||||||||
| Toronto, Canada (6) | 3 | 188,066 | 711,000 | — | 14,267 | 93.9 | % | ||||||||||||
| Denver | 2 | 371,500 | — | — | 10,850 | 95.6 | % | ||||||||||||
| Austin | 1 | 85,688 | — | — | 6,727 | 50.1 | % | ||||||||||||
| Miami | 2 | 198,461 | 22,535 | 5,318 | 6,603 | 96.6 | % | ||||||||||||
| Portland | 1 | 48,574 | — | — | 6,094 | 83.3 | % | ||||||||||||
| Minneapolis / St. Paul | 2 | 406,929 | — | — | 5,938 | 85.1 | % | ||||||||||||
| Charlotte | 3 | 95,499 | — | — | 4,447 | 88.0 | % | ||||||||||||
| Seattle | 1 | 41,156 | — | 74,790 | 2,144 | 69.1 | % | ||||||||||||
| North America Total / Weighted Average | 134 | 20,830,677 | 1,900,852 | 1,283,632 | 1,675,144 | 89.4 | % | ||||||||||||
| Europe |
| Metropolitan Area | Data Center Buildings | Net Rentable Square Feet (1) | Space Under Active Development (2) | Space Held for Development (3) | Annualized Rent (4) | Occupancy Percentage (5) | |||||||||||||
| London, United Kingdom (7) | 16 | 1,400,717 | 171,471 | 55,060 | 207,397 | 89.7 | % | ||||||||||||
| Amsterdam, Netherlands (8) | 10 | 474,217 | 21,362 | 159,947 | 47,288 | 91.9 | % | ||||||||||||
| Dublin, Ireland (8) | 5 | 307,775 | 49,051 | — | 24,048 | 90.4 | % | ||||||||||||
| Frankfurt, Germany (8) | 2 | 47,641 | 120,030 | — | 9,829 | 63.1 | % | ||||||||||||
| Paris, France (8) | 3 | 185,994 | — | — | 7,191 | 100.0 | % | ||||||||||||
| Geneva, Switzerland (8) | 1 | 59,190 | — | — | 1,791 | 100.0 | % | ||||||||||||
| Manchester, United Kingdom (7) | 1 | 38,016 | — | — | 1,822 | 100.0 | % | ||||||||||||
| Europe Total / Weighted Average | 38 | 2,513,550 | 361,914 | 215,007 | 299,366 | 90.8 | % | ||||||||||||
| Asia Pacific | |||||||||||||||||||
| Singapore (9) | 2 | 465,519 | — | 75,119 | 70,825 | 84.6 | % | ||||||||||||
| Melbourne (10) | 2 | 125,329 | 21,241 | — | 16,906 | 91.5 | % | ||||||||||||
| Sydney (10) | 3 | 138,207 | 176,150 | — | 16,306 | 99.8 | % | ||||||||||||
| Osaka | 1 | — | 239,999 | — | — | — | % | ||||||||||||
| Asia Pacific Total / Weighted Average | 8 | 729,055 | 437,390 | 75,119 | 104,037 | 88.7 | % | ||||||||||||
| Non-Data Center Properties | — | 278,068 | — | — | 1,258 | 100.0 | % | ||||||||||||
| Managed Unconsolidated Joint Ventures | |||||||||||||||||||
| Northern Virginia | 4 | 546,572 | — | — | 26,597 | 99.6 | % | ||||||||||||
| Hong Kong (11) | 1 | 114,883 | — | 71,417 | 17,639 | 80.8 | % | ||||||||||||
| Silicon Valley | 4 | 326,305 | — | — | 12,574 | 100.0 | % | ||||||||||||
| Dallas | 3 | 319,876 | — | — | 7,541 | 100.0 | % | ||||||||||||
| New York | 1 | 108,336 | — | — | 3,190 | 100.0 | % | ||||||||||||
| 13 | 1,415,972 | — | 71,417 | 67,541 | 98.3 | % | |||||||||||||
| Non-Managed Unconsolidated Joint Ventures | |||||||||||||||||||
| Seattle | 2 | 451,369 | — | — | 52,779 | 97.9 | % | ||||||||||||
| Osaka (12) | 1 | 92,682 | — | — | 14,703 | 89.2 | % | ||||||||||||
| Tokyo (12) | 2 | 277,196 | — | — | 21,099 | 87.0 | % | ||||||||||||
| 5 | 821,247 | — | — | 88,581 | 93.3 | % | |||||||||||||
| Total, excluding held for sale | 198 | 26,588,569 | 2,700,156 | 1,645,175 | 2,235,927 | 90.2 | % | ||||||||||||
| Held for Sale | 7 | 1,067,704 | — | 89,923 | 16,747 | 65.8 | % | ||||||||||||
| Total | 205 | 27,656,273 | 2,700,156 | 1,735,098 | 2,252,674 | 89.3 | % | ||||||||||||
| (1) | Net rentable square feet at a building represents the current square feet at that building under lease as specified in the lease agreements plus management’s estimate of space available for lease. We estimate the total net rentable square feet available for lease based on a number of factors in addition to contractually leased square feet, including available power, required support space and common area. Net rentable square feet includes tenants’ proportional share of common areas but excludes space held for development. |
| (2) | Space under active development includes current base building and data center projects in progress. |
| (3) | Space held for development includes space held for future data center development, and excludes space under active development. |
| (4) | Annualized rent represents the monthly contractual rent (defined as cash base rent before abatements) under existing leases as of December 31, 2017 multiplied by 12. |
| (5) | Excludes space held for development and space under active development. We estimate the total square feet available for lease based on a number of factors in addition to contractually leased square feet, including available power, required support space and common area. |
| (6) | Rental amounts were calculated based on the exchange rate in effect on December 31, 2017 of $0.80 to 1.00 CAD. |
| (7) | Rental amounts were calculated based on the exchange rate in effect on December 31, 2017 of $1.35 to £1.00. |
| (8) | Rental amounts were calculated based on the exchange rate in effect on December 31, 2017 of $1.20 to €1.00. |
| (9) | Rental amounts were calculated based on the exchange rate in effect on December 31, 2017 of $0.75 to 1.00 SGD. |
| (10) | Rental amounts were calculated based on the exchange rate in effect on December 31, 2017 of $0.78 to 1.00 AUD. |
| (11) | Rental amounts were calculated based on the exchange rate in effect on December 31, 2017 of $0.13 to 1.00 HKD. |
| (12) | Rental amounts were calculated based on the exchange rate in effect on December 31, 2017 of $0.01 to 1.00 JPY. |
We have a ground lease obligation on 2010 East Centennial Circle that expires in 2082. After February 2036, rent for the remaining term of the 2010 East Centennial Circle ground lease will be determined based on a fair market value appraisal of the property and, as result, rent after February 2036 is excluded from the minimum commitment information below.
We have ground leases on Paul van Vlissingenstraat 16 that expires in 2054, Chemin de l’Epinglier 2 that expires in 2074, Clonshaugh Industrial Estate I and II that expires in 2981, Manchester Technopark that expires in 2125, 29A International Business Park that expires in 2038, Gyroscoopweg 2E-2F, which has a continuous ground lease and will be adjusted on January 1, 2042, and Naritaweg 52, which has a continuous ground lease. We have operating leases at 111 8th Avenue (2nd and 6th floors), 111 8th Avenue (3rd and 7th floors) and 410 Commerce Boulevard, which expire in June 2024, February 2022 and December 2026, respectively. The lease at 111 8th Avenue (2ndand 6th floors) has an option to extend the lease until June 2034 and the lease at 111 8th Avenue (3rd and 7th floors) has an option to extend the lease until February 2032. The lease at 410 Commerce Boulevard has no extension options. As part of the Telx Acquisition and European Portfolio Acquisition, leases relating to operating facilities, offices, and equipment under various lease agreements expire during the years ending December 2018 through December 2037.
We have a fully prepaid ground lease on 2055 E. Technology Circle that expires in 2083. We have a fully prepaid ground lease on Cateringweg 5 that expires in 2059. The ground lease at Naritaweg 52 has been prepaid through December 2036.
Customer Diversification
As of December 31, 2017, our portfolio was leased to over 2,300 companies, many of which are internationally recognized firms. The following table sets forth information regarding the 20 largest customers in our portfolio based on annualized rent as of December 31, 2017 (dollar amounts in thousands).
| Tenant | Number of Locations | Total Occupied Square Feet (1)(4) | Percentage of Net Rentable Square Feet (4) | Annualized Rent (2)(4) | Percentage of Annualized Rent | Weighted Average Remaining Lease Term in Months | |||||||||||||
| 1 | IBM | 26 | 1,012,467 | 4.6 | % | $ | 136,542 | 6.5 | % | 50 | |||||||||
| 2 | Fortune 50 Software Company | 16 | 1,642,275 | 7.4 | % | 131,157 | 6.2 | % | 76 | ||||||||||
| 3 | Facebook, Inc. | 16 | 813,894 | 3.7 | % | 120,753 | 5.8 | % | 42 | ||||||||||
| 4 | Cyxtera Technologies, Inc. (3) | 19 | 1,938,657 | 8.8 | % | 77,374 | 3.7 | % | 56 | ||||||||||
| 5 | Oracle America, Inc. | 16 | 511,231 | 2.3 | % | 66,174 | 3.2 | % | 38 | ||||||||||
| 6 | Verizon | 67 | 452,809 | 2.0 | % | 60,469 | 2.9 | % | 39 | ||||||||||
| 7 | Fortune 25 Investment Grade-Rated Company | 7 | 493,596 | 2.2 | % | 58,554 | 2.8 | % | 66 | ||||||||||
| 8 | Equinix | 18 | 959,679 | 4.3 | % | 56,930 | 2.7 | % | 137 | ||||||||||
| 9 | Rackspace | 8 | 480,284 | 2.2 | % | 50,204 | 2.4 | % | 106 | ||||||||||
| 10 | LinkedIn Corporation | 7 | 366,992 | 1.7 | % | 44,647 | 2.1 | % | 80 | ||||||||||
| 11 | AT&T | 51 | 656,853 | 3.0 | % | 40,466 | 1.9 | % | 53 | ||||||||||
| 12 | Fortune 500 SaaS Provider | 7 | 273,349 | 1.2 | % | 40,344 | 1.9 | % | 64 | ||||||||||
| 13 | JPMorgan Chase & Co. | 16 | 260,678 | 1.2 | % | 31,702 | 1.5 | % | 40 | ||||||||||
| 14 | Comcast Corporation | 27 | 166,272 | 0.8 | % | 31,163 | 1.5 | % | 86 | ||||||||||
| 15 | DXC Technology Company | 7 | 232,114 | 1.0 | % | 29,371 | 1.4 | % | 17 | ||||||||||
| 16 | CenturyLink, Inc. | 82 | 428,465 | 1.9 | % | 26,717 | 1.3 | % | 70 | ||||||||||
| 17 | SunGard Availability Services LP | 11 | 222,187 | 1.0 | % | 24,816 | 1.2 | % | 87 | ||||||||||
| 18 | Morgan Stanley | 9 | 167,085 | 0.8 | % | 23,428 | 1.1 | % | 55 | ||||||||||
| 19 | NTT Communications Company | 15 | 237,932 | 1.1 | % | 23,419 | 1.1 | % | 48 | ||||||||||
| 20 | Charter Communications | 18 | 144,163 | 0.7 | % | 23,092 | 1.1 | % | 76 | ||||||||||
| Total / Weighted Average | 11,460,982 | 51.9 | % | $ | 1,097,322 | 52.3 | % | 66 |
Note: Our direct customers may be the entities named in the table above or their subsidiaries or affiliates.
| (1) | Occupied square footage is defined as leases that commenced on or before December 31, 2017. For some of our properties, we calculate occupancy based on factors in addition to contractually leased square feet, including available power, required support space and common area. |
| (2) | Annualized rent represents the monthly contractual base rent (defined as cash base rent before abatements) under existing leases as of December 31, 2017 multiplied by 12. |
| (3) | Represents leases with former CenturyLink, Inc. affiliates, which are our direct customers. Cyxtera Technologies, Inc. acquired the data center and colocation business, including such direct customers, of CenturyLink, Inc. in 2Q 2017. |
| (4) | Represents consolidated portfolio plus our managed portfolio of unconsolidated joint ventures based on our ownership percentage. |
Lease Distribution
The following table sets forth information relating to the distribution of leases in the properties in our portfolio, based on net rentable square feet (excluding approximately 2.7 million square feet of space under active development and approximately 1.7 million square feet of space held for development at December 31, 2017) under lease as of December 31, 2017 (dollar amounts in thousands).
| Square Feet Under Lease | Total Net Rentable Square Feet(1)(3) | Percentage of Net Rentable Square Feet(1) | Annualized Rent(2)(3) | Percentage of Annualized Rent | |||||||||
| Available | 2,528,626 | 10.3 | % | — | — | ||||||||
| 2,500 or less | 1,624,583 | 6.6 | % | $ | 319,463 | 15.2 | % | ||||||
| 2,501 - 10,000 | 2,589,701 | 10.5 | % | 311,072 | 14.8 | % | |||||||
| 10,001 - 20,000 | 5,739,871 | 23.3 | % | 688,464 | 32.8 | % | |||||||
| 20,001 - 40,000 | 4,278,349 | 17.3 | % | 446,093 | 21.3 | % | |||||||
| 40,001 - 100,000 | 4,318,334 | 17.4 | % | 218,165 | 10.4 | % | |||||||
| Greater than 100,000 | 3,589,546 | 14.6 | % | 115,349 | 5.5 | % | |||||||
| Portfolio Total | 24,669,010 | 100.0 | % | $ | 2,098,606 | 100.0 | % |
| (1) | For some of our properties, we calculate square footage based on factors in addition to contractually leased square feet, including available power, required support space and common area. We estimate the total net rentable square feet available for lease based on a number of factors in addition to contractually leased square feet, including available power, required support space and common area. |
| (2) | Annualized rent represents the monthly contractual base rent (defined as cash base rent before abatements) under existing leases as of December 31, 2017 multiplied by 12. |
| (3) | Represents consolidated portfolio plus our managed portfolio of unconsolidated joint ventures based on our ownership percentage. |
Lease Expirations
The following table sets forth a summary schedule of the lease expirations for leases in place as of December 31, 2017 plus available space for ten calendar years at the properties in our portfolio, excluding approximately 2.7 million square feet of space under active development and approximately 1.7 million square feet of space held for development at December 31, 2017. Unless otherwise stated in the footnotes to the table below, the information set forth in the table assumes that tenants exercise no renewal options and all early termination rights (dollar amounts in thousands).
| Year | Square Footage of Expiring Leases (1)(4) | Percentage of Net Rentable Square Feet (4) | Annualized Rent (2)(4) | Percentage of Annualized Rent (4) | Annualized Rent Per Occupied Square Foot (4) | Annualized Rent Per Occupied Square Foot at Expiration (4) | Annualized Rent at Expiration | ||||||||||||||||||
| Available | 2,528,626 | 10.3 | % | ||||||||||||||||||||||
| Month to Month (3) | 223,507 | 0.9 | % | $ | 59,992 | 2.9 | % | $ | 268 | $ | 269 | $ | 60,044 | ||||||||||||
| 2018 | 2,005,531 | 8.1 | % | 303,772 | 14.5 | % | 151 | 152 | 304,351 | ||||||||||||||||
| 2019 | 3,444,722 | 14.0 | % | 365,983 | 17.4 | % | 106 | 109 | 376,296 | ||||||||||||||||
| 2020 | 2,354,776 | 9.6 | % | 265,144 | 12.6 | % | 113 | 119 | 279,353 | ||||||||||||||||
| 2021 | 2,696,638 | 10.9 | % | 220,117 | 10.5 | % | 82 | 88 | 237,657 | ||||||||||||||||
| 2022 | 2,575,314 | 10.4 | % | 245,781 | 11.7 | % | 95 | 106 | 273,076 | ||||||||||||||||
| 2023 | 1,457,486 | 5.9 | % | 133,049 | 6.3 | % | 91 | 101 | 147,498 | ||||||||||||||||
| 2024 | 1,514,345 | 6.1 | % | 127,814 | 6.1 | % | 84 | 98 | 149,147 | ||||||||||||||||
| 2025 | 1,426,676 | 5.8 | % | 84,021 | 4.0 | % | 59 | 70 | 99,740 | ||||||||||||||||
| 2026 | 986,168 | 4.0 | % | 87,459 | 4.2 | % | 89 | 105 | 103,396 | ||||||||||||||||
| 2027 | 780,746 | 3.2 | % | 64,781 | 3.1 | % | 83 | 105 | 81,644 | ||||||||||||||||
| Thereafter | 2,674,475 | 10.8 | % | 140,693 | 6.7 | % | 53 | 69 | 185,822 | ||||||||||||||||
| Portfolio Total / Weighted Average | 24,669,010 | 100.0 | % | $ | 2,098,606 | 100.0 | % | $ | 95 | $ | 104 | $ | 2,298,024 |
| (1) | For some of our properties, we calculate square footage based on factors in addition to contractually leased square feet, including available power, required support space and common area. We estimate the total net rentable square feet available for lease based on a number of factors in addition to contractually leased square feet, including available power, required support space and common area. |
| (2) | Annualized rent represents the monthly contractual base rent (defined as cash base rent before abatements) under existing leases as of December 31, 2017 multiplied by 12. |
| (3) | Includes leases, licenses and similar agreements that upon expiration have been automatically renewed on a month-to-month basis. |
| (4) | Represents consolidated portfolio plus our managed portfolio of unconsolidated joint ventures based on our ownership percentage. |
Item 3. LEGAL PROCEEDINGS
In the ordinary course of our business, we may become subject to tort claims, breach of contract and other claims and administrative proceedings. As of December 31, 2017, we were not a party to any legal proceedings which we believe would have a material adverse effect on our operations or financial position.
Item 4. MINE SAFETY DISCLOSURES
Item 5. MARKET FOR REGISTRANT’S COMMON EQUITY, RELATED STOCKHOLDER MATTERS AND ISSUER PURCHASES OF EQUITY SECURITIES
Digital Realty Trust, Inc.
Digital Realty Trust, Inc.’s common stock has been listed, and is traded, on the New York Stock Exchange, or the NYSE, under the symbol “DLR” since October 29, 2004. The following table sets forth, for the periods indicated, the high and low last sale prices in dollars on the NYSE for our common stock and the dividends we declared with respect to the periods indicated.
| High | Low | Dividends Declared | |||||||||
| First Quarter 2016 | $ | 89.34 | $ | 69.89 | $ | 0.88000 | |||||
| Second Quarter 2016 | $ | 109.08 | $ | 85.50 | $ | 0.88000 | |||||
| Third Quarter 2016 | $ | 113.21 | $ | 91.27 | $ | 0.88000 | |||||
| Fourth Quarter 2016 | $ | 98.79 | $ | 85.63 | $ | 0.88000 | |||||
| First Quarter 2017 | $ | 109.00 | $ | 98.03 | $ | 0.93000 | |||||
| Second Quarter 2017 | $ | 121.53 | $ | 105.17 | $ | 0.93000 | |||||
| Third Quarter 2017 | $ | 127.23 | $ | 108.73 | $ | 0.93000 | |||||
| Fourth Quarter 2017 | $ | 124.16 | $ | 109.19 | $ | 0.93000 |
Digital Realty Trust, Inc. intends to continue to declare quarterly dividends on its common stock. The actual amount, form and timing of dividends, however, will be at the discretion of Digital Realty Trust, Inc.'s board of directors and will depend upon the Company's financial condition in addition to the requirements for qualification as a REIT under the Code, and no assurance can be given as to the amounts, form or timing of future dividends. Our global revolving credit facility and our term loan facility prohibit us from making distributions to our stockholders, or redeeming or otherwise repurchasing shares of our capital stock, including our common stock, after the occurrence and during the continuance of an event of default, except in limited circumstances including as necessary to enable us to maintain our qualification as a REIT and to avoid the payment of income or excise tax. Consequently, after the occurrence and during the continuance of an event of default under our global revolving credit facility or term loan facility, we may not be able to pay all or a portion of the dividends payable to the holders of our common stock.
Subject to the distribution requirements applicable to REITs under the Code, Digital Realty Trust, Inc. intends, to the extent practicable, to invest substantially all of the proceeds from sales and refinancings of its assets in real estate-related assets and other assets. Digital Realty Trust, Inc. may, however, under certain circumstances, make a dividend of capital or of assets. Such dividends, if any, will be made at the discretion of Digital Realty Trust, Inc.'s board of directors.
As of February 27, 2018, there were approximately 481 holders of record of Digital Realty Trust, Inc.’s common stock. This figure does not reflect the beneficial ownership of shares held in nominee name.
Digital Realty Trust, L.P.
There is no established trading market for Digital Realty Trust, L.P.’s common units of limited partnership. As of February 27, 2018, there were 93 holders of record of common units, including Digital Realty Trust, L.P.’s general partner, Digital Realty Trust, Inc.
The following table sets forth, for the periods indicated, the distributions per common unit that our Operating Partnership declared with respect to the periods indicated.
| Distributions Declared | |||
| First Quarter 2016 | $ | 0.88000 | |
| Second Quarter 2016 | $ | 0.88000 | |
| Third Quarter 2016 | $ | 0.88000 | |
| Fourth Quarter 2016 | $ | 0.88000 | |
| First Quarter 2017 | $ | 0.93000 | |
| Second Quarter 2017 | $ | 0.93000 | |
| Third Quarter 2017 | $ | 0.93000 | |
| Fourth Quarter 2017 | $ | 0.93000 |
Digital Realty Trust, L.P. currently intends to continue to make regular quarterly distributions to holders of its common units. Any future distributions will be declared at the discretion of the board of directors of Digital Realty Trust, L.P.’s general partner, Digital Realty Trust, Inc., and will depend on our actual cash flow, financial condition, capital requirements, the annual distribution requirements under the REIT provisions of the Code, and such other factors as the board of directors may deem relevant.
STOCK PERFORMANCE GRAPH
The following graph compares the yearly change in the cumulative total stockholder return on Digital Realty Trust, Inc.’s common stock during the period from December 31, 2012 through December 31, 2017, with the cumulative total returns on the MSCI US REIT Index (RMS) and the S&P 500 Market Index. The comparison assumes that $100 was invested on December 31, 2012 in Digital Realty Trust, Inc.’s common stock and in each of these indices and assumes reinvestment of dividends, if any.
COMPARISON OF CUMULATIVE TOTAL RETURNS
AMONG DIGITAL REALTY TRUST, INC., S&P 500 INDEX AND RMS INDEX
Assumes $100 invested on December 31, 2012
Assumes dividends reinvested
To fiscal year ending December 31, 2017
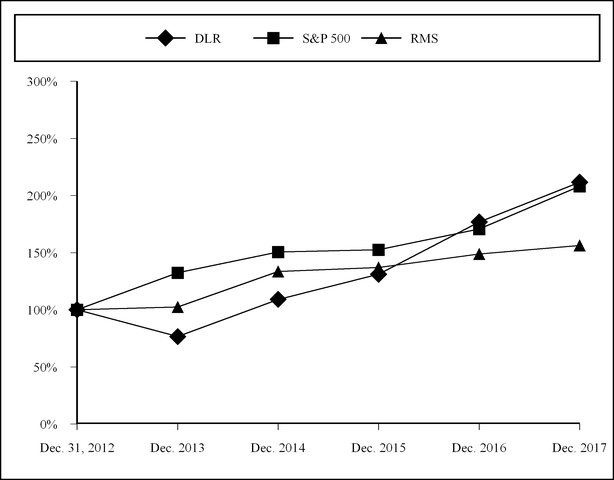
| Pricing Date | DLR($) | S&P 500($) | RMS($) | |||||
| December 31, 2012 | 100.0 | 100.0 | 100.0 | |||||
| December 31, 2013 | 76.5 | 132.4 | 102.5 | |||||
| December 31, 2014 | 109.1 | 150.5 | 133.6 | |||||
| December 31, 2015 | 131.1 | 152.6 | 137.0 | |||||
| December 31, 2016 | 176.8 | 170.8 | 148.8 | |||||
| December 31, 2017 | 211.7 | 208.1 | 156.3 |
| • | This graph and the accompanying text are not “soliciting material,” are not deemed filed with the SEC and are not to be incorporated by reference in any filing by us under the Securities Act of 1933, as amended, or the Securities Exchange Act of 1934, as amended, whether made before or after the date hereof and irrespective of any general incorporation language in any such filing. |
| • | The stock price performance shown on the graph is not necessarily indicative of future price performance. |
| • | The hypothetical investment in Digital Realty Trust, Inc.’s common stock presented in the stock performance graph above is based on the closing price of the common stock on December 31, 2012. |
SALES OF UNREGISTERED EQUITY SECURITIES
Digital Realty Trust, Inc.
None.
Digital Realty Trust, L.P.
During the year ended December 31, 2017, our Operating Partnership issued partnership units in private placements in reliance on the exemption from registration provided by Section 4(a)(2) of the Securities Act, in the amounts and for the consideration set forth below:
During the year ended December 31, 2017, Digital Realty Trust, Inc. issued an aggregate of 17,668 shares of its common stock upon the exercise of stock options. Digital Realty Trust, Inc. contributed the proceeds from the option exercises of approximately $0.7 million to our Operating Partnership and our Operating Partnership issued to Digital Realty Trust, Inc. an aggregate of 17,668 common units, as required by our Operating Partnership’s partnership agreement.
During the year ended December 31, 2017, Digital Realty Trust, Inc. issued an aggregate of 272,047 shares of its common stock in connection with restricted stock awards for no cash consideration. For each share of common stock issued by Digital Realty Trust, Inc. in connection with such awards, our Operating Partnership issued a restricted common unit to Digital Realty Trust, Inc. During the year ended December 31, 2017, our Operating Partnership issued an aggregate of 272,047 common units to Digital Realty Trust, Inc., as required by our Operating Partnership’s partnership agreement. During the year ended December 31, 2017, an aggregate of 22,997 shares of its common stock were forfeited to Digital Realty Trust, Inc. in connection with restricted stock awards for a net issuance of 249,050 shares of common stock.
All other issuances of unregistered equity securities of our Operating Partnership during the year ended December 31, 2017 have previously been disclosed in filings with the SEC. For all issuances of units to Digital Realty Trust, Inc., our Operating Partnership relied on Digital Realty Trust, Inc.’s status as a publicly traded NYSE-listed company with over $21.4 billion in total consolidated assets and as our Operating Partnership’s majority owner and general partner as the basis for the exemption under Section 4(a)(2) of the Securities Act.
REPURCHASES OF EQUITY SECURITIES
Digital Realty Trust, Inc.
None.
Digital Realty Trust, L.P.
None.
Item 6. SELECTED FINANCIAL DATA
SELECTED COMPANY FINANCIAL AND OTHER DATA (Digital Realty Trust, Inc.)
The following table sets forth selected consolidated financial and operating data on an historical basis for Digital Realty Trust, Inc.
The following data should be read in conjunction with our financial statements and notes thereto and “Management’s Discussion and Analysis of Financial Condition and Results of Operations” included elsewhere in this Form 10-K. Certain prior year amounts have been reclassified to conform to the current year presentation.
| Year Ended December 31, | |||||||||||||||||||
| 2017 | 2016 | 2015 | 2014 | 2013 | |||||||||||||||
| (Amounts in thousands, except share and per share data) | |||||||||||||||||||
| Statement of Operations Data: | |||||||||||||||||||
| Operating Revenues: | |||||||||||||||||||
| Rental | $ | 1,774,649 | $ | 1,542,511 | $ | 1,354,986 | $ | 1,256,086 | $ | 1,155,051 | |||||||||
| Tenant reimbursements | 440,224 | 355,903 | 359,875 | 350,234 | 323,286 | ||||||||||||||
| Interconnection and other | 235,652 | 204,317 | 40,759 | — | — | ||||||||||||||
| Fee income | 6,372 | 6,285 | 6,638 | 7,268 | 3,520 | ||||||||||||||
| Other | 1,031 | 33,197 | 1,078 | 2,850 | 402 | ||||||||||||||
| Total operating revenues | 2,457,928 | 2,142,213 | 1,763,336 | 1,616,438 | 1,482,259 | ||||||||||||||
| Operating Expenses: | |||||||||||||||||||
| Rental property operating and maintenance | 759,616 | 660,177 | 549,885 | 503,140 | 456,596 | ||||||||||||||
| Property taxes | 124,014 | 102,497 | 92,588 | 91,538 | 90,321 | ||||||||||||||
| Insurance | 10,981 | 9,492 | 8,809 | 8,643 | 8,743 | ||||||||||||||
| Change in fair value of contingent consideration | — | — | (44,276 | ) | (8,093 | ) | (1,762 | ) | |||||||||||
| Depreciation and amortization | 842,464 | 699,324 | 570,527 | 538,513 | 475,464 | ||||||||||||||
| General and administrative | 161,441 | 152,733 | 105,549 | 93,188 | 65,653 | ||||||||||||||
| Transaction and integration expenses | 76,048 | 20,491 | 17,400 | 1,303 | 4,605 | ||||||||||||||
| Impairment on investments in real estate | 28,992 | — | — | 126,470 | — | ||||||||||||||
| Other | 3,077 | 213 | 60,943 | 3,070 | 827 | ||||||||||||||
| Total operating expenses | 2,006,633 | 1,644,927 | 1,361,425 | 1,357,772 | 1,100,447 | ||||||||||||||
| Operating income | 451,295 | 497,286 | 401,911 | 258,666 | 381,812 | ||||||||||||||
| Other Income (Expenses): | |||||||||||||||||||
| Equity in earnings of unconsolidated joint ventures | 25,516 | 17,104 | 15,491 | 13,289 | 9,796 | ||||||||||||||
| Gain on insurance settlement | — | — | — | — | 5,597 | ||||||||||||||
| Gain on sale of properties | 40,354 | 169,902 | 94,604 | 15,945 | — | ||||||||||||||
| Gain on contribution of investment properties to unconsolidated joint ventures | — | — | — | 95,404 | 115,609 | ||||||||||||||
| Gain on sale of equity investment | — | — | — | 14,551 | — | ||||||||||||||
| Interest and other income | 3,655 | (4,564 | ) | (2,381 | ) | 2,663 | 139 | ||||||||||||
| Interest expense | (258,642 | ) | (236,480 | ) | (201,435 | ) | (191,085 | ) | (189,399 | ) | |||||||||
| Tax expense | (7,901 | ) | (10,385 | ) | (6,451 | ) | (5,238 | ) | (1,292 | ) | |||||||||
| Gain (loss) from early extinguishment of debt | 1,990 | (1,011 | ) | (148 | ) | (780 | ) | (1,813 | ) | ||||||||||
| Net income | 256,267 | 431,852 | 301,591 | 203,415 | 320,449 | ||||||||||||||
| Net income attributable to noncontrolling interests | (8,008 | ) | (5,665 | ) | (4,902 | ) | (3,232 | ) | (5,961 | ) | |||||||||
| Net income attributable to Digital Realty Trust, Inc. | 248,259 | 426,187 | 296,689 | 200,183 | 314,488 | ||||||||||||||
| Preferred stock dividends | (68,802 | ) | (83,771 | ) | (79,423 | ) | (67,465 | ) | (42,905 | ) | |||||||||
| Issuance costs associated with redeemed preferred stock | (6,309 | ) | (10,328 | ) | — | — | — | ||||||||||||
| Net income available to common stockholders | $ | 173,148 | $ | 332,088 | $ | 217,266 | $ | 132,718 | $ | 271,583 | |||||||||
| Per Share Data: | |||||||||||||||||||
| Basic income per share available to common stockholders | $ | 0.99 | $ | 2.21 | $ | 1.57 | $ | 1.00 | $ | 2.12 | |||||||||
| Diluted income per share available to common stockholders | $ | 0.99 | $ | 2.20 | $ | 1.56 | $ | 0.99 | $ | 2.12 | |||||||||
| Cash dividend per common share | $ | 3.72 | $ | 3.52 | $ | 3.40 | $ | 3.32 | $ | 3.12 |
| Weighted average common shares outstanding: | |||||||||||||||||||
| Basic | 174,059,386 | 149,953,662 | 138,247,606 | 133,369,047 | 127,941,134 | ||||||||||||||
| Diluted | 174,895,098 | 150,679,688 | 138,865,421 | 133,637,235 | 128,127,641 |
| December 31, | |||||||||||||||||||
| 2017 | 2016 | 2015 | 2014 | 2013 | |||||||||||||||
| Balance Sheet Data: | |||||||||||||||||||
| Net investments in real estate | $ | 13,841,186 | $ | 8,996,362 | $ | 8,770,212 | $ | 8,203,287 | $ | 8,384,086 | |||||||||
| Total assets | 21,404,345 | 12,192,585 | 11,416,063 | 9,526,784 | 9,626,830 | ||||||||||||||
| Global revolving credit facility | 550,946 | 199,209 | 960,271 | 525,951 | 724,668 | ||||||||||||||
| Unsecured term loan | 1,420,333 | 1,482,361 | 923,267 | 976,600 | 1,020,984 | ||||||||||||||
| Unsecured senior notes, net of discount | 6,570,757 | 4,153,797 | 3,712,569 | 2,791,758 | 2,364,232 | ||||||||||||||
| Exchangeable senior debentures, net of discount | — | — | — | — | 266,400 | ||||||||||||||
| Mortgages and other secured loans, net of premiums | 106,582 | 3,240 | 302,930 | 378,818 | 585,608 | ||||||||||||||
| Total liabilities | 10,300,993 | 7,060,288 | 6,879,561 | 5,612,546 | 5,980,318 | ||||||||||||||
| Redeemable noncontrolling interests in operating partnership | 53,902 | — | — | — | — | ||||||||||||||
| Total stockholders' equity | 10,349,081 | 5,096,015 | 4,500,132 | 3,878,256 | 3,610,516 | ||||||||||||||
| Noncontrolling interests in operating partnership | 698,126 | 29,684 | 29,612 | 29,191 | 29,027 | ||||||||||||||
| Noncontrolling interests in consolidated joint ventures | 2,243 | 6,598 | 6,758 | 6,791 | 6,969 | ||||||||||||||
| Total liabilities and equity | $ | 21,404,345 | $ | 12,192,585 | $ | 11,416,063 | $ | 9,526,784 | $ | 9,626,830 |
| Year Ended December 31, | |||||||||||||||||||
| 2017 | 2016 | 2015 | 2014 | 2013 | |||||||||||||||
| Cash flows from (used in): | |||||||||||||||||||
| Operating activities | $ | 1,023,305 | $ | 911,242 | $ | 796,840 | $ | 655,888 | $ | 656,390 | |||||||||
| Investing activities | (1,357,153 | ) | (1,303,597 | ) | (2,527,501 | ) | (644,180 | ) | (1,060,609 | ) | |||||||||
| Financing activities | 321,200 | 350,617 | 1,750,531 | (26,974 | ) | 401,832 |
SELECTED COMPANY FINANCIAL AND OTHER DATA (Digital Realty Trust, L.P.)
The following table sets forth selected consolidated financial and operating data on an historical basis for our Operating Partnership.
| Year Ended December 31, | |||||||||||||||||||
| 2017 | 2016 | 2015 | 2014 | 2013 | |||||||||||||||
| (Amounts in thousands, except unit and per unit data) | |||||||||||||||||||
| Statement of Operations Data: | |||||||||||||||||||
| Operating Revenues: | |||||||||||||||||||
| Rental | $ | 1,774,649 | $ | 1,542,511 | $ | 1,354,986 | $ | 1,256,086 | $ | 1,155,051 | |||||||||
| Tenant reimbursements | 440,224 | 355,903 | 359,875 | 350,234 | 323,286 | ||||||||||||||
| Interconnection and other | 235,652 | 204,317 | 40,759 | — | — | ||||||||||||||
| Fee income | 6,372 | 6,285 | 6,638 | 7,268 | 3,520 | ||||||||||||||
| Other | 1,031 | 33,197 | 1,078 | 2,850 | 402 | ||||||||||||||
| Total operating revenues | 2,457,928 | 2,142,213 | 1,763,336 | 1,616,438 | 1,482,259 | ||||||||||||||
| Operating Expenses: | |||||||||||||||||||
| Rental property operating and maintenance | 759,616 | 660,177 | 549,885 | 503,140 | 456,596 | ||||||||||||||
| Property taxes | 124,014 | 102,497 | 92,588 | 91,538 | 90,321 | ||||||||||||||
| Insurance | 10,981 | 9,492 | 8,809 | 8,643 | 8,743 | ||||||||||||||
| Change in fair value of contingent consideration | — | — | (44,276 | ) | (8,093 | ) | (1,762 | ) | |||||||||||
| Depreciation and amortization | 842,464 | 699,324 | 570,527 | 538,513 | 475,464 | ||||||||||||||
| General and administrative | 161,441 | 152,733 | 105,549 | 93,188 | 65,653 | ||||||||||||||
| Transaction and integration expenses | 76,048 | 20,491 | 17,400 | 1,303 | 4,605 | ||||||||||||||
| Impairment on investments in real estate | 28,992 | — | — | 126,470 | — | ||||||||||||||
| Other | 3,077 | 213 | 60,943 | 3,070 | 827 | ||||||||||||||
| Total operating expenses | 2,006,633 | 1,644,927 | 1,361,425 | 1,357,772 | 1,100,447 | ||||||||||||||
| Operating income | 451,295 | 497,286 | 401,911 | 258,666 | 381,812 | ||||||||||||||
| Other Income (Expenses): | |||||||||||||||||||
| Equity in earnings of unconsolidated joint ventures | 25,516 | 17,104 | 15,491 | 13,289 | 9,796 | ||||||||||||||
| Gain on insurance settlement | — | — | — | — | 5,597 | ||||||||||||||
| Gain on sale of properties | 40,354 | 169,902 | 94,604 | 15,945 | — | ||||||||||||||
| Gain on contribution of investment properties to unconsolidated joint ventures | — | — | — | 95,404 | 115,609 | ||||||||||||||
| Gain on sale of equity investment | — | — | — | 14,551 | — | ||||||||||||||
| Interest and other income | 3,655 | (4,564 | ) | (2,381 | ) | 2,663 | 139 | ||||||||||||
| Interest expense | (258,642 | ) | (236,480 | ) | (202,800 | ) | (191,085 | ) | (189,399 | ) | |||||||||
| Tax expense | (7,901 | ) | (10,385 | ) | (6,451 | ) | (5,238 | ) | (1,292 | ) | |||||||||
| Gain (loss) from early extinguishment of debt | 1,990 | (1,011 | ) | (148 | ) | (780 | ) | (1,813 | ) | ||||||||||
| Net income | 256,267 | 431,852 | 300,226 | 203,415 | 320,449 | ||||||||||||||
| Net (income) loss attributable to noncontrolling interests in consolidated joint ventures | (4,238 | ) | (367 | ) | (460 | ) | (465 | ) | (595 | ) | |||||||||
| Net income attributable to Digital Realty Trust, L.P. | 252,029 | 431,485 | 299,766 | 202,950 | 319,854 | ||||||||||||||
| Preferred units distributions | (68,802 | ) | (83,771 | ) | (79,423 | ) | (67,465 | ) | (42,905 | ) | |||||||||
| Issuance costs associated with redeemed preferred units | (6,309 | ) | (10,328 | ) | — | — | — | ||||||||||||
| Net income available to common unitholders | $ | 176,918 | $ | 337,386 | $ | 220,343 | $ | 135,485 | $ | 276,949 | |||||||||
| Per Unit Data: | |||||||||||||||||||
| Basic income per unit available to common unitholders | $ | 0.99 | $ | 2.21 | $ | 1.56 | $ | 1.00 | $ | 2.12 | |||||||||
| Diluted income per unit available to common unitholders | $ | 0.99 | $ | 2.20 | $ | 1.55 | $ | 0.99 | $ | 2.12 |
| Cash distributions per common unit | $ | 3.72 | $ | 3.52 | $ | 3.40 | $ | 3.32 | $ | 3.12 | |||||||||
| Weighted average common units outstanding: | |||||||||||||||||||
| Basic | 178,055,936 | 152,359,680 | 140,905,897 | 136,122,661 | 130,462,534 | ||||||||||||||
| Diluted | 178,891,648 | 153,085,706 | 141,523,712 | 136,390,849 | 130,649,041 |
| December 31, | |||||||||||||||||||
| 2017 | 2016 | 2015 | 2014 | 2013 | |||||||||||||||
| Balance Sheet Data: | |||||||||||||||||||
| Net investments in real estate | $ | 13,841,186 | $ | 8,996,362 | $ | 8,770,212 | $ | 8,203,287 | $ | 8,384,086 | |||||||||
| Total assets | 21,404,345 | 12,192,585 | 11,416,063 | 9,526,784 | 9,626,830 | ||||||||||||||
| Global revolving credit facility | 550,946 | 199,209 | 960,271 | 525,951 | 724,668 | ||||||||||||||
| Unsecured term loan | 1,420,333 | 1,482,361 | 923,267 | 976,600 | 1,020,984 | ||||||||||||||
| Unsecured senior notes, net of discount | 6,570,757 | 4,153,797 | 3,712,569 | 2,791,758 | 2,364,232 | ||||||||||||||
| Exchangeable senior debentures, net of discount | — | — | — | — | 266,400 | ||||||||||||||
| Mortgages and other secured loans, net of premiums | 106,582 | 3,240 | 302,930 | 378,818 | 585,608 | ||||||||||||||
| Total liabilities | 10,300,993 | 7,060,288 | 6,880,926 | 5,612,546 | 5,980,318 | ||||||||||||||
| Redeemable limited partner common units | 53,902 | — | — | — | — | ||||||||||||||
| General partner’s capital | 10,457,513 | 5,231,620 | 4,595,357 | 3,923,302 | 3,599,825 | ||||||||||||||
| Limited partners’ capital | 702,579 | 34,698 | 33,986 | 32,578 | 31,261 | ||||||||||||||
| Accumulated other comprehensive income (loss) | (112,885 | ) | (140,619 | ) | (100,964 | ) | (48,433 | ) | 8,457 | ||||||||||
| Noncontrolling interests in consolidated joint ventures | 2,243 | 6,598 | 6,758 | 6,791 | 6,969 | ||||||||||||||
| Total liabilities and capital | $ | 21,404,345 | $ | 12,192,585 | $ | 11,416,063 | $ | 9,526,784 | $ | 9,626,830 |
| Year Ended December 31, | |||||||||||||||||||
| 2017 | 2016 | 2015 | 2014 | 2013 | |||||||||||||||
| Cash flows from (used in): | |||||||||||||||||||
| Operating activities | $ | 1,023,305 | $ | 911,242 | $ | 796,840 | $ | 655,888 | $ | 656,390 | |||||||||
| Investing activities | (1,357,153 | ) | (1,303,597 | ) | (2,527,501 | ) | (644,180 | ) | (1,060,609 | ) | |||||||||
| Financing activities | 321,200 | 350,617 | 1,750,531 | (26,974 | ) | 401,832 |
Item 7. MANAGEMENT’S DISCUSSION AND ANALYSIS OF FINANCIAL CONDITION AND RESULTS OF OPERATIONS
The following discussion should be read in conjunction with the consolidated financial statements and notes thereto appearing elsewhere in this report. We make statements in this section that are forward-looking statements within the meaning of the federal securities laws. For a complete discussion of forward-looking statements, see the section in this report entitled “Forward-Looking Statements.” Certain risk factors may cause our actual results, performance or achievements to differ materially from those expressed or implied by the following discussion. For a discussion of such risk factors, see the sections in this report entitled “Risk Factors” and “Forward-Looking Statements.”
Occupancy percentages included in the following discussion, for some of our properties, are calculated based on factors in addition to contractually leased square feet, including available power, required support space and common area.
Overview
Our Company. Digital Realty Trust, Inc. completed its initial public offering of common stock, or our IPO, on November 3, 2004. We believe that we have operated in a manner that has enabled us to qualify, and have elected to be treated, as a REIT under Sections 856 through 860 of the Code. Our Company was formed on March 9, 2004. During the period from our formation until we commenced operations in connection with the completion of our IPO, we did not have any corporate activity other than the issuance of shares of Digital Realty Trust, Inc. common stock in connection with the initial capitalization of the Company. Our Operating Partnership was formed on July 21, 2004.
On September 14, 2017, we completed the acquisition of DuPont Fabros Technology, Inc., in an all-stock merger, which we refer to as the DFT Merger, for equity consideration of approximately $6.2 billion. We believe this transaction expanded our reach with a complementary footprint in top U.S. metropolitan areas while enhancing our ability to meet the growing demand for hyper-scale and public cloud solutions and solidifying our blue-chip customer base. As part of the DFT Merger, we acquired 15 data centers, 14 of which are located in the United States and one is located in Canada.
On September 14, 2017, pursuant to the Agreement and Plan of Merger (the “Merger Agreement”) by and among Digital Realty Trust, Inc., Digital Realty Trust, L.P., Penguins REIT Sub, LLC, a wholly owned subsidiary of Digital Realty Trust, Inc.(“Merger Sub”), Penguins OP Sub 2, LLC, a wholly owned subsidiary of Digital Realty Trust, L.P. (“Merger Sub GP”), Penguins OP Sub, LLC, a subsidiary of Digital Realty Trust, L.P. and Merger Sub GP (the “Partnership Merger Sub”), DuPont Fabros Technology, Inc., a Maryland corporation (“DFT”), and DuPont Fabros Technology, L.P., a Maryland limited partnership (the “DFT Operating Partnership”) (i) DFT merged with and into Merger Sub (the “REIT Merger”) and (ii) the Partnership Merger Sub merged with and into the DFT Operating Partnership (the “Partnership Merger” and, together with the REIT Merger, the “DFT merger” or “the merger”). Upon completion of the REIT Merger, Merger Sub survived and the separate corporate existence of DFT ceased.
Business and strategy. Our primary business objectives are to maximize: (i) sustainable long-term growth in earnings and funds from operations per share and unit, (ii) cash flow and returns to our stockholders and our operating partnership’s unitholders through the payment of distributions and (iii) return on invested capital. We expect to accomplish our objectives by achieving superior risk-adjusted returns, prudently allocating capital, diversifying our product offerings and driving revenue growth and operating efficiencies. We plan to focus on our core business of investing in and developing and operating data centers. A significant component of our current and future internal growth is anticipated through the development of our existing space held for development, acquisition of land for future development and acquisition of new properties. We target high quality, strategically located properties containing the physical and connectivity infrastructure that supports the applications and operations of data center and technology industry customers and properties that may be developed for such use. Most of our data center properties contain fully redundant electrical supply systems, multiple power feeds, above-standard cooling systems, raised floor areas, extensive in-building communications cabling and high-level security systems. We focus exclusively on owning, acquiring, developing and operating data centers because we believe that the growth in data center demand and the technology-related real estate industry generally will continue to outpace the overall economy.
As of December 31, 2017, our portfolio included 205 data centers, including seven data centers held-for-sale and 18 data centers held as investments in unconsolidated joint ventures, with approximately 32.1 million rentable square feet including approximately 2.7 million square feet of space under active development and approximately 1.7 million square feet of space held for development. The 18 data centers held as investments in unconsolidated joint ventures have an aggregate of approximately 2.2 million rentable square feet. The 21 parcels of developable land we own comprised approximately 539 acres. At December 31, 2017, approximately 2.7 million square feet was under construction for Turn-Key Flex®, colocation and
Powered Base Building® products, all of which are expected to be income producing on or after completion, in seven U.S. metropolitan areas, four European metropolitan areas, two Australian metropolitan areas, one Canadian metropolitan area and one Asian metropolitan area, consisting of approximately 1.3 million square feet of base building construction and 1.4 million square feet of data center construction.
We have developed detailed, standardized procedures for evaluating new real estate investments to ensure that they meet our financial, technical and other criteria. We expect to continue to acquire additional assets as part of our growth strategy. We intend to aggressively manage and lease our assets to increase their cash flow. We may continue to build out our development portfolio when justified by anticipated demand and returns.
We may acquire properties subject to existing mortgage financing and other indebtedness or we may incur new indebtedness in connection with acquiring or refinancing these properties. Debt service on such indebtedness will have a priority over any cash dividends with respect to Digital Realty Trust, Inc.’s common stock and preferred stock. We are committed to maintaining a conservative capital structure. We target a debt-to-Adjusted EBITDA ratio at or less than 5.5x, fixed charge coverage of greater than three times, and floating rate debt at less than 20% of total outstanding debt. In addition, we strive to maintain a well-laddered debt maturity schedule, and we seek to maximize the menu of our available sources of capital, while minimizing the cost.
Revenue base. As of December 31, 2017, we operated 205 data centers through our Operating Partnership, including seven data centers held-for-sale and 18 data centers held as investments in unconsolidated joint ventures, and developable land. These data centers are mainly located throughout North America, with 38 located in Europe, seven in Asia and five properties in Australia. We, through our predecessor, acquired our first portfolio property in January 2002 and have added properties through acquisition and development activities as set forth in the table below:
The following table presents an overview of our portfolio of data centers, including the seven data centers held-for-sale and 18 data centers held as investments in unconsolidated joint ventures, and developable land, based on
Showing the first 8K of 151K characters. Open the full section
Item 7A. QUANTITATIVE AND QUALITATIVE DISCLOSURES ABOUT MARKET RISK
Our future income, cash flows and fair values relevant to financial instruments depend upon prevalent market interest rates. Market risk refers to the risk of loss from adverse changes in market prices and interest rates. We do not use derivatives for trading or speculative purposes and only enter into contracts with major financial institutions based on their credit ratings and other factors.
Analysis of Debt between Fixed and Variable Rate
We use interest rate swap agreements and fixed rate debt to reduce our exposure to interest rate movements. As of December 31, 2017, our consolidated debt was as follows (in millions):
| Carrying Value | Estimated Fair Value | ||||||
| Fixed rate debt | $ | 6,479.3 | $ | 6,829.0 | |||
| Variable rate debt subject to interest rate swaps | 1,018.3 | 1,018.3 | |||||
| Total fixed rate debt (including interest rate swaps) | 7,497.6 | 7,847.3 | |||||
| Variable rate debt | 1,219.1 | 1,219.1 | |||||
| Total outstanding debt | $ | 8,716.7 | $ | 9,066.4 |
Interest rate derivatives and their fair values as of December 31, 2017 and December 31, 2016 were as follows (in thousands):
| Notional Amount | Fair Value at Significant Other Observable Inputs (Level 2) | ||||||||||||||||||||||
| As of December 31, 2017 | As of December 31, 2016 | Type of Derivative | Strike Rate | Effective Date | Expiration Date | As of December 31, 2017 | As of December 31, 2016 | ||||||||||||||||
| Currently-paying contracts | |||||||||||||||||||||||
| $ | 206,000 | (1) | $ | — | Swap | 1.611 | Jun 15, 2017 | Jan 15, 2020 | $ | 1,409 | $ | — | |||||||||||
| 54,905 | (1) | — | Swap | 1.605 | Jun 6, 2017 | Jan 6, 2020 | 374 | — | |||||||||||||||
| — | 206,000 | (1) | Swap | 0.932 | Jun 18, 2012 | Apr 18, 2017 | — | (90 | ) | ||||||||||||||
| — | 54,905 | (1) | Swap | 0.670 | Aug 6, 2012 | Apr 6, 2017 | — | 16 | |||||||||||||||
| 75,000 | (1) | 75,000 | (1) | Swap | 1.016 | Apr 6, 2016 | Jan 6, 2021 | 2,260 | 1,911 | ||||||||||||||
| 75,000 | (1) | 75,000 | (1) | Swap | 1.164 | Jan 15, 2016 | Jan 15, 2021 | 1,947 | 1,487 | ||||||||||||||
| 300,000 | (2) | 300,000 | (2) | Swap | 1.435 | Jan 15, 2016 | Jan 15, 2023 | 9,978 | 8,128 | ||||||||||||||
| — | 130,850 | (3) | Swap | 0.925 | Jul 17, 2012 | Apr 18, 2017 | — | 18 | |||||||||||||||
| 229,012 | (4) | 209,132 | (4) | Swap | 0.792 | Jan 15, 2016 | Jan 15, 2019 | (430 | ) | (1,818 | ) | ||||||||||||
| 78,357 | (5) | 73,294 | (5) | Swap | 0.779 | Jan 15, 2016 | Jan 15, 2021 | 3,034 | 1,556 | ||||||||||||||
| $ | 1,018,274 | $ | 1,124,181 | $ | 18,572 | $ | 11,208 |
| (1) | Represents portions of the U.S. dollar tranche of the 5-Year Term Loan. |
| (2) | Represents the U.S. dollar tranche of the 7-Year Term Loan. |
| (3) | Represents a portion of the Singapore dollar tranche of the 5-Year Term Loan. Translation to U.S. dollars is based on exchange rate of $0.69 to 1.00 SGD as of December 31, 2016. |
| (4) | Represents the British pound sterling tranche of the 5-Year Term Loan. Translation to U.S. dollars is based on exchange rates of $1.35 to £1.00 as of December 31, 2017 and $1.23 to £1.00 as of December 31, 2016. |
| (5) | Represents the Canadian dollar tranche of the 5-Year Term Loan. Translation to U.S. dollars is based on exchange rates of $0.80 to 1.00 CAD as of December 31, 2017 and $0.74 to 1.00 CAD as of December 31, 2016. |
Sensitivity to Changes in Interest Rates
The following table shows the effects if assumed changes in interest rates occurred, based on fair values and interest expense as of December 31, 2017:
| Assumed event | Change ($ millions) | |||
| Increase in fair value of interest rate swaps following an assumed 10% increase in interest rates | $ | 4.7 | ||
| Decrease in fair value of interest rate swaps following an assumed 10% decrease in interest rates | (4.7 | ) | ||
| Increase in annual interest expense on our debt that is variable rate and not subject to swapped interest following a 10% increase in interest rates | 2.1 | |||
| Decrease in annual interest expense on our debt that is variable rate and not subject to swapped interest following a 10% decrease in interest rates | (2.1 | ) | ||
| Increase in fair value of fixed rate debt following a 10% decrease in interest rates | 66.6 | |||
| Decrease in fair value of fixed rate debt following a 10% increase in interest rates | (61.6 | ) |
Interest risk amounts were determined by considering the impact of hypothetical interest rates on our financial instruments. These analyses do not consider the effect of any change in overall economic activity that could occur in that environment. Further, in the event of a change of that magnitude, we may take actions to further mitigate our exposure to the change. However, due to the uncertainty of the specific actions that would be taken and their possible effects, these analyses assume no changes in our financial structure.
Foreign Currency Exchange Risk
For the years ended December 31, 2017, 2016 and 2015, we had foreign operations in the United Kingdom, Ireland, France, Netherlands, Switzerland, Canada, Singapore, Australia, Japan and Hong Kong. In 2017, we commenced operations in Tokyo and in 2016, we commenced operations in Germany. As such, we are subject to risk from the effects of exchange rate movements of foreign currencies, which may affect future costs and cash flows. Our foreign operations are conducted in the British pound sterling, Euro, Australian dollar, Singapore dollar, Canadian dollar, Hong Kong dollar and the Japanese yen. Our primary currency exposures are to the British pound sterling, Euro and the Singapore dollar. We attempt to mitigate a portion of the risk of currency fluctuation by financing our investments in the local currency denominations and we may also hedge well-defined transactional exposures with foreign currency forwards or options, although there can be no assurances that these will be effective. As a result, changes in the relation of any such foreign currency to U.S. dollars may affect our revenues, operating margins and distributions and may also affect the book value of our assets and the amount of stockholders’ equity. For the years ended December 31, 2017, 2016 and 2015, operating revenues from properties outside the United States contributed $515.2 million, $442.9 million and $392.4 million, respectively, which represented 20.9%, 21.0% and 22.3% of our operating revenues, respectively. Net investment in properties outside the United States was $3.1 billion and $2.6 billion as of December 31, 2017 and December 31, 2016, respectively. Net assets in foreign operations were approximately $0.3 billion and $0.9 billion as of December 31, 2017 and December 31, 2016, respectively.
Other
Certain operating costs incurred by us, such as electricity, are subject to price fluctuations caused by the volatility of underlying commodity prices. In 2017, we entered into power purchase agreements to secure the renewable energy attributes from a wind farm in Illinois and a solar farm in North Carolina. In 2016, we entered into a power purchase agreement to secure the renewable energy attributes from a wind farm in Texas.
Item 8. FINANCIAL STATEMENTS AND SUPPLEMENTARY DATA
INDEX TO THE CONSOLIDATED FINANCIAL STATEMENTS
Management’s Report on Internal Control over Financial Reporting
The management of Digital Realty Trust, Inc. (the Company) is responsible for establishing and maintaining adequate internal control over financial reporting, as such term is defined in Exchange Act Rules 13a-15(f) and 15(d)-15(f). Our internal control system was designed to provide reasonable assurance to the Company’s management and board of directors regarding the preparation and fair presentation of published financial statements.
All internal control systems, no matter how well designed, have inherent limitations. Therefore, even those systems determined to be effective can provide only reasonable assurance with respect to financial statement preparation and presentation.
Under the supervision and with the participation of management, including our Chief Executive Officer and Chief Financial Officer, we assessed the effectiveness of the Company’s internal control over financial reporting as of December 31, 2017. In making this assessment, we used the criteria set forth by the Committee of Sponsoring Organizations of the Treadway Commission in Internal Control—Integrated Framework (2013). We acquired DuPont Fabros Technology, Inc. and subsidiaries during the year ended December 31, 2017. We have excluded from our overall assessment of the Company's internal control over financial reporting as of December 31, 2017, internal control over financial reporting associated with DuPont Fabros Technology, Inc. and subsidiaries' total assets of $8.4 billion and total revenues of $178 million. Based on our assessment, management concluded that as of December 31, 2017, the Company’s internal control over financial reporting was effective based on those criteria.
Our independent registered public accounting firm has issued an audit report on the Company’s internal control over financial reporting. This report appears on pages 89 and 90.
Management’s Report on Internal Control over Financial Reporting
The management of Digital Realty Trust, L.P. (the Operating Partnership) is responsible for establishing and maintaining adequate internal control over financial reporting, as such term is defined in Exchange Act Rules 13a-15(f) and 15(d)-15(f). Our internal control system was designed to provide reasonable assurance to the Operating Partnership’s management regarding the preparation and fair presentation of published financial statements.
All internal control systems, no matter how well designed, have inherent limitations. Therefore, even those systems determined to be effective can provide only reasonable assurance with respect to financial statement preparation and presentation.
Under the supervision and with the participation of management, including the Chief Executive Officer and Chief Financial Officer of our general partner, we assessed the effectiveness of the Operating Partnership’s internal control over financial reporting as of December 31, 2017. In making this assessment, we used the criteria set forth by the Committee of Sponsoring Organizations of the Treadway Commission in Internal Control—Integrated Framework (2013). We acquired DuPont Fabros Technology, Inc. and subsidiaries during the year ended December 31, 2017. We have excluded from our overall assessment of the Operating Partnership's internal control over financial reporting as of December 31, 2017, internal control over financial reporting associated with DuPont Fabros Technology, Inc. and subsidiaries' total assets of $8.4 billion and total revenues of $178 million. Based on our assessment, management concluded that as of December 31, 2017, the Operating Partnership’s internal control over financial reporting was effective based on those criteria.
Report of Independent Registered Public Accounting Firm
To the Stockholders and Board of Directors
Digital Realty Trust, Inc.:
Opinion on the Consolidated Financial Statements
We have audited the accompanying consolidated balance sheets of Digital Realty Trust, Inc. and subsidiaries (the Company) as of December 31, 2017 and 2016, the related consolidated income statements and consolidated statements of comprehensive income, equity, and cash flows for each of the years in the three‑year period ended December 31, 2017, and the related notes and financial statement schedule III, properties and accumulated depreciation (collectively, the consolidated financial statements). In our opinion, the consolidated financial statements present fairly, in all material respects, the financial position of the Company as of December 31, 2017 and 2016, and the results of its operations and its cash flows for each of the years in the three‑year
Showing the first 8K of 374K characters. Open the full section
Item 9. CHANGES IN AND DISAGREEMENTS WITH ACCOUNTANTS ON ACCOUNTING AND FINANCIAL DISCLOSURE
None.
Item 9A. CONTROLS AND PROCEDURES
Our Management’s Reports on Internal Control over Financial Reporting for Digital Realty Trust, Inc. and Digital Realty Trust, L.P. are included in Part II, Item 8, Financial Statements and Supplementary Data on pages 86 and 87.
Evaluation of Disclosure Controls and Procedures (Digital Realty Trust, Inc.)
The Company maintains disclosure controls and procedures that are designed to ensure that information required to be disclosed in its reports filed under the Securities Exchange Act of 1934, as amended, is recorded, processed, summarized and reported within the time periods specified in the U.S. Securities and Exchange Commission’s rules and forms, and that such information is accumulated and communicated to its management, including its chief executive officer and chief financial officer, as appropriate, to allow timely decisions regarding required disclosure. In designing and evaluating the disclosure controls and procedures, the Company’s management recognizes that any controls and procedures, no matter how well designed and operated, can provide only reasonable assurance of achieving the desired control objectives, and its management is required to apply its judgment in evaluating the cost-benefit relationship of possible controls and procedures. Also, the Company has investments in certain unconsolidated entities, which are accounted for using the equity method of accounting. As the Company does not control or manage these entities, its disclosure controls and procedures with respect to such entities may be substantially more limited than those it maintains with respect to its consolidated subsidiaries.
As required by Rule 13a-15(b) or Rule 15d-15(b) of the Securities Exchange Act of 1934, as amended, management of the Company carried out an evaluation, under the supervision and with participation of its chief executive officer and chief financial officer, of the effectiveness of the design and operation of its disclosure controls and procedures that were in effect as of December 31, 2017. Based on the foregoing, the Company’s management concluded that its disclosure controls and procedures were effective at the reasonable assurance level.
Changes in Internal Control over Financial Reporting
During the second quarter of 2016, we completed an upgrade of our general ledger system. This system was used to produce information contained in this Annual Report on Form 10-K. There have been no other changes in our internal control over financial reporting (as such term is defined in Rules 13a-15(f) and 15d-15(f) under the Exchange Act) during the year ended December 31, 2017 that have materially affected, or are reasonably likely to materially affect, our internal control over financial reporting.
Evaluation of Disclosure Controls and Procedures (Digital Realty Trust, L.P.)
The Operating Partnership maintains disclosure controls and procedures that are designed to ensure that information required to be disclosed in its reports filed under the Securities Exchange Act of 1934, as amended, is recorded, processed, summarized and reported within the time periods specified in the U.S. Securities and Exchange Commission’s rules and forms, and that such information is accumulated and communicated to its management, including the chief executive officer and chief financial officer of its general partner, as appropriate, to allow timely decisions regarding required disclosure. In designing and evaluating the disclosure controls and procedures, the Operating Partnership’s management recognizes that any controls and procedures, no matter how well designed and operated, can provide only reasonable assurance of achieving the desired control objectives, and its management is required to apply its judgment in evaluating the cost-benefit relationship of possible controls and procedures. Also, the Operating Partnership has investments in certain unconsolidated entities, which are accounted for using the equity method of accounting. As the Operating Partnership does not control or manage these entities, its disclosure controls and procedures with respect to such entities may be substantially more limited than those it maintains with respect to its consolidated subsidiaries.
As required by Rule 13a-15(b) or Rule 15d-15(b) of the Securities Exchange Act of 1934, as amended, management of the Operating Partnership carried out an evaluation, under the supervision and with participation of the chief executive officer and chief financial officer of its general partner, of the effectiveness of the design and operation of its disclosure controls and procedures that were in effect as of December 31, 2017. Based on the foregoing, the Operating Partnership’s management concluded that its disclosure controls and procedures were effective at the reasonable assurance level.
Changes in Internal Control over Financial Reporting
During the second quarter of 2016, we completed an upgrade of our general ledger system. This system was used to produce information contained in this Annual Report on Form 10-K. There have been no other changes in our internal control over financial reporting (as such term is defined in Rules 13a-15(f) and 15d-15(f) under the Exchange Act) during the year ended December 31, 2017 that have materially affected, or are reasonably likely to materially affect, our internal control over financial reporting.
Item 9B. OTHER INFORMATION
Item 10. DIRECTORS, EXECUTIVE OFFICERS AND CORPORATE GOVERNANCE
The information concerning our directors, executive officers and corporate governance required by Item 10 will be included in the Proxy Statement to be filed relating to our 2018 Annual Meeting of Stockholders and is incorporated herein by reference.
We have filed, as exhibits to this Annual Report on Form 10-K, the certifications of our Chief Executive Officer and Chief Financial Officer required under Section 302 of the Sarbanes Oxley Act to be filed with the Securities and Exchange Commission regarding the quality of our public disclosure. We have furnished to the Securities and Exchange Commission as exhibits to this Annual Report on Form 10-K for the year ended December 31, 2017, the certifications of our Chief Executive Officer and Chief Financial Officer required under Section 906 of the Sarbanes Oxley Act. In addition, as required by Section 303A.12 of the NYSE Listed Company Manual, our Chief Executive Officer made his annual certification to the NYSE stating that he was not aware of any violation by the Company of the corporate governance listing standards of the NYSE.
Item 11. EXECUTIVE COMPENSATION
The information concerning our executive compensation required by Item 11 will be included in the Proxy Statement to be filed relating to our 2018 Annual Meeting of Stockholders and is incorporated herein by reference.
Item 12. SECURITY OWNERSHIP OF CERTAIN BENEFICIAL OWNERS AND MANAGEMENT AND RELATED STOCKHOLDER MATTERS
The information concerning the security ownership of certain beneficial owners and management and related stockholder matters (including equity compensation plan information) required by Item 12 will be included in the Proxy Statement to be filed relating to our 2018 Annual Meeting of Stockholders and is incorporated herein by reference.
Item 13. CERTAIN RELATIONSHIPS AND RELATED TRANSACTIONS AND DIRECTOR INDEPENDENCE
The information concerning certain relationships, related transactions and director independence required by Item 13 will be included in the Proxy Statement to be filed relating to our 2018 Annual Meeting of Stockholders and is incorporated herein by reference.
Item 14. PRINCIPAL ACCOUNTING FEES AND SERVICES
The information concerning our principal accounting fees and services required by Item 14 will be included in the Proxy Statement to be filed relating to our 2018 Annual Meeting of Stockholders and is incorporated herein by reference.
PART IV
Item 15. EXHIBITS.
| 31.1 | Rule 13a-14(a)/15d-14(a) Certifications of Chief Executive Officer for Digital Realty Trust, Inc. | |
| 31.2 | Rule 13a-14(a)/15d-14(a) Certifications of Chief Financial Officer for Digital Realty Trust, Inc. | |
| 31.3 | Rule 13a-14(a)/15d-14(a) Certifications of Chief Executive Officer for Digital Realty Trust, L.P. | |
| 31.4 | Rule 13a-14(a)/15d-14(a) Certifications of Chief Financial Officer for Digital Realty Trust, L.P. | |
| 32.1 | 18 U.S.C. § 1350 Certifications of Chief Executive Officer for Digital Realty Trust, Inc. | |
| 32.2 | 18 U.S.C. § 1350 Certifications of Chief Financial Officer for Digital Realty Trust, Inc. | |
| 32.3 | 18 U.S.C. § 1350 Certifications of Chief Executive Officer for Digital Realty Trust, L.P. | |
| 32.4 | 18 U.S.C. § 1350 Certifications of Chief Financial Officer for Digital Realty Trust, L.P. | |
| 101 | The following financial statements from Digital Realty Trust, Inc.’s and Digital Realty Trust, L.P.’s Form 10-K for the year ended December 31, 2017, formatted in XBRL interactive data files: (i) Consolidated Balance Sheets as of December 31, 2017 and December 31, 2016; (ii) Consolidated Income Statements for each of the years in the three-year period ended December 31, 2017; (iii) Consolidated Statements of Equity and Comprehensive Income/Statements of Capital and Comprehensive Income for each of the years in the three-year period ended December 31, 2017; (iv) Consolidated Statements of Cash Flows for each of the years in the three-year period ended December 31, 2017; and (v) Notes to Consolidated Financial Statements. |
| † | Management contract or compensatory plan or arrangement. |
| * | Portions of this exhibit have been omitted pursuant to a grant of confidential treatment and have been filed separately with the Securities and Exchange Commission. |
Item 16. FORM 10-K SUMMARY
None.
SIGNATURES
Pursuant to the requirements of Section 13 or 15(d) of the Securities Exchange Act of 1934, the registrant has duly caused this report to be signed on its behalf by the undersigned, thereunto duly authorized.
| DIGITAL REALTY TRUST, INC. | ||
| By: | /s/ A. WILLIAM STEIN | |
| A. William Stein Chief Executive Officer | ||
| Date: February 28, 2018 |
POWER OF ATTORNEY
KNOW ALL PERSONS BY THESE PRESENTS, that each person whose signature appears below constitutes and appoints A. William Stein, Andrew P. Power and Joshua A. Mills, and each of them, with full power to act without the other, such person’s true and lawful attorneys-in-fact and agents, with full power of substitution and resubstitution, for him or her and in his or her name, place and stead, in any and all capacities, to sign this Form 10-K and any and all amendments thereto, and to file the same, with exhibits and schedules thereto, and other documents in connection therewith, with the Securities and Exchange Commission, granting unto said attorneys-in-fact and agents, and each of them, full power and authority to do and perform each and every act and thing necessary or desirable to be done in and about the premises, as fully to all intents and purposes as he or she might or could do in person, hereby ratifying and confirming all that said attorneys-in-fact and agents, or any of them, or their or his or her substitute or substitutes, may lawfully do or cause to be done by virtue hereof.
Pursuant to the requirements of the Securities Exchange Act of 1934, this report has been signed below by the following persons on behalf of the registrant and in the capacities and on the dates indicated.
| Signature | Title | Date | ||
| /S/ LAURENCE A. CHAPMAN | Chairman of the Board | February 28, 2018 | ||
| Laurence A. Chapman | ||||
| /S/ A. WILLIAM STEIN | Chief Executive Officer and Director (Principal Executive Officer) | February 28, 2018 | ||
| A. William Stein | ||||
| /S/ ANDREW P. POWER | Chief Financial Officer (Principal Financial Officer) | February 28, 2018 | ||
| Andrew P. Power | ||||
| /S/ EDWARD F. SHAM | Chief Accounting Officer (Principal Accounting Officer) | February 28, 2018 | ||
| Edward F. Sham | ||||
| /S/ MICHAEL A. COKE | Director | February 28, 2018 | ||
| Michael A. Coke | ||||
| Signature | Title | Date | ||
| /S/ KEVIN J. KENNEDY | Director | February 28, 2018 | ||
| Kevin J. Kennedy | ||||
| /S/ WILLIAM G. LAPERCH | Director | February 28, 2018 | ||
| William G. LaPerch | ||||
| /s/ AFSHIN MOHEBBI | Director | February 28, 2018 | ||
| Afshin Mohebbi | ||||
| /s/ MARK R. PATTERSON | Director | February 28, 2018 | ||
| Mark R. Patterson | ||||
| /s/ MARY HOGAN PREUSSE | Director | February 28, 2018 | ||
| Mary Hogan Preusse | ||||
| /s/ JOHN T. ROBERTS, JR. | Director | February 28, 2018 | ||
| John T. Roberts, Jr. | ||||
| /s/ DENNIS E. SINGLETON | Director | February 28, 2018 | ||
| Dennis E. Singleton | ||||
| /S/ ROBERT H. ZERBST | Director | February 28, 2018 | ||
| Robert H. Zerbst |
SIGNATURES
Pursuant to the requirements of Section 13 or 15(d) of the Securities Exchange Act of 1934, the registrant has duly caused this report to be signed on its behalf by the undersigned, thereunto duly authorized.
| DIGITAL REALTY TRUST, L.P. | ||
| By: | Digital Realty Trust, Inc., Its General Partner | |
| By: | /s/ A. WILLIAM STEIN | |
| A. William Stein Chief Executive Officer | ||
| Date: February 28, 2018 |
POWER OF ATTORNEY
KNOW ALL PERSONS BY THESE PRESENTS, that each person whose signature appears below constitutes and appoints A. William Stein, Andrew P. Power and Joshua A. Mills, and each of them, with full power to act without the other, such person’s true and lawful attorneys-in-fact and agents, with full power of substitution and resubstitution, for him or her and in his or her name, place and stead, in any and all capacities, to sign this Form 10-K and any and all amendments thereto, and to file the same, with exhibits and schedules thereto, and other documents in connection therewith, with the Securities and Exchange Commission, granting unto said attorneys-in-fact and agents, and each of them, full power and authority to do and perform each and every act and thing necessary or desirable to be done in and about the premises, as fully to all intents and purposes as he or she might or could do in person, hereby ratifying and confirming all that said attorneys-in-fact and agents, or any of them, or their or his or her substitute or substitutes, may lawfully do or cause to be done by virtue hereof.
Pursuant to the requirements of the Securities Exchange Act of 1934, this report has been signed below by the following persons on behalf of the registrant and in the capacities and on the dates indicated.
| Signature | Title | Date | ||
| /S/ LAURENCE A. CHAPMAN | Chairman of the Board | February 28, 2018 | ||
| Laurence A. Chapman | ||||
| /S/ A. WILLIAM STEIN | Chief Executive Officer and Director (Principal Executive Officer) | February 28, 2018 | ||
| A. William Stein | ||||
| /S/ ANDREW P. POWER | Chief Financial Officer (Principal Financial Officer) | February 28, 2018 | ||
| Andrew P. Power | ||||
| /S/ EDWARD F. SHAM | Chief Accounting Officer (Principal Accounting Officer) | February 28, 2018 | ||
| Edward F. Sham |
| Signature | Title | Date | ||
| /S/ MICHAEL A. COKE | Director | February 28, 2018 | ||
| Michael A. Coke | ||||
| /S/ KEVIN J. KENNEDY | Director | February 28, 2018 | ||
| Kevin J. Kennedy | ||||
| /S/ WILLIAM G. LAPERCH | Director | February 28, 2018 | ||
| William G. LaPerch | ||||
| /s/ AFSHIN MOHEBBI | Director | February 28, 2018 | ||
| Afshin Mohebbi | ||||
| /s/ MARK R. PATTERSON | Director | February 28, 2018 | ||
| Mark R. Patterson | ||||
| /s/ MARY HOGAN PREUSSE | Director | February 28, 2018 | ||
| Mary Hogan Preusse | ||||
| /s/ JOHN T. ROBERTS, JR. | Director | February 28, 2018 | ||
| John T. Roberts, Jr. | ||||
| /s/ DENNIS E. SINGLETON | Director | February 28, 2018 | ||
| Dennis E. Singleton | ||||
| /S/ ROBERT H. ZERBST | Director | February 28, 2018 | ||
| Robert H. Zerbst |