 filings.tools
Digital Realty Trust 10-K 2020-12-31
Filed 2021-03-01. 22 sections, 883K characters. Original on sec.gov · Markdown · JSON
Cover and table of contents
UNITED STATES
SECURITIES AND EXCHANGE COMMISSION
WASHINGTON, D.C. 20549
FORM 10-K
| | |
|---|---|
| ☒ | Annual Report Pursuant to Section 13 or 15(d) of the Securities Exchange Act of 1934 |
| | For the fiscal year ended December 31, 2020 |
| ☐ | Transition Report Pursuant to Section 13 or 15(d) of the Securities Exchange Act of 1934 |
| | For the Transition Period From to . |
| | | |
|---|---|---|
| | | |
| Commission file number | 001-32336 (Digital Realty Trust, Inc.) | |
| | | 000-54023 (Digital Realty Trust, L.P.) |
DIGITAL REALTY TRUST, INC.
DIGITAL REALTY TRUST, L.P.
(Exact name of registrant as specified in its charter)
| | |
|---|---|
| | |
| Maryland (Digital Realty Trust, Inc.) Maryland (Digital Realty Trust, L.P.) | 26-0081711 20-2402955 |
| (State or other jurisdiction of incorporation or organization) | (IRS employer identification number) |
| 5707 Southwest Parkway, Building 1, Suite 275 Austin**,** Texas | 78735 |
| (Address of principal executive offices) | (Zip Code) |
(737) 281-0101
(Registrant’s telephone number, including area code)
Securities registered pursuant to Section 12(b) of the Act:
| | | | | | | | |
|---|---|---|---|---|---|---|---|
| | Title of each class | | | Trading Symbols(s) | Name of each exchange on which registered | ||
| Digital Realty Trust, Inc. | | Common Stock, $0.01 par value per share | | | DLR | | New York Stock Exchange |
| | | Series C Cumulative Redeemable Perpetual Preferred Stock, $0.01 par value per share | | | DLR Pr C | | New York Stock Exchange |
| | | Series J Cumulative Redeemable Preferred Stock, $0.01 par value per share | | | DLR Pr J | | New York Stock Exchange |
| | | Series K Cumulative Redeemable Preferred Stock, $0.01 par value per share | | | DLR Pr K | | New York Stock Exchange |
| | | Series L Cumulative Redeemable Preferred Stock, $0.01 par value per share | | | DLR Pr L | | New York Stock Exchange |
| Digital Realty Trust, L.P. | | None | | | None | | None |
Securities registered pursuant to Section 12(g) of the Act:
| | |
|---|---|
| Digital Realty Trust, Inc. | None |
| Digital Realty Trust, L.P. | Common Units of Partnership Interest |
Indicate by check mark if the registrant is a well-known seasoned issuer, as defined in Rule 405 of the Securities Act.
| | |
|---|---|
| Digital Realty Trust, Inc. | Yes ⌧ No ◻ |
| Digital Realty Trust, L.P. | Yes ⌧ No ◻ |
Indicate by check mark if the registrant is not required to file reports pursuant to Section 13 or Section 15(d) of the Act.
| | |
|---|---|
| Digital Realty Trust, Inc. | Yes ◻ No ⌧ |
| Digital Realty Trust, L.P. | Yes ◻ No ⌧ |
Indicate by check mark whether the registrant (1) has filed all reports required to be filed by Section 13 or 15(d) of the Securities Exchange Act of 1934 during the preceding 12 months (or for such shorter period that the registrant was required to file such reports), and (2) has been subject to such filing requirements for the past 90 days.
| | |
|---|---|
| Digital Realty Trust, Inc. | Yes ⌧ No ◻ |
| Digital Realty Trust, L.P. | Yes ⌧ No ◻ |
Indicate by check mark whether the registrant has submitted electronically every Interactive Data File required to be submitted pursuant to Rule 405 of Regulation S-T (§232.405 of this chapter) during the preceding 12 months (or for such shorter period that the registrant was required to submit such files).
| | |
|---|---|
| Digital Realty Trust, Inc. | Yes ⌧ No ◻ |
| Digital Realty Trust, L.P. | Yes ⌧ No ◻ |
Indicate by check mark whether the registrant is a large accelerated filer, an accelerated filer, a non-accelerated filer, a smaller reporting company, or emerging growth company. See the definitions of “large accelerated filer,” “accelerated filer,” “smaller reporting company,” and “emerging growth company” in Rule 12b-2 of the Exchange Act.
Digital Realty Trust, Inc.:
| | | | |
|---|---|---|---|
| Large accelerated filer | ⌧ | Accelerated filer | ◻ |
| Non-accelerated filer | ◻ | Smaller reporting company | ☐ |
| | | Emerging growth company | ☐ |
Digital Realty Trust, L.P.:
| | | | |
|---|---|---|---|
| Large accelerated filer | ◻ | Accelerated filer | ◻ |
| Non-accelerated filer | ⌧ | Smaller reporting company | ☐ |
| | | Emerging growth company | ☐ |
If an emerging growth company, indicate by check mark if the registrant has elected not to use the extended transition period for complying with any new or revised financial accounting standards provided pursuant to Section 13(a) of the Exchange Act.
| | |
|---|---|
| Digital Realty Trust, Inc. | ☐ |
| Digital Realty Trust, L.P. | ☐ |
Indicate by check mark whether the registrant has filed a report on and attestation to its management’s assessment of the effectiveness of its internal control over financial reporting under Section 404(b) of the Sarbanes-Oxley Act (15 U.S.C. 7262(b)) by the registered public accounting firm that prepared or issued its audit report.
| Digital Realty Trust, Inc. | ☒ |
| Digital Realty Trust, L.P. | ☐ |
Indicate by check mark whether the registrant is a shell company (as defined in Rule 12b-2 of the Act).
| | |
|---|---|
| Digital Realty Trust, Inc. | Yes ☐ No ⌧ |
| Digital Realty Trust, L.P. | Yes ☐ No ⌧ |
The aggregate market value of the common equity held by non-affiliates of Digital Realty Trust, Inc. as of June 30, 2020 totaled approximately $38 billion based on the closing price for Digital Realty Trust, Inc.’s common stock on that day as reported by the New York Stock Exchange. Such value excludes common stock held by executive officers, directors and 10% or greater stockholders as of June 30, 2020. The identification of 10% or greater stockholders as of June 30, 2020 is based on Schedule 13G and amended Schedule 13G reports publicly filed before June 30, 2020. This calculation does not reflect a determination that such parties are affiliates for any other purposes.
There is no public trading market for the common units of Digital Realty Trust, L.P. As a result, the aggregate market value of the common units held by non-affiliates of Digital Realty Trust, L.P. cannot be determined.
Indicate the number of shares outstanding of each of the registrant’s classes of common stock, as of the latest practicable date.
Digital Realty Trust, Inc.:
| | | | |
|---|---|---|---|
| Class | Outstanding at February 22, 2021 | ||
| Common Stock, $.01 par value per share | | 281,121,062 | |
DOCUMENTS INCORPORATED BY REFERENCE
Part III incorporates by reference portions of Digital Realty Trust, Inc.’s Proxy Statement for its 2021 Annual Meeting of Stockholders which the registrants anticipate will be filed no later than 120 days after the end of its fiscal year pursuant to Regulation 14A.
EXPLANATORY NOTE
This report combines the annual reports on Form 10-K for the year ended December 31, 2020 of Digital Realty Trust, Inc., a Maryland corporation, and Digital Realty Trust, L.P., a Maryland limited partnership, of which Digital Realty Trust, Inc. is the sole general partner. Unless otherwise indicated or unless the context requires otherwise, all references in this report to “we,” “us,” “our,” “our Company” or “the Company” refer to Digital Realty Trust, Inc. together with its consolidated subsidiaries, including Digital Realty Trust, L.P. In statements regarding qualification as a REIT, such terms refer solely to Digital Realty Trust, Inc. Unless otherwise indicated or unless the context requires otherwise, all references to “our Operating Partnership” or “the Operating Partnership” refer to Digital Realty Trust, L.P. together with its consolidated subsidiaries.
Digital Realty Trust, Inc. is a real estate investment trust, or REIT, and the sole general partner of Digital Realty Trust, L.P. As of December 31, 2020, Digital Realty Trust, Inc. owned an approximate 97.2% common general partnership interest in Digital Realty Trust, L.P. The remaining approximate 2.8% of the common limited partnership interests of Digital Realty Trust, L.P. are owned by non-affiliated third parties and certain directors and officers of Digital Realty Trust, Inc. As of December 31, 2020, Digital Realty Trust, Inc. owned all of the preferred limited partnership interests of Digital Realty Trust, L.P. As the sole general partner of Digital Realty Trust, L.P., Digital Realty Trust, Inc. has the full, exclusive and complete responsibility for the Operating Partnership’s day-to-day management and control.
We believe combining the annual reports on Form 10-K of Digital Realty Trust, Inc. and Digital Realty Trust, L.P. into this single report results in the following benefits:
| ● | enhancing investors’ understanding of our Company and our Operating Partnership by enabling investors to view the business as a whole in the same manner as management views and operates the business; |
|---|
| ● | eliminating duplicative disclosure and providing a more streamlined and readable presentation since a substantial portion of the disclosure applies to both our Company and our Operating Partnership; and |
|---|
| ● | creating time and cost efficiencies through the preparation of one combined report instead of two separate reports. |
|---|
There are a few differences between our Company and our Operating Partnership, which are reflected in the disclosure in this report. We believe it is important to understand the differences between our Company and our Operating Partnership in the context of how we operate as an interrelated consolidated company. Digital Realty Trust, Inc. is a REIT, whose only material asset is its ownership of partnership interests of Digital Realty Trust, L.P. As a result, Digital Realty Trust, Inc. does not conduct business itself, other than acting as the sole general partner of Digital Realty Trust, L.P., issuing public equity from time to time and guaranteeing certain unsecured debt of Digital Realty Trust, L.P. and certain of its subsidiaries. Digital Realty Trust, Inc. itself does not issue any indebtedness but guarantees the unsecured debt of Digital Realty Trust, L.P. and certain of its subsidiaries and affiliates, as disclosed in this report. Digital Realty Trust, L.P. holds substantially all the assets of the Company and holds the ownership interests in the Company’s joint ventures. Digital Realty Trust, L.P. conducts the operations of the business and is structured as a partnership with no publicly traded equity. Except for net proceeds from public equity issuances by Digital Realty Trust, Inc., which are generally contributed to Digital Realty Trust, L.P. in exchange for partnership units, Digital Realty Trust, L.P. generates the capital required by the Company’s business through Digital Realty Trust, L.P.’s operations, by Digital Realty Trust, L.P.’s direct or indirect incurrence of indebtedness or through the issuance of partnership units.
The presentation of noncontrolling interests in operating partnership, stockholders’ equity and partners’ capital are the main areas of difference between the consolidated financial statements of Digital Realty Trust, Inc. and those of Digital Realty Trust, L.P. The common limited partnership interests held by the limited partners in Digital Realty Trust, L.P. are presented as limited partners’ capital within partners’ capital in Digital Realty Trust, L.P.’s consolidated financial statements and as noncontrolling interests in operating partnership within equity in Digital Realty Trust, Inc.’s consolidated financial statements. The common and preferred partnership interests held by Digital Realty Trust, Inc. in Digital Realty Trust, L.P. are presented as general partner’s capital within partners’ capital in Digital Realty Trust, L.P.’s consolidated financial statements and as preferred stock, common stock, additional paid-in capital and accumulated dividends in excess of earnings within stockholders’ equity in Digital Realty Trust, Inc.’s consolidated financial
statements. The differences in the presentations between stockholders’ equity and partners’ capital result from the differences in the equity issued at the Digital Realty Trust, Inc. and the Digital Realty Trust, L.P. levels.
To help investors understand the significant differences between the Company and the Operating Partnership, this report presents the following separate sections for each of the Company and the Operating Partnership:
| ● | consolidated financial statements; |
|---|
| ● | the following notes to the consolidated financial statements: |
|---|
| ● | "Debt of the Company" and "Debt of the Operating Partnership"; |
|---|
| ● | "Income per Share" and "Income per Unit"; |
|---|
| ● | "Equity and Accumulated Other Comprehensive Loss, Net of the Company" and "Capital and Accumulated Other Comprehensive Loss of the Operating Partnership"; and |
|---|
| ● | "Quarterly Financial Information"; |
|---|
| ● | Liquidity and Capital Resources in Management’s Discussion and Analysis of Financial Condition and Results of Operations; |
|---|
| ● | Market for Registrant’s Common Equity, Related Stockholder Matters and Issuer Purchases of Equity Securities; and |
|---|
| ● | Selected Financial Data. |
|---|
This report also includes separate Item 9A. Controls and Procedures sections and separate Exhibit 31 and 32 certifications for each of the Company and the Operating Partnership in order to establish that the Chief Executive Officer and Chief Financial Officer of each entity has made the requisite certifications and that the Company and the Operating Partnership are compliant with Rule 13a-15 or Rule 15d-15 of the Securities Exchange Act of 1934 and 18 U.S.C. §1350.
In order to highlight the differences between the Company and the Operating Partnership, the separate sections in this report for the Company and the Operating Partnership specifically refer to the Company and the Operating Partnership. In the sections that combine disclosure of the Company and the Operating Partnership, this report refers to actions or holdings as being actions or holdings of the Company. Although the Operating Partnership is generally the entity that enters into contracts and joint ventures and holds assets and debt, reference to the Company is appropriate because the business is one enterprise and the Company operates the business through the Operating Partnership.
As general partner with control of the Operating Partnership, Digital Realty Trust, Inc. consolidates the Operating Partnership for financial reporting purposes, and it does not have significant assets other than its investment in the Operating Partnership. Therefore, the assets and liabilities of Digital Realty Trust, Inc. and Digital Realty Trust, L.P. are the same on their respective consolidated financial statements. The separate discussions of Digital Realty Trust, Inc. and Digital Realty Trust, L.P. in this report should be read in conjunction with each other to understand the results of the Company on a consolidated basis and how management operates the Company.
In this report, “properties” and “buildings” refer to all or any of the buildings in our portfolio, including data centers and non-data centers, and “data centers” refers only to the properties or buildings in our portfolio that contain data center space. In this report, “global revolving credit facility” refers to our Operating Partnership’s $2.35 billion senior unsecured revolving credit facility and global senior credit agreement; “term loan facility” or “unsecured term loans” refers to our Operating Partnership’s senior unsecured multi-currency term loan facility and term loan agreement, which governs a $300 million five-year senior unsecured term loan and a $512 million five-year senior unsecured term loan; “Yen revolving credit facility” refers to our Operating Partnership’s ¥33,285,000,000 (approximately $322 million based on exchange rates at December 31, 2020) senior unsecured revolving credit facility and Yen credit agreement; and “revolving credit facilities” or “global revolving credit facilities” refer to our global revolving credit facility and our Yen revolving credit facility, collectively.
DIGITAL REALTY TRUST, INC. AND DIGITAL REALTY TRUST, L.P.
FORM 10-K
FOR THE YEAR ENDED DECEMBER 31, 2020
TABLE OF CONTENTS
PART I
Item 1. BUSINESS
The Company
Digital Realty Trust, Inc., through its controlling interest in Digital Realty Trust, L.P. (the Operating Partnership) and the subsidiaries of the Operating Partnership, (collectively, we, our, us or the Company) is a leading global provider of data center, colocation and interconnection solutions for customers across a variety of industry verticals ranging from cloud and information technology services, communications and social networking to financial services, manufacturing, energy, healthcare, and consumer products. Digital Realty Trust, L.P., a Maryland limited partnership, is the entity through which Digital Realty Trust, Inc., a Maryland corporation, conducts its business of owning, acquiring, developing and operating data centers. Digital Realty Trust, Inc. operates as a REIT for federal income tax purposes.
As of December 31, 2020, our portfolio consisted of 291 data centers (including 43 data centers held as investments in unconsolidated joint ventures), of which 139 are located in the United States, 107 are located in Europe, 22 are located in Latin America, 12 are located in Asia, six are located in Australia, three are located in Africa and two are located in Canada.
Digital Realty Trust, Inc. was incorporated in the state of Maryland on March 9, 2004. Digital Realty Trust, L.P. was organized in the state of Maryland on July 21, 2004. Our principal executive offices are located at 5707 Southwest Parkway, Building 1, Suite 275, Austin, Texas 78735. Our telephone number is (737) 281-0101. Our website is www.digitalrealty.com. The information found on, or otherwise accessible through, our website is not incorporated by reference into, nor does it form a part of, this Annual Report on Form 10-K.
Recent Acquisitions
On October 29, 2019, Digital Realty Trust, Inc., Digital Intrepid Holding B.V., an indirect subsidiary of Digital Realty Trust, Inc., and Interxion Holding N.V., which we refer to as Interxion, entered into a purchase agreement, or the Purchase Agreement, pursuant to which, subject to the terms and conditions of the Purchase Agreement, the Buyer commenced an exchange offer to purchase all of the outstanding ordinary shares of Interxion in exchange for shares of common stock of Digital Realty Trust, Inc.. We refer to the transactions contemplated by the Purchase Agreement as the Interxion Combination. We obtained control of Interxion on March 9, 2020 and completed the Interxion Combination on March 12, 2020 for total equity consideration of approximately $7.0 billion, including cash assumed. The Interxion Combination has expanded the combined company’s presence across Europe and Africa.
On November 1, 2019, we closed the joint venture with Mapletree Investments and Mapletree Industrial Trust, which we refer to collectively as Mapletree, on three existing Turn-Key Flex® data centers located in Ashburn, Virginia. The Company retained a 20% ownership interest in the joint venture, and Mapletree acquired the remaining 80% stake for approximately $0.8 billion. We will continue to operate and manage these facilities. The second tranche of the Mapletree transaction, the sale of 10 fully-leased Powered Base Building® properties for $557 million, closed in January 2020.
On December 20, 2018, the Operating Partnership and Stellar Participações S.A. (formerly Stellar Participações Ltda.), a Brazilian subsidiary of the Operating Partnership, completed the acquisition of Ascenty, a leading data center provider in Brazil, for cash and equity consideration of approximately $2.0 billion, including cash assumed. We refer to this transaction as the Ascenty Acquisition. In March 2019, we formed a joint venture with Brookfield Infrastructure, an affiliate of Brookfield Asset Management, one of the largest owners and operators of infrastructure assets globally. Brookfield invested approximately $702 million in exchange for approximately 49% of the total equity interests in the joint venture which owns and operates Ascenty. A subsidiary of the Operating Partnership retained the remaining equity interest in the Ascenty joint venture. As of March 27, 2019, we deconsolidated Ascenty and recorded our retained interest as an investment in unconsolidated joint ventures due to shared control with Brookfield.
On September 14, 2017, we completed the acquisition of DuPont Fabros Technology, Inc., or DFT, in an all-stock merger, which we refer to as the DFT Merger, for equity consideration of approximately $6.2 billion. We believe this transaction expanded our reach with a complementary portfolio in top U.S. metropolitan areas while enhancing our ability to meet the growing demand for hyper-scale and public cloud solutions and solidifying our blue-chip customer base.
Industry Background
The digital economy continues to grow and change how enterprises across all industries create and deliver value. Companies increasingly need to operate ubiquitously, on-demand and with real-time intelligence serving customers, partners and employees across multiple channels, business functions and points of business presence. Computational processing power requirements continue to advance, data traffic is growing, and the volume of data that enterprises generate, transmit, process, analyze, monitor and manage is expanding dramatically. The Internet of Things, 5G, autonomous vehicles and artificial intelligence, among other technological advancements, are driving this digital transformation.
Further, we believe that enterprise data growth is accelerating due to the growing digital economy and emerging technological advances. As enterprises analyze and process this accelerating data mass, they create more data. As this data mass builds and continues to be analyzed and processed, we believe it becomes increasingly challenging to replicate and relocate, a phenomenon called increasing data gravity. We believe that enterprise decision makers will need to increasingly consider the impact of how data gravity impacts their enterprise IT architectures and, accordingly, we have developed the Data Gravity Index™. The Data Gravity Index™ is a global forecast that measures the intensity and gravitational force of enterprise data growth.
As a global infrastructure provider for this growing digital economy, we believe the data center industry is poised for sustainable growth. The demand for data center infrastructure is being driven by this digital transformation which is contributing to the explosive growth of data, rapid growth of cloud adoption and greater demand for IT outsourcing. The power requirements and financial costs to support this growth in data, traffic and storage are substantial and growing accordingly. We believe that data centers will continue to play a critical role in the digital economy and enabling business transformation strategies.
We believe cloud solutions and, in particular, hybrid cloud solutions will remain significant drivers of demand for data center infrastructure. The hybrid cloud, which combines public and private cloud solutions, has gained traction because it enables corporate enterprises to achieve efficiencies and contain costs as well as scale and secure their most sensitive information. In addition, the leading cloud service providers are generally mature, well-capitalized technology companies, and cloud platforms are among their fastest growing business segments. Data center providers that can solve global coverage, capacity and communities of interest connectivity needs, and coordinate and aggregate diverse customer and application demand, are poised to benefit from these cloud-specific industry drivers.
These diverse and secular industry dynamics are driving greater demand for data center capacity not only from global cloud service providers, but also from businesses across other industries, including IT service firms, social media, content providers and the financial servic
Showing the first 8K of 61K characters. Open the full section
Item 1A. RISK FACTORS
For purposes of this section, the term “stockholders” means the holders of shares of Digital Realty Trust, Inc.’s common stock and preferred stock. Set forth below are the risks that we believe are material to Digital Realty Trust, Inc.’s stockholders and Digital Realty Trust, L.P.’s unitholders. You should carefully consider the following factors in evaluating our Company, our properties and our business. The occurrence of any of the following risks might cause Digital Realty Trust, Inc.’s stockholders and Digital Realty Trust, L.P.’s unitholders to lose all or a part of their investment. Some statements in this report, including statements in the following risk factors, constitute forward-looking statements. Please refer to the section entitled “Forward-Looking Statements” starting on page 46.
Overview
Our business, operations and financial results are subject to various risks and uncertainties, including those described below, that could adversely affect our business, financial condition, results of operations, cash flows, and the trading price of our common stock and preferred stock. The following material factors, among others, could cause our actual results to differ materially from historical results and those expressed in forward-looking statements made by us or on our behalf in filings with the SEC, press releases, communications with investors and oral statements. The risks that
we describe in our public filings are not the only risks that we face. Additional risks and uncertainties not presently known to us, or that we currently consider immaterial, also may materially adversely affect our business, financial condition, and results of operations.
Risk Factors Summary
The following is a summary of the principal risks that could adversely affect our business, operations and financial results.
Risk Related to Our Business and Operations
| ● | Our business and operations, and our customers, suppliers and business partners may be adversely affected by epidemics, pandemics or other outbreaks. |
|---|
| ● | Our business depends upon the demand for data centers. |
|---|
| ● | We face significant competition, which may adversely affect the occupancy and rental rates of our data centers. |
|---|
| ● | Any failure of our physical infrastructure or services could lead to significant costs and disruptions. |
|---|
| ● | We may be vulnerable to breaches, or unauthorized access to, or disruption of our physical and information security infrastructure and systems. |
|---|
| ● | We depend on significant customers, and many of our data centers are single-tenant properties or are currently occupied by single tenants. |
|---|
| ● | Failure to attract, grow and retain a diverse and balanced customer base, including key magnet customers, could harm our business and operating results. |
|---|
| ● | Our contracts with our customers could subject us to significant liability. |
|---|
| ● | Certain of our customer agreements may include restrictions on the sale of our properties to certain third parties, which could have a material adverse effect on us. |
|---|
| ● | Our data centers may not be suitable for re-leasing without significant expenditures or renovations. |
|---|
| ● | We may be unable to lease vacant or development space, renew leases, or re-lease space as leases expire. |
|---|
| ● | Even if we have additional space available for lease at any one of our data centers, our ability to lease this space to existing or new customers could be constrained by our ability to provide sufficient electrical power. |
|---|
| ● | Our portfolio depends upon local economic conditions and is geographically concentrated in certain locations. |
|---|
| ● | We may experience supply chain or procurement disruptions, or increased supply chain costs, which may lead to construction delays. |
|---|
| ● | We lease or sublease certain of our data center space from third parties and the ability to retain these leases or subleases could be a significant risk to our ongoing operations. |
|---|
| ● | We may not be able to adapt to changing technologies and customer requirements, and our data center infrastructure may become obsolete. |
|---|
| ● | We depend upon third-party suppliers for power, and we are vulnerable to service failures and to price increases by such suppliers and to volatility in the supply and price of power in the open market. |
|---|
| ● | We depend on third parties to provide network connectivity to the customers in our data centers and any delays or disruptions in connectivity may materially adversely affect our operating results and cash flow. |
|---|
| ● | Our international activities, including acquisition, ownership and operation of data centers located outside of the United States, subject us to risks different than those we face in the United States and we may not be able to effectively manage our international business. |
|---|
| ● | The United Kingdom’s withdrawal from the European Union may have a negative effect on global economic conditions, financial markets and our business. |
|---|
| ● | Our recent acquisitions may not achieve the intended benefits or may disrupt our plans and operations. |
|---|
| ● | We may be subject to unknown or contingent liabilities related to our recent acquisitions, for which we may have no or limited recourse against the sellers. |
|---|
| ● | We may be unable to identify, including sourcing off-market deal flow, and complete acquisitions on favorable terms or at all. |
|---|
| ● | Joint venture (JV) investments could be adversely affected by our lack of sole decision-making authority, our reliance on our JV partners’ financial condition and disputes between us and our JV partners. |
|---|
| ● | Brazilian political and economic conditions could adversely affect our investment in the Ascenty joint venture. |
|---|
| ● | Any delays or unexpected costs in the development of our existing space and developable land and new properties acquired for development may delay and harm our growth prospects, future operating results and financial condition. |
|---|
| ● | Discontinuation, reform or replacement of the London Interbank Offered Rate (LIBOR) and other benchmark rates, or uncertainty related to the potential for any of the foregoing, may adversely affect our business. |
|---|
| ● | We have substantial debt and face risks associated with the use of debt to fund our business activities, including refinancing and interest rate risks. |
|---|
| ● | Our growth depends on external sources of capital which are outside of our control. |
|---|
| ● | Declining real estate valuations, impairment charges and illiquidity of real estate investments could adversely affect our earnings and financial condition. |
|---|
| ● | Our success depends on key personnel whose continued service is not guaranteed. |
|---|
| ● | We may have difficulty managing our growth. |
|---|
| ● | Potential losses may not be covered by insurance. |
|---|
| ● | We could incur significant costs related to environmental matters, including from government regulation, private litigation, and existing conditions at some of our properties. |
|---|
| | ● | Our properties may contain or develop harmful mold or suffer from other air quality issues,
Showing the first 8K of 160K characters. Open the full section
Item 1B. UNRESOLVED STAFF COMMENTS
None.
Item 2. PROPERTIES
General
In addition to the information in this Item 2, certain information regarding our portfolio is contained in Schedule III (Financial Statement Schedule) under Part IV, Item 15(a) (2) and which is included in Part II, Item 8.
Our Portfolio
As of December 31, 2020, our portfolio consisted of 291 data centers, including 43 data centers held as investments in unconsolidated joint ventures, and contain a total of approximately 43.6 million rentable square feet, including 5.4 million square feet of space under active development and 2.3 million square feet of space held for development. The following table presents an overview of our portfolio of properties, including the 43 data centers held as investments in unconsolidated joint ventures and developable land, based on information as of December 31, 2020 (dollar amounts in thousands). All data centers are held in fee simple except as otherwise indicated. Please refer to Note 8 in the Notes to
the Consolidated Financial Statements included in Part II, Item 8 of this Annual Report on Form 10-K for a description of all applicable encumbrances as of December 31, 2020.
| | | | | | | | | | | | | | | |
|---|---|---|---|---|---|---|---|---|---|---|---|---|---|---|
| | | | Space Under | | | | | |||||||
| | | Data Center | | Net Rentable | | Active | | Space Held for | | Annualized | | Occupancy | ||
| Metropolitan Area | | Buildings | | Square Feet (1) | | Development (2) | | Development (3) | | Rent (4) | | Percentage (5) | ||
| | | | | | | | | | | | | | | |
| North America | | | | | | | | | | | | | | |
| Northern Virginia | 24 | 5,721,264 | 699,908 | 78,538 | | $ | 584,085 | 94.6 | % | |||||
| Chicago | 10 | 3,427,367 | — | 148,101 | | 299,046 | 87.6 | % | ||||||
| New York | 13 | 2,050,605 | 233,807 | 99,955 | | 211,307 | 83.8 | % | ||||||
| Silicon Valley | 20 | 2,251,021 | 65,594 | — | | 211,214 | 96.8 | % | ||||||
| Dallas | 21 | 3,530,749 | 143,051 | 28,094 | | 193,258 | 81.4 | % | ||||||
| Phoenix | 3 | 795,687 | — | 227,274 | | 70,533 | 71.1 | % | ||||||
| San Francisco | 4 | 824,972 | 23,321 | — | | 65,175 | 71.1 | % | ||||||
| Atlanta | 4 | 525,414 | — | 313,581 | | 52,112 | 94.6 | % | ||||||
| Los Angeles | 4 | 798,571 | 19,908 | — | | 43,447 | 85.5 | % | ||||||
| Seattle | | 1 | 400,369 | — | — | | 38,724 | 87.4 | % | |||||
| Toronto, Canada | (6) | 2 | 316,170 | 499,839 | — | | | 27,986 | 83.7 | % | ||||
| Portland | | 2 | 264,973 | 336,463 | — | | | 26,544 | 98.7 | % | ||||
| Boston | 4 | 467,519 | — | 50,649 | | 21,170 | 47.3 | % | ||||||
| Houston | 6 | 392,816 | — | 13,969 | | 15,881 | 76.5 | % | ||||||
| Miami | | 2 | 226,314 | — | — | | | 8,390 | 90.0 | % | ||||
| Austin | 1 | 85,688 | — | — | | 6,760 | 63.4 | % | ||||||
| Minneapolis/St. Paul | 1 | 328,765 | — | — | | 5,957 | 100.0 | % | ||||||
| Charlotte | 3 | 95,499 | — | — | | 4,804 | 89.2 | % | ||||||
| North America Total | 125 | 22,503,763 | 2,021,891 | 960,161 | | 1,886,393 | 87.0 | % | ||||||
| | | | | | | | | | | | | | | |
| Europe | | | ||||||||||||
| London, England | (7) | 19 | 1,715,719 | — | 161,136 | | | 259,830 | 77.4 | % | ||||
| Frankfurt, Germany | (8) | 21 | 1,627,677 | 357,733 | — | | | 191,190 | 88.5 | % | ||||
| Amsterdam, Netherlands | (8) | 17 | 1,442,910 | 48,490 | 95,262 | | | 149,828 | 67.6 | % | ||||
| Paris, France | (8) | 12 | 658,681 | 376,162 | — | | | 74,845 | 89.9 | % | ||||
| Vienna, Austria | (8) | 2 | 359,809 | — | — | | | 46,758 | 84.0 | % | ||||
| Dublin, Ireland | (8) | 8 | 380,739 | 94,005 | — | | | 45,145 | 75.0 | % | ||||
| Marseille, France | (8) | 4 | 278,617 | 161,449 | — | | | 37,813 | 78.1 | % | ||||
| Madrid, Spain | (8) | 3 | 222,047 | — | — | | | 35,044 | 77.7 | % | ||||
| Zurich, Switzerland | (9) | 3 | 229,388 | 315,197 | — | | | 30,614 | 70.6 | % | ||||
| Brussels, Belgium | (8) | 2 | 132,501 | — | — | | | 23,153 | 76.1 | % | ||||
| Stockholm, Sweden | (10) | 6 | 164,421 | 89,276 | — | | | 22,440 | 73.4 | % | ||||
| Copenhagen, Denmark | (11) | 3 | 164,489 | 61,342 | — | | | 18,120 | 76.7 | % | ||||
| Dusseldorf, Germany | (8) | 2 | 105,523 | — | — | | | 16,970 | 60.2 | % | ||||
| Athens, Greece | (8) | 2 | 55,167 | — | — | | | 6,288 | 58.0 | % | ||||
| Zagreb, Croatia | (12) | 1 | 19,365 | 12,538 | — | | | 2,032 | 49.9 | % | ||||
| Geneva, Switzerland | (9) | 1 | 59,190 | — | — | | | 2,012 | 100.0 | % | ||||
| Manchester, England | (7) | 1 | 38,016 | — | — | | | 1,863 | 100.0 | % | ||||
| Europe Total | 107 | 7,654,259 | 1,516,192 | 256,398 | | 963,945 | 78.7 | % | ||||||
| | | | | | | | | | | | | | | |
| Asia Pacific | | | ||||||||||||
| Singapore | (13) | 3 | 540,638 | 344,826 | — | | | 93,438 | 95.3 | % | ||||
| Sydney, Australia | (14) | 4 | 226,697 | 222,838 | — | | | 27,733 | 85.7 | % | ||||
| Melbourne, Australia | (14) | 2 | 146,570 | — | — | | | 17,829 | 71.3 | % | ||||
| Tokyo, Japan | (15) | 1 | — | 406,664 | — | | | — | — | % | ||||
| Osaka, Japan | (15) | 1 | — | 193,535 | — | | | — | — | % | ||||
| Seoul, South Korea | (16) | 1 | — | 162,260 | — | | | — | — | % | ||||
| Hong Kong | (17) | 1 | — | — | 284,751 | | | — | — | % | ||||
| Asia Pacific Total | 13 | 913,905 | 1,330,123 | 284,751 | | 139,001 | 89.0 | % | ||||||
| | | | | | | | | | | | | | | |
| Africa | | | | | | | | | | | | | | |
| Nairobi, Kenya | (18) | 1 | 15,710 | — | — | | | 1,114 | 52.2 | % | ||||
| Mombasa, Kenya | (18) | 2 | 9,591 | 37,025 | — | | | 645 | 41.7 | % | ||||
| Africa Total | | 3 | 25,300 | 37,025 | — | | 1,759 | 48.3 | % | |||||
| | | | | | | | | | | | | | | |
| Non-Data Center Properties | — | 263,668 | — | — | | 1,254 | 100.0 | % | ||||||
| | | | | | | | | | | | | | | |
| Managed Unconsolidated Joint Ventures | | | ||||||||||||
| Northern Virginia | 7 | 1,250,419 | — | — | | 93,381 | 100.0 | % | ||||||
| Hong Kong | (17) | 1 | 186,300 | — | — | | 19,970 | 87.3 | % | |||||
| Silicon Valley | 4 | 326,305 | — | — | | 13,705 | 100.0 | % | ||||||
| Dallas | 3 | 319,876 | — | — | | 5,555 | 82.4 | % | ||||||
| New York | 1 | 108,336 | — | — | | 3,460 | 100.0 | % | ||||||
| | 16 | 2,191,236 | — | — | | 136,071 | 96.4 | % | ||||||
| | | | | | | | | | | | | | | |
| | | | | | | | | | | | | | | |
|---|---|---|---|---|---|---|---|---|---|---|---|---|---|---|
| | | | Space Under | | | | | |||||||
| | | Data Center | | Net Rentable | | Active | | Space Held for | | Annualized | | Occupancy | ||
| Metropolitan Area | | Buildings | | Square Feet (1) | | Development (2) | | Development (3) | | Rent (4) | | Percentage (5) | ||
| Non-Managed Unconsolidated Joint Ventures | | | ||||||||||||
| Sao Paulo, Brazil | (19) | 15 | 897,625 | 254,264 | 201,589 | | 119,500 | 97.9 | % | |||||
| Tokyo, Japan | (15) | 2 | 892,667 | — | — | | 64,702 | 87.8 | % | |||||
| Osaka, Japan | (15) | 2 | 248,906 | 52,306 | 30,874 | | 45,273 | 85.6 | % | |||||
| Fortaleza, Brazil | (19) | 1 | 94,205 | — | — | | 9,860 | 100.0 | % | |||||
| Rio De Janeiro, Brazil | (19) | 2 | 72,442 | 26,781 | — | | 10,926 | 100.0 | % | |||||
| Seattle | | 1 | 51,000 | — | — | | 7,562 | 100.0 | % | |||||
| Queretaro, Mexico | | 2 | — | 108,178 | 376,202 | | — | — | % | |||||
| Santiago, Chile | (20) | 2 | 67,340 | 45,209 | 180,835 | | 6,709 | 68.7 | % | |||||
| | 27 | 2,324,185 | 486,738 | 789,500 | | 264,533 | 92.1 | % | ||||||
| | | | | | | | | | | | | | | |
| Total | 291 | 35,876,316 | 5,391,969 | 2,290,810 | | $ | 3,392,956 | 86.3 | % |
| (1) | Net rentable square feet at a building represents the current square feet at that building under lease as specified in the lease agreements plus management’s estimate of space available for lease. We estimate the total net rentable square feet available for lease based on a number of factors in addition to contractually leased square feet, including available power, required support space and common area. Net rentable square feet includes tenants’ proportional share of common areas but excludes space held for development. |
|---|
| (2) | Space under active development includes current base building and data center projects in progress. |
|---|
| (3) | Space held for development includes space held for future data center development, and excludes space under active development. |
|---|
| (4) | Annualized rent represents the monthly contractual rent (defined as cash base rent before abatements) under existing leases as of December 31, 2020 multiplied by 12. |
|---|
| (5) | Excludes space held for development and space under active development. We estimate the total square feet available for lease based on a number of factors in addition to contractually leased square feet, including available power, required support space and common area. |
|---|
| (6) | Rental amounts were calculated based on the exchange rate in effect on December 31, 2020 of $0.79 to 1.00 CAD. |
|---|
| (7) | Rental amounts were calculated based on the exchange rate in effect on December 31, 2020 of $1.37 to £1.00. |
|---|
| (8) | Rental amounts were calculated based on the exchange rate in effect on December 31, 2020 of $1.22 to €1.00. |
|---|
| (9) | Rental amounts were calculated based on the exchange rate in effect on December 31, 2020 of $1.13 to 1.00 Swiss francs. |
|---|
| (10) | Rental amounts were calculated based on the exchange rate in effect on December 31, 2020 of $0.12 to 1.00 Swedish krone. |
|---|
| (11) | Rental amounts were calculated based on the exchange rate in effect on December 31, 2020 of $0.16 to 1.00 Danish krone. |
|---|
| (12) | Rental amounts were calculated based on the exchange rate in effect on December 31, 2020 of $0.16 to 1.00 Croatian kuna. |
|---|
| (13) | Rental amounts were calculated based on the exchange rate in effect on December 31, 2020 of $0.76 to 1.00 SGD. |
|---|
| (14) | Rental amounts were calculated based on the exchange rate in effect on December 31, 2020 of $0.77 to 1.00 AUD. |
|---|
| (15) | Rental amounts were calculated based on the exchange rate in effect on December 31, 2020 of $0.01 to 1.00 JPY. |
|---|
| (16) | Rental amounts were calculated based on the exchange rate in effect on December 31, 2020 of $0.001 to 1.00 South Korean won. |
|---|
| (17) | Rental amounts were calculated based on the exchange rate in effect on December 31, 2020 of $0.13 to 1.00 HKD. |
|---|
| (18) | Rental amounts were calculated based on the exchange rate in effect on December 31, 2020 of $0.01 to 1.00 Kenyan shilling. |
|---|
| (19) | Rental amounts were calculated based on the exchange rate in effect on December 31, 2020 of $0.25 to 1.00 BRL. |
|---|
| (20) | Rental amounts were calculated based on the exchange rate in effect on December 31, 2020 of $0.001 to 1.00 Chilean peso. |
|---|
We lease space at certain of our data centers from third parties and certain equipment under noncancelable lease agreements. Leases for our data centers expire at various dates through 2065. As of December 31, 2020, certain of our data centers, primarily in Europe and Singapore, are subject to ground leases. As of December 31, 2020, the termination dates of these ground leases range from 2041 to 2981. In addition, our corporate headquarters along with several regional office locations are subject to leases with termination dates ranging from 2021 to 2028.
Customer Diversification
As of December 31, 2020, our portfolio was leased to over 4,000 customers, many of which are internationally recognized firms. The following table sets forth information regarding the 20 largest customers in our portfolio based on annualized recurring revenue as of December 31, 2020 (dollar amounts in thousands).
| | | | | | | | | | | | |
|---|---|---|---|---|---|---|---|---|---|---|---|
| | | | | | | Weighted | |||||
| | | | | | | | | | | | Average |
| | | | | | | | | | | | Remaining |
| | | | | Number | | Annualized | | % of Annualized | | Lease | |
| | | | | of | | Recurring | | Recurring | | Term in | |
| | | Tenant | | Locations | | Revenue (1) | | Revenue | | Years | |
| 1 | Fortune 50 Software Company | 53 | $ | 321,760 | 9.5 | % | 8.9 | ||||
| 2 | IBM | 40 | 159,995 | 4.7 | % | 3.1 | |||||
| 3 | Facebook, Inc. | 36 | 146,031 | 4.3 | % | 4.0 | |||||
| 4 | Oracle America, Inc. | | 29 | 96,751 | 2.9 | % | 2.4 | ||||
| 5 | Equinix | 26 | 94,329 | 2.8 | % | 8.4 | |||||
| 6 | Fortune 25 Investment Grade-Rated Company | 25 | 83,744 | 2.5 | % | 2.7 | |||||
| 7 | Global Cloud Provider | 48 | 79,201 | 2.3 | % | 2.0 | |||||
| 8 | LinkedIn Corporation | 8 | 71,327 | 2.1 | % | 3.9 | |||||
| 9 | Cyxtera Technologies, Inc. | 17 | 67,630 | 2.0 | % | 11.3 | |||||
| 10 | Fortune 500 SaaS Provider | 13 | 65,059 | 1.9 | % | 4.9 | |||||
| 11 | Rackspace | 19 | 62,862 | 1.9 | % | 8.7 | |||||
| 12 | CenturyLink, Inc. | 129 | 59,867 | 1.8 | % | 5.0 | |||||
| 13 | Fortune 25 Tech Company | 36 | 58,177 | 1.7 | % | 2.9 | |||||
| 14 | Social Content Platform | 8 | 55,398 | 1.6 | % | 6.3 | |||||
| 15 | Verizon | 101 | 46,361 | 1.4 | % | 3.4 | |||||
| 16 | Comcast Corporation | 27 | 41,343 | 1.2 | % | 5.1 | |||||
| 17 | AT&T | 71 | 38,079 | 1.1 | % | 1.5 | |||||
| 18 | DXC Technology Company | 19 | 36,426 | 1.1 | % | 2.6 | |||||
| 19 | JPMorgan Chase & Co. | 16 | 35,840 | 1.1 | % | 2.8 | |||||
| 20 | Zayo | 117 | 34,167 | 1.0 | % | 6.1 | |||||
| | Total / Weighted Average | | | $ | 1,654,347 | 48.9 | % | 6.1 |
Note: Represents consolidated portfolio in addition to our managed portfolio of unconsolidated joint ventures based on our ownership percentage. Our direct customers may be the entities named in the table above or their subsidiaries or affiliates.
| (1) | Annualized recurring revenue represents the monthly contractual base rent (defined as cash base rent before abatements), and interconnection revenue under existing leases as of December 31, 2020 multiplied by 12. |
|---|
Lease Distribution
The following table sets forth information relating to the distribution of leases in the properties in our portfolio, based on size (in megawatts), excluding approximately 5.4 million square feet of space under active development and approximately 2.3 million square feet of space held for development at December 31, 2020, under lease as of December 31, 2020 (dollar amounts in thousands).
| | | | | | | | | | | |
|---|---|---|---|---|---|---|---|---|---|---|
| | | Percentage | | | | |||||
| | | Total Net | | of Net | | | | | Percentage | |
| | | Rentable | | Rentable | | | | | of | |
| | | Square | | Square | | Annualized | | Annualized | ||
| Size | | Feet (1) | | Feet (1) | | Rent (2) | | Rent | ||
| Available | 4,680,127 | 14.7 | % | | — | — | | |||
| 0 - 1 MW | 4,716,419 | 14.8 | % | $ | 1,054,286 | 34.9 | % | |||
| > 1 MW | 12,082,358 | 37.9 | % | 1,652,690 | 54.6 | % | ||||
| Other (3) | 10,376,129 | 32.6 | % | 318,581 | 10.5 | % | ||||
| Total | 31,855,032 | 100.0 | % | $ | 3,025,558 | 100.0 | % |
Note: Represents consolidated portfolio in addition to our managed portfolio of unconsolidated joint ventures based on our ownership percentage.
| (1) | We estimate the total net rentable square feet available for lease based on a number of factors in addition to contractually leased square feet, including available power, required support space and common area. |
|---|
| (2) | Annualized rent represents the monthly contractual base rent (defined as cash base rent before abatements) under existing leases as of December 31, 2020 multiplied by 12. |
|---|
| (3) | Other includes unimproved building shell capacity as well as storage and office space within fully improved data center facilities. |
|---|
Lease Expirations
The following table sets forth a summary schedule of the lease expirations for leases in place as of December 31, 2020 plus available space for ten calendar years at the properties in our portfolio, excluding approximately 5.4 million square feet of space under active development and approximately 2.3 million square feet of space held for development at December 31, 2020. Unless otherwise stated in the footnotes to the table below, the information set forth in the table assumes that tenants exercise no renewal options and all early termination rights (dollar amounts in thousands).
| | | | | | | | | | | | | | | | | |
|---|---|---|---|---|---|---|---|---|---|---|---|---|---|---|---|---|
| | | | | | | | | | | | | Annualized | | | | |
| | | | | | | | | | Annualized | | Rent Per | | | | ||
| | | Square | | | | | Percentage | | Rent Per | | Occupied | | | | ||
| | | Footage of | | | | | of | | Occupied | | Square | | Annualized | |||
| | | Expiring | | Annualized | | Annualized | | Square | | Foot at | | Rent at | ||||
| Year | | Leases (1) | | Rent (2) | | Rent | | Foot | | Expiration | | Expiration | ||||
| Available | 4,680,127 | | | | | |||||||||||
| Month to Month (3) | 371,993 | $ | 56,340 | 1.9 | % | $ | 151 | | $ | 151 | | $ | 56,337 | |||
| 2021 | 4,890,094 | 817,901 | 27.0 | % | 167 | | 168 | | 819,973 | |||||||
| 2022 | 3,401,680 | 484,725 | 16.0 | % | 142 | | 145 | | 493,983 | |||||||
| 2023 | 2,742,258 | 328,240 | 10.8 | % | 120 | | 123 | | 337,448 | |||||||
| 2024 | 2,660,949 | 291,519 | 9.6 | % | 110 | | 116 | | 309,259 | |||||||
| 2025 | 2,988,107 | 314,197 | 10.4 | % | 105 | | 114 | | 339,491 | |||||||
| 2026 | 1,434,017 | 156,647 | 5.2 | % | 109 | | 125 | | 179,091 | |||||||
| 2027 | 1,111,798 | 114,081 | 3.8 | % | 103 | | 118 | | 131,168 | |||||||
| 2028 | 600,057 | 51,177 | 1.7 | % | 85 | | 100 | | 60,272 | |||||||
| 2029 | 1,080,449 | 83,573 | 2.8 | % | 77 | | 91 | | 98,702 | |||||||
| 2030 | 1,220,243 | 82,288 | 2.7 | % | 67 | | 81 | | 99,093 | |||||||
| Thereafter | 4,673,261 | 244,870 | 8.1 | % | 52 | | 66 | | 310,518 | |||||||
| Portfolio Total / Weighted Average | 31,855,032 | $ | 3,025,558 | 100.0 | % | $ | 111 | | $ | 119 | | $ | 3,235,336 |
Note: Represents consolidated portfolio in addition to our managed portfolio of unconsolidated joint ventures based on our ownership percentage.
| (1) | For some of our properties, we calculate square footage based on factors in addition to contractually leased square feet, including available power, required support space and common area. We estimate the total net rentable square feet available for lease based on a number of factors in addition to contractually leased square feet, including available power, required support space and common area. |
|---|
| (2) | Annualized rent represents the monthly contractual base rent (defined as cash base rent before abatements) under existing leases as of December 31, 2020 multiplied by 12. |
|---|
| (3) | Includes leases, licenses and similar agreements that upon expiration have been automatically renewed on a month-to-month basis. |
|---|
Item 3. LEGAL PROCEEDINGS
In the ordinary course of our business, we may become subject to various legal proceedings. As of December 31, 2020, we were not a party to any legal proceedings which we believe would have a material adverse effect on our operations or financial position.
Item 4. MINE SAFETY DISCLOSURES
Item 5. MARKET FOR REGISTRANT’S COMMON EQUITY, RELATED STOCKHOLDER MATTERS AND ISSUER PURCHASES OF EQUITY SECURITIES
Digital Realty Trust, Inc.
Digital Realty Trust, Inc.’s common stock has been listed, and is traded, on the New York Stock Exchange, or the NYSE, under the symbol “DLR” since October 29, 2004.
Subject to the distribution requirements applicable to REITs under the Code, Digital Realty Trust, Inc. intends, to the extent practicable, to invest substantially all of the proceeds from sales and refinancings of its assets in real estate-related assets and other assets. Digital Realty Trust, Inc. may, however, under certain circumstances, make a dividend of capital or of assets. Such dividends, if any, will be made at the discretion of Digital Realty Trust, Inc.’s Board of Directors.
As of February 22, 2021, there were approximately 54 holders of record of Digital Realty Trust, Inc.’s common stock. This figure does not reflect the beneficial ownership of shares held in nominee name.
Digital Realty Trust, L.P.
There is no established trading market for Digital Realty Trust, L.P.’s common units of limited partnership. As of February 22, 2021, there were 87 holders of record of common units, including Digital Realty Trust, L.P.’s general partner, Digital Realty Trust, Inc.
Digital Realty Trust, L.P. currently intends to continue to make regular quarterly distributions to holders of its common units. Any future distributions will be declared at the discretion of the Board of Directors of Digital Realty Trust, L.P.’s general partner, Digital Realty Trust, Inc., and will depend on our actual cash flow, financial condition, capital requirements, the annual distribution requirements under the REIT provisions of the Code, and such other factors as the Board of Directors may deem relevant.
STOCK PERFORMANCE GRAPH
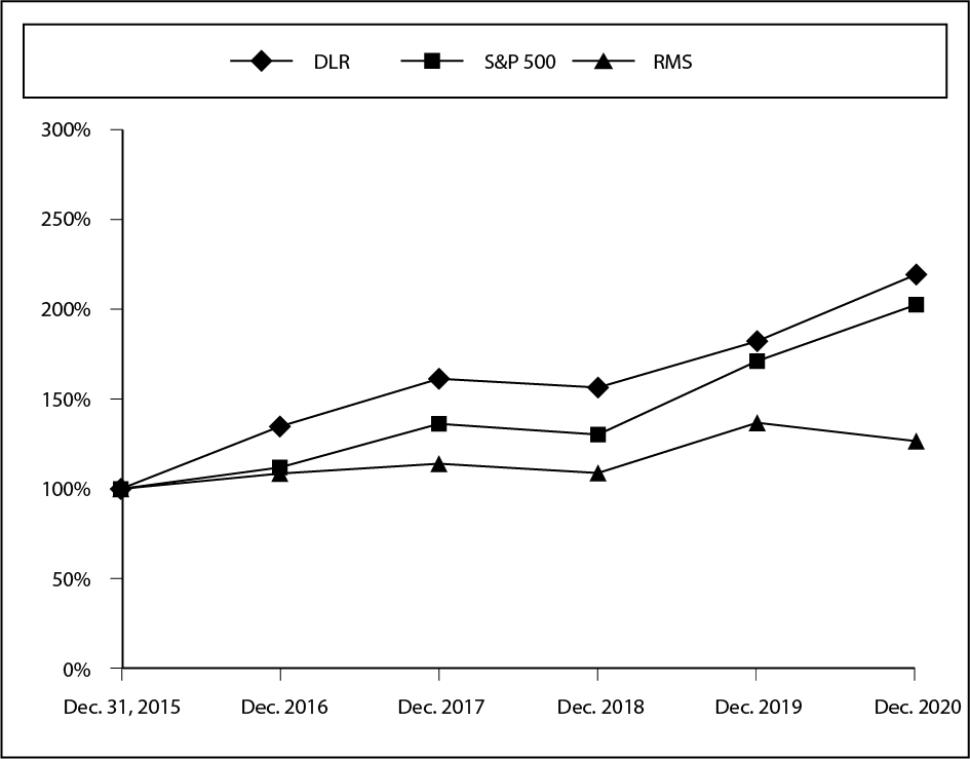
The following graph compares the yearly change in the cumulative total stockholder return on Digital Realty Trust, Inc.’s common stock during the period from December 31, 2015 through December 31, 2020, with the cumulative total returns on the MSCI US REIT Index (RMS) and the S&P 500 Market Index. The comparison assumes that $100 was invested on December 31, 2015 in Digital Realty Trust, Inc.’s common stock and in each of these indices and assumes reinvestment of dividends, if any.
COMPARISON OF CUMULATIVE TOTAL RETURNS
AMONG DIGITAL REALTY TRUST, INC., S&P 500 INDEX AND RMS INDEX
Assumes $100 invested on December 31, 2015 and
dividends reinvested
To fiscal year ending December 31, 2020
| | | | | | | |
|---|---|---|---|---|---|---|
| Pricing Date | DLR($) | S&P 500($) | RMS($) | |||
| December 31, 2015 | 100.0 | 100.0 | 100.0 | |||
| December 31, 2016 | 134.9 | 112.0 | 108.6 | |||
| December 31, 2017 | 161.6 | 136.4 | 114.1 | |||
| December 31, 2018 | 156.7 | 130.4 | 108.9 | |||
| December 31, 2019 | 182.6 | 171.5 | 137.0 | |||
| December 31, 2020 | 219.9 | 203.0 | 126.7 |
| ● | This graph and the accompanying text are not “soliciting material,” are not deemed filed with the SEC and are not to be incorporated by reference in any filing by us under the Securities Act of 1933, as amended, or the Securities Exchange Act of 1934, as amended, whether made before or after the date hereof and irrespective of any general incorporation language in any such filing. |
|---|
| ● | The stock price performance shown on the graph is not necessarily indicative of future price performance. |
|---|
| ● | The hypothetical investment in Digital Realty Trust, Inc.’s common stock presented in the stock performance graph above is based on the closing price of the common stock on December 31, 2015. |
|---|
SALES OF UNREGISTERED EQUITY SECURITIES
Digital Realty Trust, Inc.
During the year ended December 31, 2020, we issued 189,402 shares of our Common Stock as partial consideration for our acquisition of Lamda Hellix. The shares were issued in reliance upon the exemption from the registration requirements of the Securities Act of 1933, as amended (the “Securities Act”), provided by Regulation S of the Securities Act, on the basis of representations that the recipients were not “US Persons” (as that term is defined in Regulation S) and were not in the United States at the time they received the shares. The Company did not engage in any form of “directed selling efforts” (as that term is defined in Regulation S) in connection with the issuance of the shares.
Digital Realty Trust, L.P.
During the year ended December 31, 2020, our Operating Partnership issued partnership units in private placements in reliance on the exemption from registration provided by Section 4(a)(2) of the Securities Act, in the amounts and for the consideration set forth below:
During the year ended December 31, 2020, Digital Realty Trust, Inc. issued an aggregate of 263,796 shares of its common stock in connection with restricted stock awards for no cash consideration. For each share of common stock issued by Digital Realty Trust, Inc. in connection with such awards, our Operating Partnership issued a restricted common unit to Digital Realty Trust, Inc. During the year ended December 31, 2020, our Operating Partnership issued an aggregate of 263,796 common units to Digital Realty Trust, Inc., as required by our Operating Partnership’s partnership agreement. During the year ended December 31, 2020, an aggregate of 35,274 shares of its common stock were forfeited to Digital Realty Trust, Inc. in connection with restricted stock awards for a net issuance of 228,522 shares of common stock.
All other issuances of unregistered equity securities of our Operating Partnership during the year ended December 31, 2020 have been disclosed previously in filings with the SEC. For all issuances of units to Digital Realty Trust, Inc., our Operating Partnership relied on Digital Realty Trust, Inc.’s status as a publicly traded NYSE-listed company with over $36.1 billion in total consolidated assets and as our Operating Partnership’s majority owner and general partner as the basis for the exemption under Section 4(a)(2) of the Securities Act.
REPURCHASES OF EQUITY SECURITIES
Digital Realty Trust, Inc.
| | | | | | | | | | |
|---|---|---|---|---|---|---|---|---|---|
| Period | | (a) Total Number of Shares (or Units) Purchased | | (b) Average Price Paid per Share (or Unit) | | (c) Total Number of Shares (or Units) Purchased as Part of Publicly Announced Plans or Programs (1) | | (d) Maximum Number (or Approximate Dollar Value) of Shares (or Units) that May Yet Be Purchased Under the Plans or Programs (2) | |
| October 1-31, 2020 | | 10,000,000 shares of Series G Preferred Stock | | $ | 25.00 | | 10,000,000 shares of Series G Preferred Stock | | — |
| | | | | | | | | | |
| November 1-30, 2020 | | — | | | — | | — | | — |
| | | | | | | | | | |
| December 1-31, 2020 | | — | | | — | | — | | — |
| Total | | 10,000,000 | | $ | 25.00 | | 10,000,000 | | — |
| (1) | On September 15, 2020, the Company distributed a Notice of Redemption to all holders of record of its outstanding 5.875% series G cumulative redeemable preferred stock, or the series G preferred stock, announcing its redemption of all 10,000,000 outstanding shares of the series G preferred stock at a redemption price of $25.057118 per share. The redemption price was equal to the original issuance price of $25.00 per share, plus accrued and unpaid dividends up to but not including the redemption date. The redemption was made at the Company's option pursuant to Section 5(b) of the Articles Supplementary establishing and fixing the rights and preferences of the series G preferred stock. The redemption date was October 15, 2020. |
|---|
| (2) | The Company redeemed all outstanding shares of its series G preferred stock on October 15, 2020. The Operating Partnership also redeemed the corresponding 10,000,000 series G preferred units. |
|---|
Digital Realty Trust, L.P.
None.
Item 6. SELECTED FINANCIAL DATA
The following data should be read in conjunction with our financial statements and notes thereto and “Management’s Discussion and Analysis of Financial Condition and Results of Operations” included elsewhere in this Form 10-K. Certain prior year amounts have been reclassified to conform to the current year presentation.
SELECTED COMPANY FINANCIAL AND OTHER DATA (Digital Realty Trust, Inc.)
The following table sets forth selected consolidated financial and operating data on an historical basis for Digital Realty Trust, Inc. (amounts in thousands, except share and per share data).
| | | | | | | | | | | | | | | | |
|---|---|---|---|---|---|---|---|---|---|---|---|---|---|---|---|
| | | Year Ended December 31, | |||||||||||||
| | 2020 | 2019 | 2018 | 2017 | 2016 | ||||||||||
| | | (Amounts in thousands, except share and per share data) | |||||||||||||
| Statement of Operations Data: | | | | | | ||||||||||
| Operating Revenues: | | | | | | ||||||||||
| Rental and other services | | $ | 3,886,546 | | $ | 3,196,356 | | $ | 2,412,076 | | $ | 2,010,301 | | $ | 1,746,828 |
| Tenant reimbursements | | — | | — | | 624,637 | | 440,224 | | 355,903 | |||||
| Fee income and other | | 17,063 | | 12,885 | | 9,765 | | 7,403 | | 39,482 | |||||
| Total operating revenues | | 3,903,609 | | 3,209,241 | | 3,046,478 | | 2,457,928 | | 2,142,213 | |||||
| Operating Expenses: | | | | | | ||||||||||
| Rental property operating and maintenance | | 1,331,493 | | 1,020,578 | | 957,065 | | 759,616 | | 660,177 | |||||
| Property taxes and insurance | | 182,623 | | 172,183 | | 140,918 | | 134,995 | | 111,989 | |||||
| Depreciation and amortization | | 1,366,379 | | 1,163,774 | | 1,186,896 | | 842,464 | | 699,324 | |||||
| General and administrative | | 351,369 | | 211,097 | | 163,667 | | 161,441 | | 152,733 | |||||
| Transaction and integration expenses | | 106,662 | | 27,925 | | 45,327 | | 76,048 | | 20,491 | |||||
| Impairment on investments in real estate | | 6,482 | | 5,351 | | — | | 28,992 | | — | |||||
| Other | | 1,075 | | 14,118 | | 2,818 | | 3,077 | | 213 | |||||
| Total operating expenses | | 3,346,083 | | 2,615,026 | | 2,496,691 | | 2,006,633 | | 1,644,927 | |||||
| Operating income | | 557,526 | | 594,215 | | 549,787 | | 451,295 | | 497,286 | |||||
| Other Income (Expenses): | | | | | | | | | |||||||
| Equity in (loss) earnings of unconsolidated joint ventures | | (57,629) | | 8,067 | | 32,979 | | 25,516 | | 17,104 | |||||
| Gain on disposition of properties, net | | 316,894 | | 267,651 | | 80,049 | | 40,354 | | 169,902 | |||||
| Gain on deconsolidation, net | | — | | 67,497 | | — | | — | | — | |||||
| Interest and other income (expense) | | 20,222 | | 66,000 | | 3,481 | | 3,655 | | (4,564) | |||||
| Interest expense | | (333,021) | | (353,057) | | (321,529) | | (258,642) | | (236,480) | |||||
| (Loss) gain from early extinguishment of debt | | (103,215) | | (39,157) | | (1,568) | | 1,990 | | (1,011) | |||||
| Income tax expense | | (38,047) | | (11,995) | | (2,084) | | (7,901) | | (10,385) | |||||
| Net income | | 362,730 | | 599,221 | | 341,115 | | 256,267 | | 431,852 | |||||
| Net income attributable to noncontrolling interests | | (6,332) | | (19,460) | | (9,869) | | (8,008) | | (5,665) | |||||
| Net income attributable to Digital Realty Trust, Inc. | | 356,398 | | 579,761 | | 331,246 | | 248,259 | | 426,187 | |||||
| Preferred stock dividends | | (76,536) | | (74,990) | | (81,316) | | (68,802) | | (83,771) | |||||
| Issuance costs associated with redeemed preferred stock | | (16,520) | | (11,760) | | — | | (6,309) | | (10,328) | |||||
| Net income available to common stockholders | | $ | 263,342 | | $ | 493,011 | | $ | 249,930 | | $ | 173,148 | | $ | 332,088 |
| Per Share Data: | | | | | | ||||||||||
| Basic income per share available to common stockholders | | $ | 1.01 | | $ | 2.37 | | $ | 1.21 | | $ | 0.99 | | $ | 2.21 |
| Diluted income per share available to common stockholders | | $ | 1.00 | | $ | 2.35 | | $ | 1.21 | | $ | 0.99 | | $ | 2.20 |
| Cash dividend per common share | | $ | 4.48 | | $ | 4.32 | | $ | 4.04 | | $ | 3.72 | | $ | 3.52 |
| Weighted average common shares outstanding: | | | | | | ||||||||||
| Basic | | 260,098,978 | | 208,325,823 | | 206,035,408 | | 174,059,386 | | 149,953,662 | |||||
| Diluted | | 262,522,508 | | 209,462,247 | | 206,673,471 | | 174,895,098 | | 150,679,688 |
| | | | | | | | | | | | | | | | |
|---|---|---|---|---|---|---|---|---|---|---|---|---|---|---|---|
| | | December 31, | |||||||||||||
| | 2020 | 2019 | 2018 | 2017 | 2016 | ||||||||||
| Balance Sheet Data: | | | | | | ||||||||||
| Net investments in real estate | | $ | 21,731,112 | | $ | 15,517,684 | | $ | 15,079,726 | | $ | 13,841,186 | | $ | 8,996,362 |
| Total assets | | 36,076,291 | | 23,068,131 | | 23,766,695 | | 21,404,345 | | 12,192,585 | |||||
| Global revolving credit facilities, net | | 531,905 | | 234,105 | | 1,647,735 | | 550,946 | | 199,209 | |||||
| Unsecured term loans, net | | 536,580 | | 810,219 | | 1,178,904 | | 1,420,333 | | 1,482,361 | |||||
| Unsecured senior notes, net of discount | | 11,997,010 | | 8,973,190 | | 7,589,126 | | 6,570,757 | | 4,153,797 | |||||
| Secured debt, including premiums | | 239,222 | | 104,934 | | 685,714 | | 106,582 | | 3,240 | |||||
| Total liabilities | | 17,587,944 | | 12,418,566 | | 12,892,653 | | 10,300,993 | | 7,060,288 | |||||
| Redeemable noncontrolling interests | | 42,011 | | 41,465 | | 15,832 | | 53,902 | | — | |||||
| Total stockholders' equity | | 17,717,697 | | 9,879,312 | | 9,858,644 | | 10,349,081 | | 5,096,015 | |||||
| Noncontrolling interests in operating partnership | | 608,980 | | 708,163 | | 906,510 | | 698,126 | | 29,684 | |||||
| Noncontrolling interests in consolidated joint ventures | | 119,659 | | 20,625 | | 93,056 | | 2,243 | | 6,598 | |||||
| Total liabilities and equity | | $ | 36,076,291 | | $ | 23,068,131 | | $ | 23,766,695 | | $ | 21,404,345 | | $ | 12,192,585 |
| | | | | | | | | | | | | | | | |
|---|---|---|---|---|---|---|---|---|---|---|---|---|---|---|---|
| | | Year Ended December 31, | |||||||||||||
| | 2020 | 2019 | 2018 | 2017 | 2016 | ||||||||||
| Cash flows from (used in): | | | | | | | | | | | | | | | |
| Operating activities | | $ | 1,706,541 | | $ | 1,513,817 | | $ | 1,385,324 | | $ | 1,023,305 | | $ | 911,242 |
| Investing activities | | (2,599,347) | | (274,992) | | (3,035,993) | | (1,357,153) | | (1,303,597) | |||||
| Financing activities | | 935,689 | | (1,272,021) | | 1,757,269 | | 321,200 | | 350,617 |
SELECTED COMPANY FINANCIAL AND OTHER DATA (Digital Realty Trust, L.P.)
The following table sets forth selected consolidated financial and operating data on an historical basis for our Operating Partnership (amounts in thousands, except unit and per unit data)
| | | | | | | | | | | | | | | | |
|---|---|---|---|---|---|---|---|---|---|---|---|---|---|---|---|
| | | Year Ended December 31, | |||||||||||||
| | 2020 | 2019 | 2018 | 2017 | 2016 | ||||||||||
| | | (Amounts in thousands, except unit and per unit data) | |||||||||||||
| Statement of Operations Data: | | | | | | ||||||||||
| Operating Revenues: | | | | | | ||||||||||
| Rental and other services | | $ | 3,886,546 | | $ | 3,196,356 | | $ | 2,412,076 | | $ | 2,010,301 | | $ | 1,746,828 |
| Tenant reimbursements | | — | | — | | 624,637 | | 440,224 | | 355,903 | |||||
| Fee income and other | | 17,063 | | 12,885 | | 9,765 | | 7,403 | | 39,482 | |||||
| Total operating revenues | | 3,903,609 | | 3,209,241 | | 3,046,478 | | 2,457,928 | | 2,142,213 | |||||
| Operating Expenses: | | | | | | ||||||||||
| Rental property operating and maintenance | | 1,331,493 | | 1,020,578 | | 957,065 | | 759,616 | | 660,177 | |||||
| Property taxes and insurance | | 182,623 | | 172,183 | | 140,918 | | 134,995 | | 111,989 | |||||
| Depreciation and amortization | | 1,366,379 | | 1,163,774 | | 1,186,896 | | 842,464 | | 699,324 | |||||
| General and administrative | | 351,369 | | 211,097 | | 163,667 | | 161,441 | | 152,733 | |||||
| Transaction and integration expenses | | 106,662 | | 27,925 | | 45,327 | | 76,048 | | 20,491 | |||||
| Impairment on investments in real estate | | 6,482 | | 5,351 | | — | | 28,992 | | — | |||||
| Other | | 1,075 | | 14,118 | | 2,818 | | 3,077 | | 213 | |||||
| Total operating expenses | | 3,346,083 | | 2,615,026 | | 2,496,691 | | 2,006,633 | | 1,644,927 | |||||
| Operating income | | 557,526 | | 594,215 | | 549,787 | | 451,295 | | 497,286 | |||||
| Other Income (Expenses): | | | | | | | | | |||||||
| Equity in (loss) earnings of unconsolidated joint ventures | | (57,629) | | 8,067 | | 32,979 | | 25,516 | | 17,104 | |||||
| Gain on disposition of properties, net | | 316,894 | | 267,651 | | 80,049 | | 40,354 | | 169,902 | |||||
| Gain on deconsolidation, net | | — | | 67,497 | | — | | — | | — | |||||
| Interest and other income (expense) | | 20,222 | | 66,000 | | 3,481 | | 3,655 | | (4,564) | |||||
| Interest expense | | (333,021) | | (353,057) | | (321,529) | | (258,642) | | (236,480) | |||||
| (Loss) gain from early extinguishment of debt | | (103,215) | | (39,157) | | (1,568) | | 1,990 | | (1,011) | |||||
| Tax expense | | (38,047) | | (11,995) | | (2,084) | | (7,901) | | (10,385) | |||||
| Net income | | 362,730 | | 599,221 | | 341,115 | | 256,267 | | 431,852 | |||||
| Net loss (income) attributable to noncontrolling interests | | 3,168 | | 1,640 | | 311 | | (4,238) | | (367) | |||||
| Net income attributable to Digital Realty Trust, L.P. | | 365,898 | | 600,861 | | 341,426 | | 252,029 | | 431,485 | |||||
| Preferred units distributions | | (76,536) | | (74,990) | | (81,316) | | (68,802) | | (83,771) | |||||
| Issuance costs associated with redeemed preferred units | | (16,520) | | (11,760) | | — | | (6,309) | | (10,328) | |||||
| Net income available to common unitholders | | $ | 272,842 | | $ | 514,111 | | $ | 260,110 | | $ | 176,918 | | $ | 337,386 |
| Per Unit Data: | | | | | | ||||||||||
| Basic income per unit available to common unitholders | | $ | 1.02 | | $ | 2.37 | | $ | 1.21 | | $ | 0.99 | | $ | 2.21 |
| Diluted income per unit available to common unitholders | | $ | 1.01 | | $ | 2.35 | | $ | 1.21 | | $ | 0.99 | | $ | 2.20 |
| Cash distributions per common unit | | $ | 4.48 | | $ | 4.32 | | $ | 4.04 | | $ | 3.72 | | $ | 3.52 |
| Weighted average common units outstanding: | | | | | | ||||||||||
| Basic | | 268,072,983 | | 217,284,755 | | 214,312,871 | | 178,055,936 | | 152,359,680 | |||||
| Diluted | | 270,496,513 | | 218,421,179 | | 214,950,934 | | 178,891,648 | | 153,085,706 |
| | | | | | | | | | | | | | | | |
|---|---|---|---|---|---|---|---|---|---|---|---|---|---|---|---|
| | | December 31, | |||||||||||||
| | 2020 | 2019 | 2018 | 2017 | 2016 | ||||||||||
| Balance Sheet Data: | | | | | | ||||||||||
| Net investments in real estate | | $ | 21,731,112 | | $ | 15,517,684 | | $ | 15,079,726 | | $ | 13,841,186 | | $ | 8,996,362 |
| Total assets | | 36,076,291 | | 23,068,131 | | 23,766,695 | | 21,404,345 | | 12,192,585 | |||||
| Global revolving credit facilities, net | | 531,905 | | 234,105 | | 1,647,735 | | 550,946 | | 199,209 | |||||
| Unsecured term loans, net | | 536,580 | | 810,219 | | 1,178,904 | | 1,420,333 | | 1,482,361 | |||||
| Unsecured senior notes, net of discount | | 11,997,010 | | 8,973,190 | | 7,589,126 | | 6,570,757 | | 4,153,797 | |||||
| Secured debt, including premiums | | 239,222 | | 104,934 | | 685,714 | | 106,582 | | 3,240 | |||||
| Total liabilities | | 17,587,944 | | 12,418,566 | | 12,892,653 | | 10,300,993 | | 7,060,288 | |||||
| Redeemable noncontrolling interests | | 42,011 | | 41,465 | | 15,832 | | 53,902 | | — | |||||
| General partner’s capital | | 17,582,687 | | 9,967,234 | | 9,974,291 | | 10,457,513 | | 5,231,620 | |||||
| Limited partners’ capital | | 609,190 | | 711,650 | | 911,256 | | 702,579 | | 34,698 | |||||
| Accumulated other comprehensive income (loss) | | 134,800 | | (91,409) | | (120,393) | | (112,885) | | (140,619) | |||||
| Noncontrolling interests in consolidated joint ventures | | 119,659 | | 20,625 | | 93,056 | | 2,243 | | 6,598 | |||||
| Total liabilities and capital | | $ | 36,076,291 | | $ | 23,068,131 | | $ | 23,766,695 | | $ | 21,404,345 | | $ | 12,192,585 |
| | | | | | | | | | | | | | | | |
|---|---|---|---|---|---|---|---|---|---|---|---|---|---|---|---|
| | | Year Ended December 31, | |||||||||||||
| | 2020 | 2019 | 2018 | 2017 | 2016 | ||||||||||
| Cash flows from (used in): | | | | | | ||||||||||
| Operating activities | | $ | 1,706,541 | | $ | 1,513,817 | | $ | 1,385,324 | | $ | 1,023,305 | | $ | 911,242 |
| Investing activities | | (2,599,347) | | (274,992) | | (3,035,993) | | (1,357,153) | | (1,303,597) | |||||
| Financing activities | | 935,689 | | (1,272,021) | | 1,757,269 | | 321,200 | | 350,617 |
Item 7. MANAGEMENT’S DISCUSSION AND ANALYSIS OF FINANCIAL CONDITION AND RESULTS OF OPERATIONS
The following discussion should be read in conjunction with the consolidated financial statements and notes thereto appearing elsewhere in this report. We make statements in this section that are forward-looking statements within the meaning of the federal securities laws. For a complete discussion of forward-looking statements, see the section in this report entitled “Forward-Looking Statements.” Certain risk factors may cause our actual results, performance or achievements to differ materially from those expressed or implied by the following discussion. For a discussion of such risk factors, see the sections in this report entitled “Risk Factors” and “Forward-Looking Statements.”
Occupancy percentages included in the following discussion, for some of our properties, are calculated based on factors in addition to contractually leased square feet, including available power, required support space and common area.
Overview
Our Company. Digital Realty Trust, Inc. completed its initial public offering of common stock, or our IPO, on November 3, 2004. We believe that we have operated in a manner that has enabled us to qualify, and have elected to be treated, as a REIT under Sections 856 through 860 of the Code. Our Company was formed on March 9, 2004. During the period from our formation until we commenced operations in connection with the completion of our IPO, we did not have any corporate activity other than the issuance of shares of Digital Realty Trust, Inc. common stock in connection with the initial capitalization of the Company. Our Operating Partnership was formed on July 21, 2004.
Business and strategy. Our primary business objectives are to maximize: (i) sustainable long-term growth in earnings and funds from operations per share and unit, (ii) cash flow and returns to our stockholders and our operating partnership’s unitholders through the payment of distributions and (iii) return on invested capital. We expect to accomplish our objectives by achieving superior risk-adjusted returns, prudently allocating capital, diversifying our product offerings, accelerating our global reach and scale and driving revenue growth and operating efficiencies. We plan to focus on our core business of investing in and developing and operating data centers. A significant component of our current and future internal growth is anticipated through the development of our existing space held for development, acquisition of land for future development and acquisition of new properties. We target high-quality, strategically located properties containing the physical and connectivity infrastructure that supports the applications and operations of data center and technology industry customers and properties that may be developed for such use. Most of our data center properties contain fully redundant electrical supply systems, multiple power feeds, above-standard cooling systems, raised floor areas, extensive in-building communications cabling and high-level security systems. We focus exclusively on owning, acquiring, developing and operating data centers because we believe that the growth in data center demand and the technology-related real estate industry generally will continue to outpace the overall economy.
As of December 31, 2020, our portfolio included 291 data centers, including 43 data centers held as investments in unconsolidated joint ventures, with approximately 43.6 million rentable square feet including approximately 5.4 million square feet of space under active development and approximately 2.3 million square feet of space held for development. The 43 data centers held as investments in unconsolidated joint ventures have an aggregate of approximately 4.5 million rentable square feet. The 34 parcels of developable land we own as of December 31, 2020 comprised approximately 927 acres. At December 31, 2020, excluding unconsolidated joint ventures, approximately 4.9 million square feet was under construction for Turn-Key Flex® and Powered Base Building® products, all of which are expected to be income producing on or after completion, in seven U.S. metropolitan areas, nine European metropolitan areas, four Asian metropolitan areas, one Australian metropolitan area, one African metropolitan area and one Canadian metropolitan area, consisting of approximately 2.3 million square feet of base building construction and 2.6 million square feet of data center construction.
We have developed detailed, standardized procedures for evaluating new real estate investments to ensure that they meet our financial, technical and other criteria. We expect to continue to acquire additional assets as part of our growth
strategy. We intend to aggressively manage and lease our assets to increase their cash flow. We may continue to build out our development portfolio when justified by anticipated demand and returns.
We may acquire properties subject to existing mortgage financing and other indebtedness or we may incur new indebtedness in connection with acquiring or refinancing these properties. Debt service on such indebtedness will have a priority over any cash dividends with respect to Digital Realty Trust, Inc.’s common stock and preferred stock. We are committed to maintaining a conservative capital structure. We target a debt-to-Adjusted EBITDA ratio at or less than 5.5x, fixed charge coverage of greater than three times, and floating rate debt at less than 20% of total outstanding debt. In addition, we strive to maintain a well-laddered debt maturity schedule, and we seek to maximize the menu of our available sources of capital, while minimizing the cost.
Revenue base. As of December 31, 2020, our portfolio included 291 data centers, including 43 data centers held as investments in unconsolidated joint ventures. Our global portfolio includes 141 data centers located in North America, with 107 located in Europe, 22 in Latin America, 12 in Asia, six in Australia and three in Africa.
The following table presents an overview of our portfolio of data centers, including the 43 data centers held as investments in unconsolidated joint ventures, and developable land, based on information as of December 31, 2020.
| | | | | | | | |
|---|---|---|---|---|---|---|---|
| | | | Space Under | | |||
| | Data Center | | Net Rentable | | Active | | Space Held for |
| Metropolitan Area | Buildings | | Square Feet (1) | | Development (2) | | Development (3) |
| | | | | | | | |
| North America | | | | | | | |
| Northern Virginia | 24 | 5,721,264 | 699,908 | 78,538 | |||
| Chicago | 10 | 3,427,367 | — | 148,101 | |||
| New York | 13 | 2,050,605 | 233,807 | 99,955 | |||
| Silicon Valley | 20 | 2,251,021 | 65,594 | — | |||
| Dallas | 21 | 3,530,749 | 143,051 | 28,094 | |||
| Phoenix | 3 | 795,687 | — | 227,274 | |||
| San Francisco | 4 | 824,972 | 23,321 | — | |||
| Atlanta | 4 | 525,414 | — | 313,581 | |||
| Los Angeles | 4 | 798,571 | 19,908 | — | |||
| Seattle | 1 | | 400,369 | — | — | ||
| Toronto, Canada | 2 | | 316,170 | 499,839 | — | ||
| Portland | 2 | 264,973 | 336,463 | — | |||
| Boston | 4 | | 467,519 | — | 50,649 | ||
| Houston | 6 | 392,816 | — | 13,969 | |||
| Miami | 2 | 226,314 | — | — | |||
| Austin | 1 | 85,688 | — | — | |||
| Minneapolis/St. Paul | 1 | 328,765 | — | — | |||
| Charlotte | 3 | 95,499 | — | — | |||
| North America Total | 125 | 22,503,763 | 2,021,891 | 960,161 | |||
| | | | | | | | |
| Europe | |||||||
| London, England | 19 | 1,715,719 | — | 161,136 | |||
| Frankfurt, Germany | 21 | 1,627,677 | 357,733 | — |
Showing the first 8K of 146K characters. Open the full section
Item 7A. QUANTITATIVE AND QUALITATIVE DISCLOSURES ABOUT MARKET RISK
Our future income, cash flows and fair values relevant to financial instruments depend upon prevalent market interest rates. Market risk refers to the risk of loss from adverse changes in market prices and interest rates. We do not use derivatives for trading or speculative purposes and only enter into contracts with major financial institutions based on their credit ratings and other factors.
Analysis of Debt between Fixed and Variable Rate
We use interest rate swap agreements and fixed rate debt to reduce our exposure to interest rate movements. As of December 31, 2020, our consolidated debt was as follows (in millions):
| | | | | | | |
|---|---|---|---|---|---|---|
| | | | Estimated Fair | |||
| | | Carrying Value | Value | |||
| Fixed rate debt | | $ | 11,864.8 | | $ | 13,131.5 |
| Variable rate debt subject to interest rate swaps | | 181.4 | | 181.4 | ||
| Total fixed rate debt (including interest rate swaps) | | 12,046.2 | | 13,312.9 | ||
| Variable rate debt | | 1,366.8 | | 1,366.8 | ||
| Total outstanding debt | | $ | 13,413.0 | | $ | 14,679.7 |
Interest rate derivatives and their fair values as of December 31, 2020 and December 31, 2018 were as follows (in thousands):
| | | | | | | | | | | | | | | | | | | |
|---|---|---|---|---|---|---|---|---|---|---|---|---|---|---|---|---|---|---|
| | | | | | | | | | | | | | | Fair Value at Significant Other | ||||
| Notional Amount | | | | | | | | | | Observable Inputs (Level 2) | ||||||||
| As of | | As of | | | | | | | | | | As of | | As of | ||||
| December 31, | | December 31, | | Type of | | Strike | | Effective | | Expiration | | December 31, | | December 31, | ||||
| 2020 | 2019 | Derivative | Rate | Date | Date | 2020 | 2019 | |||||||||||
| Currently-paying contracts | | | | | | | | | | | | | | | | | | |
| $ | — | | $ | 29,000 | (1) | Swap | 1.016 | | Apr 6, 2016 | | Jan 6, 2021 | | $ | — | | $ | 175 | |
| | — | | 75,000 | (1) | Swap | 1.164 | | Jan 15, 2016 | | Jan 15, 2021 | | — | | 345 | ||||
| | 104,000 | (1) | 300,000 | (1) | Swap | 1.435 | | Jan 15, 2016 | | Jan 15, 2023 | | (2,773) | | 945 | ||||
| | 77,352 | (2) | 75,825 | (2) | Swap | 0.779 | | Jan 15, 2016 | | Jan 15, 2021 | | (9) | | 931 | ||||
| $ | 181,352 | | $ | 479,825 | | | | $ | (2,782) | | $ | 2,396 |
| (1) | Represents debt which bears interest based on one-month U.S. LIBOR. |
|---|
| (2) | Represents debt which bears interest based on one-month CDOR. Translation to U.S. dollars is based on exchange rates of $0.79 to 1.00 CAD as of December 31, 2020 and $0.77 to 1.00 CAD as of December 31, 2019. |
|---|
Sensitivity to Changes in Interest Rates
The following table shows the effects if assumed changes in interest rates occurred, based on fair values and interest expense as of December 31, 2020:
| | | | |
|---|---|---|---|
| | Change | ||
| Assumed event | | ($ millions) | |
| Increase in fair value of interest rate swaps following an assumed 10% increase in interest rates | | $ | 0.1 |
| Decrease in fair value of interest rate swaps following an assumed 10% decrease in interest rates | | (0.1) | |
| Increase in annual interest expense on our debt that is variable rate and not subject to swapped interest following a 10% increase in interest rates | | 0.4 | |
| Decrease in annual interest expense on our debt that is variable rate and not subject to swapped interest following a 10% decrease in interest rates | | (0.4) | |
| Increase in fair value of fixed rate debt following a 10% decrease in interest rates | | 13.1 | |
| Decrease in fair value of fixed rate debt following a 10% increase in interest rates | | (28.2) |
Interest risk amounts were determined by considering the impact of hypothetical interest rates on our financial instruments. These analyses do not consider the effect of any change in overall economic activity that could occur in that environment. Further, in the event of a change of that magnitude, we may take actions to further mitigate our exposure to the change. However, due to the uncertainty of the specific actions that would be taken and their possible effects, these analyses assume no changes in our financial structure.
Foreign Currency Exchange Risk
For the years ended December 31, 2020, 2019 and 2018, we had foreign operations, including through our investments in unconsolidated joint ventures, in the United Kingdom, Ireland, France, the Netherlands, Germany, Switzerland, Canada, Singapore, Australia, Japan, Hong Kong, South Korea and Brazil and we have added Austria, Belgium, Denmark, Spain, Sweden and Kenya as part of the Interxion Combination, which closed in March 2020. As such, we are subject to risk from the effects of exchange rate movements of foreign currencies, which may affect future costs and cash flows. Our foreign operations are conducted in the British pound sterling, Euro, Canadian dollar, Brazilian real, Singapore dollar, Australian dollar, Japanese Yen, Hong Kong dollar, South Korean won, Swiss franc, Danish krone, Swedish krona and the Kenyan shilling. Our primary currency exposures are to the British pound sterling, Euro and the Singapore dollar. As a result of the Ascenty joint venture and deconsolidation of Ascenty, our exposure to foreign exchange risk related to the Brazilian real is limited to the impact that currency has on our share of the Ascenty
joint venture’s operations and financial position. We attempt to mitigate a portion of the risk of currency fluctuation by financing our investments in the local currency denominations and we may also hedge well-defined transactional exposures with foreign currency forwards or options, although there can be no assurances that these will be effective. As a result, changes in the relation of any such foreign currency to U.S. dollars may affect our revenues, operating margins and distributions and may also affect the book value of our assets and the amount of stockholders’ equity. For the years ended December 31, 2020, 2019 and 2018, operating revenues from properties outside the United States contributed $1,301.8 million, $627.4 million and $564.4 million, respectively, which represented 33.3%, 19.5% and 18.5% of our operating revenues, respectively. Net investment in properties outside the United States was $9.3 billion and $3.7 billion as of December 31, 2020 and December 31, 2019, respectively. Net assets in foreign operations were approximately $5.7 billion and $(1.4) billion as of December 31, 2020 and December 31, 2019, respectively.
Other
Certain operating costs incurred by us, such as electricity, are subject to price fluctuations caused by the volatility of underlying commodity prices. In 2020, we added 154 megawatts of renewable energy contracts across our U.S. portfolio, bringing the total executed under long-term contracts to 556 megawatts of renewable energy. In 2019, we entered into a power purchase agreement to secure the renewable energy attributes from a solar farm in Virginia. In 2018, we entered into power purchase agreements to secure the renewable energy attributes from a solar farm in North Carolina to support the renewable energy needs of a customer in Virginia.
Item 8. FINANCIAL STATEMENTS AND SUPPLEMENTARY DATA
INDEX TO THE CONSOLIDATED FINANCIAL STATEMENTS
Management’s Report on Internal Control over Financial Reporting
The management of Digital Realty Trust, Inc. (the Company) is responsible for establishing and maintaining adequate internal control over financial reporting, as such term is defined in Exchange Act Rules 13a-15(f) and 15(d)-15(f). Our internal control system was designed to provide reasonable assurance to the Company’s management and board of directors regarding the preparation and fair presentation of published financial statements.
All internal control systems, no matter how well designed, have inherent limitations. Therefore, even those systems determined to be effective can provide only reasonable assurance with respect to financial statement preparation and presentation.
Under the supervision and with the participation of management, including our Chief Executive Officer and Chief Financial Officer, we assessed the effectiveness of the Company’s internal control over financial reporting as of December 31, 2020. In making this assessment, we used the criteria set forth by the Committee of Sponsoring Organizations of the Treadway Commission in Internal Control—Integrated Framework (2013). We acquired Interxion and subsidiaries during the year ended December 31, 2020. We have excluded from our overall assessment of the Company's internal control over financial reporting as of December 31, 2020, internal control over financial reporting associated with Interxion and subsidiaries' total assets of $12 billion and total revenues of $691 million. Based on our assessment, management concluded that as of December 31, 2020, the Company’s internal control over financial reporting was effective based on those criteria.
Our independent registered public accounting firm has issued an audit report on the Company’s internal control over financial reporting. This report appears on page 101.
Management’s Report on Internal Control over Financial Reporting
The management of Digital Realty Trust, L.P. (the Operating Partnership) is responsible for establishing and maintaining adequate internal control over financial reporting, as such term is defined in Exchange Act Rules 13a-15(f) and 15(d)-15(f). Our internal control system was designed to provide reasonable assurance to the Operating Partnership’s management regarding the preparation and fair presentation of published financial statements.
All internal control systems, no matter how well designed, have inherent limitations. Therefore, even those systems determined to be effective can provide only reasonable assurance with respect to financial statement preparation and presentation.
Under the supervision and with the participation of management, including the Chief Executive Officer and Chief Financial Officer of our general partner, we assessed the effectiveness of the Operating Partnership’s internal control over financial reporting as of December 31, 2020. In making this assessment, we used the criteria set forth by the Committee of Sponsoring Organizations of the Treadway Commission in Internal Control—Integrated Framework (2013). We acquired Interxion and subsidiaries during the year ended December 31, 2020. We have excluded from our overall assessment of the Operating Partnership's internal control over financial reporting as of December 31, 2020, internal control over financial reporting associated with Interxion and subsidiaries' total assets of $12 billion and total revenues of $691 million. Based on our assessment, management concluded that as of December 31, 2020, the Operating Partnership’s internal control over financial reporting was effective based on those criteria.
Report of Independent Registered Public Accounting Firm
To the Stockholders and Board of Directors
Digital Realty Trust, Inc.:
Opinion on the Consolidated Financial Statements
We have audited the accompanying consolidated balance sheets of Digital Realty Trust, Inc. and subsidiaries (the Company) as of December 31, 2020 and 2019, the related consolidated income statements, and statements of comprehensive income, equity, and cash flows for each of the years in the three-year period ended December 31, 2020, and the related notes and financial statement schedule III, properties and accumulated depreciation (collectively, the consolidated financial statements). In our opinion, the consolidated financial statements present fairly, in all material respects, the financial position of the Company as of December 31, 2020 and 2019, and the results of its operations and its cash flows for each of the years in the three-year period ended December 31, 2020, in conformity with U.S. generally accepted accounting principles.
We also have audited, in accordance with the standards of the Public Company Accounting Oversight Board (United States) (PCAOB), the Company’s internal control over financial reporting as of December 31, 2020, based on the criteria established in Internal Control – Integrated Framework (2013) issued by the Committee of Sponsoring Organizations of the Treadway Commission, and our report dated March 1, 2021 expressed an unqualified opinion on the effectiveness of the Company’s internal control over financial reporting.
Change in Accounting Principle
The Company has changed its method of accounting for leases as of Janu
Showing the first 8K of 369K characters. Open the full section
Item 9. CHANGES IN AND DISAGREEMENTS WITH ACCOUNTANTS ON ACCOUNTING AND FINANCIAL DISCLOSURE
None.
Item 9A. CONTROLS AND PROCEDURES
Our Management’s Reports on Internal Control over Financial Reporting for Digital Realty Trust, Inc. and Digital Realty Trust, L.P. are included in Part II, Item 8, Financial Statements and Supplementary Data on page 98.
Evaluation of Disclosure Controls and Procedures (Digital Realty Trust, Inc.)
The Company maintains disclosure controls and procedures that are designed to ensure that information required to be disclosed in its reports filed under the Securities Exchange Act of 1934, as amended, is recorded, processed, summarized and reported within the time periods specified in the U.S. Securities and Exchange Commission’s rules and forms, and that such information is accumulated and communicated to its management, including its chief executive officer and chief financial officer, as appropriate, to allow timely decisions regarding required disclosure. In designing and evaluating the disclosure controls and procedures, the Company’s management recognizes that any controls and procedures, no matter how well designed and operated, can provide only reasonable assurance of achieving the desired control objectives, and its management is required to apply its judgment in evaluating the cost-benefit relationship of possible controls and procedures. Also, the Company has investments in certain unconsolidated entities, which are accounted for using the equity method of accounting. As the Company does not control or manage these entities, its disclosure controls and procedures with respect to such entities may be substantially more limited than those it maintains with respect to its consolidated subsidiaries.
As required by Rule 13a-15(b) or Rule 15d-15(b) of the Securities Exchange Act of 1934, as amended, management of the Company carried out an evaluation, under the supervision and with participation of its chief executive officer and chief financial officer, of the effectiveness of the design and operation of its disclosure controls and procedures that were in effect as of December 31, 2020. Based on the foregoing, the Company’s management concluded that its disclosure controls and procedures were effective at the reasonable assurance level.
Changes in Internal Control over Financial Reporting
There has not been any change in our internal control over financial reporting during the three months ended December 31, 2020, that has materially affected, or is reasonably likely to materially affect, our internal control over financial reporting.
Evaluation of Disclosure Controls and Procedures (Digital Realty Trust, L.P.)
The Operating Partnership maintains disclosure controls and procedures that are designed to ensure that information required to be disclosed in its reports filed under the Securities Exchange Act of 1934, as amended, is recorded, processed, summarized and reported within the time periods specified in the U.S. Securities and Exchange Commission’s rules and forms, and that such information is accumulated and communicated to its management, including the chief executive officer and chief financial officer of its general partner, as appropriate, to allow timely decisions regarding required disclosure. In designing and evaluating the disclosure controls and procedures, the Operating Partnership’s management recognizes that any controls and procedures, no matter how well designed and operated, can provide only reasonable assurance of achieving the desired control objectives, and its management is required to apply its judgment in evaluating the cost-benefit relationship of possible controls and procedures. Also, the Operating Partnership has investments in certain unconsolidated entities, which are accounted for using the equity method of accounting. As the Operating Partnership does not control or manage these entities, its disclosure controls and procedures with respect to such entities may be substantially more limited than those it maintains with respect to its consolidated subsidiaries.
As required by Rule 13a-15(b) or Rule 15d-15(b) of the Securities Exchange Act of 1934, as amended, management of the Operating Partnership carried out an evaluation, under the supervision and with participation of the chief executive officer and chief financial officer of its general partner, of the effectiveness of the design and operation of its disclosure controls and procedures that were in effect as of December 31, 2020. Based on the foregoing, the Operating Partnership’s management concluded that its disclosure controls and procedures were effective at the reasonable assurance level.
Changes in Internal Control over Financial Reporting
There has not been any change in our internal control over financial reporting during the three months ended December 31, 2020, that has materially affected, or is reasonably likely to materially affect, our internal control over financial reporting.
Item 9B. OTHER INFORMATION
Headquarter Relocation
Digital Realty has relocated its corporate headquarters from San Francisco, California, to Austin, Texas and plans for employee growth centered in Dallas. We are committed to fostering an inclusive and flexible workplace, which includes a broadly distributed workforce across the six continents, 24 countries, and 49 metropolitan areas where we have a presence. Where appropriate, we provide employees with the opportunity to live and work globally and across the U.S.—including Texas, where we have a longstanding, significant investment in terms of properties and talent. We will continue to support other employee hubs across the U.S., including the San Francisco Bay Area, where we will retain a significant presence. We believe our distributed office approach will help our employees maintain a high quality of life—including a suitable degree of flexibility in choosing where to live and work, depending on their roles.
Director and Officer Indemnification Agreement
On or about February 26, 2021, the Company entered into, or will enter into, new indemnification agreements with each of its directors and executive officers (each, an “Indemnitee”). The indemnification agreements provide that the Company will indemnify the Indemnitee against certain expenses and costs arising out of claims to which he or she becomes subject in connection with his or her service to the Company. The indemnification agreements contain customary terms and conditions and establish certain customary procedures and presumptions. Each new indemnification agreement with a current director or officer will replace and supersede the prior indemnification agreement between the Company and such director or officer, if such director or officer was a party to a prior indemnification agreement.
The above description of the indemnification agreements does not purport to be complete and is qualified in its entirety by reference to the form of indemnification agreement filed as Exhibit 10.59 hereto and incorporated herein by reference.
PART III
Item 10. DIRECTORS, EXECUTIVE OFFICERS AND CORPORATE GOVERNANCE
The information concerning our directors, executive officers and corporate governance required by Item 10 will be included in the Proxy Statement to be filed relating to our 2021 Annual Meeting of Stockholders and is incorporated herein by reference.
We have filed, as exhibits to this Annual Report on Form 10-K for the year ended December 31, 2020, the certifications of our Chief Executive Officer and Chief Financial Officer required under Section 302 of the Sarbanes Oxley Act to be filed with the Securities and Exchange Commission regarding the quality of our public disclosure. We have furnished to the Securities and Exchange Commission as exhibits to this Annual Report on Form 10-K for the year ended December 31, 2020, the certifications of our Chief Executive Officer and Chief Financial Officer required under Section 906 of the Sarbanes Oxley Act. In addition, as required by Section 303A.12 of the NYSE Listed Company Manual, our Chief Executive Officer made his annual certification to the NYSE stating that he was not aware of any violation by the Company of the corporate governance listing standards of the NYSE.
Item 11. EXECUTIVE COMPENSATION
The information concerning our executive compensation required by Item 11 will be included in the Proxy Statement to be filed relating to our 2021 Annual Meeting of Stockholders and is incorporated herein by reference.
Item 12. SECURITY OWNERSHIP OF CERTAIN BENEFICIAL OWNERS AND MANAGEMENT AND RELATED STOCKHOLDER MATTERS
The information concerning the security ownership of certain beneficial owners and management and related stockholder matters (including equity compensation plan information) required by Item 12 will be included in the Proxy Statement to be filed relating to our 2021 Annual Meeting of Stockholders and is incorporated herein by reference.
Item 13. CERTAIN RELATIONSHIPS AND RELATED TRANSACTIONS AND DIRECTOR INDEPENDENCE
The information concerning certain relationships, related transactions and director independence required by Item 13 will be included in the Proxy Statement to be filed relating to our 2021 Annual Meeting of Stockholders and is incorporated herein by reference.
Item 14. PRINCIPAL ACCOUNTING FEES AND SERVICES
The information concerning our principal accounting fees and services required by Item 14 will be included in the Proxy Statement to be filed relating to our 2021 Annual Meeting of Stockholders and is incorporated herein by reference.
PART IV
Item 15. EXHIBITS.
| 32.4 | | 18 U.S.C. § 1350 Certifications of Chief Financial Officer for Digital Realty Trust, L.P. |
|---|---|---|
| | | |
| 101 | | The following financial statements from Digital Realty Trust, Inc.’s and Digital Realty Trust, L.P.’s Form 10-K for the year ended December 31, 2020, formatted in Inline XBRL interactive data files: (i) Consolidated Balance Sheets as of December 31, 2020 and December 31, 2019; (ii) Consolidated Income Statements for each of the years in the three-year period ended December 31, 2020; (iii) Consolidated Statements of Equity and Comprehensive Income/Statements of Capital and Comprehensive Income for each of the years in the three-year period ended December 31, 2020; (iv) Consolidated Statements of Cash Flows for each of the years in the three-year period ended December 31, 2020; and (v) Notes to Consolidated Financial Statements. |
| | | |
| 104 | | Cover Page Interactive Data File (formatted as Inline XBRL and contained in Exhibit 101). |
| † | Management contract or compensatory plan or arrangement. |
|---|
| * | Portions of this exhibit have been omitted pursuant to a grant of confidential treatment and have been filed separately with the Securities and Exchange Commission. |
|---|
Item 16. FORM 10-K SUMMARY
None.
SIGNATURES
Pursuant to the requirements of Section 13 or 15(d) of the Securities Exchange Act of 1934, the registrant has duly caused this report to be signed on its behalf by the undersigned, thereunto duly authorized.
| | | |
|---|---|---|
| | | DIGITAL REALTY TRUST, INC. |
| | | |
| | By: | /s/ A. WILLIAM STEIN |
| | | A. William Stein Chief Executive Officer |
| | | |
| | Date: | March 1, 2021 |
POWER OF ATTORNEY
KNOW ALL PERSONS BY THESE PRESENTS, that each person whose signature appears below constitutes and appoints A. William Stein, Andrew P. Power and Joshua A. Mills, and each of them, with full power to act without the other, such person’s true and lawful attorneys-in-fact and agents, with full power of substitution and resubstitution, for him or her and in his or her name, place and stead, in any and all capacities, to sign this Form 10-K and any and all amendments thereto, and to file the same, with exhibits and schedules thereto, and other documents in connection therewith, with the Securities and Exchange Commission, granting unto said attorneys-in-fact and agents, and each of them, full power and authority to do and perform each and every act and thing necessary or desirable to be done in and about the premises, as fully to all intents and purposes as he or she might or could do in person, hereby ratifying and confirming all that said attorneys-in-fact and agents, or any of them, or their or his or her substitute or substitutes, may lawfully do or cause to be done by virtue hereof.
Pursuant to the requirements of the Securities Exchange Act of 1934, this report has been signed below by the following persons on behalf of the registrant and in the capacities and on the dates indicated.
| | | | | |
|---|---|---|---|---|
| Signature | Title | Date | ||
| | | | | |
| /s/ LAURENCE A. CHAPMAN | | Chairman of the Board | | March 1, 2021 |
| Laurence A. Chapman | | | | |
| | | | | |
| /s/ A. WILLIAM STEIN | | Chief Executive Officer and Director (Principal Executive Officer) | | March 1, 2021 |
| A. William Stein | | | | |
| | | | | |
| /s/ ANDREW P. POWER | | Chief Financial Officer (Principal Financial Officer) | | March 1, 2021 |
| Andrew P. Power | | | | |
| | | | | |
| /s/ MATTHEW MERCIER | | Senior Vice President, Finance and Accounting (Principal Accounting Officer) | | March 1, 2021 |
| Matthew Mercier | | | | |
| | | | | |
| /s/ ALEXIS BLACK BJORLIN | | Director | | March 1, 2021 |
| Alexis Black Bjorlin | | | | |
| | | | | |
| /s/ MICHAEL A. COKE | | Director | | March 1, 2021 |
| Michael A. Coke | | | | |
| | | | | |
| /s/ VeraLinn Jamieson | | Director | | March 1, 2021 |
| VeraLinn Jamieson | | | | |
| | | | | |
|---|---|---|---|---|
| Signature | Title | Date | ||
| | | | | |
| /s/ KEVIN J. KENNEDY | | Director | | March 1, 2021 |
| Kevin J. Kennedy | | | | |
| | | | | |
| /s/ WILLIAM G. LAPERCH | | Director | | March 1, 2021 |
| William G. LaPerch | | | | |
| | | | | |
| /s/ JEAN F.H.P. MANDEVILLE | | Director | | March 1, 2021 |
| Jean F.H.P. Mandeville | | | | |
| | | | | |
| /s/ AFSHIN MOHEBBI | | Director | | March 1, 2021 |
| Afshin Mohebbi | | | | |
| | | | | |
| /s/ MARK R. PATTERSON | | Director | | March 1, 2021 |
| Mark R. Patterson | | | | |
| | | | | |
| /s/ MARY HOGAN PREUSSE | | Director | | March 1, 2021 |
| Mary Hogan Preusse | | | | |
| | | | | |
SIGNATURES
Pursuant to the requirements of Section 13 or 15(d) of the Securities Exchange Act of 1934, the registrant has duly caused this report to be signed on its behalf by the undersigned, thereunto duly authorized.
| | | |
|---|---|---|
| | DIGITAL REALTY TRUST, L.P. | |
| | | |
| | By: | Digital Realty Trust, Inc., |
| | Its | General Partner |
| | | |
| | By: | /s/ A. WILLIAM STEIN |
| | | A. William Stein Chief Executive Officer |
| | | |
| | Date: | March 1, 2021 |
POWER OF ATTORNEY
KNOW ALL PERSONS BY THESE PRESENTS, that each person whose signature appears below constitutes and appoints A. William Stein, Andrew P. Power and Joshua A. Mills, and each of them, with full power to act without the other, such person’s true and lawful attorneys-in-fact and agents, with full power of substitution and resubstitution, for him or her and in his or her name, place and stead, in any and all capacities, to sign this Form 10-K and any and all amendments thereto, and to file the same, with exhibits and schedules thereto, and other documents in connection therewith, with the Securities and Exchange Commission, granting unto said attorneys-in-fact and agents, and each of them, full power and authority to do and perform each and every act and thing necessary or desirable to be done in and about the premises, as fully to all intents and purposes as he or she might or could do in person, hereby ratifying and confirming all that said attorneys-in-fact and agents, or any of them, or their or his or her substitute or substitutes, may lawfully do or cause to be done by virtue hereof.
Pursuant to the requirements of the Securities Exchange Act of 1934, this report has been signed below by the following persons on behalf of the registrant and in the capacities and on the dates indicated.
| | | | | |
|---|---|---|---|---|
| Signature | Title | Date | ||
| | | | | |
| /s/ LAURENCE A. CHAPMAN | | Chairman of the Board | | March 1, 2021 |
| Laurence A. Chapman | | | | |
| | | | | |
| /s/ A. WILLIAM STEIN | | Chief Executive Officer and Director (Principal Executive Officer) | | March 1, 2021 |
| A. William Stein | | | | |
| | | | | |
| /s/ ANDREW P. POWER | | Chief Financial Officer (Principal Financial Officer) | | March 1, 2021 |
| Andrew P. Power | | | | |
| | | | | |
| /s/ MATTHEW MERCIER | | Senior Vice President, Finance and Accounting (Principal Accounting Officer) | | March 1, 2021 |
| Matthew Mercier | | | | |
| | | | | |
| /s/ ALEXIS BLACK BJORLIN | | Director | | March 1, 2021 |
| Alexis Black Bjorlin | | | | |
| | | | | |
|---|---|---|---|---|
| Signature | Title | Date | ||
| | | | | |
| /s/ MICHAEL A. COKE | | Director | | March 1, 2021 |
| Michael A. Coke | | | | |
| | | | | |
| /s/ VeraLinn Jamieson | | Director | | March 1, 2021 |
| VeraLinn Jamieson | | | | |
| | | | | |
| /s/ KEVIN J. KENNEDY | | Director | | March 1, 2021 |
| Kevin J. Kennedy | | | | |
| | | | | |
| /s/ WILLIAM G. LAPERCH | | Director | | March 1, 2021 |
| William G. LaPerch | | | | |
| | | | | |
| /s/ JEAN F.H.P. MANDEVILLE | | Director | | March 1, 2021 |
| Jean F.H.P. Mandeville | | | | |
| | | | | |
| /s/ AFSHIN MOHEBBI | | Director | | March 1, 2021 |
| Afshin Mohebbi | | | | |
| | | | | |
| /s/ MARK R. PATTERSON | | Director | | March 1, 2021 |
| Mark R. Patterson | | | | |
| | | | | |
| /s/ MARY HOGAN PREUSSE | | Director | | March 1, 2021 |
| Mary Hogan Preusse | | | | |
| | | | | |