 filings.tools
Item 5. Market for Registrant’s Common Equity, Related Stockholder Matters and Issuer Purchases of Equity Securities
4K characters. Original on sec.gov · Markdown
Item 5. Market for Registrant’s Common Equity, Related Stockholder Matters and Issuer Purchases of Equity Securities
Our common stock is traded on The Nasdaq Global Select Market® under the symbol “DLTR.” As of March 10, 2021, we had 2,288 shareholders of record.
Issuer Purchases of Equity Securities
The following table presents our share repurchase activity during the fourth quarter of 2020:
| Fiscal Period | Total number of shares purchased | Average price paid per share | Total number of shares purchased as part of publicly announced plans or programs | Approximate dollar value of shares that may yet be purchased under the plans or programs (in millions) | ||||||||||||||||||||||
| November 1, 2020 - November 28, 2020 | — | $ | — | — | $ | 600.0 | ||||||||||||||||||||
| November 29, 2020 - January 2, 2021 | 896,698 | 109.23 | 896,698 | 502.1 | ||||||||||||||||||||||
| January 3, 2021 - January 30, 2021 | 931,476 | 109.56 | 931,476 | 400.0 | ||||||||||||||||||||||
| Total | 1,828,174 | $ | 109.40 | 1,828,174 | $ | 400.0 |
During fiscal 2020 and 2019, we repurchased 3,982,478 and 1,967,355 shares of common stock, respectively, on the open market at a total cost of $400.0 million and $200.0 million, respectively. We did not repurchase any shares of common stock in fiscal 2018.
As of January 30, 2021, we had $400.0 million remaining under the Board repurchase authorization. Subsequently, on March 2, 2021, the Board increased the share repurchase authorization by $2.0 billion resulting in a total share repurchase authorization of $2.4 billion. The repurchase authorization does not have an expiration date.
Stockholder Matters
We anticipate that substantially all of our cash flow from operations in the foreseeable future will be retained for the development and expansion of our business, the repayment of indebtedness and, as authorized by our Board of Directors, the repurchase of stock. We do not anticipate paying cash dividends on our common stock in the foreseeable future.
Stock Performance Graph
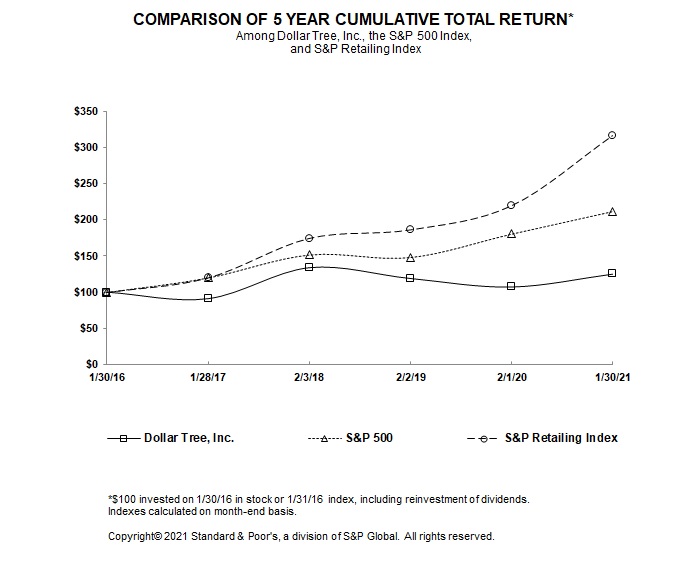
The following graph sets forth the yearly percentage change in the cumulative total shareholder return on our common stock during the five fiscal years ended January 30, 2021, compared with the cumulative total returns of the S&P 500 Index and the S&P Retailing Index. The comparison assumes that $100 was invested in our common stock on January 30, 2016, and, in each of the foregoing indices on January 30, 2016, and that dividends were reinvested. The stock price performance shown in the graph is not necessarily indicative of future price performance.
| Year Ended | ||||||||||||||||||||
| January 30, 2016 | January 28, 2017 | February 3, 2018 | February 2, 2019 | February 1, 2020 | January 30, 2021 | |||||||||||||||
| Dollar Tree, Inc. | $ | 100.00 | $ | 91.06 | $ | 133.83 | $ | 118.90 | $ | 107.07 | $ | 125.01 | ||||||||
| S&P 500 Index | 100.00 | 120.04 | 151.74 | 148.23 | 180.37 | 211.48 | ||||||||||||||
| S&P Retailing Index | 100.00 | 120.09 | 174.49 | 186.29 | 219.46 | 316.05 |
Previous: Item 4. Mine Safety Disclosures · Next: Item 6. Selected Financial Data