 filings.tools
Dollar Tree 10-K 2023-01-28
Filed 2023-03-10. 23 sections, 312K characters. Original on sec.gov · Markdown · JSON
Cover and table of contents
UNITED STATES
SECURITIES AND EXCHANGE COMMISSION
Washington, D.C. 20549
FORM 10-K
(Mark One)
| ☒ | ANNUAL REPORT PURSUANT TO SECTION 13 OR 15(d) OF THE SECURITIES EXCHANGE ACT OF 1934 |
For the fiscal year ended January 28, 2023
or
| ☐ | TRANSITION REPORT PURSUANT TO SECTION 13 OR 15(d) OF THE SECURITIES EXCHANGE ACT OF 1934 |
For the transition period from to
Commission file number: 0-25464

DOLLAR TREE, INC.
(Exact name of registrant as specified in its charter)
| Virginia | 26-2018846 | |||||||
| (State or other jurisdiction of incorporation or organization) | (I.R.S. Employer Identification No.) |
| 500 Volvo Parkway | |||||||||||
| Chesapeake, | Virginia | 23320 | |||||||||
| (Address of principal executive offices) | (Zip Code) |
Registrant’s telephone number, including area code: (757) 321-5000
Securities registered pursuant to Section 12(b) of the Act:
| Title of each class | Trading symbol(s) | Name of each exchange on which registered | ||||||
| Common Stock, par value $.01 per share | DLTR | NASDAQ Global Select Market |
Securities registered pursuant to section 12(g) of the Act:
None
(Title of Class)
Indicate by check mark if the registrant is a well-known seasoned issuer, as defined in Rule 405 of the Securities Act.
| Yes | ☒ | No | ☐ |
Indicate by check mark if the registrant is not required to file reports pursuant to Section 13 or Section 15(d) of the Act.
| Yes | ☐ | No | ☒ |
Indicate by check mark whether the registrant (1) has filed all reports required to be filed by Section 13 or 15(d) of the Securities Exchange Act of 1934 during the preceding 12 months (or for such shorter period that the registrant was required to file such reports), and (2) has been subject to such filing requirements for the past 90 days.
| Yes | ☒ | No | ☐ |
Indicate by check mark whether the registrant has submitted electronically every Interactive Data File required to be submitted pursuant to Rule 405 of Regulation S-T (§ 232.405 of this chapter) during the preceding 12 months (or for such shorter period that the registrant was required to submit such files).
| Yes | ☒ | No | ☐ |
Indicate by check mark whether the registrant is a large accelerated filer, an accelerated filer, a non-accelerated filer, a smaller reporting company, or an emerging growth company. See the definitions of “large accelerated filer,” “accelerated filer,” “smaller reporting company,” and “emerging growth company” in Rule 12b-2 of the Exchange Act.
| Large accelerated filer | ☒ | Accelerated filer | ☐ | ||||||||
| Non-accelerated filer | ☐ | Smaller reporting company | ☐ | ||||||||
| Emerging growth company | ☐ |
If an emerging growth company, indicate by check mark if the registrant has elected not to use the extended transition period for complying with any new or revised financial accounting standards provided pursuant to Section 13(a) of the Exchange Act.
| ☐ |
Indicate by check mark whether the registrant has filed a report on and attestation to its management’s assessment of the effectiveness of its internal control over financial reporting under Section 404(b) of the Sarbanes-Oxley Act (15 U.S.C. 7262(b)) by the registered public accounting firm that prepared or issued its audit report.
| ☒ |
Indicate by check mark whether the registrant is a shell company (as defined in Rule 12b-2 of the Act).
| Yes | ☐ | No | ☒ |
The aggregate market value of common stock held by non-affiliates of the registrant on July 29, 2022, the last business day of the registrant’s most recently completed second fiscal quarter, was $35,108,117,366, based upon the closing sale price for the registrant’s common stock on such date. For purposes of this computation, all executive officers and directors have been deemed to be affiliates. Such determination should not be deemed to be an admission that such executive officers and directors are, in fact, affiliates of the registrant.
On March 3, 2023, there were 221,227,564 shares of the registrant’s common stock outstanding.
DOCUMENTS INCORPORATED BY REFERENCE
The information called for in Items 10, 11, 12, 13 and 14 of Part III, to the extent not set forth herein, is incorporated by reference to the definitive Proxy Statement for the 2023 Annual Meeting of Stockholders, which will be filed with the Securities and Exchange Commission within 120 days of the registrant’s fiscal year ended January 28, 2023.
DOLLAR TREE, INC.
FORM 10-K
FOR THE FISCAL YEAR ENDED JANUARY 28, 2023
TABLE OF CONTENTS
Cautionary Note Regarding Forward-Looking Statements
This Annual Report on Form 10-K contains “forward-looking statements” as that term is used in the Private Securities Litigation Reform Act of 1995. Forward-looking statements can be identified by the fact that they address future events, developments and results and do not relate strictly to historical facts. Any statements contained herein that are not statements of historical facts may be deemed to be forward-looking statements. Forward-looking statements include, without limitation, statements preceded by, followed by or including words such as “believe,” “anticipate,” “expect,” “intend,” “plan,” “view,” “target” or “estimate,” “may,” “will,” “should,” “predict,” “possible,” “potential,” “continue,” “strategy,” and similar expressions. For example, our forward-looking statements include, without limitation, statements regarding:
-
The potential effect of general business or economic conditions on our business, including the direct and indirect effects of inflation, labor shortages, consumer spending levels, and unemployment in our markets;
-
The uncertainty of the impact of the COVID-19 pandemic on our business and results of operations, including uncertainties surrounding disruptions in our supply chain or sources of supply;
-
Our expectations regarding import and domestic freight costs and fuel costs in 2023;
-
Our expectations regarding increased expenses for higher wages and bonuses paid to associates, including increases in the minimum wage by States and localities, potential federal legislation increasing the minimum wage, and a potential increase in the minimum salary for exempt store managers;
-
Our growth plans, including our plans to add, renovate, re-banner, expand, remodel, relocate or close stores and any related costs or charges, our leasing strategy for future expansion, and our ability to renew leases at existing store locations;
-
Our anticipated sales, comparable store net sales, net sales growth, gross profit margin, costs of goods sold (including product mix), shrink rates, earnings and earnings growth, inventory levels, selling, general and administrative and other fixed costs, and our ability to leverage those costs;
-
The expected and possible outcome, costs, and impact of pending or potential litigation, arbitrations, other legal proceedings or governmental investigations, including (a) U.S. Food and Drug Administration (“FDA”) proceedings arising out of or relating to the inspection of our West Memphis, Arkansas Family Dollar distribution center (“Arkansas FDA Matter”) and the retail product recall we initiated in February 2022 in connection with the Arkansas FDA Matter, (b) a proposed consolidated class action complaint filed against Family Dollar pertaining to the circumstances underlying the Arkansas FDA Matter, and (c) the federal grand jury subpoena and related U.S. Department of Justice investigation relating to issues associated with our West Memphis, Arkansas Family Dollar distribution center;
-
Our plans to renovate existing Family Dollar stores and build new stores in the H2 store format, and the performance of that format on our results of operations;
-
Our plans relating to new store openings and new store concepts such as Dollar Tree Plus and our Combo Store format;
-
Our plans and expectations regarding our current initiatives and future strategic investments and the uncertainty with respect to the amount, timing and impact of those initiatives and investments on our business and results of operations;
-
The impact of trade relations between the United States and China, including the effect of Section 301 tariffs on Chinese goods imposed by the United States, and other potential impediments to imports;
-
The reliability of, and cost associated with, our sources of supply, particularly imported goods such as those sourced from China;
-
The average size and suitability of our retail stores to be added in 2023;
-
Our cash needs, including our ability to fund our future capital expenditures, working capital requirements and repurchases of common stock under our repurchase program, and our expectations regarding potential increases in interest rates and the effect on our revolving credit facility;
-
Our expectations regarding the construction of new distribution centers, the expansion of existing distribution centers, and the capabilities of our distribution center network;
-
Our expectations regarding higher commodity and other costs associated with the build-out of new stores and the renovation of existing stores, limitations on the availability of certain fixtures and equipment, and construction, permitting and inspection delays related to new store openings;
-
Our expectations regarding competition and our potential for long-term growth;
-
Management’s estimates and expectations as they relate to income tax liabilities, deferred income taxes, uncertain tax positions, and recognition of stock-based compensation; and
-
Management’s estimates associated with our critical accounting estimates, including inventory valuation, self-insurance liabilities and valuations for our goodwill and indefinite-lived intangible assets impairment analyses.
A forward-looking statement is neither a prediction nor a guarantee of future results, events or circumstances. You should not place undue reliance on forward-looking statements, which speak only as of the date of this Annual Report on Form 10-K. Our forward-looking statements are all based on currently available operating, financial and business information. The outcome of the events described in these forward-looking statements is subject to a variety of factors, including, but not limited to, the risks and uncertainties discussed under “Item 1A. Risk Factors,” “Item 7. Management’s Discussion and Analysis of Financial Condition and Results of Operations” and elsewhere in this Form 10-K.
We cannot assure you that the results, events and circumstances reflected in the forward-looking statements will be achieved or occur, and actual results, events or circumstances could differ materially from those described in the forward-looking statements. Moreover, new risks and uncertainties emerge from time to time and it is not possible for us to predict all risks and uncertainties that could have an impact on our forward-looking statements.
We do not undertake to publicly update or revise any forward-looking statements after the date of this Form 10-K, whether as a result of new information, future events, or otherwise.
Investors should also be aware that while we do, from time to time, communicate with securities analysts and others, it is against our policy to disclose to them any material, nonpublic information or other confidential commercial information. Accordingly, shareholders should not assume that we agree with any statement or report issued by any securities analyst regardless of the content of the statement or report. Furthermore, we have a policy against confirming projections, forecasts or opinions issued by others. Thus, to the extent that reports issued by securities analysts contain any projections, forecasts or opinions, such reports are not our responsibility.
Introductory Note
Unless otherwise stated, references to “we,” “our” and “us” generally refer to Dollar Tree, Inc. and its direct and indirect subsidiaries on a consolidated basis. Unless specifically indicated otherwise, any references to “2023” or “fiscal 2023,” “2022” or “fiscal 2022,” “2021” or “fiscal 2021,” and “2020” or “fiscal 2020,” relate to as of or for the years ended February 3, 2024, January 28, 2023, January 29, 2022 and January 30, 2021, respectively.
PART I
Item 1. Business
Overview
We are a leading operator of discount variety stores with a solid history of growth and performance. Our stores operate under the brand names of Dollar Tree, Family Dollar and Dollar Tree Canada. At January 28, 2023, we operated 16,340 discount variety retail stores across 48 states and five Canadian provinces and over the long-term, we believe that the market can support more than 10,000 Dollar Tree stores and 15,000 Family Dollar stores across the United States, and approximately 1,000 Dollar Tree stores in Canada. We believe the convenience and value we offer are key factors in serving and growing our base of loyal customers.
We operate in two reporting business segments: Dollar Tree and Family Dollar. For discussion of the operating results of our reporting business segments, refer to “Item 7. Management’s Discussion and Analysis of Financial Condition and Results of Operations” under the caption “Segment Information” and Note 11 to our consolidated financial statements.
We execute a dual-banner strategy that aims to offer the best of our brands in various store formats to serve customers in all types of geographic markets. Dollar Tree is the leading operator of discount variety stores offering merchandise predominantly at the fixed price point of $1.25. Dollar Tree stores serve customers with a broad range of income levels in suburban locations, striving continuously to “Wow” the customer with a compelling, fun and fresh merchandise assortment comprised of a variety of the things the customer wants and needs, all at incredible values in bright, clean and friendly stores. Family Dollar operates general merchandise retail discount stores providing customers with a selection of competitively-priced merchandise in convenient neighborhood stores. Family Dollar primarily serves a lower than average income customer in urban and rural locations, offering great values on everyday items.
We are committed to growing our combined business through new store openings and through our store relocation, expansion and remodel program. We plan to open new stores in underserved markets and to strategically increase our presence in our existing markets. We are executing our strategic initiatives including Dollar Tree Plus and the Family Dollar H2 and Combination Store (or Combo Store) format initiatives. We are focused on refining our assortment in every store by leveraging the complementary merchandise expertise of each segment, including Dollar Tree’s sourcing and product development expertise and Family Dollar’s consumer package goods and national brands sourcing expertise. These initiatives are discussed further in the overview of each segment below.
Corporate Culture
We believe that honesty and integrity, and treating people fairly and with respect are core values within our corporate culture. We believe that running a business, and certainly a public company, carries with it a responsibility to be above reproach when making operational and financial decisions. Our executive management team visits and shops at our stores like every customer, and ideas and individual creativity on the part of our associates are encouraged, particularly from our store managers who best know their stores and their customers. We have standards for store displays, merchandise presentation, and store operations. We maintain an open-door policy for all associates. Our distribution centers are operated based on objective measures of performance and our store support center associates are available to assist associates in our stores and distribution centers. For more information, see Human Capital Resources below.
Dollar Tree
The Dollar Tree segment includes 8,134 stores operating under the Dollar Tree and Dollar Tree Canada brands, 15 distribution centers in the United States and two in Canada. Our stores predominantly range from 8,000 - 10,000 selling square feet. During the third quarter of 2021, we announced our new $1.25 price point initiative and we completed the rollout of this initiative to all Dollar Tree stores in the United States during the first quarter of fiscal 2022, increasing the price point on a majority of our $1.00 merchandise to $1.25. During fiscal 2022, we began investing in new products and modifying existing products to provide greater value for our customers and increase customer traffic and store productivity. We continue to expand our Dollar Tree Plus initiative which provides our customers with extraordinary value in discretionary and consumable categories priced at the $3, $4 and $5 price points. During 2021, we entered into a partnership with Instacart and as of January 28, 2023, our customers can shop online and receive same-day delivery from more than 7,800 Dollar Tree stores without having to visit a store. We are the owners of several trademarks including “Dollar Tree” and the “Dollar Tree” logo.
In our Dollar Tree Canada stores, we sell items principally for $1.50(CAD) or less. Our revenue and assets in Canada are not material.
We strive to exceed our customers’ expectations of the variety and quality of products they can purchase by offering items we believe typically sell for higher prices elsewhere. Merchandise imported directly typically accounts for approximately 41%-43% of our total retail value purchases, with the remaining merchandise purchased domestically. Our domestic purchases include basic, home,
closeouts and promotional merchandise. We believe our mix of imported and domestic merchandise affords our buyers flexibility that enables them to consistently exceed our customers’ expectations. In addition, direct relationships with manufacturers permit us to select from a broad range of products and customize packaging, product sizes and package quantities that best meet our customers’ needs.
We carry approximately 8,000 items in our Dollar Tree stores and as of the end of fiscal 2022 approximately 25% of our items were automatically replenished. The remaining items are pushed to the stores and a portion can be reordered by our store managers on a weekly basis. Through automatic replenishment and our store managers’ ability to order product, each store manager is able to satisfy the demands of their particular customer base.
We maintain a balanced selection of products within traditional variety store categories. We offer a wide selection of everyday basic products and we supplement these basic, everyday items with seasonal, closeout and promotional merchandise. We attempt to keep certain basic consumable merchandise in our stores continuously to establish our stores as a destination and increase traffic in our stores. Closeout and promotional merchandise is purchased opportunistically and represents less than 10% of our purchases.
The merchandise mix in our Dollar Tree stores consists of:
-
consumable merchandise, which includes everyday consumables such as household paper and chemicals, food, candy, health and personal care products, and in most stores, frozen and refrigerated food;
-
variety merchandise, which includes toys, durable housewares, gifts, stationery, party goods, greeting cards, softlines, arts and crafts supplies and other items; and
-
seasonal goods, which include, among others, Christmas, Easter, Halloween and Valentine’s Day merchandise.
For information regarding the amounts and percentages of our net sales contributed by the above merchandise categories for the last three fiscal years, please refer to Note 11 to our consolidated financial statements.
Family Dollar
In our 8,206 Family Dollar stores, we sell merchandise at prices that generally range from $1.00 to $10.00. Our stores predominantly range from 6,000 - 8,000 selling square feet. The Family Dollar segment consists of our store operations under the Family Dollar brand and ten distribution centers. We have two primary initiatives for our Family Dollar stores, the H2 format and our Combo Store format, both of which incorporate elements of our Dollar Tree stores into Family Dollar stores. The H2 model stores include Dollar Tree $1.25 merchandise items and establish a minimum number of freezer and cooler doors throughout the store. As of January 28, 2023, we operated approximately 4,360 H2 stores. The Combo Store format, which was designed specifically for small towns and rural communities with populations of 3,000 to 4,000 residents, blends Family Dollar’s great value and assortment with select Dollar Tree merchandise categories under one roof. As of January 28, 2023, we operated approximately 810 Combo Stores. Our new and renovated H2 and Combo Stores have higher sales and operating income margins compared with legacy Family Dollar stores. During 2021, we entered into a partnership with Instacart and as of January 28, 2023, our customers can shop online and receive same-day delivery from more than 7,500 Family Dollar stores without having to visit a store. We are the owners of the trademarks “Family Dollar,” “Family Dollar Stores” and other names and designs of certain merchandise sold in Family Dollar stores.
Our Family Dollar stores provide customers with a quality, high-value assortment of basic necessities and seasonal merchandise. We offer competitively-priced national brands from leading manufacturers alongside name brand equivalent-value, lower-priced private labels. We purchase merchandise from a wide base of suppliers and generally have not experienced difficulty in obtaining adequate quantities of merchandise. In fiscal 2022, we purchased approximately 15% of our merchandise through our relationship with McLane Company, Inc., which distributes consumable merchandise from multiple manufacturers. In addition, merchandise imported directly typically accounts for approximately 15%-17% of our total retail value purchases.
While the number of items in a given store can vary based on the store’s size, geographic location, merchandising initiatives and other factors, our typical Family Dollar store generally carries approximately 7,600 basic items alongside items that are ever-changing and seasonally-relevant throughout the year.
The merchandise mix in our Family Dollar stores consists of:
-
consumable merchandise, which includes food and beverages, tobacco, health and personal care products, household chemicals, paper products, hardware and automotive supplies, diapers, batteries, and pet food and supplies;
-
home products, which include housewares, home décor, giftware, and domestics, including comforters, sheets and towels;
-
apparel and accessories merchandise, which includes clothing, fashion accessories and shoes; and
-
seasonal and electronics merchandise, which includes Christmas, Easter, Halloween and Valentine’s Day merchandise, personal electronics, including pre-paid cellular phones and services, stationery and school supplies, and toys.
For information regarding the amounts and percentages of our net sales contributed by the above merchandise categories for the last three fiscal years, please refer to Note 11 to our consolidated financial statements.
Purchasing
We believe our substantial buying power and our flexibility in making sourcing decisions contributes to our successful purchasing strategy, which includes targeted merchandise margin goals by category. We leverage our merchandising team to source products that can be sold in both Dollar Tree and Family Dollar stores. We also believe our ability to negotiate with our vendor partners enables us to manage the margin impact of economic pressures. We buy products on an order-by-order basis and have no material long-term purchase contracts or other assurances of continued product supply or guaranteed product cost. Historically, no vendor has accounted for more than 10% of total merchandise purchased by us.
Our merchandise systems provide us with valuable sales information to assist our buyers and improve product allocation to our stores. We use this information to target our inventory levels in our distribution centers and stores in order to plan for capacity and labor needs.
Distribution
A strong and efficient distribution network is critical to our ability to grow and to maintain a low-cost operating structure. We currently operate 25 distribution centers in the United States, 15 of which are primarily dedicated to serving our Dollar Tree stores and ten distribution centers primarily serve our Family Dollar stores. We expect future distribution centers to be built with the capability to service both Dollar Tree and Family Dollar stores. New distribution sites are strategically located to reduce the distance between the distribution centers and stores, maintain flexibility and improve efficiency in our store service areas. We expect to complete a significant expansion of our Ocala, Florida distribution center in 2024 which will include enhanced automation.
Our Dollar Tree stores receive approximately 92% of their inventory from our distribution centers via contract carriers and our Family Dollar stores receive approximately 70% of their inventory from our distribution centers. The remaining store inventory, primarily perishable consumable items and other vendor-maintained display items, are delivered directly to our stores from vendors or third party distributors. Our Family Dollar stores receive approximately 15% of their merchandise from McLane Company, Inc. For more information on our distribution center network, see “Item 2. Properties.”
Seasonality
For information on the impact of seasonality, see “Item 1A. Risk Factors” and “Item 7. Management’s Discussion and Analysis of Financial Condition and Results of Operations.”
Competition
Our segment of the retail industry is fragmented and highly competitive and we expect competition to increase in the future. We operate in the discount retail sector, which is currently and is expected to continue to be highly competitive with respect to price, store location, merchandise quality, assortment and presentation, and customer service, including merchandise delivery and checkout options. Our competitors include single-price dollar stores, multi-price dollar stores, mass merchandisers, online retailers, discount retailers, drug stores, convenience stores, independently-operated discount stores, grocery stores and a wide variety of other retailers. In addition, several competitors have sections within their stores devoted to “one dollar” price point merchandise, which further increases competition. We believe we differentiate ourselves from other retailers by providing high-value, high-quality, low-cost merchandise in attractively-designed stores that are conveniently located. Our sales and profits could be reduced by increases in competition. There are no significant economic barriers for others to enter our retail sector.
Government Regulation
We are subject to a wide variety of local, state and federal laws and regulations within the United States and Canada. Compliance with these laws and regulations often requires the dedication of our associates’ time and attention, as well as financial resources. Historically, compliance with these laws and regulations did not have a material effect on our capital expenditures, earnings or competitive position; however, in fiscal 2022, we closed our West Memphis, Arkansas distribution center (“DC 202”) following observations of rodent infestation at the facility as well as other items that required remediation. During the first quarter of fiscal 2022, approximately 400 stores serviced by DC 202 were temporarily closed in connection with a retail-level product recall. We incurred costs related to the product recall, remediation efforts and asset impairment during fiscal 2022. Remediation-related costs included merchandise disposal costs, payroll and legal costs as well as incremental freight costs resulting from stores being serviced by distribution centers which are farther away.
Human Capital Resources
Our business success is built upon our dedicated, passionate and diverse associates who work and live in the communities we serve. Our goal is to provide a working environment that is welcoming and inclusive, offers competitive pay and benefits, supports the growth and development of our associates, and affirms our corporate values and mission. We recruit and hire in the communities we serve using local job fairs, social media as well as local community service partners to provide part-time and full-time jobs that can become lasting careers. Our Human Resources team, with oversight from our Board of Directors and its committees, develops and executes programs for compensation and benefits, onboarding and training, professional development, performance management, retention and succession planning.
We greatly value our people and invest in their personal well-being and professional growth through various human capital programs and initiatives, including the following:
-
Compensation, benefits and well-being. We are committed to providing market-competitive pay for all positions and we are a pay-for-performance organization, offering performance-based compensation opportunities at nearly all levels of the organization, including certain hourly-paid positions. We strive to ensure gender and racial pay equity for employees performing equal or substantially similar work. Eligible associates can participate in our Retirement Savings Plan, which provides a dollar for dollar match on the first 5% of employee contributions and all associates can participate in our Employee Stock Purchase Plan. All full-time and part-time associates are eligible for competitive health and welfare benefits, including medical, dental and vision. Associates may be eligible for other benefits including disability and life insurance as well as primary caregiver and parental leave. We have a program that provides financial support to associates recovering from natural disasters and personal hardships as well as a scholarship program for associates with children pursuing higher education. We also offer a voluntary benefit called “pay any day,” which allows associates to advance their payday earnings for flexibility in meeting their bills and expenses.
-
Talent development and retention. We believe in the growth and development of our associates and are committed to building a culture of learning in which associates are given the opportunity to enhance their skills at every stage of their career. To support this objective, we provide a multitude of professional and leadership development experiences, including online and instructor-led trainings, tuition reimbursement for graduate, undergraduate, GED and English as a Second Language classes, and discounted tuition at over 200 colleges and universities for our associates and their families. Retention of our associates is a focus for all leaders and we continue to strive to improve our turnover rate. To identify high-potential talent, leadership assesses talent at the store manager level and above on a regular basis through structured talent reviews and succession planning paired with customized development plans. This focus on talent resulted in more than 52,600 promotions in fiscal 2022.
-
Diversity, equity and inclusion. We believe our associates should mirror our diverse customer base and the communities we serve. Our goal is to create and support a culture of inclusion within a diverse workforce where the unique skills and perspectives of our associates and customers are understood, respected and appreciated. To further this goal, we established a Diversity, Equity and Inclusion (DEI) Executive Council comprised of senior leaders from every department. The DEI Executive Council provides strategic and tactical leadership support to our Chief Diversity Officer (CDO) on all matters related to DEI. The CDO is charged with creating and implementing DEI-focused strategies consistent with our business goals, catalyzing cultural change throughout the organization and driving accountability at the senior management level for progress on key DEI objectives. In addition, we provide associate training on DEI topics and have formed a number of associate resource groups. Our objective is to build a platform to encourage professional development, support community outreach, cultivate mentoring, attract diverse talent and promote cross-functional teamwork for all employees. Each associate resource group will be supported by an executive sponsor who is a member of the DEI Executive Council or senior leadership team.
-
Workplace safety. We strive to maintain a safe working environment for our associates with a safety program designed to promote accident prevention. Among other things, our environmental health and safety department establishes standard safety protocols and operating procedures across the company, and our field managers are responsible for overseeing associate safety training and conducting store safety audits. In response to the COVID-19 pandemic, we implemented several changes to protect our associates and our customers and to ensure adherence to Centers for Disease Control and Prevention recommendations.
-
Communication and Engagement. We believe that our associates are the most critical part of our business, and supporting an engaging culture where people can do their best work is a top priority for our leaders. Over the last year we have added new channels to foster two-way dialogue and ensure we are listening to our associates and taking action on their feedback. A recent culture assessment helped identify areas of focus and prepare the organization for a robust employee engagement survey process to close the gap between our current culture and the culture we aspire to have.
As of January 28, 2023, we employed more than 207,500 associates, as follows:
| Store and Distribution Center Associates | ||||||||||||||||||||||||||
| Dollar Tree | Family Dollar | Store Support Center Associates | Total | |||||||||||||||||||||||
| Full-time Associates | 29,669 | 32,602 | 2,754 | 65,025 | ||||||||||||||||||||||
| Part-time Associates | 95,473 | 47,043 | 7 | 142,523 | ||||||||||||||||||||||
| Total | 125,142 | 79,645 | 2,761 | 207,548 |
Part-time associates work an average of less than 30 hours per week and the number of part-time associates fluctuates depending on seasonal needs.
We consider our relationship with our associates to be good, and have not experienced significant interruptions of operations due to labor disagreements.
Available Information
Our annual reports on Form 10-K, quarterly reports on Form 10-Q, current reports on Form 8-K and amendments to those reports filed or furnished pursuant to Section 13(a) or 15(d) of the Securities Exchange Act of 1934 are available free of charge on our website at www.dollartree.com as soon as reasonably practicable after electronic filing of such reports with the Securities and Exchange Commission (“SEC”).
Item 1A. Risk Factors
An investment in our common stock involves a high degree of risk. Any failure to meet market expectations, including our comparable store sales growth rate, earnings and earnings per share or new store openings, could cause the market price of our stock to decline. You should carefully consider the specific risk factors listed below together with all other information included or incorporated in this report and other filings that we make from time to time with the SEC, including our consolidated financial statements and accompanying notes. However, the risks and uncertainties that we face are not limited to those described below and those set forth in our SEC filings. Additional risks and uncertainties not presently known to us or that we currently believe to be immaterial may also arise. In such event, our business, financial condition, results of operations or prospects could be materially adversely affected.
Profitability and Operational Risks
Our profitability is vulnerable to increases in merchandise, shipping, freight and fuel costs, wage and benefit costs and other operating costs.
Future increases in costs such as the cost of merchandise (including the substitution of higher cost domestic goods), wage and benefit costs, ocean shipping rates, domestic freight costs, fuel and energy costs, duties and tariffs, merchandise loss (due to theft, damage, or errors) and store occupancy costs would reduce our profitability. We experienced material increases in wage rates and labor costs as well as in shipping rates, freight and fuel costs in 2022, and we expect further increases in certain cost categories in 2023. We have incurred additional costs as a result of recent minimum wage increases by certain states and localities and we expect additional minimum wage increases by states and localities in 2023. In addition, the federal minimum wage may increase depending on the outcome of legislation proposed in Congress, and the current administration may consider raising the minimum salary for store managers who have exempt status under the Fair Labor Standards Act. Separately, government or industry actions addressing the impact of climate change, or shifts in customer preferences for more sustainable, energy-efficient products, may result in increases in our merchandise or operating costs.
In our Dollar Tree segment, we raised our primary price point on merchandise to $1.25 in fiscal 2021. In addition, we continue to implement our Dollar Tree Plus initiative which provides our customers with discretionary categories priced at the $3 and $5 price points and beginning in fiscal 2022, we added $3, $4 and $5 frozen and refrigerated product in 3,500 stores. Although we have increased our price points at our Dollar Tree stores, our ability to adjust our product assortment, to operate more efficiently or to increase our comparable store net sales in order to offset cost increases is critical to maintaining our profitability levels. Supply chain constraints and higher commodity costs could make it more difficult for us to obtain sufficient quantities of certain products and could negatively affect our product assortment and merchandise costs. We can give no assurance that we will be able to adjust our product assortment, operate more efficiently or increase our comparable store net sales in the future. Although Family Dollar, unlike Dollar Tree, can more easily raise the price of merchandise, customers may buy fewer products if prices were to increase. Please see “Item 7. Management’s Discussion and Analysis of Financial Condition and Results of Operations” for further discussion of the effect of economic factors on our operations.
We are experiencing higher costs and disruptions in our distribution network, which have had and could have an adverse impact on our sales, margins and profitability.
Our success is dependent on our ability to import or transport merchandise to our distribution centers and store, pick and ship merchandise to our stores in a timely and cost-effective manner. We rely heavily on third parties including ocean carriers and truckers in these processes. We may not anticipate, respond to or control all of the challenges of operating our distribution network. Additionally, when our distribution centers fail to operate effectively, we could experience increased freight or operational costs or merchandise shortages that could lead to lost sales. We have also experienced trucking shortages, and increased trucking and fuel costs. Some of the factors that have had and could have an adverse effect on our distribution network or costs in 2023 are:
-
Shipping costs. We have experienced significantly higher international and domestic freight costs. Domestically, diesel fuel prices have been and are expected to remain higher and may increase further because of international tensions. A significant increase in our freight costs could have a material adverse impact on our business and results of operations. Changes in import duties, import quotas and other trade sanctions could also increase our costs.
-
Shipping disruptions. We have experienced disruptions in the global supply chain, including issues with shipping capacity, port congestion and pandemic-related port closings and ship diversions. Our receipt of imported merchandise has been and may be further disrupted or delayed as a result of these or other factors. Delays could potentially have a material adverse impact on future product availability, product mix, sales and merchandise margin, especially at Dollar Tree. In addition, our supply chain may be disrupted as a result of other international events such as armed conflict, war, economic sanctions or acts of terrorism.
-
Efficient operations and management. Distribution centers and other aspects of our distribution network are complex and difficult to operate efficiently, and we have experienced and could continue to experience a reduction in operating efficiency resulting in delayed shipments of merchandise to our stores as a result of challenges in attracting and retaining an adequate and reliable workforce. Although we have offered sign-on bonuses, enhanced wages and other inducements in certain markets to address the shortage of labor at our distribution centers, such measures have increased our costs and are expected to continue to increase our costs, which could have an adverse effect on our margins and profitability. There can be no assurances that such measures will be adequate to attract and retain the workforce necessary for the efficient operation of our distribution centers.
-
Trucking costs. We have experienced significant increases in trucking costs in recent years due to a truck driver shortage and other factors. The truck driver shortage also required us to increase our use of more expensive surge carriers to transport our merchandise.
-
Diesel fuel costs. We have experienced volatility in diesel fuel costs and are expecting increases to continue in fiscal 2023 and may worsen, for example, because of the impact of international events such as trade restrictions on Russia on oil prices.
-
Vulnerability to natural or man-made disasters, including climate change. A fire, explosion or natural disaster at a port or any of our distribution or store support facilities could result in a loss of merchandise and impair our ability to adequately stock our stores. Some facilities are vulnerable to earthquakes, hurricanes, tornadoes or floods, and an increase in the severity and frequency of extreme weather events and patterns may increase our operating costs, disrupt manufacturing or our supply chain, change customer buying patterns, result in closures of our stores or distribution and store support centers and impede physical access to our stores.
-
Labor disagreement. Labor disagreements, disruptions or strikes, including at ports, rail networks or transporta
Showing the first 8K of 64K characters. Open the full section
Item 1B. Unresolved Staff Comments
None.
Item 2. Properties
As of January 28, 2023, we operated 16,096 stores across the contiguous United States and the District of Columbia and operated 244 stores within five Canadian provinces.
The Dollar Tree segment includes 8,134 stores operating under the Dollar Tree and Dollar Tree Canada brands with stores predominantly ranging from 8,000 - 10,000 selling square feet. The Family Dollar segment includes 8,206 stores operating under the Family Dollar brand with stores predominantly ranging from 6,000 - 8,000 selling square feet. For additional information on store counts and square footage by segment for the years ended January 28, 2023 and January 29, 2022, see “Item 7. Management’s Discussion and Analysis of Financial Condition and Results of Operations” under the caption “Overview.”
We lease the vast majority of our stores and expect to lease the majority of our new stores as we expand. Our leases typically provide for a short initial lease term, generally between five and ten years, with options to extend; in some cases we have initial lease terms of up to fifteen years. We believe this leasing strategy enhances our flexibility to pursue various expansion opportunities resulting from changing market conditions. As current leases expire, we believe that we will be able to obtain lease renewals, if desired, for present store locations, or to obtain leases for equivalent or better locations in the same general area.
Our network of distribution centers is strategically located throughout the United States to support our stores. As of January 28, 2023, we operated 25 distribution centers occupying a total of 23.2 million square feet, 15 of which are primarily dedicated to serving our Dollar Tree stores and ten distribution centers primarily serve our Family Dollar stores. We expect future distribution centers to be built with the capability to service both Dollar Tree and Family Dollar stores. Our distribution network supports multiple store formats including H2, Combo Stores and Dollar Tree Plus. We ship to our H2 format stores from our Family Dollar distribution centers and we ship to our Dollar Tree Plus format stores from our Dollar Tree distribution centers. Our Combo Stores receive shipments from both Dollar Tree and Family Dollar distribution centers. Except for 0.4 million square feet of our distribution center in San Bernardino, California and short-term leases for offsite facilities, all of our distribution center capacity is owned.
Each of our distribution centers contains advanced materials handling technologies, including radio-frequency inventory tracking equipment and specialized information systems. With the exception of three of our facilities, each of our distribution centers in the United States also contains automated conveyor and sorting systems.
Distribution services in Canada are provided by a third party from facilities in British Columbia and Ontario.
Our store support center in Chesapeake, Virginia is located in an approximately 0.5 million square foot office tower that we own.
For more information on financing of our new, expanded and renovated stores, and distribution centers, see “Item 7. Management’s Discussion and Analysis of Financial Condition and Results of Operations” under the caption “Funding Requirements.”
Item 3. Legal Proceedings
For information regarding legal proceedings in which we are involved, please see Note 4 to the consolidated financial statements included elsewhere in this Annual Report on Form 10-K, under the caption “Contingencies.” For a further description of certain of these matters and their impact, see “Item 1A. Risk Factors”: “We may stop selling or recall certain products for safety-related or other issues” on page 12 and “Litigation, arbitration and government proceedings may adversely affect our business, financial condition and/or results of operations” on page 17.
Item 4. Mine Safety Disclosures
None.
PART II
Item 5. Market for Registrant’s Common Equity, Related Stockholder Matters and Issuer Purchases of Equity Securities
Our common stock is traded on The Nasdaq Global Select Market® under the symbol “DLTR.” As of March 3, 2023, we had 2,125 shareholders of record.
Issuer Purchases of Equity Securities
During fiscal 2022, fiscal 2021 and fiscal 2020, we repurchased 4,613,696, 9,156,898 and 3,982,478 shares of common stock, respectively, on the open market at a total cost of $647.5 million, $950.0 million and $400.0 million, respectively. The fiscal 2022 share repurchases occurred prior to the fourth quarter. As of January 28, 2023, we had $1.85 billion remaining under our Board repurchase authorization. The repurchase authorization does not have an expiration date.
Stockholder Matters
We anticipate that substantially all of our cash flow from operations in the foreseeable future will be retained for the development and expansion of our business, the repayment of indebtedness and, as authorized by our Board of Directors, the repurchase of stock. We do not anticipate paying cash dividends on our common stock in the foreseeable future.
Stock Performance Graph
The following graph sets forth the yearly percentage change in the cumulative total shareholder return on our common stock during the five fiscal years ended January 28, 2023, compared with the cumulative total returns of the S&P 500 Index and the S&P 500 Retailing Index. The comparison assumes that $100 was invested in our common stock on February 3, 2018, and, in each of the foregoing indices on February 3, 2018, and that dividends were reinvested. The stock price performance shown in the graph is not necessarily indicative of future price performance.
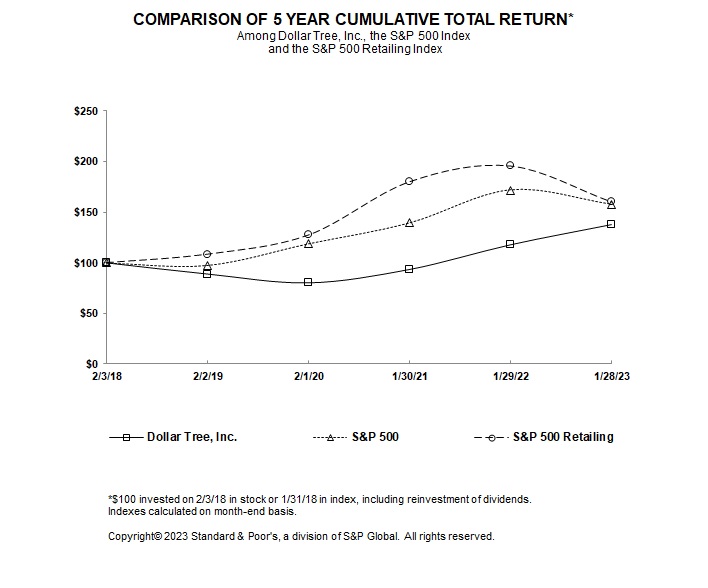
| Year Ended | ||||||||||||||||||||
| February 3, 2018 | February 2, 2019 | February 1, 2020 | January 30, 2021 | January 29, 2022 | January 28, 2023 | |||||||||||||||
| Dollar Tree, Inc. | $ | 100.00 | $ | 88.84 | $ | 80.01 | $ | 93.41 | $ | 118.06 | $ | 138.17 | ||||||||
| S&P 500 Index | 100.00 | 97.69 | 118.87 | 139.37 | 171.83 | 157.71 | ||||||||||||||
| S&P 500 Retailing Index | 100.00 | 108.42 | 127.45 | 180.19 | 195.77 | 160.10 |
Item 6. Reserved
Item 7. Management’s Discussion and Analysis of Financial Condition and Results of Operations
This section of Form 10-K generally discusses 2022 and 2021 events and results and year-to-year comparisons between 2022 and 2021. Discussions of 2020 items and year-to-year comparisons between 2021 and 2020 that are not included in this Form 10-K can be found in “Management’s Discussion and Analysis of Financial Condition and Results of Operations” in Part II, Item 7 of our Annual Report on Form 10-K for the fiscal year ended January 29, 2022.
In Management’s Discussion and Analysis, we explain the general financial condition and the results of operations for our company, including, factors that affect our business, analysis of annual changes in certain line items in the consolidated financial statements, performance of each of our operating segments, expenditures incurred for capital projects and sources of funding for future expenditures. As you read Management’s Discussion and Analysis, please refer to our consolidated financial statements and related notes, included in “Item 8. Financial Statements and Supplementary Data” of this Form 10-K.
Initiatives and Recent Developments
Our initiatives, as well as other recent developments that have had or are expected to have an impact on our business or results of operations are listed below:
- Dollar Tree
◦In September 2021, we announced our new $1.25 price point initiative and we completed the rollout of this initiative to all Dollar Tree stores during the first quarter of fiscal 2022, increasing the price point on a majority of our $1 merchandise to $1.25. To date, the increase in the price point has more than offset the decline in the number of units sold. During fiscal 2022, we began investing in new products and modifying existing products to provide greater value for our customers and increase customer traffic and store productivity. While our gross margin was higher in the fourth quarter of fiscal 2022 compared with the fourth quarter of fiscal 2021, because of the investments in new products, the increase was not as high as it was in the first three quarters of fiscal 2022 and we expect Dollar Tree’s gross margin to be lower in the first half of fiscal 2023.
◦We began testing the Instacart online delivery service at Dollar Tree stores in the third quarter of fiscal 2021 and began rolling it out in the fourth quarter of fiscal 2021. As of January 28, 2023, the Instacart platform covers more than 7,800 Dollar Tree stores. This enables our customers to shop online and receive same-day delivery without having to visit a store.
◦In fiscal 2022, we continued to implement our Dollar Tree Plus initiative which introduces products priced at the $3 and $5 price points and provides our customers with extraordinary value in discretionary categories. As of January 28, 2023, we have approximately 2,500 Dollar Tree Plus stores. We plan to accelerate the implementation of the Dollar Tree Plus initiative in fiscal 2023 by adding the concept to an additional 1,800, or more, stores. In addition, beginning in fiscal 2022, we added $3, $4 and $5 frozen and refrigerated product to 3,500 stores.
◦The rollout of our Crafter’s Square initiative to all of our Dollar Tree stores was completed during fiscal 2020. The Crafter’s Square assortment carries mark-ups which are higher than our average mark-up.
- Family Dollar
◦In fiscal 2022, we continued to implement our H2 initiative. Our H2 stores have significantly improved merchandise offerings throughout the store, including the addition of Dollar Tree $1.25 merchandise items and establishing a minimum number of freezer and cooler doors. These stores have higher customer traffic and provide a higher average comparable store net sales lift, when compared to non-renovated stores, in the first year following renovation. H2 stores perform well in a variety of locations and especially in locations where our Family Dollar stores have been most challenged in the past. As of January 28, 2023, we have approximately 4,360 H2 stores.
◦Building on the success of the H2 format, in March 2021, we announced the development of a new combination store format. Combo Stores leverage the strengths of the Dollar Tree and Family Dollar brands under one roof to serve small towns across the country. We are taking Family Dollar’s great value and assortment and blending in select Dollar Tree merchandise categories, creating a new store format targeted for small towns and rural communities with populations of 3,000 to 4,000 residents. As of January 28, 2023, we operated approximately 810 Combo Stores.
◦After a successful pilot program in 2020, we entered into a partnership with Instacart in February 2021, which covers more than 7,500 Family Dollar stores across the United States as of January 28, 2023.
◦We added adult beverage to approximately 570 stores in fiscal 2022. We believe the addition of adult beverage to our assortment drives traffic to our stores. As of January 28, 2023, there were more than 3,300 stores selling adult beverage products.
◦On February 11, 2022, the Food and Drug Administration issued Form 483 observations primarily regarding rodent infestation at our West Memphis, Arkansas distribution center (“DC 202”), as well as other items that require remediation. During the first quarter of fiscal 2022, approximately 400 stores serviced by DC 202 were temporarily closed in connection with a retail-level product recall. We incurred approximately $65.0 million in costs related to the product recall, remediation efforts and asset impairment during fiscal 2022. Remediation-related costs included merchandise disposal costs, payroll and legal costs.
- Strategic Investments
Building on our current initiatives, we are currently developing plans to make additional multi-year strategic investments across both banners to further position the company for long-term sustained growth. We anticipate that these investments will relate to four key areas of our business: our associates, our distribution center network and supply chain, our product pricing and value proposition, and our technology infrastructure. Within these areas, the focus of these investments is expected to be on associate wages, improved store execution, enhanced safety and working conditions, increased supply chain efficiencies, competitive pricing at Family Dollar, and enhancements to our systems infrastructure.
- Supply Chain
◦Inventory: During fiscal 2021, we experienced significant disruptions in our supply chain which impacted our ability to ship products from overseas on a timely basis. During the second and third quarters of fiscal 2022 these challenges subsided; however, as a result of receiving inventory more timely, our inventory levels exceeded the storage capacity of some of our distribution centers. As a result, we arranged for temporary offsite warehouse storage facilities and incurred detention costs and incremental drayage costs that increased our cost of goods sold.
◦Freight Costs: We experienced significantly higher international and domestic freight costs as a result of disruptions in the global supply chain during the second half of fiscal 2021 and into the first half of fiscal 2022. Domestically, diesel fuel prices were higher in fiscal 2022 than in the prior year and may increase further in fiscal 2023 because of international tensions. We are a large importer of merchandise from Asia and rely heavily on domestic freight to transport goods to our distribution centers and stores, which makes us particularly sensitive to freight costs. Due to these trends, in fiscal 2022, import and domestic freight costs were higher compared to fiscal 2021; however, we expect freight costs to be lower in fiscal 2023 compared with fiscal 2022.
- Long-term Debt
◦During the fourth quarter of 2021, we completed the registered offering of $800.0 million of 2.65% Senior Notes due 2031 and $400.0 million of 3.375% Senior Notes due 2051 and used the proceeds of the offering to redeem the $1.0 billion 2023 Notes, which resulted in our incurring a $43.8 million prepayment penalty and we accelerated the expensing of $2.7 million of deferred financing and original issue discount costs associated with the 2023 Notes;
◦During the fourth quarter of 2021, we entered into a credit agreement for a $1.5 billion revolving credit facility, which replaced our then-existing $1.25 billion revolving credit facility.
For additional information regarding the risks related to our business and operations, including risks relating to the implementation of our initiatives, see “Item 1A. Risk Factors.”
Overview
We are a leading operator of more than 16,300 retail discount stores and we conduct our operations in two reporting segments. Our Dollar Tree segment is the leading operator of discount variety stores offering merchandise predominantly at the fixed price of $1.25. Our Family Dollar segment operates general merchandise retail discount stores providing consumers with a selection of competitively-priced merchandise in convenient neighborhood stores.
Our net sales are derived from the sale of merchandise. Two major factors tend to affect our net sales trends. First is our success at opening new stores. Second is the performance of stores once they are open which can be impacted by a number of factors including operational performance, competition, inflation and changes in the product assortment, pricing, or quality. Sales vary at our existing stores from one year to the next. We refer to this as a change in comparable store net sales, because we include only those stores that are open throughout both of the periods being compared, beginning after the first fifteen months of operation. We include sales from stores expanded or remodeled during the year in the calculation of comparable store net sales, which has the effect of increasing our comparable store net sales. The term ‘expanded’ also includes stores that are relocated. Stores that have been re-bannered are considered to be new stores and are not included in the calculation of the comparable store net sales change until after the first fifteen months of operation under the new brand.
At January 28, 2023, we operated stores in 48 states and the District of Columbia, as well as stores in five Canadian provinces. A breakdown of store counts and square footage by segment for the years ended January 28, 2023 and January 29, 2022 is as follows:
| Year Ended | |||||||||||||||||||||||||||||||||||
| January 28, 2023 | January 29, 2022 | ||||||||||||||||||||||||||||||||||
| Dollar Tree | Family Dollar | Total | Dollar Tree | Family Dollar | Total | ||||||||||||||||||||||||||||||
| Store Count: | |||||||||||||||||||||||||||||||||||
| Beginning | 8,061 | 8,016 | 16,077 | 7,805 | 7,880 | 15,685 | |||||||||||||||||||||||||||||
| New stores | 131 | 333 | 464 | 311 | 225 | 536 | |||||||||||||||||||||||||||||
| Re-bannered stores | (5) | 9 | 4 | 1 | (1) | — | |||||||||||||||||||||||||||||
| Closings | (53) | (152) | (205) | (56) | (88) | (144) | |||||||||||||||||||||||||||||
| Ending | 8,134 | 8,206 | 16,340 | 8,061 | 8,016 | 16,077 | |||||||||||||||||||||||||||||
| Relocations | 28 | 92 | 120 | 56 | 68 | 124 | |||||||||||||||||||||||||||||
| Selling Square Feet (in millions): | |||||||||||||||||||||||||||||||||||
| Beginning | 69.7 | 59.2 | 128.9 | 67.4 | 57.7 | 125.1 | |||||||||||||||||||||||||||||
| New stores | 1.1 | 3.1 | 4.2 | 2.7 | 2.0 | 4.7 | |||||||||||||||||||||||||||||
| Re-bannered stores | — | 0.1 | 0.1 | — | — | — | |||||||||||||||||||||||||||||
| Closings | (0.4) | (1.1) | (1.5) | (0.5) | (0.6) | (1.1) | |||||||||||||||||||||||||||||
| Relocations | 0.1 | 0.3 | 0.4 | 0.1 | 0.1 | 0.2 | |||||||||||||||||||||||||||||
| Ending | 70.5 | 61.6 | 132.1 | 69.7 | 59.2 | 128.9 |
Stores are included as re-banners when they close or open, respectively.
The average size of stores opened in 2022 was approximately 8,660 selling square feet (or about 10,710 gross square feet) for the Dollar Tree segment and 9,160 selling square feet (or about 11,210 gross square feet) for the Family Dollar segment. For 2023, we continue to plan to open stores that are 8,000 - 10,000 selling square feet (or about 10,000 - 12,000 gross square feet) for both the Dollar Tree segment and the Family Dollar segment. We believe that these size stores are in the ranges of our optimal sizes operationally and give our customers a shopping environment which invites them to shop longer, buy more and make return visits.
Fiscal 2022, fiscal 2021 and fiscal 2020 each included 52 weeks.
The percentage change in comparable store net sales for the fiscal year ended January 28, 2023, as compared with the preceding year, is as follows:
| Year Ended January 28, 2023 | ||||||||||||||||||||
| Sales Growth | Change in Customer Traffic | Change in Average Ticket | ||||||||||||||||||
| Consolidated | 5.9 | % | (2.7) | % | 8.9 | % | ||||||||||||||
| Dollar Tree Segment | 9.0 | % | (3.9) | % | 13.4 | % | ||||||||||||||
| Family Dollar Segment | 2.4 | % | (1.0) | % | 3.4 | % |
Comparable store net sales are positively affected by our expanded and relocated stores, which we include in the calculation, and are negatively affected when we open new stores, re-banner stores or expand stores near existing stores.
Results of Operations
Our results of operations and year-over-year changes are discussed in the following section. Note that gross profit margin is calculated as gross profit (i.e., net sales less cost of sales) divided by net sales. The selling, general and administrative expense rate and operating income margin are calculated by dividing the applicable amount by total revenue.
Net Sales
| Year Ended | Percentage Change | |||||||||||||||||||||||||
| January 28, | January 29, | January 30, | Fiscal 2022 vs. Fiscal 2021 | |||||||||||||||||||||||
| (dollars in millions) | 2023 | 2022 | 2021 | |||||||||||||||||||||||
| Net sales | $ | 28,318.2 | $ | 26,309.8 | $ | 25,508.4 | 7.6 | % | ||||||||||||||||||
| Comparable store net sales change | 5.9 | % | 1.1 | % | 6.0 | % |
The increase in net sales from 2021 to 2022 was a result of comparable store net sales increases in the Dollar Tree and Family Dollar segments and sales of $758.6 million at new stores.
Enterprise comparable store net sales increased 5.9% in 2022, as a result of an 8.9% increase in average ticket, partially offset by a 2.7% decrease in customer traffic. Comparable store net sales increased 9.0% in the Dollar Tree segment and increased 2.4% in the Family Dollar segment.
Gross Profit
| Year Ended | Percentage Change | |||||||||||||||||||||||||
| January 28, | January 29, | January 30, | Fiscal 2022 vs. Fiscal 2021 | |||||||||||||||||||||||
| (dollars in millions) | 2023 | 2022 | 2021 | |||||||||||||||||||||||
| Gross profit | $ | 8,921.9 | $ | 7,725.9 | $ | 7,787.4 | 15.5 | % | ||||||||||||||||||
| Gross profit margin | 31.5 | % | 29.4 | % | 30.5 | % | 2.1 | % |
The increase in gross profit margin from 2021 to 2022 was a result of the net of the following:
-
Merchandise cost, which includes freight, decreased 255 basis points resulting primarily from higher initial mark-on, partially offset by higher freight costs and increased sales of lower margin consumable merchandise on the Family Dollar segment.
-
Occupancy costs decreased 30 basis points due to leverage from the comparable store net sales increase.
-
Distribution costs decreased 5 basis points due to leverage from the comparable store net sales increase and higher capitalized amounts resulting from increases in inventory levels, partially offset by higher maintenance and compliance costs and higher hourly wages in our distribution centers.
-
Shrink costs increased 30 basis points resulting from unfavorable inventory results in relation to accruals.
-
Markdown costs increased 45 basis points primarily due to higher promotional and clearance markdowns on the Family Dollar segment and higher clearance markdowns resulting from a move to a higher value assortment at the $1.25 price point on the Dollar Tree segment.
Selling, General and Administrative Expenses
| Year Ended | Percentage Change | |||||||||||||||||||||||||
| January 28, | January 29, | January 30, | Fiscal 2022 vs. Fiscal 2021 | |||||||||||||||||||||||
| (dollars in millions) | 2023 | 2022 | 2021 | |||||||||||||||||||||||
| Selling, general and administrative expenses | $ | 6,699.1 | $ | 5,925.9 | $ | 5,900.4 | 13.0 | % | ||||||||||||||||||
| Selling, general and administrative expense rate | 23.6 | % | 22.5 | % | 23.1 | % | 1.1 | % |
The increase in the selling, general and administrative expense rate from 2021 to 2022 was the result of the following:
-
Other selling, general and administrative expenses increased 70 basis points primarily due to long-lived asset impairments related to certain Family Dollar stores and the Family Dollar West Memphis, Arkansas distribution center, higher legal fees, including costs related to the reconstitution of the Board of Directors, unfavorable development of general liability claims and inflationary pressure across several expense categories.
-
Store facility costs increased 35 basis points primarily due to an increase in repairs and maintenance expenses as we focus on store conditions for our customers and associates, higher utility costs and costs associated with the removal of product from certain Family Dollar stores in connection with the retail-level product recall.
-
Payroll expenses increased 10 basis points primarily due to minimum wage increases and other investments in store payroll and higher stock compensation expenses, partially offset by leverage from the comparable store net sales increase.
-
Depreciation and amortization expense was unchanged as a percentage of total revenue, as capital expenditures related to store renovations and improvements were offset by leverage from the comparable store net sales increase.
Operating Income
| Year Ended | Percentage Change | |||||||||||||||||||||||||
| January 28, | January 29, | January 30, | Fiscal 2022 vs. Fiscal 2021 | |||||||||||||||||||||||
| (dollars in millions) | 2023 | 2022 | 2021 | |||||||||||||||||||||||
| Operating income | $ | 2,236.3 | $ | 1,811.4 | $ | 1,887.9 | 23.5 | % | ||||||||||||||||||
| Operating income margin | 7.9 | % | 6.9 | % | 7.4 | % | 1.0 | % |
Operating income margin increased to 7.9% in fiscal 2022 compared to 6.9% in fiscal 2021, resulting from the increase in gross profit margin, partially offset by the increase in the selling, general and administrative expense rate, as described above.
Interest Expense, Net
| Year Ended | Percentage Change | |||||||||||||||||||||||||
| January 28, | January 29, | January 30, | Fiscal 2022 vs. Fiscal 2021 | |||||||||||||||||||||||
| (dollars in millions) | 2023 | 2022 | 2021 | |||||||||||||||||||||||
| Interest expense, net | $ | 125.3 | $ | 178.9 | $ | 147.3 | (30.0) | % | ||||||||||||||||||
Interest expense, net decreased $53.6 million in fiscal 2022 compared to the prior year, resulting from the refinancing of our debt in the fourth quarter of 2021, which resulted in prepayment penalties of $43.8 million and the acceleration of the expensing of $2.7 million of amortizable non-cash deferred financing costs. Higher interest income on investments more than offset interest expense on credit facility borrowings in the current year.
Provision for Income taxes
| Year Ended | Percentage Change | |||||||||||||||||||||||||
| January 28, | January 29, | January 30, | Fiscal 2022 vs. Fiscal 2021 | |||||||||||||||||||||||
| (dollars in millions) | 2023 | 2022 | 2021 | |||||||||||||||||||||||
| Provision for income taxes | $ | 495.2 | $ | 304.3 | $ | 397.9 | 62.7 | % | ||||||||||||||||||
| Effective tax rate | 23.5 | % | 18.6 | % | 22.9 | % | 4.9 | % |
The effective tax rate for 2022 was 23.5% compared to 18.6% for 2021. The 2022 effective rate increased compared to the prior year rate primarily due to a deferred tax benefit in the prior year related to state entity restructuring as well as higher non-deductible executive compensation and lower Work Opportunity Tax credits as a percentage of pre-tax income in the current year.
Segment Information
We operate more than 16,300 retail discount stores in 48 states and five Canadian provinces. Our operations are conducted in two reporting business segments: Dollar Tree and Family Dollar. We define our segments as those operations whose results our chief operating decision maker (“CODM”) regularly reviews to analyze performance and allocate resources.
We measure the results of our segments using, among other measures, each segment’s net sales, gross profit and operating income. The CODM reviews these metrics for each of our reporting segments. We may revise the measurement of each segment’s operating income, as determined by the information regularly reviewed by the CODM. If the measurement of a segment changes, prior period amounts and balances are reclassified to be comparable to the current period’s presentation. Corporate, support and Other consists primarily of store support center costs that are considered shared services and therefore these selling, general and administrative costs are excluded from our two reporting business segments. These costs include operating expenses for our store support center and the results of operations for our Summit Pointe property in Chesapeake, Virginia. The Family Dollar segment “Operating income” includes advertising revenue, which is a component of “Other revenue” in the accompanying consolidated income statements.
Dollar Tree
The following table summarizes the operating results of the Dollar Tree segment:
| Year Ended | Percentage Change | |||||||||||||||||||||||||
| January 28, | January 29, | January 30, | Fiscal 2022 vs. Fiscal 2021 | |||||||||||||||||||||||
| (dollars in millions) | 2023 | 2022 | 2021 | |||||||||||||||||||||||
| Net sales | $ | 15,405.7 | $ | 13,922.1 | $ | 13,265.0 | 10.7 | % | ||||||||||||||||||
| Gross profit | 5,775.5 | 4,603.6 | 4,543.8 | 25.5 | % | |||||||||||||||||||||
| Gross profit margin | 37.5 | % | 33.1 | % | 34.3 | % | 4.4 | % | ||||||||||||||||||
| Operating income | $ | 2,536.0 | $ | 1,607.0 | $ | 1,598.0 | 57.8 | % | ||||||||||||||||||
| Operating income margin | 16.5 | % | 11.5 | % | 12.0 | % | 5.0 | % |
Net sales for the Dollar Tree segment increased $1,483.6 million, or 10.7%, in 2022 compared to 2021 due to an increase in comparable store net sales of 9.0% and $372.8 million of new store sales. Average ticket increased 13.4% and customer traffic declined 3.9% in 2022. Net sales were positively impacted by our $1.25 price point initiative which increased the selling price of the majority of our $1 merchandise to $1.25. The rollout of this initiative was completed during the first quarter of fiscal 2022. The increase in price point more than offset the decline in the number of units sold during the year.
Gross profit margin for the Dollar Tree segment increased to 37.5% in 2022 from 33.1% in 2021. The increase is due to the net of the following:
-
Merchandise cost, which includes freight, decreased 410 basis points primarily due to higher initial mark-on, partially offset by higher freight costs.
-
Occupancy costs decreased 60 basis points primarily due to leverage from the comparable store net sales increase.
-
Distribution costs decreased 10 basis points due to leverage from the comparable store net sales increase and higher capitalized balances resulting from increases in inventory levels partially offset by higher hourly wages in our distribution centers.
-
Shrink costs increased 20 basis points resulting from unfavorable inventory results in relation to accruals.
-
Markdown costs increased 20 basis points resulting primarily from markdowns for clearance items as we move to a higher value assortment at the $1.25 price point.
Operating income margin for the Dollar Tree segment increased to 16.5% in 2022 from 11.5% in 2021 as a result of the gross profit margin increase noted above and a decrease in the selling, general and administrative expense rate. The selling, general and administrative expense rate decreased to 21.0% in 2022 compared to 21.5% in 2021 as a result of the net of the following:
-
Payroll expenses decreased 85 basis points primarily due to leverage from the comparable store net sales increase, partially offset by minimum wage increases and other investments in store payroll.
-
Depreciation and amortization expense decreased 5 basis points primarily due to leverage from the comparable store net sales increase, partially offset by capital expenditures related to store renovations and improvements.
-
Store facility costs increased 15 basis points primarily due to an increase in repairs and maintenance expenses as we focus on store conditions for our customers and associates and higher utility costs, partially offset by leverage from the comparable store net sales increase.
-
Other selling, general and administrative expenses increased 25 basis points primarily due to unfavorable development of general liability claims, the benefit in the prior year associated with the realization of certain tax credits and inflationary pressure across several expense categories in the current year.
Family Dollar
The following table summarizes the operating results of the Family Dollar segment:
| Year Ended | Percentage Change | |||||||||||||||||||||||||
| January 28, | January 29, | January 30, | Fiscal 2022 vs. Fiscal 2021 | |||||||||||||||||||||||
| (dollars in millions) | 2023 | 2022 | 2021 | |||||||||||||||||||||||
| Net sales | $ | 12,912.5 | $ | 12,387.7 | $ | 12,243.4 | 4.2 | % | ||||||||||||||||||
| Gross profit | 3,146.4 | 3,122.3 | 3,243.6 | 0.8 | % | |||||||||||||||||||||
| Gross profit margin | 24.4 | % | 25.2 | % | 26.5 | % | (0.8) | % | ||||||||||||||||||
| Operating income | $ | 127.5 | $ | 543.1 | $ | 655.6 | (76.5) | % | ||||||||||||||||||
| Operating income margin | 1.0 | % | 4.4 | % | 5.4 | % | (3.4) | % |
Net sales for the Family Dollar segment increased $524.8 million, or 4.2%, in 2022 compared to 2021 due to $385.8 million of new store sales and a comparable store net sales increase of 2.4%. Average ticket increased 3.4% and customer traffic declined 1.0% in 2022. During the first quarter of 2022, approximately 400 stores serviced by the West Memphis, Arkansas distribution center were temporarily closed in connection with a retail-level product recall. The Family Dollar comparable store net sales increased 2.8% when excluding the effect of the store closures. Net sales in the prior year were positively impacted by significant government stimulus dollars provided to our customers.
Gross profit margin for the Family Dollar segment decreased to 24.4% in 2022 compared to 25.2% in 2021. The decrease is due to the net of the following:
-
Markdown costs increased 80 basis points primarily due to higher promotional and clearance markdowns.
-
Shrink costs increased 45 basis points resulting from unfavorable inventory results in relation to accruals.
-
Distribution costs were unchanged as a percentage of sales compared to the prior year as higher capitalized balances resulting from increases in inventory levels in the current year were offset by higher maintenance and compliance costs and higher hourly wages in our distribution centers.
-
Merchandise cost, which includes freight, decreased 40 basis points primarily due to higher initial mark-on, partially offset by higher sales of lower margin consumable merchandise and higher freight costs.
Operating income margin for the Family Dollar segment decreased to 1.0% in 2022 from 4.4% in 2021, resulting from the gross profit margin decrease noted above and an increase in the selling, general and administrative expense rate. The selling, general and administrative expense rate increased to 23.4% in 2022 from 20.9% in 2021 as a result of the following:
-
Other selling, general and administrative expenses increased 95 basis points primarily due to long-lived asset impairments related to certain stores and the West Memphis, Arkansas distribution center, higher legal fees and inflationary pressure across several expense categories.
-
Payroll expenses increased 85 basis points primarily due to minimum wage increases and other investments in store payroll.
-
Store facility costs increased 60 basis points primarily due to an increase in repairs and maintenance expenses as we focus on store conditions for our customers and associates, higher utility costs and costs associated with the removal of product from certain stores in connection with a voluntary retail-level product recall.
-
Depreciation and amortization expense increased 15 basis points primarily due to capital expenditures related to store renovations and improvements.
Liquidity and Capital Resources
We invest capital to build and open new stores, expand and renovate existing stores, expand our distribution network and operate our existing stores. Our working capital requirements for existing stores are seasonal in nature and typically reach their peak in the months of September and October. Historically, we have satisfied our seasonal working capital requirements for existing stores and have funded our store opening and distribution network expansion programs from internally generated funds and borrowings under our credit facilities.
The following table compares cash flow-related information for the years ended January 28, 2023, January 29, 2022 and January 30, 2021:
| Year Ended | ||||||||||||||||||||
| January 28, | January 29, | January 30, | ||||||||||||||||||
| (in millions) | 2023 | 2022 | 2021 | |||||||||||||||||
| Net cash provided by (used in): | ||||||||||||||||||||
| Operating activities | $ | 1,614.8 | $ | 1,431.5 | $ | 2,716.3 | ||||||||||||||
| Investing activities | (1,253.8) | (1,019.9) | (889.7) | |||||||||||||||||
| Financing activities | (686.8) | (836.5) | (949.9) |
Operating Activities
Net cash provided by operating activities increased $183.3 million in 2022 compared to 2021 primarily as a result of higher current year earnings, net of non-cash items, and smaller decreases in liability balances, partially offset by higher inventory levels and a smaller increase in accounts payable.
Investing Activities
Net cash used in investing activities increased $233.9 million in 2022 compared with 2021 primarily due to higher capital expenditures in the current year.
Financing Activities
Net cash used in financing activities decreased $149.7 million in 2022 compared to 2021 primarily due to the following:
-
In 2022, we paid $647.5 million in cash for stock repurchases compared to $950.0 million in the prior year.
-
In 2021, we completed the registered offering of $800.0 million aggregate principal amount of Senior Notes due 2031 and $400.0 million aggregate principal amount of Senior Notes due 2051 and used the proceeds of the offering to redeem the $1.0 billion 2023 Notes, which resulted in our incurring a $43.8 million prepayment penalty. In addition, in connection with the registering of these senior notes and the refinancing of our revolving line of credit, we paid $15.5 million in deferred financing costs.
At January 28, 2023, our long-term borrowings were $3.45 billion and we had $1.5 billion available under our revolving credit facility, less amounts outstanding for standby letters of credit totaling $4.4 million. For additional detail on our long-term borrowings and other commitments, refer to the discussion of Funding Requirements below, as well as Note 4 and Note 5 to our consolidated financial statements.
Share Repurchases
We repurchased 4,613,696, 9,156,898 and 3,982,478 shares of common stock on the open market in fiscal 2022, fiscal 2021 and fiscal 2020, respectively, for $647.5 million, $950.0 million and $400.0 million, respectively. At January 28, 2023, we had $1.85 billion remaining under our Board repurchase authorization.
Funding Requirements
Overview
We expect our cash needs for opening new stores and expanding existing stores in fiscal 2023 to total approximately $690.0 million, which includes capital expenditures, initial inventory and pre-opening costs. Our total estimated capital expenditures for fiscal 2023 are approximately $2.0 billion, including planned expenditures for our new and expanded stores, store renovations, supply chain and information technology investments, and other property improvements. We believe that we can adequately fund our working capital requirements and planned capital expenditures for the foreseeable future from net cash provided by operations and potential borrowings under our revolving credit facility.
Our material contractual obligations consist of long-term debt and related interest payments and operating lease obligations. Additionally, we have commitments related to ocean shipping contracts, software license and support agreements, telecommunication services and store technology assets and maintenance for our stores. Other commitments include letters of credit for imported merchandise, standby letters of credit that serve as collateral for our large-deductible insurance programs and surety bonds that serve as collateral for utility payments at our stores and self-insured insurance programs. For additional information regarding these
obligations, including amounts outstanding at January 28, 2023, refer to Note 4, Note 5 and Note 6 to our consolidated financial statements.
Critical Accounting Estimates
The preparation of financial statements requires the use of estimates. Certain of our estimates require a high level of judgment and have the potential to have a material effect on the financial statements if actual results vary significantly from those estimates. Following is a discussion of the estimates that we consider critical.
Inventory Valuation
As discussed in Note 1 to our consolidated financial statements under the caption “Merchandise Inventories,” inventories at the distribution centers are stated at the lower of cost or net realizable value with cost determined on a weighted-average basis. Cost is assigned to store inventories using the retail inventory method on a weighted-average basis. Under the retail inventory method, the valuation of inventories at cost and the resulting gross margins are computed by applying a calculated cost-to-retail ratio to the retail value of inventories. The retail inventory method is an averaging method that is widely used in the retail industry and results in valuing inventories at lower of cost or market when markdowns are taken as a reduction of the retail value of inventories on a timely basis.
Inventory valuation methods require certain management estimates and judgments, including estimates of future merchandise markdowns and shrink, which significantly affect the ending inventory valuation at cost as well as the resulting gross margins. The averaging required in applying the retail inventory method and the estimates of shrink and markdowns could, under certain circumstances, result in costs not being recorded in the proper period.
We estimate our markdown reserve based on the consideration of a variety of factors, including, but not limited to, quantities of slow moving or seasonal carryover merchandise on hand, historical markdown statistics and future merchandising plans. The accuracy of our estimates can be affected by many factors, some of which are outside of our control, including changes in economic conditions and consumer buying trends. Historically, we have not experienced significant differences in our estimated reserve for markdowns compared with actual results.
Our accrual for shrink is based on the actual, historical shrink results of our most recent physical inventories adjusted, if necessary, for current economic conditions and business trends. These estimates are compared to actual results as physical inventory counts are taken and reconciled to the general ledger. Our physical inventory counts are generally taken between January and October of each year; therefore, the shrink accrual recorded at January 28, 2023 is based on estimated shrink for most of 2022, including the fourth quarter. The amounts recorded in the current year reflect the Dollar Tree and Family Dollar segments’ historical results. We periodically adjust our shrink estimates to reflect our best estimates based on the factors described and, historically, these adjustments have not been material.
Our management believes that our application of the retail inventory method results in an inventory valuation that reasonably approximates cost and results in carrying inventory at the lower of cost or market each year on a consistent basis.
Self-Insurance Liabilities
The liabilities related to our self-insurance programs for workers’ compensation and general liability are estimates that require judgment and the use of assumptions. Semiannually, we obtain third-party actuarial valuations to aid in valuing the liabilities and in determining the amount to accrue during the year. These actuarial valuations are estimates based on our historical loss development factors and the related accruals are adjusted as management’s estimates change.
Management’s estimate for self-insurance liabilities could vary from the ultimate loss sustained given the difficulty in predicting future events; however, historically, the net total of these differences has not had a material effect on our financial condition or results of operations.
Goodwill and Indefinite-Lived Intangible Assets
Goodwill and indefinite-lived intangible assets are initially recorded at their fair values. These assets are not amortized but are evaluated annually for impairment. A more frequent evaluation is performed if events or circumstances indicate that impairment could have occurred. Such events or circumstances could include, but are not limited to, significant negative industry or economic trends, unanticipated changes in the competitive environment and a significant sustained decline in the market price of our stock.
For purposes of our goodwill impairment evaluation, the reporting units are Family Dollar, Dollar Tree and Dollar Tree Canada. Goodwill has been assigned to the reporting units based on prior business combinations related to the brands. We have the option to initially perform a qualitative assessment to determine whether it is more likely than not that the fair value is less than the carrying amount. Alternatively, we may bypass the qualitative assessment and proceed directly to performing the quantitative impairment test.
In connection with the fiscal 2022 annual impairment evaluation, management’s qualitative assessment did not indicate that it was more likely than not that the fair value of the reporting units were less than their carrying values. However, due to recent executive level management changes and investments being made with respect to the Family Dollar reporting unit, management elected to perform a quantitative assessment of both the Family Dollar goodwill and trade name.
We estimate the fair value using a combination of a market multiple method and a discounted cash flow method. Under the market multiple approach, we estimate a fair value based on comparable companies’ market multiples of revenues and earnings before interest, taxes, depreciation and amortization (“EBITDA”) and adjusted for a control premium. Under the discounted cash flow approach, we project future cash flows which are discounted using a weighted-average cost of capital analysis that reflects current market conditions, adjusted for specific reporting unit risks (primarily the uncertainty of achieving projected operating cash flows). If the carrying amount of a reporting unit exceeds its estimated fair value, an impairment loss is recognized in an amount equal to that excess.
The Family Dollar goodwill and trade name comprise a substantial portion of our goodwill and indefinite-lived intangible assets and management’s judgment utilized in the Family Dollar goodwill and trade name impairment evaluations is critical. The computations require management to make estimates and assumptions and actual results may differ significantly, particularly if there are significant adverse changes in the operating environment. Critical assumptions that are used as part of a quantitative Family Dollar goodwill evaluation include:
-
The potential future revenue, EBITDA and cash flows of the reporting unit. The projections use management’s assumptions about economic and market conditions over the projected period as well as our estimates of future performance and reporting unit revenue, gross margin, expenses and other factors. The resulting revenue, EBITDA and cash flow estimates are based on our most recent business operating plans, and various growth rates are assumed for years beyond the current business plan period. These operating plans include anticipated investments in associate wages, improved store execution, enhanced safety and working conditions, increased supply chain efficiencies, competitive pricing, and enhancements to our technology infrastructure. We believe that the assumptions, estimates and rates used in our fiscal 2022 impairment evaluations are reasonable; however, variations in the assumptions, estimates and rates could result in significantly different estimates of fair value.
-
Selection of an appropriate discount rate. Calculating the present value of future cash flows requires the selection of an appropriate discount rate, which is based on a weighted-average cost of capital analysis. The discount rate is affected by changes in short-term interest rates and long-term yield as well as variances in the typical capital structure of marketplace participants. Given current economic conditions, it is possible that the discount rate will fluctuate in the near term. We engaged third party experts to assist in the determination of the weighted-average cost of capital used to discount the cash flows for our Family Dollar reporting unit. The weighted-average cost of capital used to discount the cash flows for our evaluation was 9.5% for our fiscal 2022 analysis.
Our evaluation of goodwill did not result in impairment charges being recorded in fiscal 2022, 2021 or 2020.
Indefinite-lived intangible assets, such as the Family Dollar trade name, are not subject to amortization but are reviewed at least annually for impairment. The indefinite-lived intangible asset impairment evaluations are performed by comparing the fair value of the indefinite-lived intangible assets to their carrying values. We estimate the fair value of our trade name intangible asset based on an income approach using the relief-from-royalty method. This approach is dependent upon a number of factors, including estimates of future growth and trends, royalty rates, discount rates and other variables. We base our fair value estimates on assumptions we believe to be reasonable, but which are inherently uncertain. The discount rate includes a premium compared to the discount rate used for the Family Dollar goodwill impairment evaluation due to the inherently higher risk profile of intangible assets compared to the overall reporting unit.
Our evaluation of the Family Dollar trade name did not result in impairment charges during fiscal 2022, 2021 or 2020.
For additional information related to goodwill and indefinite-lived intangible assets, including the related impairment evaluations, refer to Note 1 to our consolidated financial statements under the caption “Goodwill and Nonamortizing Intangible Assets.” For additional information related to uncertainties associated with the key assumptions and any potential events and/or circumstances that could have a negative effect on the key assumptions, please refer to “Item 1A. Risk Factors” and elsewhere within this “Item 7. Management’s Discussion and Analysis of Financial Condition and Results of Operations.” If our assumptions and related estimates change in the future, we may be required to record impairment charges against earnings in future periods. Any impairment charges that we may take in the future could be material to our results of operations and financial condition.
Item 7A. Quantitative and Qualitative Disclosures About Market Risk
We are exposed to various types of market risk in the normal course of our business, including the impact of interest rate changes and diesel fuel cost changes. We may enter into interest rate or diesel fuel swaps to manage exposure to interest rate and diesel fuel price changes. We do not enter into derivative instruments for any purpose other than cash flow hedging and we do not hold derivative instruments for trading purposes.
Interest Rate Risk
Our exposure to interest rate risk relates to our revolving credit facility, as borrowings under the revolving credit facility bear interest at SOFR, reset periodically, plus 0.10%, plus 0.875% to 1.50% as determined by our credit ratings and leverage ratio. At January 28, 2023, there were no borrowings outstanding under the revolving credit facility.
Inflation Risk
The primary inflationary factors impacting our business include changes to the costs of merchandise, transportation (including the cost of diesel fuel), and labor. If these inflationary pressures become significant, we may not be able to fully offset such higher costs through price increases on the Family Dollar banner or through adjustments to our product assortment, improvements in operational efficiencies or increases in our comparable store net sales on the Dollar Tree banner. Our inability or failure to do so could harm our business, financial condition and results of operations.
Item 8. Financial Statements and Supplementary Data
INDEX TO CONSOLIDATED FINANCIAL STATEMENTS
Report of Independent Registered Public Accounting Firm
To the Shareholders and Board of Directors
Dollar Tree, Inc.:
Opinion on the Consolidated Financial Statements
We have audited the accompanying consolidated balance sheets of Dollar Tree, Inc. and subsidiaries (the Company) as of January 28, 2023 and January 29, 2022, the related consolidated income statements, statements of comprehensive income, shareholders’ equity, and cash flows for each of the years in the three‑year period ended January 28, 2023, and the related notes (collectively, the consolidated financial statements). In our opinion, the consolidated financial statements present fairly, in all material respects, the financial position of the Company as of January 28, 2023 and January 29, 2022, and the results of its operations and its cash flows for each of the years in the three‑year period ended January 28, 2023, in conformity with U.S. generally accepted accounting principles.
We also have audited, in accordance with the standards of the Public Company Accounting Oversight Board (United States) (PCAOB), the Company’s internal control over financial reporting as of January 28, 2023, based on criteria established in Internal Control – Integrated Framework (2013) issued by the Committee of Sponsoring Organizations of the Treadway Commission, and our report dated March 10, 2023 expressed an unqualified opinion on the effectiveness of the Company’s internal control over financial reporting.
Basis for Opinion
These consolidated financial statements are the responsibility of the Company’s management. Our responsibility is to express an opinion on these consolidated financial statements based on our audits. We are a public accounting firm registered with the PCAOB and are required to be independent with respect to the Company in accordance with the U.S. federal securities laws and the applicable rules and regulations of the Securities and Exchange Commission and the PCAOB.
We conducted our audits in accordance with the standards of the PCAOB. Those standards require that we plan and perform the audit to obtain reasonable assurance about whether the consolidated financial statements are free of material misstatement, whether due to error or fraud. Our audits included performing procedures to assess the risks of material misstatement of the consolidated financial statements, whether due to error or fraud, and performing procedures that respond to those risks. Such procedures included examining, on a test basis, evidence regarding the amounts and disclosures in the consolidated financial statements. Our audits also included evaluating the accounting principles used and significant estimates made by management, as well as evaluating the overall presentation of the consolidated financial statements. We believe that our audits provide a reasonable basis for our opinion.
Critical Audit Matter
The critical audit matter communicated below is a matter arising from the current period audit of the consolidated financial statements that was communicated or required to be communicated to the audit committee and that: (1) relates to accounts or disclosures that are material to the consolidated financial statements and (2) involved our especially challenging, subjective, or complex judgments. The communication of a critical audit matter does not alter in any way our opinion on the consolidated financial statements, taken as a whole, and we are not, by communicating the critical audit matter below, providing a separate opinion on the critical audit matter or on the accounts or disclosures to which it relates.
Estimated self‑insurance liability
As discussed in Note 1 to the consolidated financial statements, the Company considers actuarial assumptions to estimate its self‑insurance liability. As of January 28, 2023, the Company recorded an estimated liability of $318 million.
We identified the evaluation of the estimated self‑insurance liability as a critical audit matter. The estimation process involves auditor judgment and actuarial expertise to evaluate the actuarial methods and assumptions that are used to estimate future claim payments. Specifically, the evaluation includes the assumptions related to the loss development factors and expected loss rates which are primarily driven by historical claims paid and incurred data.
The following are the primary procedures we performed to address this critical audit matter. We evaluated the design and tested the operating effectiveness of certain internal controls over the Company’s self‑insurance liability estimation process. This included controls related to (1) the selection of the actuarial methods, and the development of the loss development factors and expected loss rates used to calculate the liability, and (2) the completeness and accuracy of historical claims paid and incurred data. We assessed the Company’s estimate of the liability by testing a selection of certain data, including claims data, utilized by the Company’s actuary by comparing it to relevant documentation. We involved actuarial professionals with specialized skills and knowledge, who assisted in:
- assessing the Company’s actuarial methods by comparing them to generally accepted actuarial methodologies; and
Showing the first 8K of 108K characters. Open the full section
Item 9. Changes in and Disagreements With Accountants on Accounting and Financial Disclosure
None.
Item 9A. Controls and Procedures
Evaluation of Disclosure Controls and Procedures
We maintain disclosure controls and procedures that are designed to ensure that information required to be disclosed in our reports under the Securities Exchange Act of 1934 (Exchange Act) is recorded, processed, summarized and reported within the time periods specified in the rules and forms of the Securities and Exchange Commission, and that such information is accumulated and communicated to our management, including our Chief Executive Officer and Chief Financial Officer, as appropriate, to allow timely decisions regarding required disclosure. In designing and evaluating the disclosure controls and procedures, we recognize that any controls and procedures, no matter how well designed and operated, can provide only reasonable assurance of achieving the desired control objectives, and management necessarily is required to apply our judgment in evaluating the cost-benefit relationship of possible controls and procedures.
Our management has carried out, with the participation of our Chief Executive Officer and Chief Financial Officer, an evaluation of the effectiveness of our disclosure controls and procedures, as defined in Rule 13a-15(e) under the Exchange Act as of the end of the period covered by this report. Based upon this evaluation, our Chief Executive Officer and our Chief Financial Officer concluded that, as of January 28, 2023, our disclosure controls and procedures were designed and functioning effectively to provide reasonable assurance that information required to be disclosed by us in reports that we file or submit under the Exchange Act is (i) recorded, processed, summarized and reported within the time periods specified in Securities and Exchange Commission rules and forms and (ii) accumulated and communicated to our management, including the Chief Executive Officer and Chief Financial Officer, as appropriate to allow timely decisions regarding disclosure.
Management’s Report on Internal Control over Financial Reporting
Our management is responsible for establishing and maintaining adequate internal control over financial reporting, as defined in Exchange Act Rule 13a-15(f). Our management conducted an assessment of our internal control over financial reporting based on the framework established by the Committee of Sponsoring Organizations of the Treadway Commission in Internal Control - Integrated Framework (2013). Based on this assessment, our management has concluded that, as of January 28, 2023, our internal control over financial reporting is effective.
Our independent registered public accounting firm, KPMG LLP, has audited our consolidated financial statements and has issued an attestation report on the effectiveness of our internal control over financial reporting. Their report appears below.
Changes in Internal Controls
There were no changes in our internal control over financial reporting that occurred during our most recently completed fiscal quarter that materially affected, or are reasonably likely to materially affect, our internal control over financial reporting.
Report of Independent Registered Public Accounting Firm
To the Shareholders and Board of Directors
Dollar Tree, Inc.:
Opinion on Internal Control Over Financial Reporting
We have audited Dollar Tree, Inc. and subsidiaries’ (the Company) internal control over financial reporting as of January 28, 2023, based on criteria established in Internal Control – Integrated Framework (2013) issued by the Committee of Sponsoring Organizations of the Treadway Commission. In our opinion, the Company maintained, in all material respects, effective internal control over financial reporting as of January 28, 2023, based on criteria established in Internal Control – Integrated Framework (2013) issued by the Committee of Sponsoring Organizations of the Treadway Commission.
We also have audited, in accordance with the standards of the Public Company Accounting Oversight Board (United States) (PCAOB), the consolidated balance sheets of the Company as of January 28, 2023 and January 29, 2022, the related consolidated income statements, statements of comprehensive income, shareholders’ equity, and cash flows for each of the years in the three‑year period ended January 28, 2023, and the related notes (collectively, the consolidated financial statements), and our report dated March 10, 2023 expressed an unqualified opinion on those consolidated financial statements.
Basis for Opinion
The Company’s management is responsible for maintaining effective internal control over financial reporting and for its assessment of the effectiveness of internal control over financial reporting, included in the accompanying Management’s Report on Internal Control over Financial Reporting. Our responsibility is to express an opinion on the Company’s internal control over financial reporting based on our audit. We are a public accounting firm registered with the PCAOB and are required to be independent with respect to the Company in accordance with the U.S. federal securities laws and the applicable rules and regulations of the Securities and Exchange Commission and the PCAOB.
We conducted our audit in accordance with the standards of the PCAOB. Those standards require that we plan and perform the audit to obtain reasonable assurance about whether effective internal control over financial reporting was maintained in all material respects. Our audit of internal control over financial reporting included obtaining an understanding of internal control over financial reporting, assessing the risk that a material weakness exists, and testing and evaluating the design and operating effectiveness of internal control based on the assessed risk. Our audit also included performing such other procedures as we considered necessary in the circumstances. We believe that our audit provides a reasonable basis for our opinion.
Definition and Limitations of Internal Control Over Financial Reporting
A company’s internal control over financial reporting is a process designed to provide reasonable assurance regarding the reliability of financial reporting and the preparation of financial statements for external purposes in accordance with generally accepted accounting principles. A company’s internal control over financial reporting includes those policies and procedures that (1) pertain to the maintenance of records that, in reasonable detail, accurately and fairly reflect the transactions and dispositions of the assets of the company; (2) provide reasonable assurance that transactions are recorded as necessary to permit preparation of financial statements in accordance with generally accepted accounting principles, and that receipts and expenditures of the company are being made only in accordance with authorizations of management and directors of the company; and (3) provide reasonable assurance regarding prevention or timely detection of unauthorized acquisition, use, or disposition of the company’s assets that could have a material effect on the financial statements.
Because of its inherent limitations, internal control over financial reporting may not prevent or detect misstatements. Also, projections of any evaluation of effectiveness to future periods are subject to the risk that controls may become inadequate because of changes in conditions, or that the degree of compliance with the policies or procedures may deteriorate.
/s/ KPMG LLP
Norfolk, Virginia
March 10, 2023
Item 9B. Other Information
On March 8, 2023, the Board of Directors of the Company approved an amendment to Article III, Section 2 of the Company’s Amended and Restated By-Laws to reduce the size of the Board from twelve directors to ten directors, effective immediately prior to the convening of the 2023 annual meeting of shareholders on June 13, 2023.
The above summary does not purport to be complete and is qualified in its entirety by reference to the Amended and Restated By-Laws, effective June 13, 2023, a copy of which is filed as Exhibit 3.3 to this Annual Report on Form 10-K and is incorporated herein by reference.
Item 9C. Disclosure Regarding Foreign Jurisdictions that Prevent Inspections.
Not Applicable.
PART III
Item 10. Directors, Executive Officers and Corporate Governance
The information concerning our Directors and Executive Officers required by this Item is incorporated by reference to Dollar Tree, Inc.’s Proxy Statement relating to our 2023 Annual Meeting (“Proxy Statement”), under the captions “Director Biographies” and “Executive Officers.”
To the extent disclosure of any delinquent report under Section 16(a) of the Securities Exchange Act of 1934 is made by us, such disclosure will be set forth under the caption “Delinquent Section 16(a) Reports” in our Proxy Statement, which is incorporated herein by reference.
The information concerning our audit committee and audit committee financial experts required by this Item is incorporated herein by reference to the Proxy Statement, under the caption “The Board and Its Committees.”
The information concerning our code of ethics required by this Item is incorporated by reference to the Proxy Statement, under the caption “Board Governance - Code of Ethics.”
Item 11. Executive Compensation
Information set forth in the Proxy Statement under the captions “Compensation Committee Report on Executive Compensation,” “Compensation Discussion and Analysis,” “Annual Compensation of Executive Officers,” “Pay Ratio Disclosure,” and “Director Compensation” is incorporated herein by reference.
Item 12. Security Ownership of Certain Beneficial Owners and Management and Related Stockholder Matters
Equity Compensation Plans
The following table summarizes information regarding shares issuable as of January 28, 2023, under our equity compensation plans, including the number of shares of common stock subject to options, restricted stock units, deferred shares and other rights granted to employees and members of our Board of Directors; the weighted-average exercise price of outstanding options; and the number of shares remaining available for future award grants under these plans. Additional information regarding our equity compensation plans can be found in Note 10 to our consolidated financial statements.
| Equity compensation plan category | (a) Number of securities to be issued upon exercise of outstanding options, warrants and rights | (b) Weighted-average exercise price of outstanding options, warrants and rights | (c) Number of securities remaining available for future issuance under equity compensation plans (excluding securities reflected in column (a)) | |||||||||||||||||
| Plans approved by security holders1 | 1,240,339 | $ | 108.38 | 8,696,011 | ||||||||||||||||
| Plans not approved by security holders2 | 2,252,587 | $ | 157.17 | — |
(a)Amounts represent outstanding options, restricted stock units and deferred (“phantom”) shares as of January 28, 2023.
(b)Not included in the calculation of weighted-average exercise price are (i) 1,192,291 restricted stock units and (ii) 37,273 director deferred shares.
(c)The 8,696,011 shares remaining available for future issuance under our equity-based plans approved by security holders includes 5,799,159 shares remaining under our 2021 Omnibus Incentive Plan, 2,507,678 shares remaining under our 2015 Employee Stock Purchase Plan and 389,174 shares remaining under our 2013 Director Deferred Compensation Plan.
1Equity-based plans approved by our shareholders include: the 2013 Director Deferred Compensation Plan, the 2015 Employee Stock Purchase Plan (which replaced a predecessor plan), and the 2021 Omnibus Incentive Plan (which replaced the 2011 Omnibus Incentive Plan). As of March 17, 2021, the 2011 Omnibus Incentive Plan was no longer available for new grants of awards, but all outstanding awards that were granted under the plan prior to March 17, 2021 continue to be governed by the terms and conditions of the plan and applicable award agreements.
2In connection with our employment of Richard W. Dreiling as Executive Chairman of the Board in March 2022, Mr. Dreiling was granted a one-time award of options to purchase 2,252,587 shares of Company common stock as an employment inducement grant within the meaning of Rule 5635(c)(4) of the NASDAQ Listing Rules. The amount shown in the table does not include 13,575 shares to be issued upon the exercise of options with a weighted-average exercise price of $77.06 that were granted under the Family Dollar 2006 Incentive Plan and assumed by us in connection with our merger with Family Dollar.
Information set forth in the Proxy Statement under the caption “Ownership of Common Stock,” with respect to security ownership of certain beneficial owners and management, is incorporated herein by reference.
Item 13. Certain Relationships and Related Transactions, and Director Independence
Information set forth in the Proxy Statement under the caption “Certain Relationships and Related Transactions,” is incorporated herein by reference.
The information concerning the independence of our directors required by this Item is incorporated by reference to the Proxy Statement under the caption “Board Governance - Independence.”
Item 14. Principal Accountant Fees and Services
Information set forth in the Proxy Statement under the caption “Ratification of Appointment of Independent Auditors,” is incorporated herein by reference.
PART IV
Item 15. Exhibit and Financial Statement Schedules
1.Documents filed as part of this report**:**
1.Financial Statements. Reference is made to the Index to the Consolidated Financial Statements set forth under Part II, Item 8 of this Form 10-K.
- Financial Statement Schedules. All schedules for which provision is made in the applicable accounting regulations of the Securities and Exchange Commission are not required under the related instructions, are not applicable, or the information is included in the Consolidated Financial Statements, and therefore have been omitted.
3.Exhibits. The following exhibits are filed as part of, or incorporated by reference into, this report.
| Incorporated by Reference | ||||||||||||||||||||||||||||||||
| Exhibit | Exhibit Description | Form | Exhibit | Filing Date | Filed Herewith | |||||||||||||||||||||||||||
| 3.1 | Amended and Restated Articles of Incorporation of Dollar Tree, Inc., effective October 14, 2022 | 10-Q | 3.1 | 11/22/2022 | ||||||||||||||||||||||||||||
| 3.2 | Amended and Restated By-Laws of Dollar Tree, Inc., effective January 30, 2023 | 8-K | 3.1 | 1/31/2023 | ||||||||||||||||||||||||||||
| 3.3 | Amended and Restated By-Laws of Dollar Tree, Inc., effective June 13, 2023 | X | ||||||||||||||||||||||||||||||
| 4.1 | Form of Common Stock Certificate | 8-K | 4.1 | 3/13/2008 | ||||||||||||||||||||||||||||
| 4.2.1 | Indenture, dated as of April 2, 2018, between Dollar Tree, Inc., as issuer, and U.S. Bank National Association, as trustee | S-3 ASR | 4.1 | 4/2/2018 | ||||||||||||||||||||||||||||
| 4.2.2 | First Supplemental Indenture, dated as of April 19, 2018, between Dollar Tree, Inc. and U.S. Bank National Association, as trustee | 8-K | 4.1 | 4/20/2018 |
Item 16. Form 10-K Summary
None.
SIGNATURES
Pursuant to the requirements of Section 13 or 15(d) of the Securities Exchange Act of 1934, the registrant has duly caused this report to be signed on its behalf by the undersigned, thereunto duly authorized.
| DOLLAR TREE, INC. | ||||||||
| (Registrant) | ||||||||
| March 10, 2023 | By: /s/ Richard W. Dreiling | |||||||
| Date | Richard W. Dreiling | |||||||
| Chairman and Chief Executive Officer | ||||||||
| (Principal Executive Officer) | ||||||||
| March 10, 2023 | By: /s/ Jeffrey A. Davis | |||||||
| Date | Jeffrey A. Davis | |||||||
| Chief Financial Officer | ||||||||
| (Principal Financial Officer) | ||||||||
| March 10, 2023 | By: /s/ Kathleen E. Mallas | |||||||
| Date | Kathleen E. Mallas | |||||||
| Senior Vice President - Chief Accounting Officer and Treasurer | ||||||||
| (Principal Accounting Officer) |
Pursuant to the requirements of the Securities Exchange Act of 1934, this report has been signed below by the following persons on behalf of the registrant and in the capacities and on the dates indicated. Each of the directors of the registrant whose signature appears below hereby appoints Jeffrey A. Davis, Kathleen E. Mallas, and John S. Mitchell, and each of them severally, as his or her attorney-in-fact to sign in his or her name and behalf, in any and all capacities stated below, and to file with the Securities and Exchange Commission any and all amendments to this report, making such changes in this report as appropriate, and generally to do all such things on their behalf in their capacities as directors and/or officers to enable the registrant to comply with the provisions of the Securities Exchange Act of 1934, and all requirements of the Securities and Exchange Commission.
| /s/ Richard W. Dreiling | Chairman and Chief Executive Officer | March 10, 2023 | ||||||
| Richard W. Dreiling | (Principal Executive Officer) | Date | ||||||
| /s/ Paul C. Hilal | Vice Chairman | March 10, 2023 | ||||||
| Paul C. Hilal | Date | |||||||
| /s/ Edward J. Kelly, III | Lead Independent Director | March 10, 2023 | ||||||
| Edward J. Kelly, III | Date | |||||||
| /s/ Thomas W. Dickson | Director | March 10, 2023 | ||||||
| Thomas W. Dickson | Date | |||||||
| /s/ Cheryl W. Grisé | Director | March 10, 2023 | ||||||
| Cheryl W. Grisé | Date | |||||||
| /s/ Daniel J. Heinrich | Director | March 10, 2023 | ||||||
| Daniel J. Heinrich | Date | |||||||
| /s/ Mary A. Laschinger | Director | March 10, 2023 | ||||||
| Mary A. Laschinger | Date | |||||||
| /s/ Jeffrey G. Naylor | Director | March 10, 2023 | ||||||
| Jeffrey G. Naylor | Date | |||||||
| /s/ Winnie Y. Park | Director | March 10, 2023 | ||||||
| Winnie Y. Park | Date | |||||||
| /s/ Bertram L. Scott | Director | March 10, 2023 | ||||||
| Bertram L. Scott | Date | |||||||
| /s/ Stephanie P. Stahl | Director | March 10, 2023 | ||||||
| Stephanie P. Stahl | Date |