 filings.tools
Healthpeak Properties 10-K 2014-12-31
Filed 2015-02-10. 21 sections, 658K characters. Original on sec.gov · Markdown · JSON
Cover and table of contents
10-K 1 hcp-20141231x10k.htm 10-K
UNITED STATES
SECURITIES AND EXCHANGE COMMISSION
Washington, D.C. 20549
Form 10-K
| (Mark One) | |
| ☒ | ANNUAL REPORT PURSUANT TO SECTION 13 OR 15(d) OF THE SECURITIES EXCHANGE ACT OF 1934 |
| For the fiscal year ended December 31, 2014 | |
| or | |
| ☐ | TRANSITION REPORT PURSUANT TO SECTION 13 OR 15(d) OF THE SECURITIES EXCHANGE ACT OF 1934 |
| For the transition period from to | |
| Commission file number 1-08895 |
HCP, Inc.
(Exact name of registrant as specified in its charter)
| Maryland | 33-0091377 |
| (State or other jurisdiction of incorporation or organization) | (I.R.S. Employer Identification No.) |
| 1920 Main Street, Suite 1200 Irvine, California | 92614 (Zip Code) |
| (Address of principal executive offices) | |
| Registrant’s telephone number, including area code (949) 407-0700 | |
| Securities registered pursuant to Section 12(b) of the Act: |
| Title of each class | Name of each exchange on which registered |
| Common Stock | New York Stock Exchange |
Indicate by check mark if the registrant is a well-known seasoned issuer, as defined in Rule 405 of the Securities Act. Yes ☒ No ☐
Indicate by check mark if the registrant is not required to file reports pursuant to Section 13 or Section 15(d) of the Act. Yes ☐ No ☒
Indicate by check mark whether the registrant; (1) has filed all reports required to be filed by Section 13 or 15(d) of the Securities Exchange Act of 1934 during the preceding 12 months (or for such shorter period that the registrant was required to file such reports), and (2) has been subject to such filing requirements for the past 90 days. Yes ☒ No ☐
Indicate by check mark whether the registrant has submitted electronically and posted on its corporate Web site, if any, every Interactive Data File required to be submitted and posted pursuant to Rule 405 of Regulation S-T (§232.405 of this chapter) during the preceding 12 months (or for such shorter period that the registrant was required to submit and post such files). Yes ☒ No ☐
Indicate by check mark if disclosure of delinquent filers pursuant to Item 405 of Regulation S-K (§ 229.405 of this chapter) is not contained herein, and will not be contained, to the best of registrant’s knowledge, in definitive proxy or information statements incorporated by reference in Part III of this Form 10-K or any amendment to this Form 10-K. ☒
Indicate by check mark whether the registrant is a large accelerated filer, an accelerated filer, a non-accelerated filer, or a smaller reporting company. See the definitions of “large accelerated filer,” “accelerated filer” and “smaller reporting company” in Rule 12b-2 of the Exchange Act. (check one):
| Large accelerated filer ☒ | Accelerated filer ☐ | Non-accelerated filer ☐ (Do not check if a smaller reporting company) | Smaller reporting company ☐ |
Indicate by check mark whether the registrant is a shell company (as defined by Rule 12b-2 of the Act.) Yes ☐ No ☒
State the aggregate market value of the voting and non-voting common equity held by non-affiliates computed by reference to the price at which the common equity was last sold, or the average bid and asked price of such common equity, as of the last business day of the registrant’s most recently completed second fiscal quarter: $16.7 billion.
As of January 30, 2015 there were 460,763,248 shares of common stock outstanding.
DOCUMENTS INCORPORATED BY REFERENCE
Portions of the definitive Proxy Statement for the registrant’s 2015 Annual Meeting of Stockholders have been incorporated by reference into Part III of this Report.
HCP, Inc.
Form 10-K
For the Fiscal Year Ended December 31, 2014
Table of Contents
All references in this report to “HCP,” the “Company,” “we,” “us” or “our” mean HCP, Inc., together with its consolidated subsidiaries. Unless the context suggests otherwise, references to “HCP, Inc.” mean the parent company without its subsidiaries.
Cautionary Language Regarding Forward-Looking Statements
Statements in this Annual Report on Form 10-K that are not historical factual statements are “forward-looking statements.” We intend to have our forward-looking statements covered by the safe harbor provisions of the Private Securities Litigation Reform Act of 1995 and include this statement for purposes of complying with those provisions. Forward-looking statements include, among other things, statements regarding our and our officers’ intent, belief or expectation as identified by the use of words such as “may,” “will,” “project,” “expect,” “believe,” “intend,” “anticipate,” “seek,” “forecast,” “plan,” “potential,” “estimate,” “could,” “would,” “should” and other comparable and derivative terms or the negatives thereof. Any such forward-looking statements reflect our current expectations and views about future events and are subject to a number of risks and uncertainties that could significantly affect the Company’s future financial condition and results of operations. While forward-looking statements reflect our good faith belief and reasonable assumptions based upon current information, we can give no assurance that our expectations or forecasts will be attained. Further, we cannot guarantee the accuracy of any such forward-looking statement contained in this Annual Report, and such forward-looking statements are subject to known and unknown risks and uncertainties that are difficult to predict. As more fully set forth under “Item 1A, Risk Factors” in this report, risks and uncertainties that may cause our actual results to differ materially from the expectations contained in the forward-looking statements include, among other things:
| (a) | our reliance on a concentration of a small number of tenants and operators for a significant portion of our revenues; |
|---|
| (b) | the financial weakness of tenants and operators, including potential bankruptcies and downturns in their businesses, which results in uncertainties regarding our ability to continue to realize the full benefit of such tenants’ and/or operators’ leases; |
|---|
| (c) | the ability of our tenants and operators to conduct their respective businesses in a manner sufficient to maintain or increase their revenues and to generate sufficient income to make rent and loan payments to us and our ability to recover investments made, if applicable, in their operations; |
|---|
| (d) | competition for tenants and operators, including with respect to new leases and mortgages and the renewal or rollover of existing leases; |
|---|
| (e) | availability of suitable properties to acquire at favorable prices and the competition for the acquisition and financing of those properties; |
|---|
| (f) | our ability to negotiate the same or better terms with new tenants or operators if existing leases are not renewed or we exercise our right to replace an existing tenant or operator upon default; |
|---|
| (g) | the risks associated with our investments in joint ventures and unconsolidated entities, including our lack of sole decision making authority and our reliance on our partners’ financial condition and continued cooperation; |
|---|
| (h) | the risk that we may not be able to achieve the benefits of investments within expected time frames or at all, or within expected cost projections; |
|---|
| (i) | the potential impact of future litigation matters, including the possibility of larger than expected litigation costs, adverse results and related developments; |
|---|
| (j) | the effect on healthcare providers of legislation addressing entitlement programs and related services, including Medicare and Medicaid, which may result in future reductions in reimbursements; |
|---|
| (k) | changes in federal, state or local laws and regulations, including those affecting the healthcare industry that affect our costs of compliance or increase the costs, or otherwise affect the operations, of our tenants and operators; |
|---|
| (l) | volatility or uncertainty in the capital markets, the availability and cost of capital as impacted by interest rates, changes in our credit ratings, and the value of our common stock, and other conditions that may adversely impact our ability to fund our obligations or consummate transactions, or reduce the earnings from potential transactions; |
|---|
| (m) | changes in global, national and local economic conditions, and currency exchange rates; |
|---|
| (n) | changes in the credit ratings on United States (“U.S.”) government debt securities or default or delay in payment by the U.S. of its obligations; |
|---|
| (o) | our ability to manage our indebtedness level and changes in the terms of such indebtedness; and |
|---|
| (p) | the ability to maintain our qualification as a real estate investment trust. |
|---|
We do not undertake, and hereby disclaim, any obligation to update any forward-looking statements, which speak only as of the date on which they are made.
PART I
Item 1. Business
General Overview
HCP, an S&P 500 company, invests primarily in real estate serving the healthcare industry in the United States. We are a Maryland corporation organized in 1985 and qualify as a self-administered real estate investment trust (“REIT”). We are headquartered in Irvine, California, with offices in Nashville, Los Angeles, San Francisco and London. Our diverse portfolio is comprised of investments in the following healthcare segments: (i) senior housing, (ii) post-acute/skilled nursing, (iii) life science, (iv) medical office and (v) hospital.
Portfolio Summary: At December 31, 2014, we managed $24.3 billion of investments in our Owned Portfolio and Unconsolidated Joint Ventures and owned $483 million of assets under Development and Redevelopment.
Owned Portfolio. At December 31, 2014, our leases, operating properties and debt investments in our owned portfolio consisted of the following (square feet and dollars in thousands):
| Number of | Investment(3) | Total | Interest | ||||||||||||||||||
| Segment | Properties(1) | Capacity(2) | Properties(1) | Debt | Investment | NOI(4) | Income | ||||||||||||||
| Senior housing | 465 | 45,358 | Units | $ | 7,782,877 | $ | 152,733 | $ | 7,935,610 | $ | 695,672 | $ | 14,249 | ||||||||
| Post-acute/ skilled | 301 | 38,309 | Beds | 5,875,525 | 968,200 | 6,843,725 | 553,235 | 60,242 | |||||||||||||
| Life science | 111 | 7,321 | Sq. ft. | 3,648,505 | — | 3,648,505 | 251,034 | — | |||||||||||||
| Medical office | 215 | 15,222 | Sq. ft. | 3,023,953 | — | 3,023,953 | 222,757 | — | |||||||||||||
| Hospital | 16 | 2,221 | Beds | 594,048 | 17,470 | 611,518 | 82,678 | — | |||||||||||||
| Total | 1,108 | $ | 20,924,908 | $ | 1,138,403 | $ | 22,063,311 | $ | 1,805,376 | $ | 74,491 |
| (1) | Represents 1,040 properties under lease with an investment value of $19.3 billion and 68 operating properties under RIDEA structures (see “Healthcare Segments—Senior housing” section below) with an investment value of $1.6 billion. |
|---|
| (2) | Senior housing facilities are measured in available units (e.g., studio, one or two bedroom units). Post-acute/skilled nursing facilities and hospitals are measured in available bed count. Life science and medical office buildings are measured in square feet (“sq. ft.”). |
|---|
| (3) | Property investment represents: (i) the carrying amount of real estate and intangibles, after adding back accumulated depreciation and amortization, and (ii) the carrying amount of direct financing leases. Debt investment represents the carrying amount of loans receivable and marketable debt securities. |
|---|
| (4) | Net Operating Income from continuing operations (“NOI”) is a non-GAAP supplemental financial measure used to evaluate the operating performance of real estate properties. For a reconciliation of net income to NOI for 2014, refer to Note 14 to the Consolidated Financial Statements. |
|---|
Unconsolidated Joint Ventures. At December 31, 2014, we had interests in significant unconsolidated joint ventures representing 88 properties with an aggregate investment of $2.2 billion primarily in our senior housing, life science and medical office segments.
Developments and Redevelopments. At December 31, 2014, we had an aggregate investment of $483 million in assets under development, redevelopment and land held for future development, which are primarily in our life science and medical office segments.
For a description of our significant activities during 2014, see Item 7 in this report.
Business Strategy
We invest and manage our real estate portfolio for the long-term to maximize the benefit to our shareholders and support the growth of our dividends. The core elements of our strategy are: (i) to acquire, develop, lease, own and manage a diversified portfolio of quality healthcare properties across multiple business segments and geographic locations (including Europe); (ii) to align ourselves with leading healthcare companies, operators and service providers, which over the long-term should result in higher relative rental rates, net operating cash flows and appreciation of property values; (iii) to concentrate on longer-term escalating triple-net leases with high-quality tenants, while using RIDEA structures for properties that have higher growth potential; (iv) to maintain adequate liquidity with long-term fixed rate debt financing with staggered maturities, which supports the longer-term nature of our investments, while reducing our exposure to interest rate volatility and refinancing risk at any point in the interest rate or credit cycles; and (v) to continue to manage our balance sheet with a targeted financial leverage of 40% relative to our assets.
Internal Growth Strategies
We believe that our longer-term escalating triple-net leases with financially strong tenants and operators enhance the quality, stability and growth of our rental income. Further, we believe many of our existing properties hold the potential for increased future cash flows as they are of high quality and in desirable locations within markets where the creation of new supply is limited by the lack of available sites and the difficulty of obtaining the necessary licensing, other approvals and/or financing. Our strategy for maximizing the benefits from these opportunities is to: (i) work with new or existing tenants and operators to address their space and capital needs and (ii) provide high-quality property management services in order to motivate tenants to renew, expand or relocate into our properties.
We expect to continue our internal growth as a result of our ability to:
| · | Build and maintain long-term leasing and management relationships with quality tenants and operators. In choosing locations for our properties, we focus our attention on their physical environment, adjacency to established businesses (e.g., hospital systems) and educational centers, proximity to sources of business growth and other local demographic factors. |
|---|
| · | Replace tenants and operators quickly at the best available market terms and lowest possible transaction costs. We believe that we are well-positioned to attract new tenants and operators and achieve attractive rental rates and operating cash flow as a result of the location, design and maintenance of our properties, together with our reputation for high-quality building services and responsiveness to tenants, and our ability to offer space alternatives within our portfolios. |
|---|
| · | Extend and modify terms of existing leases prior to expiration. We structure lease extensions, early renewals or modifications, which reduce the cost associated with lease downtime or the re-investment risk resulting from the exercise of tenants’ purchase options, while securing the tenancy and/or relationship of our high quality tenants and operators on a long-term basis. |
|---|
Investment Strategies
The delivery of healthcare services requires real estate and, as a result, tenants and operators depend on real estate, in part, to maintain and grow their businesses. We believe that the healthcare real estate market provides investment opportunities due to the: (i) compelling demographics driving the demand for healthcare services; (ii) specialized nature of healthcare real estate investing; and (iii) ongoing consolidation of the fragmented healthcare real estate sector.
While we emphasize healthcare real estate ownership, we may also provide real estate secured financing to, or invest in equity or debt securities of, healthcare operators or other entities engaged in healthcare real estate ownership. We may also acquire all or substantially all of the securities or assets of other REITs, operating companies or similar entities where such investments would be consistent with our investment strategies. We may co-invest alongside institutional or development investors through partnerships or limited liability companies.
We monitor, but do not limit, our investments based on the percentage of our total assets that may be invested in any one property type, investment vehicle or geographic location, the number of properties that may be leased to a single tenant or operator, or loans that may be made to a single borrower. In allocating capital to our multiple segments, we target
opportunities with the most attractive risk/reward profile for our portfolio as a whole. We may take additional measures to mitigate risk, including diversifying our investments (by sector, geography, tenant or operator), structuring transactions as master leases, requiring tenant or operator insurance and indemnifications, and obtaining credit enhancements in the form of guarantees, letters of credit or security deposits.
We believe we are well positioned to achieve external growth through acquisitions, financing and development. Other factors that contribute to our competitive position include:
| · | our reputation gained through nearly 30 years of successful operations and the stability and strength of our existing portfolio of properties; |
|---|
| · | our relationships with leading healthcare operators, private equity firms, corporations, non-profits and public institutions seeking to monetize existing assets or develop new facilities; |
|---|
| · | our relationships with institutional buyers and sellers of high-quality healthcare real estate assets; |
|---|
| · | our ability to act quickly on due diligence and financing due to the strength of our experienced management team and balance sheet liquidity; |
|---|
| · | our track record and reputation for executing acquisitions responsively and efficiently, which provides confidence to domestic and foreign institutions and private investors who seek to sell healthcare real estate in our market areas; |
|---|
| · | our relationships with nationally recognized financial institutions that provide capital to the healthcare and real estate industries; and |
|---|
| · | our control of sites (including assets under contract with radius restrictions). |
|---|
Financing Strategies
Because our REIT qualification requires us to distribute at least 90% of our REIT taxable income (excluding net capital gains), we regularly access the public equity and debt markets to raise the funds necessary to finance acquisitions and debt investments, develop and redevelop properties, and refinance maturing debt.
We may finance acquisitions and other investments through the following vehicles:
| · | issuance of common or preferred stock; |
|---|
| · | issuance or origination of debt, including unsecured notes and mortgage debt; |
|---|
| · | borrowings under our credit facility; or |
|---|
| · | sale of ownership interests in properties or other investments. |
|---|
We maintain a disciplined balance sheet by actively managing our debt to equity levels and maintaining multiple sources of liquidity, such as our revolving line of credit facility, access to capital markets and secured debt lenders, relationships with current and prospective institutional joint venture partners, and our ability to divest of assets. Our debt obligations are primarily long-term fixed rate with staggered maturities, which reduces the impact of rising interest rates on our operations.
We finance our investments based on our evaluation of available sources of funding. For short-term purposes, we may utilize our revolving line of credit facility or arrange for other short-term borrowings from banks or other sources. We arrange for longer-term financing by offering equity and debt securities, placing mortgage debt and obtaining capital from institutional lenders.
Competition
Investing in real estate serving the healthcare industry is highly competitive. We face competition from other REITs, investment companies, pension funds, private equity and hedge fund investors, sovereign funds, healthcare operators, lenders, developers and other institutional investors, some of whom may have greater flexibility (e.g., non-REIT competitors), resources and lower costs of capital than we do. Increased competition makes it more challenging for us to identify and successfully capitalize on opportunities that meet our objectives. Our ability to compete may also be impacted by global, national and local economic trends, availability of investment alternatives, availability and cost of capital, construction and renovation costs, existing laws and regulations, new legislation and population trends.
Income from our investments is dependent on the ability of our tenants and operators to compete with other companies on a number of different levels, including: the quality of care provided, reputation, success of product or drug development, the physical appearance of a facility, price and range of services offered, alternatives for healthcare delivery, the supply of competing properties, physicians, staff, referral sources, location, the size and demographics of the population in surrounding areas, and the financial condition of our tenants and operators. Private, federal and state payment programs, and government reimbursement, as well as the effect of laws and regulations, may also have a significant influence on the profitability of our tenants and operators. For a discussion of the risks associated with competitive conditions affecting our business, see “Item 1A, Risk Factors” in this report.
Healthcare Segments
Senior housing. At December 31, 2014, we had interests in 479 senior housing facilities, including 14 properties owned by our unconsolidated joint ventures. Our senior housing facilities are primarily triple-net leased and include independent living facilities (“ILFs”), assisted living facilities (“ALFs”), memory care facilities (“MCFs”), care homes, and continuing care retirement communities (“CCRCs”), which cater to different segments of the elderly population based upon their personal needs. Services provided by our tenants or operators in these facilities are primarily paid for by the residents directly or through private insurance and are less reliant on government reimbursement programs such as Medicare and Medicaid. Our senior housing property types are further described below:
| · | Independent Living Facilities. ILFs are designed to meet the needs of seniors who choose to live in an environment surrounded socially by their peers with services such as housekeeping, meals and activities. These residents generally do not need assistance with activities of daily living (“ADL”). However, in some of our facilities, residents have the option to contract for these services. At December 31, 2014, we had interests in 64 ILFs. |
|---|
| · | Assisted Living Facilities. ALFs are licensed care facilities that provide personal care services, support and housing for those who need help with ADL, such as bathing, eating, dressing and medication management, yet require limited medical care. The programs and services may include transportation, social activities, exercise and fitness programs, beauty or barber shop access, hobby and craft activities, community excursions, meals in a dining room setting and other activities sought by residents. These facilities are often in apartment-like buildings with private residences ranging from single rooms to large apartments. Certain ALFs may dedicate a portion of a facility that offer higher levels of personal assistance for residents requiring memory care as a result of Alzheimer’s disease or other forms of dementia. Levels of personal assistance are based in part on local regulations. At December 31, 2014, we had interests in 345 ALFs. |
|---|
| · | Memory Care Facilities. MCFs address the unique challenges of our residents with Alzheimer’s disease or other forms of dementia. Residents may live in semi-private apartments or private rooms and have structured activities delivered by staff members trained specifically on how to care for residents with memory impairment. These facilities offer programs that provide comfort and care in a secure environment for residents with memory loss issues in comfortable settings. At December 31, 2014, we had interests in 21 MCFs. |
|---|
| · | Care Homes (United Kingdom). Care homes offer personal care services, such as lodging, meal services, housekeeping and laundry services, medication management and assistance with ADL. Care homes are registered to provide different levels of services, ranging from personal care to nursing care. Some homes can be further registered for a specific care need, such as dementia or terminal illness. At December 31, 2014, we had interests in 23 care homes. |
|---|
| · | Continuing Care Retirement Communities. CCRCs offer several levels of assistance, including independent living, assisted living and nursing home care. CCRCs are different from other housing and care options for seniors because they usually provide written agreements or long-term contracts between residents and the communities (frequently lasting the term of the resident's lifetime), which offer a continuum of housing, services and healthcare on one campus or site. CCRCs are appealing as they allow residents to “age in place.” CCRCs typically require the individual to be in relatively good health and independent upon entry. At December 31, 2014, we had interests in 26 CCRCs. |
|---|
Our senior housing segment accounted for approximately 39%, 36% and 33% of total revenues for the years ended December 31, 2014, 2013 and 2012, respectively. The following table provides information about our senior housing tenant/operator concentration for the year ended December 31, 2014:
| Percentage of | Percentage of | ||||
| Tenants/Operators | Segment Revenues | Total Revenues | |||
| Brookdale Senior Living, Inc. (“Brookdale”)(1) | 37 | % | 14 | % | |
| HCR ManorCare, Inc. (“HCRMC”)(2) | 8 | % | 26 | % |
| (1) | On July 31, 2014, Brookdale completed its acquisition of Emeritus Corporation (“Emeritus”). Percentages of segment and total revenues presented are prepared on a pro forma basis to reflect the combined concentration for Brookdale and Emeritus, as if the merger had occurred as of the beginning of 2014. On August 29, 2014, HCP and Brookdale amended or terminated all former leases with Emeritus and entered into two RIDEA joint ventures (see Note 3 to the Consolidated Financial Statements regarding the Brookdale Transaction). Percentages do not include senior housing facilities that Brookdale manages (is not a tenant) under a RIDEA structure. |
|---|
| (2) | Percentage of total revenues includes revenues earned from both senior housing and post-acute/skilled nursing facilities leased to HCRMC. |
|---|
We have entered into long-term agreements with Brookdale to manage properties that are operated under a structure permitted by the Housing and Economic Recovery Act of 2008 (commonly referred to as “RIDEA”). Under the provisions of RIDEA, a REIT may lease a “qualified healthcare property” on an arm’s length basis to a taxable REIT subsidiary (“TRS”), if the property is operated on behalf of such subsidiary by a person who qualifies as an “eligible independent contractor.” RIDEA structures allow us to own the risks and rewards of the operations of healthcare facilities (as compared to leasing the property for contractual triple-net rents) in a tax efficient manner. We view RIDEA as a structure primarily to be used on properties that present attractive valuation entry points and/or growth profiles by: (i) transitioning the asset to a new operator that can bring scale, operating efficiencies, and/or ancillary services; or (ii) investing capital to reposition the asset. Brookdale provides comprehensive facility management and accounting services with respect to our senior housing RIDEA properties, for which we pay annual management fees pursuant to the aforementioned agreements. Most of the management agreements have terms ranging from 10 to 15 years, with 5-year renewals. The base management fees are 4.5% to 5.0% of gross revenues (as defined) generated by the RIDEA facilities. In addition, there are incentive management fees payable to Brookdale if operating results of the RIDEA properties exceed pre-established EBITDAR (as defined) thresholds. As of January 1, 2015, 83 properties are under RIDEA structures, 14 of which are owned by our CCRC unconsolidated joint venture (discussed below in Item 7).
Post-acute/skilled nursing. At December 31, 2014, we had interests in 301 post-acute/skilled nursing facilities (“SNFs”). SNFs offer restorative, rehabilitative and custodial nursing care for people following a hospital stay or not requiring the more extensive and complex treatment available at hospitals. Ancillary revenues and revenues from sub-acute care services are derived from providing services to residents beyond room and board and include occupational, physical, speech, respiratory and intravenous therapy, wound care, oncology treatment, brain injury care and orthopedic therapy, as well as sales of pharmaceutical products and other services. Certain SNFs provide some of the foregoing services on an out-patient basis. Post-acute/skilled nursing services provided by our tenants and operators in these facilities are paid for by private sources, third-party payors (e.g., insurance and Health Maintenance Organizations or “HMOs”) or through the Medicare and Medicaid programs. All of our SNFs are triple-net leased.
Our post-acute/skilled nursing segment accounted for approximately 27%, 29% and 29% of total revenues for the years ended December 31, 2014, 2013 and 2012, respectively. The following table provides information about our post-acute/skilled nursing tenant/operator concentration for the year ended December 31, 2014:
| Percentage of | Percentage of | ||||
| Tenants/Operators | Segment Revenues | Total Revenues | |||
| HCR ManorCare, Inc. (“HCRMC”)(1) | 85 | % | 26 | % |
| (1) | Percentage of total revenues includes revenues earned from both senior housing and post-acute/skilled nursing facilities leased to HCRMC. |
|---|
Life science. At December 31, 2014, we had interests in and managed 115 life science properties, including four facilities owned by our unconsolidated joint ventures. These properties contain laboratory and office space primarily for biotechnology, medical device and pharmaceutical companies, scientific research institutions, government agencies and other organizations involved in the life science industry. While these properties have characteristics similar to commercial office buildings, they generally contain more advanced electrical, mechanical, and heating, ventilating and air conditioning (“HVAC”) systems. The facilities generally have specialty equipment including emergency generators, fume hoods, lab bench tops and related amenities. In many instances, life science tenants make significant investments to improve their leased space, in addition to landlord improvements, to accommodate biology, chemistry or medical device research initiatives.
Life science properties are primarily configured in business park or campus settings and include multiple buildings. The business park and campus settings allow us the opportunity to provide flexible, contiguous/adjacent expansion to accommodate the growth of existing tenants. Our properties are located in well-established geographical markets known for scientific research, including San Francisco and San Diego, California, Salt Lake City, Utah, Durham, North Carolina and Boston, Massachusetts. At December 31, 2014, 97% of our life science properties were triple-net leased (based on leased square feet).
Our life science segment accounted for approximately 14%, 14% and 15% of total revenues for the years ended December 31, 2014, 2013 and 2012, respectively. The following table provides information about our life science tenant concentration for the year ended December 31, 2014:
| Percentage of | Percentage of | ||||
| Tenants | Segment Revenues | Total Revenues | |||
| Genentech, Inc. | 18 | % | 3 | % | |
| Amgen, Inc. | 17 | % | 2 | % |
Medical office. At December 31, 2014, we had interests in and managed 281 medical office buildings (“MOBs”), including 66 facilities owned by our significant unconsolidated joint ventures. MOBs typically contain physicians’ offices and examination rooms, and may also include pharmacies, hospital ancillary service space and outpatient services such as diagnostic centers, rehabilitation clinics and day-surgery operating rooms. While these facilities are similar to commercial office buildings, they require additional plumbing, electrical and mechanical systems to accommodate multiple exam rooms that may require sinks in every room, and special equipment such as x-ray machines. In addition, MOBs are often built to accommodate higher structural loads for certain equipment and may contain vaults or other specialized construction. Our MOBs are typically multi-tenant properties leased to healthcare providers (hospitals and physician practices), with approximately 79% of our MOBs, based on square feet, located on hospital campuses and 94% are affiliated with hospital systems. At December 31, 2014, 48% of our medical office buildings were triple-net leased (based on leased square feet).
Our medical office segment accounted for approximately 16%, 17% and 18% of total revenues for the years ended December 31, 2014, 2013 and 2012, respectively. The following table provides information about our medical office tenant/operator concentration for the year ended December 31, 2014:
| Percentage of | Percentage of | ||||
| Tenants/Operators | Segment Revenues | Total Revenues | |||
| HCA(1) | 16 | % | 4 | % |
| (1) | Percentage of total revenues from HCA includes revenues earned from both our medical office and hospital segments. |
|---|
Hospital. At December 31, 2014, we had interests in and managed 20 hospitals, including four facilities owned by our unconsolidated joint ventures. Services provided by our tenants and operators in these facilities are paid for by private sources, third-party payors (e.g., insurance and HMOs) or through Medicare and Medicaid programs. Our hospital property types include acute care, long-term acute care, specialty and rehabilitation hospitals. All of our hospitals are triple-net leased.
Our hospital segment accounted for approximately 4%, 4% and 5% of total revenues for the years ended December 31, 2014, 2013 and 2012, respectively. The following table provides information about our hospital tenant/operator concentration for the year ended December 31, 2014:
| Percentage of | Percentage of | ||||
| Tenants/Operators | Segment Revenues | Total Revenues | |||
| HCA(1) | 28 | % | 4 | % | |
| Tenet Healthcare Corporation | 27 | % | 1 | % |
| (1) | Percentage of total revenues from HCA includes revenues earned from both our medical office and hospital segments. |
|---|
Sustainability
We believe that sustainability initiatives are a vital part of corporate responsibility, which supports our primary goal of increasing stockholder value through profitable growth. We continue to advance our commitment to sustainability, with a focus on achieving goals in each of the Environmental, Social and Governance (ESG) dimensions of sustainability.
Our environmental management programs strive to capture cost efficiencies that ultimately benefit our investors, tenants, operators and employees, while making a positive impact on the communities in which we operate. Our social responsibility team leads our local philanthropic and volunteer activities, and our transparent corporate governance initiatives incorporate sustainability as a critical component to achieving our business objectives and properly managing risks.
Our 2014 sustainability achievements include being named Global Healthcare Sector Leader by the Global Real Estate Sustainability Benchmark (GRESB) and named to the FTSE4Good Index series, each for the third consecutive year. Additionally, we were named to CDP’s S&P 500 Climate Disclosure Leadership Index (CDLI) and the Dow Jones Sustainability Index for the North American region, each for the second consecutive year. For additional information regarding our sustainability initiatives, please visit our website at www.hcpi.com/sustainability.
Insurance
We obtain various types of insurance to mitigate the impact of property, business interruption, liability, flood, windstorm, earthquake, environmental and terrorism related losses. We attempt to obtain appropriate policy terms, conditions, limits and deductibles considering the relative risk of loss, the cost of such coverage and current industry practice. There are, however, certain types of extraordinary losses, such as those due to acts of war or other events that may be either uninsurable or not economically insurable. In addition, we have a large number of properties that are exposed to earthquake, flood and windstorm occurrences for which the related insurances carry higher deductibles.
We maintain property insurance for all of our properties and this insurance is primary for our medical office, life science and RIDEA facilities. Tenants under triple-net leases, primarily in our senior housing, post-acute/skilled nursing and
hospital segments, are required to provide primary property, business interruption and liability insurance. We maintain separate general and professional liability insurance for our RIDEA facilities. Additionally, our corporate general and professional liability insurance program also extends coverage for all of our properties beyond the aforementioned. Under our management agreements with Brookdale, we may elect, on an annual basis, whether we or Brookdale will bear responsibility for maintaining the required insurance coverage for the applicable properties, but the costs of such insurance are facility expenses paid from the revenues of those properties, regardless of who maintains the insurance.
Employees of HCP
At December 31, 2014, we had 170 full-time employees, none of whom are subject to a collective bargaining agreement.
Government Regulation, Licensing and Enforcement
Overview
Our tenants and operators are typically subject to extensive and complex federal, state and local healthcare laws and regulations relating to quality of care, licensure and certificate of need, government reimbursement, fraud and abuse practices, and similar laws governing the operation of healthcare facilities, and we expect that the healthcare industry, in general, will continue to face increased regulation and pressure in the areas of fraud, waste and abuse, cost control, healthcare management and provision of services, among others. These regulations are wide ranging and can subject our tenants and operators to civil, criminal and administrative sanctions. Affected tenants and operators may find it increasingly difficult to comply with this complex and evolving regulatory environment because of a relative lack of guidance in many areas as certain of our healthcare properties are subject to oversight from several government agencies and the laws may vary from one jurisdiction to another. Changes in laws, regulations, reimbursement enforcement activity and regulatory non-compliance by our tenants and operators can all have a significant effect on their operations and financial condition, which in turn may adversely impact us, as detailed below and set forth under “Item 1A, Risk Factors” in this report.
Based on information primarily provided by our tenants and operators, excluding our medical office segment, at December 31, 2014, we estimate that approximately 15% and 14% of the annualized base rental payments received from our tenants and operators were dependent on Medicare and Medicaid reimbursement, respectively.
The following is a discussion of certain laws and regulations generally applicable to our operators, and in certain cases, to us.
Fraud and Abuse Enforcement
There are various extremely complex federal and state laws and regulations governing healthcare providers’ relationships and arrangements and prohibiting fraudulent and abusive practices by such providers. These laws include: (i) federal and state false claims acts, which, among other things, prohibit providers from filing false claims or making false statements to receive payment from Medicare, Medicaid or other federal or state healthcare programs; (ii) federal and state anti-kickback and fee-splitting statutes, including the Medicare and Medicaid anti-kickback statute, which prohibit the payment or receipt of remuneration to induce referrals or recommendations of healthcare items or services; (iii) federal and state physician self-referral laws (commonly referred to as the “Stark Law”), which generally prohibit referrals by physicians to entities with which the physician or an immediate family member has a financial relationship; (iv) the federal Civil Monetary Penalties Law, which prohibits, among other things, the knowing presentation of a false or fraudulent claim for certain healthcare services and (v) federal and state privacy laws, including the privacy and security rules contained in the Health Insurance Portability and Accountability Act of 1996 (commonly referred to as “HIPAA”), which provide for the privacy and security of personal health information. Violations of healthcare fraud and abuse laws carry civil, criminal and administrative sanctions, including punitive sanctions, monetary penalties, imprisonment, denial of Medicare and Medicaid reimbursement and potential exclusion from Medicare, Medicaid or other federal or state healthcare programs. These laws are enforced by a variety of federal, state and local agencies and can also be enforced by private litigants through, among other things, federal and state false claims acts, which allow private litigants to bring qui tam or “whistleblower” actions. Many of our tenants and operators are subject to these laws, and may become the subject of governmental enforcement actions if they fail to comply with applicable laws.
Reimbursement
Sources of revenue for many of our tenants and operators include, among others, governmental healthcare programs, such as the federal Medicare programs and state Medicaid programs, and non-governmental third-party payors, such as insurance carriers and HMOs. As federal and state governments focus on healthcare reform initiatives, and as the federal government and many states face significant current and future budget deficits, efforts to reduce costs by these payors will likely continue, which may result in reduced or slower growth in reimbursement for certain services provided by some of our tenants and operators. Additionally, new and evolving payor and provider programs, including but not limited to Medicare Advantage, Dual Eligible, Accountable Care Organizations (“ACO”), and Bundled Payments could adversely impact our tenants’ and operators’ liquidity, financial condition or results of operations.
Healthcare Licensure and Certificate of Need
Certain healthcare facilities in our portfolio are subject to extensive federal, state and local licensure, certification and inspection laws and regulations. In addition, various licenses and permits are required to dispense narcotics, operate pharmacies, handle radioactive materials and operate equipment. Many states require certain healthcare providers to obtain a certificate of need, which requires prior approval for the construction, expansion or closure of certain healthcare facilities. The approval process related to state certificate of need laws may impact some of our tenants’ and operators’ abilities to expand or change their businesses.
Life Science Facilities
While certain of our life science tenants include some well-established companies, other tenants are less established and, in some cases, may not yet have a product approved by the Food and Drug Administration, or other regulatory authorities, for commercial sale. Creating a new pharmaceutical product or medical device requires substantial investments of time and capital, in part because of the extensive regulation of the healthcare industry; it also entails considerable risk of failure in demonstrating that the product is safe and effective and in gaining regulatory approval and market acceptance.
Senior Housing Entrance Fee Communities
Certain of our senior housing facilities are operated as entrance fee communities. Generally, an entrance fee is an upfront fee or consideration paid by a resident, a portion of which may be refundable, in exchange for some form of long-term benefit. Some of the entrance fee communities are subject to significant state regulatory oversight, including, for example, oversight of each facility’s financial condition, establishment and monitoring of reserve requirements and other financial restrictions, the right of residents to cancel their contracts within a specified period of time, lien rights in favor of the residents, restrictions on change of ownership and similar matters.
Americans with Disabilities Act (the “ADA”)
Our properties must comply with the ADA and any similar state or local laws to the extent that such properties are “public accommodations” as defined in those statutes. The ADA may require removal of barriers to access by persons with disabilities in certain public areas of our properties where such removal is readily achievable. To date, we have not received any notices of noncompliance with the ADA that have caused us to incur substantial capital expenditures to address ADA concerns. Should barriers to access by persons with disabilities be discovered at any of our properties, we may be directly or indirectly responsible for additional costs that may be required to make facilities ADA-compliant. Noncompliance with the ADA could result in the imposition of fines or an award of damages to private litigants. The obligation to make readily achievable accommodations pursuant to the ADA is an ongoing one, and we continue to assess our properties and make modifications as appropriate in this respect.
Environmental Matters
A wide variety of federal, state and local environmental and occupational health and safety laws and regulations affect healthcare facility operations. These complex federal and state statutes, and their enforcement, involve a myriad of regulations, many of which involve strict liability on the part of the potential offender. Some of these federal and state statutes may directly impact us. Under various federal, state and local environmental laws, ordinances and regulations, an owner of real property or a secured lender, such as us, may be liable for the costs of removal or remediation of hazardous or toxic substances at, under or disposed of in connection with such property, as well as other potential costs relating to hazardous or toxic substances (including government fines and damages for injuries to persons and adjacent property). The cost of any required remediation, removal, fines or personal or property damages and any related liability therefore
could exceed or impair the value of the property and/or the assets. In addition, the presence of such substances, or the failure to properly dispose of or remediate such substances, may adversely affect the owner’s ability to sell or rent such property or to borrow using such property as collateral which, in turn, could reduce our earnings. For a description of the risks associated with environmental matters, see “Item 1A, Risk Factors” in this report.
Available Information
Our website address is www.hcpi.com. Our Annual Reports on Form 10-K, Quarterly Reports on Form 10-Q, Current Reports on Form 8-K and any amendments to those reports filed or furnished pursuant to Section 13(a) or 15(d) of the Securities Exchange Act of 1934 (the “Exchange Act”) are available on our website, free of charge, as soon as reasonably practicable after we electronically file such materials with, or furnish them to, the U.S. Securities and Exchange Commission (“SEC”).
Current copies of our Code of Business Conduct and Ethics and Vendor Code of Business Conduct and Ethics are posted in the Investor Relations section of our website at www.hcpi.com. In addition, waivers from, and amendments to, our Code of Business Conduct and Ethics that apply to our directors and executive officers, including our principal executive officer, principal financial officer, principal accounting officer or persons performing similar functions, will be timely posted in the Investor Relations section of our website at www.hcpi.com.
Item 1A. Risk Factors
The section below discusses the most significant risk factors that may materially adversely affect our business, results of operations and financial condition.
As set forth below, we believe that the risks facing our company generally fall into the following categories:
| · | risks related to our business and operations; |
|---|
| · | risks related to our capital structure and market conditions; |
|---|
| · | risks related to other events; and |
|---|
| · | risks related to tax, including REIT-related risks. |
|---|
Risks Related to Our Business
We depend on a limited number of operators and tenants that account for a large percentage of our revenues.
During the year ended December 31, 2014, approximately 40% of our revenues were generated by our leasing or financial arrangements with the following two companies: HCRMC (26%) and Brookdale (14%). The inability or other failure of these tenants or operators to meet their obligations to us could materially reduce our cash flow as well as our results of operations, which could in turn reduce the amount of dividends we pay, cause our stock price to decline and have other materially adverse effects on our business, results of operations and financial condition.
In addition, any failure by these tenants or operators to effectively conduct their operations or to maintain and improve our properties could adversely affect their business reputation and their ability to attract and retain patients and residents in our properties, which could have a materially adverse effect on our business, results of operations and financial condition. These tenants and operators generally have also agreed to indemnify, defend and hold us harmless from and against various claims, litigation and liabilities arising in connection with their respective businesses, and we cannot provide any assurance that they will have sufficient assets, income, access to financing and/or insurance coverage to enable them to satisfy their indemnification obligations.
Our ownership interest in, and lease with, our largest tenant, HCRMC, accounts for a significant portion of our assets and revenues. Adverse regulatory or operational developments in HCRMC’s business or financial condition could have a material adverse effect on us.
HCRMC is a provider of a range of healthcare services, primarily in post-acute care, skilled nursing care and assisted living, and our largest tenant representing 31% and 26% of our gross assets and revenues, respectively, as of and for the year ended December 31, 2014. We also own a 9.4% equity interest in HCRMC, which we acquired together with our April 2011 $6 billion acquisition of substantially all the real estate assets of HCRMC. In December 2014, we recorded an impairment charge of $36 million for our equity ownership interest in HCRMC, primarily resulting from our review of their 2015 preliminary base financial forecast and other financial information provided by HCRMC that reflected a continued shift in patient payor sources from Medicare to Medicare Advantage, which negatively impacts reimbursement rates and length of stay for HCRMC’s skilled nursing segment.
Additionally, HCRMC has responded to a Civil Investigative Demand, subpoenas and other requests for information regarding their skilled nursing facilities in connection with an inquiry coordinated by the U.S. Department of Justice, the Department of Health and Human Services, Office of Inspector General, and certain state attorneys general offices. HCRMC believes it is in material compliance with all applicable laws and regulations. However, since the review is ongoing the ultimate outcome is uncertain and could, among other things, (1) require substantial time and costs to continue to respond to and defend HCRMC’s actions; (2) require HCRMC to refund or adjust amounts previously paid for services under governmental programs; (3) require payment of substantial fines, penalties or other sanctions; (4) result in the loss of HCRMC’s right to participate in the Medicare or Medicaid programs; or (5) cause damage to HCRMC’s reputation.
Continued deterioration in HCRMC’s operating performance or other adverse developments in its business, operating and regulatory affairs, or financial condition could reduce the revenues we earn under our master lease with HCRMC and/or impair the value of our master lease with HCRMC, either of which could have a material adverse effect on us.
See additional information regarding the aforementioned impairment charge, 9.4% equity interest in HCRMC and master lease with HCRMC in: (i) Item 7 “Results of Operations” (post-acute/skilled nursing segment 2014/2013 comparison); and (ii) Note 6 (DFLs), Note 8 (unconsolidated joint ventures) and Note 17 (impairments) to the Consolidated Financial Statements.
The properties managed by Brookdale account for a significant portion of our revenues and operating income. Adverse developments in Brookdale’s business and affairs or financial condition could have a materially adverse effect on us.
As of January 1, 2015, Brookdale managed 69 senior housing facilities that we own and 14 CCRCs owned by our unconsolidated joint venture pursuant to long-term management agreements. These properties represent a substantial portion of our portfolio, based on their gross book value, and account for a significant portion of our revenues and NOI. Although we have various rights as the property owner under our management agreements, we rely on Brookdale’s personnel, expertise, technical resources and information systems, proprietary information, good faith and judgment to manage our senior living operations efficiently and effectively. We also rely on Brookdale to set appropriate resident fees, to provide accurate property-level financial results for our properties in a timely manner and to otherwise operate our senior housing communities in compliance with the terms of our management agreements and all applicable laws and regulations.
In its capacity as a manager, Brookdale does not lease our properties, and, therefore, we are not directly exposed to their credit risk in the same manner or to the same extent as a triple-net tenant. However, any adverse developments in Brookdale’s business and affairs or financial condition could impair its ability to manage our properties efficiently and effectively and could have a materially adverse effect on us. Brookdale is also one of our triple-net tenants. If Brookdale experiences any significant financial, legal, accounting or regulatory difficulties due to a weak economy or otherwise, such difficulties could result in, among other adverse events, acceleration of its indebtedness, impairment of its continued access to capital, the enforcement of default remedies by its counterparties or the commencement of insolvency proceedings by or against it under the U.S. Bankruptcy Code, any one or a combination of which indirectly could have a materially adverse effect on us.
The bankruptcy, insolvency or financial deterioration of one or more of our major tenants or operators may materially adversely affect our business, results of operations and financial condition.
We lease our properties directly to operators in most cases, and in certain other cases, we lease to third party tenants who enter into long-term management agreements with operators to manage the properties. Although our leases, financing arrangements and other agreements with our tenants and operators generally provide us the right under specified circumstances to terminate a lease, evict a tenant or operator or demand immediate repayment of certain obligations to us, the bankruptcy and insolvency laws afford certain rights to a party that has filed for bankruptcy or reorganization that may render certain of these remedies unenforceable, or at the least, delay our ability to pursue such remedi
Showing the first 8K of 67K characters. Open the full section
Item 1B. Unresolved Staff Comments
None.
Item 2. Properties
We are organized to invest in income-producing healthcare-related facilities. In evaluating potential investments, we consider a multitude of factors, including:
| · | location, construction quality, age, condition and design of the property; |
|---|
| · | geographic area, proximity to other healthcare facilities, type of property and demographic profile; |
|---|
| · | whether the expected risk-adjusted return exceeds our cost of capital; |
|---|
| · | whether the rent or operating income provides a competitive market return to our investors; |
|---|
| · | duration, rental rates, tenant and operator quality and other attributes of in-place leases, including master lease structures; |
|---|
| · | current and anticipated cash flow and its adequacy to meet our operational needs; |
|---|
| · | availability of security such as letters of credit, security deposits and guarantees; |
|---|
| · | potential for capital appreciation; |
|---|
| · | expertise and reputation of the tenant or operator; |
|---|
| · | occupancy and demand for similar healthcare facilities in the same or nearby communities; |
|---|
| · | the mix of revenues generated at healthcare facilities between privately paid and government reimbursed; |
|---|
| · | availability of qualified operators or property managers and whether we can manage the property; |
|---|
| · | potential alternative uses of the facilities; |
|---|
| · | the regulatory and reimbursement environment in which the properties operate; |
|---|
| · | tax laws related to REITs; |
|---|
| · | prospects for liquidity through financing or refinancing; and |
|---|
| · | our access to and cost of capital. |
|---|
Property and Direct Financing Lease Investments
The following table summarizes our property and direct financing lease (“DFL”) investments in our Owned Portfolio as of and for the year ended December 31, 2014 (square feet and dollars in thousands):
| Number of | Gross Asset | Rental | Operating | |||||||||||
| Facility Location | Facilities | Capacity | Value(1) | Revenues(2) | Expenses | |||||||||
| Senior housing—real estate: | (Units) | |||||||||||||
| California | 28 | 4,228 | $ | 547,091 | $ | 103,419 | $ | 2,655 | ||||||
| Texas | 28 | 5,984 | 434,297 | 54,001 | 4 | |||||||||
| Florida | 26 | 4,083 | 396,797 | 45,615 | 6 | |||||||||
| Oregon | 27 | 2,427 | 318,517 | 29,585 | 262 | |||||||||
| Virginia | 9 | 1,404 | 249,829 | 22,254 | — | |||||||||
| Washington | 20 | 1,433 | 235,860 | 19,273 | — | |||||||||
| Colorado | 6 | 1,069 | 188,802 | 19,421 | — | |||||||||
| New Jersey | 7 | 802 | 140,991 | 12,201 | 58 | |||||||||
| South Carolina | 19 | 1,317 | 140,564 | 16,258 | 8 | |||||||||
| Georgia | 16 | 1,103 | 139,999 | 12,189 | 11 | |||||||||
| Other (31 States and U.K.) | 118 | 3,724 | 1,599,056 | 171,855 | 474 | |||||||||
| 304 | 27,574 | 4,391,803 | 506,071 | 3,478 | ||||||||||
| Senior housing—RIDEA: | ||||||||||||||
| Other (23 States) | 68 | 9,869 | 1,471,237 | 241,514 | 163,650 | |||||||||
| Senior housing—DFLs(3): | ||||||||||||||
| Maryland | 13 | 1,086 | 254,500 | 20,350 | — | |||||||||
| New Jersey | 8 | 678 | 190,660 | 14,011 | 112 | |||||||||
| Illinois | 10 | 942 | 178,557 | 13,834 | — | |||||||||
| Florida | 14 | 1,204 | 163,233 | 13,395 | 63 | |||||||||
| Pennsylvania | 10 | 725 | 149,073 | 12,652 | — | |||||||||
| Ohio | 11 | 945 | 143,150 | 10,758 | 21 | |||||||||
| Other (12 States) | 27 | 2,335 | 417,962 | 30,494 | 83 | |||||||||
| 93 | 7,915 | 1,497,135 | 115,494 | 279 | ||||||||||
| Total senior housing | 465 | 45,358 | $ | 7,360,175 | $ | 863,079 | $ | 167,407 | ||||||
| Post-acute/skilled nursing—real estate: | (Beds) | |||||||||||||
| Virginia | 9 | 932 | $ | 58,377 | $ | 7,502 | $ | — | ||||||
| Indiana | 8 | 920 | 55,572 | 9,083 | — | |||||||||
| Ohio | 6 | 577 | 30,863 | 4,948 | 10 | |||||||||
| Nevada | 2 | 298 | 17,474 | 3,290 | 1 | |||||||||
| Colorado | 2 | 216 | 13,800 | 1,792 | — | |||||||||
| Other (6 States) | 7 | 689 | 25,313 | 4,240 | 1,909 | |||||||||
| 34 | 3,632 | 201,399 | 30,855 | 1,920 |
| Number of | Gross Asset | Rental | Operating | |||||||||||
| Facility Location | Facilities | Capacity | Value(1) | Revenues(2) | Expenses | |||||||||
| Post-acute/skilled nursing—DFLs(3): | (Units) | |||||||||||||
| Pennsylvania | 43 | 6,919 | 1,262,692 | 119,850 | — | |||||||||
| Illinois | 26 | 3,177 | 731,899 | 67,072 | — | |||||||||
| Ohio | 44 | 5,005 | 667,976 | 62,467 | 111 | |||||||||
| Michigan | 27 | 3,183 | 603,331 | 54,475 | — | |||||||||
| Florida | 27 | 3,486 | 570,885 | 53,052 | 10 | |||||||||
| Other (24 States) | 100 | 12,907 | 1,822,525 | 167,551 | 46 | |||||||||
| 267 | 34,677 | 5,659,308 | 524,467 | 167 | ||||||||||
| Total post-acute/skilled nursing | 301 | 38,309 | $ | 5,860,707 | $ | 555,322 | $ | 2,087 | ||||||
| Life science: | (Sq. Ft.) | |||||||||||||
| California | 98 | 6,408 | $ | 3,195,318 | $ | 288,563 | $ | 58,296 | ||||||
| Utah | 10 | 669 | 114,480 | 15,926 | 2,149 | |||||||||
| Other (2 States) | 3 | 244 | 114,750 | 9,625 | 2,635 | |||||||||
| Total life science | 111 | 7,321 | $ | 3,424,548 | $ | 314,114 | $ | 63,080 | ||||||
| Medical office: | (Sq. Ft.) | |||||||||||||
| Texas | 49 | 4,382 | $ | 719,694 | $ | 103,330 | $ | 47,045 | ||||||
| California | 15 | 871 | 226,094 | 25,166 | 13,336 | |||||||||
| Colorado | 16 | 1,083 | 198,991 | 29,507 | 11,766 | |||||||||
| Utah | 27 | 1,288 | 195,098 | 26,559 | 7,520 | |||||||||
| Kentucky | 12 | 1,121 | 191,424 | 19,731 | 5,937 | |||||||||
| Washington | 6 | 651 | 164,819 | 30,162 | 10,961 | |||||||||
| Other (22 States and Mexico) | 90 | 5,826 | 1,002,839 | 136,501 | 51,634 | |||||||||
| Total medical office | 215 | 15,222 | $ | 2,698,959 | $ | 370,956 | $ | 148,199 | ||||||
| Hospital—real estate: | (Beds) | |||||||||||||
| Texas | 4 | 906 | $ | 231,516 | $ | 30,387 | $ | 3,706 | ||||||
| California | 2 | 111 | 143,500 | 19,346 | 11 | |||||||||
| Louisiana | 2 | 79 | 31,616 | 2,866 | 128 | |||||||||
| Other (5 States) | 5 | 369 | 57,125 | 10,817 | — | |||||||||
| 13 | 1,465 | $ | 463,757 | $ | 63,416 | $ | 3,845 | |||||||
| Hospital—DFLs(3): | ||||||||||||||
| Other (3 States) | 3 | 756 | 123,891 | 23,092 | (15) | |||||||||
| Total hospital | 16 | 2,221 | $ | 587,648 | $ | 86,508 | $ | 3,830 | ||||||
| Total properties | 1,108 | $ | 19,932,037 | $ | 2,189,979 | $ | 384,603 |
| (1) | Represents gross real estate and the carrying value of DFLs. Gross real estate represents the carrying amount of real estate after adding back accumulated depreciation and amortization. |
|---|
| (2) | Represent the combined amount of rental and related revenues, tenant recoveries, resident fees and services and income from direct financing leases. |
|---|
| (3) | Represents leased properties that are classified as DFLs. |
|---|
Occupancy and Annual Rent Trends
The following table summarizes occupancy and average annual rent trends for our owned portfolio for the years ended December 31, (square feet in thousands):
| 2014 | 2013 | 2012 | 2011 | 2010 | ||||||||||||
| Senior housing(1): | ||||||||||||||||
| Average annual rent per unit(2) | $ | 13,596 | $ | 13,174 | $ | 13,140 | $ | 14,431 | $ | 12,675 | ||||||
| Average capacity (available units) | 45,684 | 45,400 | 36,694 | 30,167 | 24,356 | |||||||||||
| Post-acute/skilled nursing(1): | ||||||||||||||||
| Average annual rent per bed(2) | $ | 12,646 | $ | 12,218 | $ | 11,802 | $ | 12,669 | $ | 7,118 | ||||||
| Average capacity (available beds) | 38,441 | 38,464 | 38,459 | 26,167 | 3,675 | |||||||||||
| Life science: | ||||||||||||||||
| Average occupancy percentage | 93 | % | 92 | % | 90 | % | 90 | % | 89 | % | ||||||
| Average annual rent per square foot(2) | $ | 46 | $ | 44 | $ | 45 | $ | 44 | $ | 44 | ||||||
| Average occupied square feet | 6,637 | 6,480 | 6,250 | 6,076 | 5,740 | |||||||||||
| Medical office: | ||||||||||||||||
| Average occupancy percentage | 91 | % | 91 | % | 91 | % | 91 | % | 91 | % | ||||||
| Average annual rent per square foot(2) | $ | 28 | $ | 27 | $ | 27 | $ | 27 | $ | 26 | ||||||
| Average occupied square feet | 13,178 | 12,767 | 12,147 | 11,721 | 11,437 | |||||||||||
| Hospital(1): | ||||||||||||||||
| Average annual rent per bed(2) | $ | 39,149 | $ | 38,437 | $ | 37,679 | $ | 36,974 | $ | 36,273 | ||||||
| Average capacity (available beds) | 2,221 | 2,175 | 2,087 | 2,084 | 2,064 |
| (1) | Senior housing includes average units of 6,408, 4,620, 4,626 and 1,545 for the years ended December 31, 2014, 2013, 2012 and 2011, respectively, that are in a RIDEA structure in which resident occupancy impacts our annual revenue, which structure was initially adopted in 2011 and expanded in August 2014. The average resident occupancy for these units was 87%, 88%, 86% and 86% for the years ended December 31, 2014, 2013, 2012 and 2011, respectively. All other senior housing, post-acute/skilled nursing and hospital facilities are triple-net leased to operator occupied facilities, which makes these facilities 100% leased from our perspective. |
|---|
| (2) | Average annual rent is presented as a ratio of revenues comprised of rental and related revenues, tenant recoveries and income from DFLs divided by the average capacity or average occupied square feet of the facilities and annualized for mergers and acquisitions for the year in which they occurred. Average annual rent for properties operated under a RIDEA structure is calculated based on NOI divided by the average capacity of the facilities. Average annual rent for leased properties (including DFLs) excludes termination fees and non-cash revenue adjustments (i.e., straight-line rents, amortization of market lease intangibles and DFL interest accretion). |
|---|
Development Properties
The following table sets forth the properties owned by us in our medical office and senior housing segments at December 31, 2014 that are currently under development or redevelopment (dollars and square feet in thousands):
| Estimated | Estimated | Estimated | |||||||||||
| Completion | Rentable | Investment | Total | ||||||||||
| Name of Project | Location | Date(1) | Sq. Ft./Units | to Date | Investment | ||||||||
| Life science: | |||||||||||||
| Pacific Corporate Park | San Diego, CA | 2Q 2016 | 57 | $ | 12,707 | $ | 19,868 | ||||||
| Medical office: | |||||||||||||
| Memorial Hermann | Pearland, TX | 1Q 2016 | 98 | 5,491 | 18,800 | ||||||||
| Sky Ridge | Lone Tree, CO | 1Q 2016 | 118 | 5,453 | 29,400 | ||||||||
| Bayfront(2) | St. Petersburg, FL | 4Q 2015 | 120 | 13,572 | 19,236 | ||||||||
| Folsom | Sacramento, CA | 4Q 2015 | 92 | 38,553 | 59,350 | ||||||||
| Senior housing: | |||||||||||||
| Deer Park | Deer Park, IL | 4Q 2015 | 180 | 17,249 | 47,690 | ||||||||
| $ | 93,025 | $ | 194,344 |
| (1) | For development projects, management’s estimate of the date the core and shell structure improvements are expected to be completed. For redevelopment projects, management’s estimate of the time in which major construction activity in relation to the scope of the project is expected 29 |
|---|
| to be substantially completed. There are no assurances that any of these projects will be completed on schedule or within estimated amounts. |
|---|
| (2) | Represents a portion of the facility. |
|---|
At December 31, 2014, we also had $390 million of land held for future development primarily in our life science segment. In February 2015, we began construction on the first phase of The Cove at Oyster Point, a life science development in South San Francisco with an investment of $26 million that was reported in land held for development at December 31, 2014.
Tenant Lease Expirations
The following table shows tenant lease expirations, including those related to DFLs, for the next 10 years and thereafter at our leased properties, assuming that none of the tenants exercise any of their renewal options (dollars and square feet in thousands). See “Tenant Purchase Options” section of Note 12 to the Consolidated Financial Statements for additional information on leases subject to purchase options.
| Expiration Year | ||||||||||||||||||||||||||||||||||||
| Segment | Total | 2015(1) | 2016 | 2017 | 2018 | 2019 | 2020 | 2021 | 2022 | 2023 | 2024 | Thereafter | ||||||||||||||||||||||||
| Senior housing(2): | ||||||||||||||||||||||||||||||||||||
| Properties | 397 | 1 | 14 | 8 | 25 | 5 | 24 | 9 | 2 | 8 | 26 | 275 | ||||||||||||||||||||||||
| Base rent(3) | $ | 495,555 | $ | 220 | $ | 17,139 | $ | 10,759 | $ | 48,887 | $ | 8,893 | $ | 39,965 | $ | 12,147 | $ | 2,129 | $ | 23,553 | $ | 30,111 | $ | 301,752 | ||||||||||||
| % of segment base rent | 100 | — | 3 | 2 | 10 | 2 | 8 | 2 | — | 5 | 6 | 62 | ||||||||||||||||||||||||
| Post-acute/skilled nursing: | ||||||||||||||||||||||||||||||||||||
| Properties | 301 | — | 1 | — | 2 | 21 | 6 | — | 4 | — | — | 267 | ||||||||||||||||||||||||
| Base rent(3) | $ | 489,547 | $ | — | $ | 340 | $ | — | $ | 1,168 | $ | 18,633 | $ | 6,934 | $ | — | $ | 3,274 | $ | — | $ | — | $ | 459,198 | ||||||||||||
| % of segment base rent | 100 | — | — | — | — | 4 | 1 | — | 1 | — | — | 94 | ||||||||||||||||||||||||
| Life science: | ||||||||||||||||||||||||||||||||||||
| Square feet | 6,971 | 280 | 375 | 911 | 835 | 509 | 1,056 | 643 | 455 | 769 | 471 | 667 | ||||||||||||||||||||||||
| Base rent(3) | $ | 261,376 | $ | 9,076 | $ | 10,165 | $ | 31,876 | $ | 35,758 | $ | 15,519 | $ | 48,264 | $ | 34,638 | $ | 15,919 | $ | 34,173 | $ | 7,553 | $ | 18,435 | ||||||||||||
| % of segment base rent | 100 | 4 | 4 | 12 | 14 | 6 | 18 | 13 | 6 | 13 | 3 | 7 | ||||||||||||||||||||||||
| Medical office: | ||||||||||||||||||||||||||||||||||||
| Square feet | 13,814 | 2,242 | 1,681 | 2,190 | 1,831 | 1,621 | 1,304 | 707 | 628 | 413 | 417 | 780 | ||||||||||||||||||||||||
| Base rent(3) | $ | 316,302 | $ | 52,546 | $ | 37,273 | $ | 51,006 | $ | 40,421 | $ | 37,281 | $ | 28,892 | $ | 16,658 | $ | 14,507 | $ | 7,374 | $ | 10,952 | $ | 19,392 | ||||||||||||
| % of segment base rent | 100 | 17 | 12 | 16 | 13 | 12 | 9 | 5 | 5 | 2 | 3 | 6 | ||||||||||||||||||||||||
| Hospital: | ||||||||||||||||||||||||||||||||||||
| Properties | 16 | — | — | 3 | — | 5 | 1 | 1 | 2 | — | 1 | 3 | ||||||||||||||||||||||||
| Base rent(3) | $ | 74,903 | $ | — | $ | — | $ | 12,667 | $ | — | $ | 7,332 | $ | 7,700 | $ | 1,282 | $ | 11,523 | $ | — | $ | 13,304 | $ | 21,095 | ||||||||||||
| % of segment base rent | 100 | — | — | 17 | — | 10 | 10 | 2 | 15 | — | 18 | 28 | ||||||||||||||||||||||||
| Total: | ||||||||||||||||||||||||||||||||||||
| Base rent(3) | $ | 1,637,683 | $ | 61,842 | $ | 64,917 | $ | 106,308 | $ | 126,234 | $ | 87,658 | $ | 131,755 | $ | 64,725 | $ | 47,352 | $ | 65,100 | $ | 61,920 | $ | 819,872 | ||||||||||||
| % of total base rent | 100 | 4 | 4 | 6 | 8 | 5 | 8 | 4 | 3 | 4 | 4 | 50 |
| (1) | Includes month-to-month leases. |
|---|
| (2) | Excludes 68 RIDEA facilities, leased to consolidated subsidiaries, with annualized NOI of $117 million. |
|---|
| (3) | The most recent month’s (or subsequent month’s if acquired in the most recent month) base rent including additional rent floors and cash income from DFLs annualized for 12 months. Base rent does not include tenant recoveries, additional rents in excess of floors and non-cash revenue adjustments (i.e., straight-line rents, amortization of market lease intangibles, DFL interest accretion and deferred revenues). |
|---|
We specifically incorporate by reference into this section the information set forth in Schedule III: Real Estate and Accumulated Depreciation, included in this report.
Item 3. Legal Proceedings
We are involved from time-to-time in legal proceedings that arise in the ordinary course of our business, including, but not limited to, commercial disputes, environmental matters, and litigation in connection with transactions including acquisitions and divestitures. We believe that such existing legal proceedings will not have a material adverse impact on our financial position or our results of operations. We record a liability when a loss is considered probable and the amount can be reasonably estimated.
See “Legal Proceedings” section of Note 12 to the Consolidated Financial Statements for information regarding legal proceedings, which information is incorporated by reference in this Item 3.
Item 4. Mine Safety Disclosures
None.
PART II
Item 5. Market for Registrant’s Common Equity, Related Stockholder Matters and Issuer Purchases of Equity Securities
Our common stock is listed on the New York Stock Exchange. It has been our policy to declare quarterly dividends to common stockholders so as to comply with applicable provisions of the Code governing REITs. For the fiscal quarters indicated below are the reported high and low sales prices per share of our common stock on the New York Stock Exchange and the cash dividends paid per common share:
| High | Low | Per Share Distribution | ||||||||
| 2014 | ||||||||||
| Fourth Quarter | $ | 46.07 | $ | 39.66 | $ | 0.545 | ||||
| Third Quarter | 43.86 | 39.34 | 0.545 | |||||||
| Second Quarter | 42.82 | 38.49 | 0.545 | |||||||
| First Quarter | 39.59 | 35.95 | 0.545 | |||||||
| 2013 | ||||||||||
| Fourth Quarter | 43.29 | 35.50 | 0.525 | |||||||
| Third Quarter | 47.45 | 38.93 | 0.525 | |||||||
| Second Quarter | 56.06 | 41.50 | 0.525 | |||||||
| First Quarter | 49.91 | 45.22 | 0.525 |
At January 30, 2015, we had approximately 10,259 stockholders of record, and there were approximately 312,913 beneficial holders of our common stock.
Dividends (Distributions)
Distributions with respect to our common stock can be characterized for federal income tax purposes as taxable ordinary dividends, capital gain dividends, nondividend distributions or a combination thereof. Following is the characterization of our annual common stock distributions per share:
| Year Ended December 31, | ||||||||||
| 2014 | 2013 | 2012 | ||||||||
| Ordinary dividends | $ | 1.9992 | $ | 1.8127 | $ | 1.4618 | ||||
| Capital gain dividends | 0.0890 | 0.1516 | 0.0495 | |||||||
| Nondividend distributions | 0.0918 | 0.1357 | 0.4887 | |||||||
| $ | 2.1800 | $ | 2.1000 | $ | 2.0000 |
On January 29, 2015, we announced that our Board of Directors declared a quarterly common stock cash dividend of $0.565 per share. The common stock dividend will be paid on February 24, 2015 to stockholders of record as of the close of business on February 9, 2015.
Distributions with respect to our preferred stock can be characterized for federal income tax purposes as taxable ordinary dividends, capital gain dividends, nondividend distributions or a combination thereof. We redeemed all of our outstanding preferred stock on April 23, 2012. Following is the characterization of our annual preferred stock distributions per share:
| Series E | Series F | ||||||
| December 31, 2012 | December 31, 2012 | ||||||
| Ordinary dividends | $ | 0.4383 | $ | 0.4292 | |||
| Capital gain dividends | 0.0148 | 0.0145 | |||||
| $ | 0.4531 | $ | 0.4437 |
Issuer Purchases of Equity Securities
The table below sets forth the information with respect to purchases of our common stock made by or on our behalf during the quarter ended December 31, 2014.
| Total Number of Shares | Maximum Number (or | |||||||||
| Purchased as | Approximate Dollar Value) | |||||||||
| Total Number | Part of Publicly | of Shares that May Yet | ||||||||
| of Shares | Average Price | Announced Plans | be Purchased Under | |||||||
| Period Covered | Purchased(1) | Paid per Share | or Programs | the Plans or Programs | ||||||
| October 1-31, 2014 | 19,343 | $ | 41.10 | — | — | |||||
| November 1-30, 2014 | 106 | 43.97 | — | — | ||||||
| December 1-31, 2014 | 6,759 | 45.06 | — | — | ||||||
| Total | 26,208 | 42.14 | — | — |
| (1) | Represents restricted shares withheld under our equity incentive plans to offset tax withholding obligations that occur upon vesting of restricted shares. The value of the shares withheld is based on the closing price of our common stock on the last trading day prior to the date the relevant transaction occurred. |
|---|
Performance Graph
The graph below compares the cumulative total return of HCP, the S&P 500 Index and the Equity REIT Index of the National Association of Real Estate Investment Trusts, Inc. (“NAREIT”), from January 1, 2010 to December 31, 2014. Total cumulative return is based on a $100 investment in HCP common stock and in each of the indices on January 1, 2010 and assumes quarterly reinvestment of dividends before consideration of income taxes. Stockholder returns over the indicated periods should not be considered indicative of future stock prices or stockholder returns.
COMPARISON OF FIVE-YEAR CUMULATIVE TOTAL RETURN
AMONG S&P 500, EQUITY REITS AND HCP, INC.
RATE OF RETURN TREND COMPARISON
JANUARY 1, 2010–DECEMBER 31, 2014
(JANUARY 1, 2010 = 100)
Performance Graph Total Stockholder Return
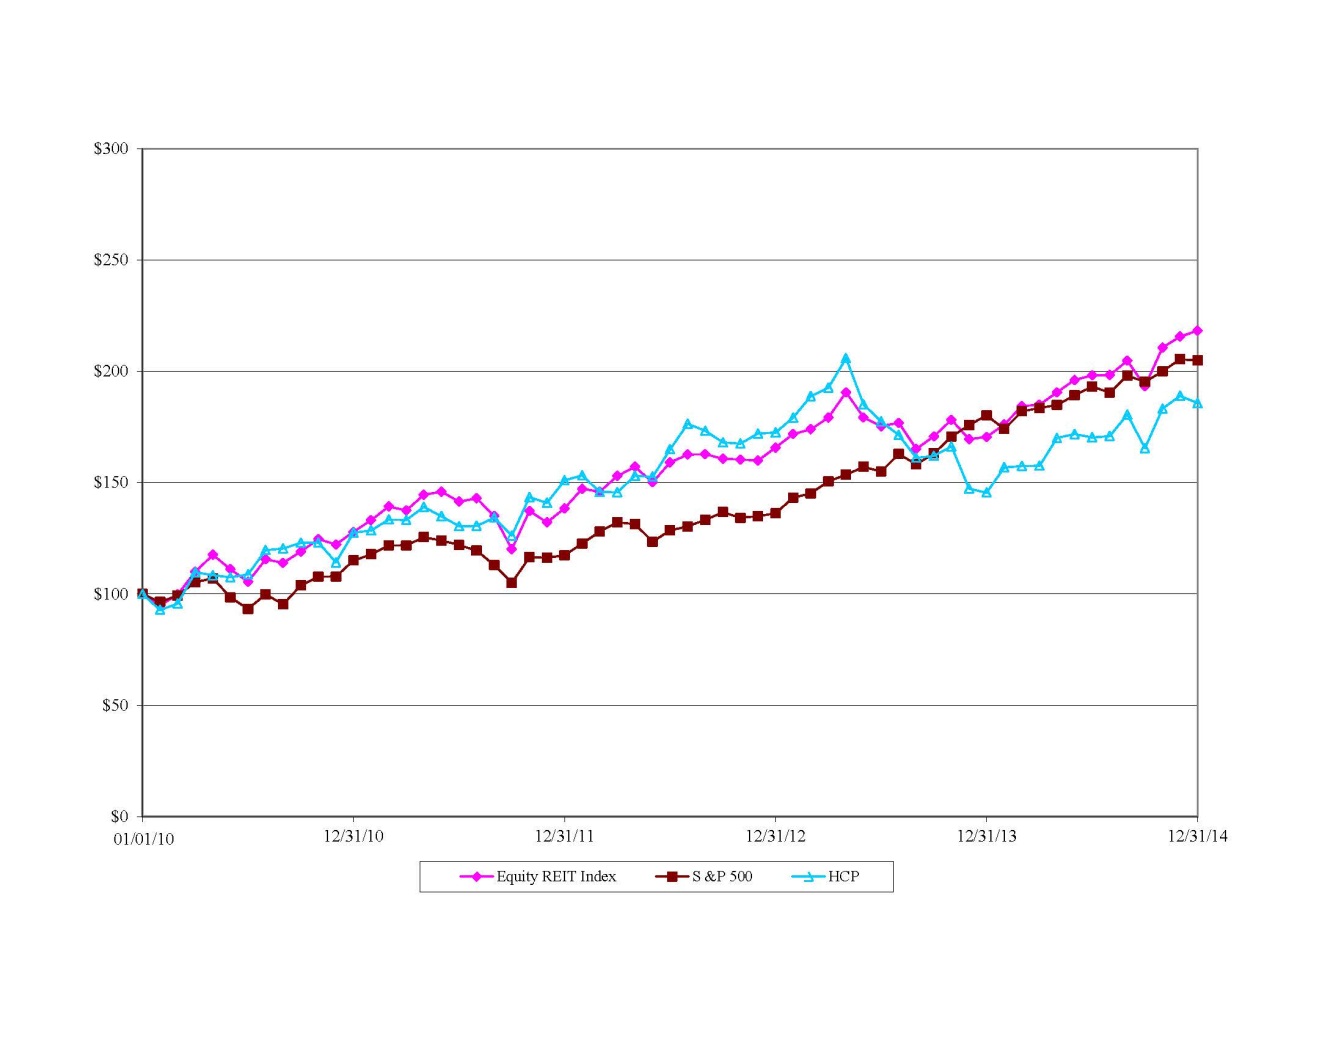
| December 31, | ||||||||||||||||
| 2010 | 2011 | 2012 | 2013 | 2014 | ||||||||||||
| FTSE NAREIT Equity REIT Index | $ | 127.95 | $ | 138.55 | $ | 165.84 | $ | 170.58 | $ | 218.38 | ||||||
| S&P 500 | 115.08 | 117.47 | 136.24 | 180.33 | 204.96 | |||||||||||
| HCP, Inc. | 127.60 | 151.10 | 172.56 | 145.56 | 185.79 |
Item 6. Selected Financial Data
Set forth below is our selected financial data as of and for each of the years in the five-year period ended December 31, 2014 (dollars in thousands, except per share data):
| Year Ended December 31,(1) | ||||||||||||||||
| 2014 | 2013 | 2012 | 2011(2) | 2010 | ||||||||||||
| Income statement data: | ||||||||||||||||
| Total revenues | $ | 2,266,279 | $ | 2,099,878 | $ | 1,879,970 | $ | 1,694,418 | $ | 1,224,717 | ||||||
| Income from continuing operations | 906,845 | 910,633 | 801,190 | 536,130 | 303,869 | |||||||||||
| Net income applicable to common shares | 919,796 | 969,103 | 812,289 | 515,302 | 307,498 | |||||||||||
| Income from continuing operations applicable to common shares: | ||||||||||||||||
| Basic earnings per common share | 1.94 | 1.97 | 1.80 | 1.25 | 0.87 | |||||||||||
| Diluted earnings per common share | 1.94 | 1.97 | 1.80 | 1.25 | 0.87 | |||||||||||
| Net income applicable to common shares: | ||||||||||||||||
| Basic earnings per common share | 2.01 | 2.13 | 1.90 | 1.29 | 1.01 | |||||||||||
| Diluted earnings per common share | 2.00 | 2.13 | 1.90 | 1.29 | 1.00 | |||||||||||
| Balance sheet data: | ||||||||||||||||
| Total assets | 21,369,940 | 20,075,870 | 19,915,555 | 17,408,475 | 13,331,923 | |||||||||||
| Debt obligations(3) | 9,759,773 | 8,661,627 | 8,695,549 | 7,731,137 | 4,656,241 | |||||||||||
| Total equity | 10,997,099 | 10,931,134 | 10,753,777 | 9,220,622 | 8,146,047 | |||||||||||
| Other data: | ||||||||||||||||
| Dividends paid | 1,001,559 | 956,685 | 865,306 | 787,689 | 590,735 | |||||||||||
| Dividends paid per common share | 2.18 | 2.10 | 2.00 | 1.92 | 1.86 | |||||||||||
| Funds from operations (“FFO”)(4) | 1,381,634 | 1,349,264 | 1,166,508 | 877,907 | 690,637 | |||||||||||
| Diluted FFO per common share(4) | 3.00 | 2.95 | 2.72 | 2.19 | 2.25 | |||||||||||
| FFO as adjusted(4) | 1,398,691 | 1,382,699 | 1,195,799 | 1,052,692 | 689,740 | |||||||||||
| Diluted FFO as adjusted per common share(4) | 3.04 | 3.02 | 2.79 | 2.71 | 2.25 | |||||||||||
| Funds available for distribution (“FAD”)(4) | 1,178,822 | 1,158,082 | 954,645 | 838,440 | 585,116 | |||||||||||
| Diluted FAD per common share(4) | 2.57 | 2.54 | 2.23 | 2.16 | 1.92 |
| (1) | The following are acquisitions that had a meaningful impact on our financial position and results of operations in the years in which they closed and thereafter: |
|---|
| · | During the third quarter of 2014, we completed the Brookdale Transaction in which, among other things, we contributed 48 properties that were triple-net leased into a RIDEA structure, with Brookdale managing the communities (see Note 3 to the Consolidated Financial Statements regarding the Brookdale Transaction). An additional property was contributed on January 1, 2015. |
|---|
| · | During the fourth quarter of 2012, we acquired 129 senior housing communities from a joint venture between Emeritus and Blackstone Real Estate Partners VI, an affiliate of the Blackstone Group (the “Blackstone JV”). |
|---|
| · | On April 7, 2011, we completed our acquisition of substantially all of the real estate assets of HCRMC, which included the settlement of our HCRMC debt investments. |
|---|
| · | On January 14, 2011, we acquired our partner’s 65% interest in HCP Ventures II, a joint venture that owned 25 senior housing facilities, becoming the sole owner of the portfolio. |
|---|
| (2) | On November 9, 2011, we entered into an agreement with Ventas, Inc. (“Ventas”) to settle all remaining claims relating to Ventas’s litigation against HCP arising out of Ventas’s 2007 acquisition of Sunrise Senior Living REIT. We paid $125 million to Ventas, which was recorded as litigation settlement expense for the year ended December 31, 2011. |
|---|
| (3) | Includes bank line of credit, bridge and term loans, senior unsecured notes, mortgage and other secured debt, and other debt. |
|---|
| (4) | For a more detailed discussion and reconciliation of Funds From Operations (“FFO”), FFO as adjusted and Funds Available for Distribution (“FAD”), see “Non-GAAP Financial Measures—FFO and FAD” in Item 7. |
|---|
Item 7. Management’s Discussion and Analysis of Financial Condition and Results of Operations
The information set forth in this Item 7 is intended to provide readers with an understanding of our financial condition, changes in financial condition and results of operations. We will discuss and provide our analysis in the following order:
| · | 2014 Transaction Overview |
|---|
| · | Dividends |
|---|
| · | Results of Operations |
|---|
| · | Liquidity and Capital Resources |
|---|
| · | Non-GAAP Financial Measures—FFO and FAD |
|---|
| · | Off-Balance Sheet Arrangements |
|---|
| · | Contractual Obligations |
|---|
| · | Inflation |
|---|
| · | Critical Accounting Policies |
|---|
| · | Recent Accounting Pronouncements |
|---|
2014 Transaction Overview
Investment Transactions
In 2014 we completed $2.1 billion of investment transactions, including $777 million (£483 million) in debt and real estate in the United Kingdom (“U.K.”) and $588 million for our 49% interest in the industry’s largest CCRC joint venture, which transactions are further described below:
Brookdale Lease Amendments and Terminations and the Formation of Two RIDEA Joint Ventures (“Brookdale Transaction”)
On August 29, 2014, HCP and Brookdale, through a Master Contribution and Transactions Agreement, closed a multiple-element transaction that has three major components:
| · | formed new unconsolidated joint ventures that collectively own 14 campuses of continuing care retirement communities (the “CCRC JV”). At closing, Brookdale contributed eight of its owned campuses; we contributed two campuses previously leased to Brookdale and cash used to acquire four additional campuses from third parties. HCP and Brookdale own 49% and 51%, respectively, of the CCRC JV, and Brookdale manages these communities; |
|---|
| · | amended existing lease agreements on 153 HCP-owned senior housing communities, including the termination of embedded tenant purchase options relating to 30 properties and future rent reductions; and |
|---|
| · | terminated existing lease agreements on 49 HCP-owned senior housing properties, including the termination of embedded tenant purchase options relating to 19 properties. At closing, we contributed 48 of these properties to a newly formed RIDEA partnerships (the “RIDEA Subsidiaries”); the 49th property was contributed on January 1, 2015. Brookdale owns a 20% noncontrolling equity interest in the RIDEA Subsidiaries and manages the facilities on behalf of the partnership. |
|---|
£395 Million Debt Investment in U.K. Care Home Portfolio
In November 2014, we were the lead investor in the financing for Formation Capital and Safanad’s acquisition of NHP, a company that, at closing, owned 273 nursing and residential care homes representing over 12,500 beds in the U.K. principally operated by HC-One. We provided a loan facility totaling $630 million (£395 million), secured by substantially all of NHP’s assets, with £363 million drawn at closing.
Other Investment Transactions
During the year ended December 31, 2014, we completed $634 million of additional investments and commitments in 34 properties across our senior housing, life science and medical office segments, including $147 million (£88 million) for 23 care homes in the U.K. Additionally, we funded $287 million for construction and other capital projects, primarily in our life science, medical office and senior housing segments.
Financing Activities
We raised $2.1 billion of debt in 2014 and through January 2015, including the following transactions:
| · | On January 21, 2015, we issued $600 million of 3.4% senior unsecured notes due 2025. The notes were priced at 99.185% of the principal amount with a yield-to-maturity of 3.497%. |
|---|
| · | On January 12, 2015, we completed a $333 million (£220 million) four-year unsecured term loan that accrues interest at a rate of GBP LIBOR plus 0.975%, subject to adjustments based on our credit ratings. Concurrently, we entered into a three-year interest rate swap agreement that effectively fixes the rate of the term loan at 1.79%. |
|---|
| · | On August 14, 2014, we issued $800 million of 3.875% senior unsecured notes due 2024. The notes were priced at 99.63% of the principal amount with an effective yield-to-maturity of 3.92%. |
|---|
| · | On February 12, 2014, we issued $350 million of 4.2% senior unsecured notes due 2024. The notes were priced at 99.537% of the principal amount with an effective yield-to-maturity of 4.257%. |
|---|
On March 31, 2014, we amended our unsecured revolving credit facility and increased it by $500 million to $2 billion. The amended facility reduces our funded interest cost by 17.5 basis points and extends the maturity date to March 31, 2018. Based on our current credit ratings, the amended facility bears interest annually at LIBOR plus 92.5 basis points and has a facility fee of 15.0 basis points. Other terms of the amended facility were substantially unchanged, including a one-year extension option at our discretion, and the ability to increase the commitments by an aggregate amount of up to $500 million, subject to customary conditions.
During the year ended December 31, 2014, we repaid $911 million of aggregate senior unsecured notes and mortgage debt with a weighted average interest rate of 4.33%.
Dividends
Quarterly dividends paid during 2014 aggregated $2.18 per share, which represents a 3.8% increase from 2013. On January 29, 2015, our Board of Directors declared a quarterly cash dividend of $0.565 per common share. The annualized distribution rate per share for 2015 increased 3.7% to $2.26, compared to $2.18 for 2014. The dividend will be paid on February 24, 2015 to stockholders of record as of the close of business on February 9, 2015.
Results of Operations
We evaluate our business and allocate resources among our five business segments: (i) senior housing, (ii) post-acute/skilled nursing, (iii) life science, (iv) medical office and (v) hospital. Under the medical office segment, we invest through the acquisition and development of MOBs, which generally require a greater level of property management. Otherwise, we primarily invest, through the acquisition and development of real estate, in single tenants and operators occupied properties and debt issued by tenants and operators in these sectors. The accounting policies of the segments are the same as those described in the summary of significant accounting policies (see Note 2 to the Consolidated Financial Statements).
Non-GAAP Financial Measures
Same Property Portfolio
Our evaluation of results of operations by each business segment includes an analysis of NOI and adjusted NOI of our Same Property Portfolio (“SPP”) and our total property portfolio. We believe NOI provides relevant and useful information because it reflects only income and operating expense items that are incurred at the property level and presents them on an
unleveraged basis. We use NOI and adjusted NOI to make decisions about resource allocations and to assess and compare property level performance. SPP NOI and adjusted NOI information allows us to evaluate the performance of our property portfolio under a consistent population by eliminating changes in the composition of our portfolio of properties. We identify our SPP as stabilized properties that remained in operations and were consistently reported as leased properties or RIDEA properties for the duration of the year‑over‑year comparison periods presented. Accordingly, it takes a stabilized property a minimum of 12 months in operations under a consistent reporting structure to be in
Showing the first 8K of 115K characters. Open the full section
Item 7A. Quantitative and Qualitative Disclosures About Market Risk
We use derivative financial instruments in the normal course of business to mitigate interest rate and foreign currency risk. We do not use derivative financial instruments for speculative or trading purposes. Derivatives are recorded on the consolidated balance sheets at their fair value (see Note 24 to the Consolidated Financial Statements).
To illustrate the effect of movements in the interest rate and foreign currency markets, we performed a market sensitivity analysis on our hedging instruments. We applied various basis point spreads to the underlying interest rate curves and foreign currency exchange rates of the derivative portfolio in order to determine the instruments’ change in fair value. Assuming a one percentage point change in the underlying interest rate curve and foreign currency exchange rates, the estimated change in fair value of each of the underlying derivative instruments would not exceed $4 million. See Note 24 to the Consolidated Financial Statements for additional analysis details.
Interest Rate Risk
At December 31, 2014, we are exposed to market risks related to fluctuations in interest rates primarily on variable rate investments, which have been predominately hedged through interest rate swap contracts.
Interest rate fluctuations will generally not affect our future earnings or cash flows on our fixed rate debt and assets unless such instruments mature or are otherwise terminated. However, interest rate changes will affect the fair value of our fixed rate instruments. Conversely, changes in interest rates on variable rate debt and investments would change our future earnings and cash flows, but not significantly affect the fair value of those instruments. Assuming a one percentage point increase in the interest rate related to the variable-rate investments and variable-rate debt, and assuming no other changes in the outstanding balance as of December 31, 2014, our annual interest expense would increase by approximately $9 million, or $0.02 per common share on a diluted basis.
Foreign Currency Exchange Rate Risk
At December 31, 2014, our exposure to foreign currencies primarily relates to U.K. investments in leased real estate, loan investments, senior unsecured notes and the related GBP denominated cash flows from such investments. Our foreign currency exposure is partially mitigated through the use of GBP denominated borrowings and foreign currency swap contracts.
Market Risk
We have investments in marketable debt securities classified as held-to-maturity because we have the positive intent and ability to hold the securities to maturity. Held-to-maturity securities are recorded at amortized cost and adjusted for the amortization of premiums and discounts through maturity. We consider a variety of factors in evaluating an other-than-temporary decline in value, such as: the length of time and the extent to which the market value has been less than our
current adjusted carrying value; the issuer’s financial condition, capital strength and near-term prospects; any recent events specific to that issuer and economic conditions of its industry; and our investment horizon in relationship to an anticipated near-term recovery in the market value, if any. At December 31, 2014, the fair value and carrying value of marketable debt securities were $252 million and $231 million, respectively.
The principal amount and the average interest rates for our loans receivable and debt categorized by maturity dates is presented in the table below. The fair value for our senior unsecured notes payable is based on prevailing market prices. The fair value estimates for loans receivable and mortgage debt payable are based on discounting future cash flows utilizing current rates for loans and debt of the same type and remaining maturity.
The table below summarizes the carrying amounts and fair values of our financial instruments exposed to interest rate risk (dollars in thousands):
| Maturity | ||||||||||||||||||||||||
| 2015 | 2016 | 2017 | 2018 | 2019 | Thereafter | Total | Fair Value | |||||||||||||||||
| Assets: | ||||||||||||||||||||||||
| Loans receivable (USD) | $ | 17,470 | (1) | $ | 79,251 | $ | 237,796 | $ | 18,715 | $ | 553,729 | $ | — | $ | 906,961 | $ | 898,522 | |||||||
| Weighted average interest rate | 14.00 | % | 8.50 | % | 12.29 | % | 8.00 | % | 7.50 | % | — | % | 8.98 | % | ||||||||||
| Debt securities held to maturity (USD) | $ | — | $ | — | $ | — | $ | — | $ | — | $ | 17,370 | $ | 17,370 | $ | 17,370 | ||||||||
| Weighted average interest rate | — | % | — | % | — | % | — | % | — | % | 4.43 | % | 4.43 | % | ||||||||||
| Debt securities held to maturity (GBP)(3) | $ | — | $ | — | $ | — | $ | — | $ | — | $ | 214,072 | $ | 214,072 | $ | 234,755 | ||||||||
| Weighted average interest rate | — | % | — | % | — | % | — | % | — | % | 12.25 | % | 12.25 | % | ||||||||||
| Liabilities(2): | ||||||||||||||||||||||||
| Variable rate debt: | ||||||||||||||||||||||||
| Line of credit (USD)(4) | $ | — | $ | — | $ | — | $ | 285,000 | $ | — | $ | — | $ | 285,000 | $ | 285,000 | ||||||||
| Weighted average interest rate | — | % | — | % | — | % | 1.37 | % | — | % | — | % | 1.37 | % | ||||||||||
| Line of credit (GBP)(5) | $ | — | $ | — | $ | — | $ | 553,516 | $ | — | $ | — | $ | 553,516 | $ | 553,516 | ||||||||
| Weighted average interest rate | — | % | — | % | — | % | 1.71 | % | — | % | — | % | 1.71 | % | ||||||||||
| Term loan (GBP)(3) | $ | — | $ | 213,610 | $ | — | $ | — | $ | — | $ | — | $ | 213,610 | $ | 213,610 | ||||||||
| Weighted average interest rate | — | % | 1.70 | % | — | % | — | % | — | % | — | % | 1.70 | % | ||||||||||
| Mortgage debt payable (USD) | $ | 8,500 | $ | 25,789 | $ | — | $ | — | $ | — | $ | 45,610 | $ | 79,899 | $ | 72,210 | ||||||||
| Weighted average interest rate | 0.38 | % | 1.67 | % | — | % | — | % | — | % | 0.06 | % | 0.61 | % | ||||||||||
| Fixed rate debt: | ||||||||||||||||||||||||
| Senior unsecured notes payable (USD) | $ | 400,000 | $ | 900,000 | $ | 750,000 | $ | 600,000 | $ | 450,000 | $ | 4,550,000 | $ | 7,650,000 | $ | 8,187,458 | ||||||||
| Weighted average interest rate | 6.57 | % | 5.10 | % | 6.02 | % | 6.82 | % | 3.96 | % | 4.45 | % | 4.95 | % | ||||||||||
| Mortgage debt payable (USD) | $ | 12,489 | $ | 256,102 | $ | 606,492 | $ | 4,971 | $ | — | $ | 26,613 | $ | 906,667 | $ | 935,594 | ||||||||
| Weighted average interest rate | 5.79 | % | 6.54 | % | 5.69 | % | 5.90 | % | — | % | 5.87 | % | 5.94 | % | ||||||||||
| Interest rate derivatives assets | ||||||||||||||||||||||||
| (liabilities): | ||||||||||||||||||||||||
| Variable rate mortgage debt: | ||||||||||||||||||||||||
| Variable to fixed (USD) | $ | — | $ | (1,724) | $ | — | $ | — | $ | — | $ | (5,939) | $ | (7,663) | $ | (7,663) | ||||||||
| Weighted average pay rate | — | % | 5.95 | % | — | % | — | % | — | % | 3.82 | % | 4.30 | % | ||||||||||
| Weighted average receive rate | — | % | 2.49 | % | — | % | — | % | — | % | 1.86 | % | 2.00 | % | ||||||||||
| Variable rate 2012 Term Loan: | ||||||||||||||||||||||||
| Variable to fixed (GBP) | $ | — | $ | 178 | $ | — | $ | — | $ | — | $ | — | $ | 178 | $ | 178 | ||||||||
| Weighted average pay rate | — | % | 1.81 | % | — | % | — | % | — | % | — | % | 1.81 | % | ||||||||||
| Weighted average receive rate | — | % | 1.89 | % | — | % | — | % | — | % | — | % | 1.89 | % |
| (1) | Effective January 1, 2011, a senior secured loan to Delphis was placed on non-accrual status. For additional information regarding the senior secured loan to Delphis, see Note 7 to the Consolidated Financial Statements. |
|---|
| (2) | Excludes $97 million of other debt that represents life care bonds and demand notes that have no scheduled maturities. |
|---|
| (3) | Represents approximately £137 million translated into U.S. dollars. |
|---|
| (4) | In January 2015, we repaid the outstanding amount under the line of credit (USD) in full with cash on hand and a portion of the proceeds from the 2015 senior unsecured notes issuance. |
|---|
| (5) | Represents approximately £355 million translated into U.S. dollars. In January 2015, we repaid all but £135 million outstanding under the line of credit (GBP) with proceeds from the 2015 Term Loan. |
|---|
Item 8. Financial Statements and Supplementary Data
HCP, Inc.
Index to Consolidated Financial Statements
REPORT OF INDEPENDENT REGISTERED PUBLIC ACCOUNTING FIRM
The Board of Directors and Stockholders of HCP, Inc.
Irvine, California
We have audited the accompanying consolidated balance sheets of HCP, Inc. and subsidiaries (the “Company”) as of December 31, 2014 and 2013, and the related consolidated statements of income, comprehensive income, equity, and cash flows for each of the three years in the period ended December 31, 2014. Our audits also included the financial statement schedules listed in the Index at Item 15. These financial statements and financial statement schedules are the responsibility of the Company’s management. Our responsibility is to express an opinion on these financial statements and financial statement schedules based on our audits.
We conducted our audits in accordance with the standards of the Public Company Accounting Oversight Board (United States). Those standards require that we plan and perform the audit to obtain reasonable assurance about whether the financial statements are free of material misstatement. An audit includes examining, on a test basis, evidence supporting the amounts and disclosures in the financial statements. An audit also includes assessing the accounting principles used and significant estimates made by management, as well as evaluating the overall financial statement presentation. We believe that our audits provide a reasonable basis for our opinion.
In our opinion, such consolidated financial statements present fairly, in all material respects, the financial position of HCP, Inc. and subsidiaries as of December 31, 2014 and 2013, and the results of their operations and their cash flows for each of the three years in the period ended December 31, 2014, in conformity with accounting principles generally accepted in the United States of America. Also, in our opinion, such financial statement schedules, when considered in relation to the basic consolidated financial statements taken as a whole, present fairly, in all material respects, the information set forth therein.
We have also audited, in accordance with the standards of the Public Company Accounting Oversight Board (United States), the Company’s internal control over financial reporting as of December 31, 2014, based on the criteria established in Internal Control—Integrated Framework (2013) issued by the Committee of Sponsoring Organizations of the Treadway Commission and our report dated February 10, 2015 expressed an unqualified opinion on the Company’s internal control over financial reporting.
| /s/ Deloitte & Touche LLP |
Los Angeles, California
February 10, 2015
HCP, Inc.
CONSOLIDATED BALANCE SHEETS
(In thousands, except share data)
| December 31, | |||||||
| 2014 | 2013 | ||||||
| ASSETS | |||||||
| Real estate: | |||||||
| Buildings and improvements | $ | 10,972,973 | $ | 10,544,110 | |||
| Development costs and construction in progress | 275,233 | 225,869 | |||||
| Land | 1,889,438 | 1,822,862 | |||||
| Accumulated depreciation and amortization | (2,250,757) | (1,965,592) | |||||
| Net real estate | 10,886,887 | 10,627,249 | |||||
| Net investment in direct financing leases | 7,280,334 | 7,153,399 | |||||
| Loans receivable, net | 906,961 | 366,001 | |||||
| Investments in and advances to unconsolidated joint ventures | 605,448 | 196,576 | |||||
| Accounts receivable, net of allowance of $3,785 and $1,529, respectively | 36,339 | 27,494 | |||||
| Cash and cash equivalents | 183,810 | 300,556 | |||||
| Restricted cash | 48,976 | 37,229 | |||||
| Intangible assets, net | 481,013 | 489,842 | |||||
| Real estate assets held for sale, net | — | 9,819 | |||||
| Other assets, net | 940,172 | 867,705 | |||||
| Total assets(1) | $ | 21,369,940 | $ | 20,075,870 | |||
| LIABILITIES AND EQUITY | |||||||
| Bank line of credit | $ | 838,516 | $ | — | |||
| Term loan | 213,610 | 226,858 | |||||
| Senior unsecured notes | 7,626,194 | 6,963,375 | |||||
| Mortgage debt | 984,431 | 1,396,485 | |||||
| Other debt | 97,022 | 74,909 | |||||
| Intangible liabilities, net | 84,723 | 98,810 | |||||
| Accounts payable and accrued liabilities | 432,934 | 318,427 | |||||
| Deferred revenue | 95,411 | 65,872 | |||||
| Total liabilities(2) | 10,372,841 | 9,144,736 | |||||
| Commitments and contingencies | |||||||
| Common stock, $1.00 par value: 750,000,000 shares authorized; 459,746,267 and 456,960,648 shares issued and outstanding, respectively | 459,746 | 456,961 | |||||
| Additional paid-in capital | 11,431,987 | 11,334,041 | |||||
| Cumulative dividends in excess of earnings | (1,132,541) | (1,053,215) | |||||
| Accumulated other comprehensive loss | (23,895) | (14,487) | |||||
| Total stockholders’ equity | 10,735,297 | 10,723,300 | |||||
| Joint venture partners | 73,214 | 23,729 | |||||
| Non-managing member unitholders | 188,588 | 184,105 | |||||
| Total noncontrolling interests | 261,802 | 207,834 | |||||
| Total equity | 10,997,099 | 10,931,134 | |||||
| Total liabilities and equity | $ | 21,369,940 | $ | 20,075,870 |
| (1) | The Company’s consolidated total assets at December 31, 2014 and 2013 include assets of certain variable interest entities (“VIEs”) that can only be used to settle the liabilities of those VIEs. Total assets at December 31, 2014 include VIE assets as follows: buildings and improvements $677 million; land $113 million; accumulated depreciation and amortization $111 million; accounts receivable $5 million; cash $42 million; and other assets $23 million. Total assets at December 31, 2013 include other assets of $1 million from VIEs. See Note 21 to the Consolidated Financial Statements for additional details. |
|---|
| (2) | The Company’s consolidated total liabilities at December 31, 2014 and 2013 include liabilities of certain VIEs for which the VIE creditors do not have recourse to HCP, Inc. Total liabilities at December 31, 2014, include accounts payable and accrued liabilities of $34 million and deferred revenue of $12 million from VIEs. Total liabilities at December 31, 2013 include accounts payable and accrued liabilities of $9 million from VIEs. See Note 21 to the Consolidated Financial Statements for additional details. |
|---|
See accompanying Notes to Consolidated Financial Statements.
HCP, Inc.
CONSOLIDATED STATEMENTS OF INCOME
(In thousands, except per share data)
| | | | | | | | | | | | | --- | --- | --- | --- | --- | --- |
Showing the first 8K of 203K characters. Open the full section
Item 9. Changes in and Disagreements with Accountants on Accounting and Financial Disclosure
None.
Item 9A. Controls and Procedures
Disclosure Controls and Procedures. We maintain disclosure controls and procedures that are designed to ensure that information required to be disclosed in our reports under the Exchange Act is recorded, processed, summarized and reported within the time periods specified in the SEC’s rules and forms and that such information is accumulated and communicated to our management, including our Chief Executive Officer (Principal Executive Officer) and Chief Financial Officer (Principal Financial Officer), to allow for timely decisions regarding required disclosure. In designing and evaluating the disclosure controls and procedures, management recognizes that any controls and procedures, no matter how well designed and operated, can provide only reasonable assurance of achieving the desired control objectives, and management is required to apply its judgment in evaluating the cost-benefit relationship of possible controls and procedures.
As required by Rules 13a-15(b) and 15d-15(b) of the Exchange Act, we carried out an evaluation, under the supervision and with the participation of our management, including our Chief Executive Officer (Principal Executive Officer) and Chief Financial Officer (Principal Financial Officer), of the effectiveness of the design and operation of our disclosure controls and procedures as of December 31, 2014. Based upon that evaluation, our Chief Executive Officer (Principal Executive Officer) and Chief Financial Officer (Principal Financial Officer) concluded that our disclosure controls and procedures were effective, as of December 31, 2014, at the reasonable assurance level.
Changes in Internal Control Over Financial Reporting. There were no changes in our internal control over financial reporting (as such term is defined in Rules 13a-15(f) and 15d-15(f) under the Exchange Act) during the fourth quarter of 2014 to which this report relates that have materially affected, or are reasonable likely to materially affect, our internal control over financial reporting.
Management’s Annual Report on Internal Control over Financial Reporting. Management is responsible for establishing and maintaining adequate internal control over financial reporting, as such term is defined in Exchange Act Rules 13a-15(f) and 15d-15(f). Under the supervision and with the participation of our management, including our Chief Executive Officer (Principal Executive Officer) and Chief Financial Officer (Principal Financial Officer), we conducted an evaluation of the effectiveness of our internal control over financial reporting based on the framework in Internal Control—Integrated Framework (2013) issued by the Committee of Sponsoring Organizations of the Treadway Commission. Based on our evaluation under the framework in Internal Control—Integrated Framework (2013), our management concluded that our internal control over financial reporting was effective as of December 31, 2014.
The effectiveness of our internal control over financial reporting as of December 31, 2014 has been audited by Deloitte & Touche LLP, an independent registered public accounting firm, as stated in their report which is included herein.
REPORT OF INDEPENDENT REGISTERED PUBLIC ACCOUNTING FIRM
The Board of Directors and Stockholders of HCP, Inc.
Irvine, California
We have audited the internal control over financial reporting of HCP, Inc. and subsidiaries (the ‘‘Company’’) as of December 31, 2014, based on criteria established in Internal Control—Integrated Framework (2013) issued by the Committee of Sponsoring Organizations of the Treadway Commission. The Company’s management is responsible for maintaining effective internal control over financial reporting and for its assessment of the effectiveness of internal control over financial reporting, included in the accompanying Management’s Annual Report on Internal Control over Financial Reporting. Our responsibility is to express an opinion on the Company’s internal control over financial reporting based on our audit.
We conducted our audit in accordance with the standards of the Public Company Accounting Oversight Board (United States). Those standards require that we plan and perform the audit to obtain reasonable assurance about whether effective internal control over financial reporting was maintained in all material respects. Our audit included obtaining an understanding of internal control over financial reporting, assessing the risk that a material weakness exists, testing and evaluating the design and operating effectiveness of internal control based on the assessed risk, and performing such other procedures as we considered necessary in the circumstances. We believe that our audit provides a reasonable basis for our opinion.
A company’s internal control over financial reporting is a process designed by, or under the supervision of, the company’s principal executive and principal financial officers, or persons performing similar functions, and effected by the company’s board of directors, management, and other personnel to provide reasonable assurance regarding the reliability of financial reporting and the preparation of financial statements for external purposes in accordance with generally accepted accounting principles. A company’s internal control over financial reporting includes those policies and procedures that (1) pertain to the maintenance of records that, in reasonable detail, accurately and fairly reflect the transactions and dispositions of the assets of the company; (2) provide reasonable assurance that transactions are recorded as necessary to permit preparation of financial statements in accordance with generally accepted accounting principles, and that receipts and expenditures of the company are being made only in accordance with authorizations of management and directors of the company; and (3) provide reasonable assurance regarding prevention or timely detection of unauthorized acquisition, use, or disposition of the company’s assets that could have a material effect on the financial statements.
Because of the inherent limitations of internal control over financial reporting, including the possibility of collusion or improper management override of controls, material misstatements due to error or fraud may not be prevented or detected on a timely basis. Also, projections of any evaluation of the effectiveness of the internal control over financial reporting to future periods are subject to the risk that the controls may become inadequate because of changes in conditions, or that the degree of compliance with the policies or procedures may deteriorate.
In our opinion, the Company maintained, in all material respects, effective internal control over financial reporting as of December 31, 2014, based on the criteria established in Internal Control—Integrated Framework (2013) issued by the Committee of Sponsoring Organizations of the Treadway Commission.
We have also audited, in accordance with the standards of the Public Company Accounting Oversight Board (United States), the consolidated financial statements and financial statement schedules as of and for the year ended December 31, 2014, of the Company and our report dated February 10, 2015 expressed an unqualified opinion on those financial statements and financial statement schedules.
| /s/ Deloitte & Touche LLP |
|---|
Los Angeles, California
February 10, 2015
Item 9B. Other Information
None.
PART III
Item 10. Directors, Executive Officers and Corporate Governance
We have adopted a Code of Business Conduct and Ethics that applies to all of our directors and employees, including our Chief Executive Officer and all senior financial officers, including our principal financial officer, principal accounting officer and controller. We have also adopted a Vendor Code of Business Conduct and Ethics applicable to our vendors and business partners. A current copy of our Code of Business Conduct and Ethics and Vendor Code of Business Conduct and Ethics are posted on the Investor Relations section of our website at www.hcpi.com. In addition, waivers from, and amendments to, our Code of Business Conduct and Ethics that apply to our directors and executive officers, including our principal executive officer, principal financial officer, principal accounting officer or persons performing similar functions, will be timely posted in the Investor Relations section of our website at www.hcpi.com.
We hereby incorporate by reference the information appearing under the captions “Proposal No. 1 Election of Directors,” “Our Executive Officers,” “Board of Directors and Corporate Governance” and “Section 16(a) Beneficial Ownership Reporting Compliance” in the Registrant’s definitive proxy statement relating to its 2015 Annual Meeting of Stockholders to be held on April 30, 2015.
Item 11. Executive Compensation
We hereby incorporate by reference the information under the caption “Executive Compensation” in the Registrant’s definitive proxy statement relating to its 2015 Annual Meeting of Stockholders to be held on April 30, 2015.
Item 12. Security Ownership of Certain Beneficial Owners and Management and Related Stockholder Matters
We hereby incorporate by reference the information under the captions “Security Ownership of Principal Stockholders, Directors and Management” and “Proposal No. 4 HCP, Inc. 2014 Performance Incentive Plan Proposal” in the Registrant’s definitive proxy statement relating to its 2015 Annual Meeting of Stockholders to be held on April 30, 2015.
Item 13. Certain Relationships and Related Transactions, and Director Independence
We hereby incorporate by reference the information under the captions “Certain Transactions” and “Board of Directors and Corporate Governance” in the Registrant’s definitive proxy statement relating to its 2015 Annual Meeting of Stockholders to be held on April 30, 2015.
Item 14. Principal Accounting Fees and Services
We hereby incorporate by reference under the caption “Audit and Non-Audit Fees” in the Registrant’s definitive proxy statement relating to its 2015 Annual Meeting of Stockholders to be held on April 30, 2015.
PART IV
Item 15. Exhibits, Financial Statement Schedules
(a) 1. Financial Statement Schedules
Schedule II: Valuation and Qualifying Accounts
| Allowance Accounts(1) | Additions | Deductions | |||||||||||||||||
| Amounts | |||||||||||||||||||
| Balance at | Charged | Uncollectible | |||||||||||||||||
| Year Ended | Beginning of | Against | Acquired | Accounts | Disposed | Balance at | |||||||||||||
| December 31, | Year | Operations, net | Properties | Written-off | Properties | End of Year | |||||||||||||
| 2014 | $ | 49,169 | $ | 5,413 | $ | — | $ | (2,512) | $ | (693) | $ | 51,377 | |||||||
| 2013 | 48,599 | 2,633 | — | (2,063) | — | 49,169 | |||||||||||||
| 2012 | 49,209 | 3,724 | — | (960) | (3,374) | 48,599 |
| (1) | Includes allowance for doubtful accounts, straight-line rent reserves, and allowances for loan and direct financing lease losses. |
|---|
Schedule III: Real Estate and Accumulated Depreciation
| Costs | Life on Which | ||||||||||||||||||||||||||||||||
| Capitalized | Gross Amount at Which Carried | Depreciation in | |||||||||||||||||||||||||||||||
| Initial Cost to Company | Subsequent | As of December 31, 2014 | Year | Latest Income | |||||||||||||||||||||||||||||
| Encumbrances at | Buildings and | to | Buildings and | Accumulated | Acquired/ | Statement is | |||||||||||||||||||||||||||
| City | State | December 31, 2014 | Land | Improvements | Acquisition | Land | Improvements | Total(1) | Depreciation | Constructed | Computed | ||||||||||||||||||||||
| Senior housing | |||||||||||||||||||||||||||||||||
| 1107 | Huntsville | AL | $ | — | $ | 307 | $ | 5,813 | $ | — | $ | 307 | $ | 5,453 | $ | 5,760 | $ | (1,125) | 2006 | 40 | |||||||||||||
| 2366 | Little Rock | AR | — | 1,922 | 14,140 | 445 | 2,046 | 13,967 | 16,013 | (3,030) | 2006 | 45 | |||||||||||||||||||||
| 0786 | Douglas | AZ | — | 110 | 703 | — | 110 | 703 | 813 | (305) | 2005 | 35 | |||||||||||||||||||||
| 2384 | Prescott | AZ | — | 1,276 | 8,660 | — | 1,276 | 8,660 | 9,936 | (688) | 2012 | 45 | |||||||||||||||||||||
| 1974 | Sun City | AZ | 26,908 | 2,640 | 33,223 | 1,620 | 2,640 | 34,314 | 36,954 | (4,647) | 2011 | 30 | |||||||||||||||||||||
| 0518 | Tucson | AZ | — | 2,350 | 24,037 | — | 2,350 | 24,037 | 26,387 | (9,014) | 2002 | 30 | |||||||||||||||||||||
| 1238 | Beverly Hills | CA | — | 9,872 | 32,590 | 2,208 | 9,872 | 34,073 | 43,945 | (7,652) | 2006 | 40 | |||||||||||||||||||||
| 2362 | Camarillo | CA | — | 5,798 | 19,427 | 575 | 5,822 | 19,202 | 25,024 | (4,073) | 2006 | 45 | |||||||||||||||||||||
| 2352 | Carlsbad | CA | — | 7,897 | 14,255 | 2,063 | 7,897 | 15,527 | 23,424 | (2,913) | 2006 | 45 | |||||||||||||||||||||
| 0883 | Carmichael | CA | — | 4,270 | 13,846 | — | 4,270 | 13,236 | 17,506 | (2,675) | 2006 | 40 | |||||||||||||||||||||
| 2204 | Chino Hills | CA | — | 3,720 | 41,183 | — | 3,720 | 41,183 | 44,903 | (803) | 2014 | 35 | |||||||||||||||||||||
| 0851 | Citrus Heights | CA | — | 1,180 | 8,367 | — | 1,180 | 8,037 | 9,217 | (2,298) | 2006 | 29 | |||||||||||||||||||||
| 2092 | Clearlake | CA | — | 354 | 4,799 | — | 354 | 4,799 | 5,153 | (328) | 2012 | 45 | |||||||||||||||||||||
| 0790 | Concord | CA | 25,000 | 6,010 | 39,601 | — | 6,010 | 38,301 | 44,311 | (9,002) | 2005 | 40 | |||||||||||||||||||||
| 2399 | Corona | CA | — | 2,637 | 10,134 | — | 2,637 | 10,134 | 12,771 | (687) | 2012 | 45 | |||||||||||||||||||||
| 0787 | Dana Point | CA | — | 1,960 | 15,946 | — | 1,960 | 15,466 | 17,426 | (3,641) | 2005 | 39 | |||||||||||||||||||||
| 2364 | Elk Grove | CA | — | 2,235 | 6,339 | 262 | 2,235 | 6,448 | 8,683 | (1,367) | 2006 | 45 | |||||||||||||||||||||
| 0798 | Escondido | CA | 14,340 | 5,090 | 24,253 | — | 5,090 | 23,353 | 28,443 | (5,498) | 2005 | 40 | |||||||||||||||||||||
| 2054 | Fortuna | CA | — | 818 | 3,295 | — | 818 | 3,295 | 4,113 | (996) | 2012 | 50 | |||||||||||||||||||||
| 2079 | Fortuna | CA | — | 1,346 | 11,856 | — | 1,346 | 11,856 | 13,202 | (2,553) | 2012 | 45 | |||||||||||||||||||||
| 0791 | Fremont | CA | 8,641 | 2,360 | 11,672 | — | 2,360 | 11,192 | 13,552 | (2,635) | 2005 | 40 | |||||||||||||||||||||
| 1965 | Fresno | CA | 18,666 | 1,730 | 31,918 | 6,623 | 1,730 | 38,111 | 39,841 | (4,342) | 2011 | 30 | |||||||||||||||||||||
| 0788 | Granada Hills | CA | — | 2,200 | 18,257 | — | 2,200 | 17,637 | 19,837 | (4,152) | 2005 | 39 | |||||||||||||||||||||
| 1156 | Hemet | CA | — | 1,270 | 5,966 | 214 | 1,271 | 5,933 | 7,204 | (1,603) | 2006 | 40 | |||||||||||||||||||||
| 0856 | Irvine | CA | — | 8,220 | 14,104 | — | 8,220 | 13,564 | 21,784 | (2,537) | 2006 | 45 | |||||||||||||||||||||
| 0227 | Lodi | CA | 8,664 | 732 | 5,453 | — | 732 | 5,453 | 6,185 | (2,540) | 1997 | 35 | |||||||||||||||||||||
| 0226 | Murrieta | CA | 5,822 | 435 | 5,729 | — | 435 | 5,729 | 6,164 | (2,601) | 1997 | 35 | |||||||||||||||||||||
| 1165 | Northridge | CA | — | 6,718 | 26,309 | 549 | 6,752 | 26,015 | 32,767 | (5,464) | 2006 | 40 | |||||||||||||||||||||
| 1561 | Orangevale | CA | — | 2,160 | 8,522 | 1,000 | 2,160 | 9,002 | 11,162 | (2,031) | 2008 | 40 | |||||||||||||||||||||
| 1168 | Palm Springs | CA | — | 1,005 | 5,183 | 396 | 1,005 | 5,216 | 6,221 | (1,124) | 2006 | 40 | |||||||||||||||||||||
| 0789 | Pleasant Hill | CA | 6,270 | 2,480 | 21,333 | — | 2,480 | 20,633 | 23,113 | (4,857) | 2005 | 40 | |||||||||||||||||||||
| 2369 | Rancho Mirage | CA | — | 1,798 | 24,053 | 475 | 1,811 | 23,600 | 25,411 | (4,925) | 2006 | 45 | |||||||||||||||||||||
| 2380 | Roseville | CA | — | 692 | 21,662 | — | 692 | 21,662 | 22,354 | (1,220) | 2012 | 45 | |||||||||||||||||||||
| 2205 | Roseville | CA | — | 3,844 | 33,527 |
Showing the first 8K of 168K characters. Open the full section