 filings.tools
Healthpeak Properties 10-K 2019-12-31
Filed 2020-02-13. 22 sections, 728K characters. Original on sec.gov · Markdown · JSON
Cover and table of contents
UNITED STATES
SECURITIES AND EXCHANGE COMMISSION
Washington, D.C. 20549
FORM 10-K
(Mark One)
| ☒ | ANNUAL REPORT PURSUANT TO SECTION 13 OR 15(d) OF THE SECURITIES EXCHANGE ACT OF 1934. |
For the fiscal year ended December 31, 2019
or
| ☐ | TRANSITION REPORT PURSUANT TO SECTION 13 OR 15(d) OF THE SECURITIES EXCHANGE ACT OF 1934 |
For the transition period from to
Commission file number 001-08895
Healthpeak Properties, Inc.
(Exact name of registrant as specified in its charter)
| Maryland | 33-0091377 | |
| (State or other jurisdiction of incorporation or organization) | (I.R.S. Employer Identification No.) |
1920 Main Street**,** Suite 1200
Irvine**,** CA 92614
(Address of principal executive offices) (Zip Code)
Registrant’s telephone number, including area code (949) 407-0700
Securities registered pursuant to Section 12(b) of the Act:
| Title of each class | Trading symbol(s) | Name of each exchange on which registered |
| Common Stock | PEAK | New York Stock Exchange |
Indicate by check mark if the registrant is a well-known seasoned issuer, as defined in Rule 405 of the Securities Act. Yes ☒ No ☐
Indicate by check mark if the registrant is not required to file reports pursuant to Section 13 or Section 15(d) of the Act. Yes ☐ No ☒
Indicate by check mark whether the registrant; (1) has filed all reports required to be filed by Section 13 or 15(d) of the Securities Exchange Act of 1934 during the preceding 12 months (or for such shorter period that the registrant was required to file such reports), and (2) has been subject to such filing requirements for the past 90 days. Yes ☒ No ☐
Indicate by check mark whether the registrant has submitted electronically every Interactive Data File required to be submitted pursuant to Rule 405 of Regulation S-T (§232.405 of this chapter) during the preceding 12 months (or for such shorter period that the registrant was required to submit such files). Yes ☒ No ☐
Indicate by check mark whether the registrant is a large accelerated filer, an accelerated filer, a non-accelerated filer, a smaller reporting company or an emerging growth company. See the definitions of “large accelerated filer,” “accelerated filer”, “smaller reporting company” and "emerging growth company" in Rule 12b-2 of the Exchange Act.
| Large accelerated filer | ☒ | Accelerated filer | ☐ |
| Non-accelerated filer | ☐ | Smaller reporting company | ☐ |
| Emerging growth company | ☐ |
If an emerging growth company, indicate by check mark if the registrant has elected not to use the extended transition period for complying with any new or revised financial accounting standards provided pursuant to Section 13(a) of the Exchange Act. ☐
Indicate by check mark whether the registrant is a shell company (as defined by Rule 12b-2 of the Act.) Yes ☐ No ☒
State the aggregate market value of the voting and non-voting common equity held by non-affiliates computed by reference to the price at which the common equity was last sold, or the average bid and asked price of such common equity, as of the last business day of the registrant’s most recently completed second fiscal quarter: $13.2 billion.
As of February 10, 2020 there were 505,411,840 shares of common stock outstanding.
DOCUMENTS INCORPORATED BY REFERENCE
Portions of the definitive Proxy Statement for the registrant’s 2020 Annual Meeting of Stockholders have been incorporated by reference into Part III of this Report.
Healthpeak Properties, Inc.
Form 10-K
For the Fiscal Year Ended December 31, 2019
Table of Contents
All references in this report to “Healthpeak,” the “Company,” “we,” “us” or “our” mean Healthpeak Properties, Inc., together with its consolidated subsidiaries. Unless the context suggests otherwise, references to “Healthpeak Properties, Inc.” mean the parent company without its subsidiaries.
Cautionary Language Regarding Forward-Looking Statements
Statements in this Annual Report on Form 10-K that are not historical factual statements are “forward-looking statements” within the meaning of Section 27A of the Securities Act of 1933, as amended, and Section 21E of the Securities Exchange Act of 1934, as amended (the “Exchange Act”). Forward-looking statements include, among other things, statements regarding our and our officers’ intent, belief or expectation as identified by the use of words such as “may,” “will,” “project,” “expect,” “believe,” “intend,” “anticipate,” “seek,” “target,” “forecast,” “plan,” “potential,” “estimate,” “could,” “would,” “should” and other comparable and derivative terms or the negatives thereof. Forward-looking statements reflect our current expectations and views about future events and are subject to risks and uncertainties that could significantly affect our future financial condition and results of operations. While forward-looking statements reflect our good faith belief and assumptions we believe to be reasonable based upon current information, we can give no assurance that our expectations or forecasts will be attained. Further, we cannot guarantee the accuracy of any such forward-looking statement contained in this Annual Report, and such forward-looking statements are subject to known and unknown risks and uncertainties that are difficult to predict. As more fully set forth under “Item 1A, Risk Factors” in this report, these risks and uncertainties include, among other things:
| • | operational risks associated with third party management contracts, including the additional regulation and liabilities of our RIDEA lease structures; |
| • | the ability of our existing and future tenants, operators and borrowers to conduct their respective businesses in a manner sufficient to maintain or increase their revenues and manage their expenses in order to generate sufficient income to make rent and loan payments to us and our ability to recover investments made, if applicable, in their operations; |
| • | the financial condition of our existing and future tenants, operators, and borrowers, including potential bankruptcies and downturns in their businesses, and their legal and regulatory proceedings, which may result in uncertainties regarding our ability to continue to realize the full benefit of such tenants’ and operators’ leases and borrowers’ loans; |
| • | our concentration in the healthcare property sector, particularly in senior housing, life sciences and medical office buildings, which makes our profitability more vulnerable to a downturn in a specific sector than if we were investing in multiple industries; |
| • | the effect on us and our tenants and operators of legislation, executive orders and other legal requirements, including compliance with the Americans with Disabilities Act, fire, safety and health regulations, environmental laws, the Affordable Care Act, licensure, certification and inspection requirements, and laws addressing entitlement programs and related services, including Medicare and Medicaid, which may result in future reductions in reimbursements or fines for noncompliance; |
| • | our ability to identify replacement tenants and operators and the potential renovation costs and regulatory approvals associated therewith; |
| • | the risks associated with property development and redevelopment, including costs above original estimates, project delays and lower occupancy rates and rents than expected; |
| • | the potential impact of uninsured or underinsured losses; |
| • | the risks associated with our investments in joint ventures and unconsolidated entities, including our lack of sole decision making authority and our reliance on our partners’ financial condition and continued cooperation; |
| • | competition for the acquisition and financing of suitable healthcare properties as well as competition for tenants and operators, including with respect to new leases and mortgages and the renewal or rollover of existing leases; |
| • | our, or our counterparties', ability to fulfill obligations, such as financing conditions and/or regulatory approval requirements, required to successfully consummate acquisitions, dispositions, transitions, developments, redevelopments, joint venture transactions, or other transactions; |
| • | our ability to achieve the benefits of acquisitions or other investments within expected time frames or at all, or within expected cost projections; |
| • | the potential impact on us and our tenants, operators and borrowers from current and future litigation matters, including the possibility of larger than expected litigation costs, adverse results, and related developments; |
| • | changes in federal, state or local laws and regulations, including those affecting the healthcare industry that affect our costs of compliance or increase the costs, or otherwise affect the operations, of our tenants and operators; |
| • | our ability to foreclose on collateral securing our real estate-related loans; |
| • | volatility or uncertainty in the capital markets, the availability and cost of capital as impacted by interest rates, changes in our credit ratings, and the value of our common stock, and other conditions that may adversely impact our ability to fund our obligations or consummate transactions, or reduce the earnings from potential transactions; |
| • | changes in global, national and local economic and other conditions; |
| • | our ability to manage our indebtedness level and changes in the terms of such indebtedness; |
| • | competition for skilled management and other key personnel; |
| • | our reliance on information technology systems and the potential impact of system failures, disruptions or breaches; and |
| • | our ability to maintain our qualification as a real estate investment trust (“REIT”). |
Except as required by law, we do not undertake, and hereby disclaim, any obligation to update any forward-looking statements, which speak only as of the date on which they are made.
PART I
Item 1. Business
General Overview
Healthpeak Properties, Inc. is a Standard & Poor's ("S&P") 500 company that acquires, develops, owns, leases, and manages healthcare real estate across the United States ("U.S."). We are a Maryland corporation and qualify as a self-administered REIT. We are headquartered in Irvine, California, with additional offices in Nashville and San Francisco. At December 31, 2019, we had 204 full-time employees.
On October 30, 2019, we changed our name from HCP, Inc. to Healthpeak Properties, Inc. Our common shares began trading on the New York Stock Exchange under the new name and ticker symbol, "PEAK", on November 5, 2019.
We invest in a diversified portfolio of high-quality healthcare properties across our three core asset classes of senior housing, life science, and medical office real estate. Our senior housing properties are either operated under triple-net leases in our senior housing triple-net segment or through RIDEA structures in our senior housing operating portfolio (“SHOP”) segment. Under the life science and medical office segments, we invest through the acquisition, development, and management of life science buildings and medical office buildings. We have other non-reportable segments that are comprised primarily of our unconsolidated joint ventures, hospital properties, and debt investments.
At December 31, 2019, our consolidated portfolio of investments consisted of interests in 617 properties. We also owned interests in 48 properties owned by our unconsolidated joint ventures at December 31, 2019. The following table summarizes information for our reportable segments for the year ended December 31, 2019 (dollars in thousands):
| Segment | Total Portfolio Adjusted NOI**(1)** | Percentage of Total Portfolio Adjusted NOI**(1)** | Number of Properties | |||||||
| Senior housing triple-net | $ | 197,601 | 18 | % | 90 | |||||
| SHOP | 162,330 | 15 | % | 115 | ||||||
| Life science | 311,192 | 29 | % | 134 | ||||||
| Medical office | 364,115 | 33 | % | 267 | ||||||
| Other non-reportable(2) | 51,873 | 5 | % | 11 | ||||||
| Totals | $ | 1,087,111 | 100 | % | 617 |
_______________________________________
(1) Total Portfolio metrics include results of operations from disposed properties and properties that transitioned segments through the disposition or transition date. Adjusted NOI excludes our share of income (loss) from unconsolidated joint ventures. See "Item 7, Management's Discussion and Analysis of Financial Condition and Results of Operations—Results of Operations—Non-GAAP Financial Measures" for additional information regarding Adjusted NOI and see Note 15 to the Consolidated Financial Statements for a reconciliation of Adjusted NOI by segment to net income (loss).
(2) Adjusted NOI for Other non-reportable segments excludes our share of earnings from unconsolidated joint ventures, which is recorded in equity income (loss) from unconsolidated joint ventures in our consolidated statements of operations.
For a description of our significant activities during 2019, see “Item 7, Management's Discussion and Analysis of Financial Condition and Results of Operations—2019 Transaction Overview” in this report.
Business Strategy
We invest in and manage our real estate portfolio for the long-term to maximize benefit to our stockholders and support the growth of our dividends. Our strategy consists of four core elements:
| (i) | Our real estate: Our portfolio is grounded in high-quality properties in desirable locations. We focus on three purposely selected private pay asset classes, senior housing, life science, and medical office, to provide stability through inevitable market cycles. |
| (ii) | Our financials: We maintain a strong investment-grade balance sheet with ample liquidity as well as long-term fixed-rate debt financing with staggered maturities to reduce our exposure to interest-rate volatility and refinancing risk. |
| (iii) | Our partnerships: We work with leading healthcare companies, operators, and service providers and are responsive to their space and capital needs. We provide high-quality management services to encourage tenants to renew, expand, and relocate into our properties, which drives increased occupancy, rental rates, and property values. |
| (iv) | Our platform: We have a people-first culture that we believe attracts, develops, and retains top talent. We continually strive to create and maintain an industry-leading platform with systems and tools that allow us to effectively and efficiently manage our assets and investment activity. |
Internal Growth Strategies
We believe our real estate portfolio holds the potential for increased future cash flows as it is well-maintained and in desirable locations. Our strategy for maximizing the benefits from these opportunities is to: (i) work with new or existing tenants and operators to address their space and capital needs and (ii) provide high-quality property management services in order to motivate tenants to renew, expand, or relocate into our properties.
We expect to continue our internal growth as a result of our ability to:
| • | Build and maintain long-term leasing and management relationships with quality tenants and operators. In choosing locations for our properties, we focus on the physical environment, adjacency to established businesses (e.g., hospital systems) and educational centers, proximity to sources of business growth, and other local demographic factors. |
| • | Replace tenants and operators at the best available market terms and lowest possible transaction costs. We believe we are well-positioned to attract new tenants and operators and achieve attractive rental rates and operating cash flow as a result of the location, design, and maintenance of our properties, together with our reputation for high-quality building services and responsiveness to tenants, and our ability to offer space alternatives within our portfolio. |
| • | Extend and modify terms of existing leases prior to expiration. We structure lease extensions, early renewals, or modifications, which reduce the cost associated with lease downtime or the re-investment risk resulting from the exercise of tenants’ purchase options, while securing the tenancy and relationship of our high quality tenants and operators on a long-term basis. |
Investment Strategies
The delivery of healthcare services requires real estate and, as a result, tenants and operators depend on real estate, in part, to maintain and grow their businesses. We believe the healthcare real estate market provides investment opportunities due to the: (i) compelling long-term demographics driving the demand for healthcare services; (ii) specialized nature of healthcare real estate investing; and (iii) ongoing consolidation of the fragmented healthcare real estate sector.
While we emphasize healthcare real estate ownership, we may also provide real estate secured financing to, or invest in equity or debt securities of, healthcare operators or other entities engaged in healthcare real estate ownership. We may also acquire all or substantially all of the securities or assets of other REITs, operating companies, or similar entities where such investments would be consistent with our investment strategies. We may co-invest alongside institutional or development investors through partnerships or limited liability companies.
We monitor, but do not limit, our investments based on the percentage of our total assets that may be invested in any one property type, investment vehicle, or geographic location, the number of properties that may be leased to a single tenant or operator, or loans that may be made to a single borrower. In allocating capital, we target opportunities with the most attractive risk/reward profile for our portfolio as a whole. We may take additional measures to mitigate risk, including diversifying our investments (by sector, geography, tenant, or operator), structuring transactions as master leases, requiring tenant or operator insurance and indemnifications, and/or obtaining credit enhancements in the form of guarantees, letters of credit, or security deposits.
We believe we are well-positioned to achieve external growth through acquisitions, financing, and development. Other factors that contribute to our competitive position include:
| • | our reputation gained through over 30 years of successful operations and the strength of our existing portfolio of properties; |
| • | our relationships with leading healthcare operators and systems, investment banks and other market intermediaries, corporations, private equity firms, not-for-profit organizations, and public institutions seeking to monetize existing assets or develop new facilities; |
| • | our relationships with institutional buyers and sellers of high-quality healthcare real estate; |
| • | our track record and reputation for executing acquisitions responsively and efficiently, which provides confidence to domestic and foreign institutions and private investors who seek to sell healthcare real estate in our market areas; |
| • | our relationships with nationally recognized financial institutions that provide capital to the healthcare and real estate industries; and |
| • | our control of sites (including assets under contract with radius restrictions). |
Financing Strategies
Our REIT qualification requires us to distribute at least 90% of our REIT taxable income (excluding net capital gains); therefore, we do not retain a significant amount of capital. As a result, we regularly access the public equity and debt markets to raise the funds necessary to finance acquisitions and debt investments, develop and redevelop properties, and refinance maturing debt.
We may finance acquisitions and other investments through the following vehicles:
| • | cash flow from operations; |
| • | sale or exchange of ownership interests in properties or other investments; |
| • | borrowings under our credit facility or commercial paper program; |
| • | issuance of additional debt, including unsecured notes, term loans, and mortgage debt; and/or |
| • | issuance of common stock or preferred stock or its equivalent. |
We maintain a disciplined balance sheet by actively managing our debt to equity levels and maintaining multiple sources of liquidity. Our debt obligations are primarily long-term fixed rate with staggered maturities.
We finance our investments based on our evaluation of available sources of funding. For short-term purposes, we may utilize our revolving line of credit facility or commercial paper program, arrange for other short-term borrowings from banks or other sources, or issue equity securities pursuant to our at-the-market equity offering program. We arrange for longer-term financing by offering debt and equity securities, placing mortgage debt, and obtaining capital from institutional lenders and joint venture partners.
Segments
Senior housing (triple-net and senior housing operating portfolio, or SHOP)
Our senior housing properties are owned either through triple-net leases with third party tenant-operators or through so-called RIDEA structures, which is permitted by the Housing and Economic Recovery Act of 2008, and includes most of the provisions previously proposed in the REIT Investment Diversification and Empowerment Act of 2007 (commonly referred to as “RIDEA”). Our senior housing properties include independent living facilities (“ILFs”), assisted living facilities (“ALFs”), memory care facilities (“MCFs”), and continuing care retirement communities (“CCRCs”), which cater to different segments of the elderly population based upon their personal needs. The services provided by our third party tenant-operators under triple-net leases or by our third-party manager-operators under a RIDEA structure at our properties are primarily paid for by the residents directly or through private insurance and are less reliant on government reimbursement programs such as Medicare and Medicaid.
Our triple-net leases are typically long-term agreements with third party tenant-operators. Under triple-net leases, our tenant-operators are typically responsible for the ongoing expenses of the property, including real estate taxes, insurance, and maintenance, in addition to paying rent and utilities. Additionally, operational risks and liabilities are the responsibility of our tenant-operator, including with respect to any employment matters, compliance with healthcare and other laws and liabilities relating to personal injury-tort matters, resident-patient quality of care claims, and governmental reimbursement matters.
A RIDEA structure allows us, through a taxable REIT subsidiary (“TRS”), to receive cash flow from the operations of a healthcare facility (as compared to only receiving contractual rent from a third-party tenant-operator under a triple-net lease structure) in compliance with REIT tax requirements. The criteria for operating a healthcare facility through a RIDEA structure require us to lease the facility to an affiliate TRS under a triple-net lease, and for such affiliate TRS to engage an independent qualifying management company (also known as an eligible independent contractor or third-party operator) to manage and operate the day-to-day business of the facility in exchange for a management fee. As a result, under a RIDEA structure, we are required to rely on a third-party operator to hire and train all facility employees, enter into many third-party contracts for the benefit of the facility, including resident/patient agreements, comply with laws, including but not limited to healthcare laws, and provide resident care. We are substantially limited in our ability to control or influence day-to-day operations under a RIDEA structure, and thus rely on the third-party tenant-operator to manage and operate the business.
Unlike our triple-net leased properties, through our TRS, we bear all operational risks and liabilities associated with the operation of these properties, with limited exceptions, such as a third-party operator’s gross negligence or willful misconduct. These operational risks and liabilities include those relating to any employment matters of our operator, compliance with healthcare and other laws and liabilities relating to personal injury-tort matters, resident-patient quality of care claims, and any governmental reimbursement matters, even though we have limited ability to control or influence our third-party operators’ management of these risks.
We view RIDEA as an important structure for senior housing properties that present attractive valuation entry points and/or growth profiles, and this structure has become the preferred structure (as opposed to triple-net leases) among most high-quality operators in the senior housing industry. Many of the management agreements we have in RIDEA structures have terms ranging from 5 to 15 years, with mutual renewal options. The base management fees are typically 4.5% to 5.0% of gross revenues (as defined in the respective management agreements) generated by the RIDEA properties. In addition, there are sometimes incentive management fees payable to our third-party operators if operating results of the RIDEA properties exceed pre-established thresholds. Conversely, there are sometimes provisions in the management agreements that reduce management fees payable to our third-party operators if operating results do not meet certain pre-established thresholds.
Our senior housing property types under both triple-net leases and RIDEA structures are further described below:
| • | Independent Living Facilities. ILFs are designed to meet the needs of seniors who choose to live in an environment surrounded socially by their peers with services such as housekeeping, meals, and activities. Additionally, the programs and services may include transportation, social activities, exercise and fitness programs, beauty or barber shop access, hobby and craft activities, community excursions, meals in a dining room setting, and other activities sought by residents. These residents generally do not need assistance with activities of daily living (“ADL”). However, in some of our facilities, residents have the option to contract for these services. |
| • | Assisted Living Facilities. ALFs are licensed care facilities that provide personal care services, support and housing for those who need help with ADL, such as bathing, eating, dressing and medication management, yet require limited medical care. These facilities are often in apartment-like buildings with private residences ranging from single rooms to large apartments. Certain ALFs may have a dedicated portion of a facility that offers higher levels of personal assistance for residents requiring memory care as a result of Alzheimer’s disease or other forms of dementia. Levels of personal assistance are based in part on local regulations. |
| • | Memory Care Facilities. MCFs address the unique challenges of residents with Alzheimer’s disease or other forms of dementia. Residents may live in semi-private apartments or private rooms and have structured activities delivered by staff members trained specifically on how to care for residents with memory impairment. These facilities offer programs that provide comfort and care in a secure environment. |
| • | Continuing Care Retirement Communities. CCRCs offer several levels of service, including independent living, assisted living, and skilled nursing home care. CCRCs are different from other housing and care options for seniors because they usually provide written agreements or long-term contracts between residents and the communities (frequently lasting the term of the resident’s lifetime), which offer a continuum of housing, services and healthcare on one campus or site. CCRCs are appealing as they allow residents to “age in place.” CCRCs typically require the individual to be in relatively good health and independent upon entry. |
The following table provides information about our senior housing triple-net tenant concentration for the year ended December 31, 2019:
| Tenant | Percentage of Segment Revenues | Percentage of Total Revenues | ||||
| Brookdale Senior Living, Inc. (“Brookdale”)(1) | 38 | % | 4 | % |
_______________________________________
| (1) | Excludes facilities operated by Brookdale in our SHOP segment, as discussed below. Percentages of segment and total revenues include partial-year revenue earned from senior housing triple-net facilities that were sold or transitioned during 2019. Accordingly, the percentages of segment and total revenues are expected to decrease in 2020 (see Note 3 to the Consolidated Financial Statements). |
As third-party operators manage our RIDEA properties in exchange for the receipt of a management fee, we are not directly exposed to the credit risk of these operators in the same manner or to the same extent as our triple-net tenants.
Life science
These properties contain laboratory and office space primarily for biotechnology, medical device and pharmaceutical companies, scientific research institutions, government agencies, and other organizations involved in the life science industry. While these properties have characteristics similar to commercial office buildings, they generally contain more advanced electrical, mechanical, heating, ventilating, and air conditioning systems. The facilities generally have specialty equipment including emergency generators, fume hoods, lab bench tops, and related amenities. In many instances, life science tenants make significant investments to improve their leased space, in addition to landlord improvements, to accommodate biology, chemistry, or medical device research initiatives.
Life science properties are primarily configured in business park or campus settings and include multiple buildings. The business park and campus settings allow us the opportunity to provide flexible, contiguous/adjacent expansion to accommodate the growth of existing tenants. Our properties are located in well-established geographical markets known for scientific research and drug discovery, including San Francisco (57%) and San Diego (25%), California, and Boston, Massachusetts (12%) (based on square feet). At December 31, 2019, 87% of our life science properties were triple-net leased (based on leased square feet).
The following table provides information about our life science tenant concentration for the year ended December 31, 2019:
| Tenants | Percentage of Segment Revenues | Percentage of Total Revenues | ||||
| Amgen, Inc. | 12 | % | 3 | % |
Medical office
Medical office buildings (“MOBs”) typically contain physicians’ offices and examination rooms, and may also include pharmacies, hospital ancillary service space, and outpatient services such as diagnostic centers, rehabilitation clinics, and day-surgery operating rooms. While these facilities are similar to commercial office buildings, they require additional plumbing, electrical, and mechanical systems to accommodate multiple exam rooms that may require sinks in every room and special equipment such as x-ray machines. In addition, MOBs are often built to accommodate higher structural loads for certain equipment and may contain vaults or other specialized construction. Our MOBs are typically multi-tenant properties leased to healthcare providers (hospitals and physician practices), with approximately 84% of our MOBs located on hospital campuses and 95% affiliated with hospital systems (based on square feet). Occasionally, we invest in MOBs located on hospital campuses subject to ground leases. At December 31, 2019, approximately 58% of our MOBs were net leased (based on leased square feet) with the remaining leased under gross or modified gross leases.
The following table provides information about our medical office tenant concentration for the year ended December 31, 2019:
| Tenant | Percentage of Segment Revenues | Percentage of Total Revenues | ||||
| HCA Healthcare, Inc. (HCA) | 23 | % | 6 | % |
Other non-reportable segments.
At December 31, 2019, we had interests in 11 hospitals and 10 debt investments. Additionally, we had interests in 43 senior housing facilities, 3 MOBs, and 2 post-acute/skilled nursing facilities (“SNFs”) owned and operated by our unconsolidated joint ventures. Services provided by our tenants and operators in hospitals are paid for by private sources, third-party payors (e.g., insurance and HMOs) or through Medicare and Medicaid programs. Our hospital property types include acute care, long-term acute care, and specialty and rehabilitation hospitals. SNFs offer restorative, rehabilitative, and custodial nursing care for people following a hospital stay or not requiring the more extensive and complex treatment available at hospitals. All of our hospitals are triple-net leased.
Competition
Investing in real estate serving the healthcare industry is highly competitive. We face competition from other REITs, investment companies, pension funds, private equity investors, sovereign funds, healthcare operators, lenders, developers, and other institutional investors, some of whom may have greater flexibility (e.g., non-REIT competitors), greater resources, and lower costs of capital than we do. Increased competition makes it more challenging for us to identify and successfully capitalize on opportunities that meet our objectives. Our ability to compete may also be impacted by global, national, and local economic trends, availability of investment alternatives, availability and cost of capital, construction and renovation costs, existing laws and regulations, new legislation, and population trends.
Income from our investments depends on our tenants’ and operators’ ability to compete with other companies on multiple levels, including: (i) the quality of care provided, (ii) reputation, (iii) success of product or drug development, (iv) the physical appearance of a facility, (v) price and range of services offered, (vi) alternatives for healthcare delivery, (vii) the supply of competing properties, (viii) physicians, (ix) staff, (x) referral sources, (xi) location, (xii) the size and demographics of the population in surrounding areas, and (xiii) the financial condition of our tenants and operators. For a discussion of the risks associated with competitive conditions affecting our business, see “Item 1A, Risk Factors” in this report.
Government Regulation, Licensing and Enforcement
Overview
Our healthcare facility operators (which include our TRS entities when we use a RIDEA structure) and tenants are typically subject to extensive and complex federal, state, and local healthcare laws and regulations relating to quality of care, licensure and certificate of need, government reimbursement, fraud and abuse practices, and similar laws governing the operation of healthcare facilities, and we expect the healthcare industry, in general, will continue to face increased regulation and pressure in the areas of fraud, waste and abuse, cost control, healthcare management, and provision of services, among others. These regulations are wide ranging and can subject our tenants and operators to civil, criminal, and administrative sanctions. Affected tenants and operators may find it increasingly difficult to comply with this complex and evolving regulatory environment because of a relative lack of guidance in many areas as certain of our healthcare properties are subject to oversight from several government agencies, and the laws may vary from one jurisdiction to another. Changes in laws, regulations, reimbursement enforcement activity, and regulatory non-compliance by our tenants and operators can all have a significant effect on their operations and financial condition, which in turn may adversely impact us, as detailed below and set forth under “Item 1A, Risk Factors” in this report.
The following is a discussion of certain laws and regulations generally applicable to our operators, and in certain cases, to us.
Fraud and Abuse Enforcement
There are various extremely complex U.S. federal and state laws and regulations governing healthcare providers’ relationships and arrangements and prohibiting fraudulent and abusive practices by such providers. These laws include: (i) U.S. federal and state false claims acts, which, among other things, prohibit providers from filing false claims or making false statements to receive payment from Medicare, Medicaid, or other U.S. federal or state healthcare programs; (ii) U.S. federal and state anti-kickback and fee-splitting statutes, including the Medicare and Medicaid anti-kickback statute, which prohibit or restrict the payment or receipt of remuneration to induce referrals or recommendations of healthcare items or services; (iii) U.S. federal and state physician self-referral laws (commonly referred to as the “Stark Law”), which generally prohibit referrals by physicians to entities with which the physician or an immediate family member has a financial relationship; and (iv) the federal Civil Monetary Penalties Law, which prohibits, among other things, the knowing presentation of a false or fraudulent claim for certain healthcare services. Violations of U.S. healthcare fraud and abuse laws carry civil, criminal, and administrative sanctions, including punitive sanctions, monetary penalties, imprisonment, denial of Medicare and Medicaid reimbursement, and potential exclusion from Medicare, Medicaid or other federal or state healthcare programs. These laws are enforced by a variety of federal, state, and local agencies and in the U.S. can also be enforced by private litigants through, among other things, federal and state false claims acts, which allow private litigants to bring qui tam or “whistleblower” actions. Many of our tenants and operators are subject to these laws, and may become the subject of governmental enforcement actions or whistleblower actions if they fail to comply with applicable laws. Additionally, as of November 2019, the licensed operators of our U.S. long-term care facilities that participate in government reimbursement programs are required to have compliance and ethics programs that meet the requirements of federal laws and regulations relating to the Social Security Act. Consistent with RIDEA, such responsibilities are delegated to our operating partners and we have developed a program to periodically monitor compliance with such obligations.
Laws and Regulations Governing Privacy and Security
There are various U.S. federal and state privacy laws and regulations, including the privacy and security rules contained in the Health Insurance Portability and Accountability Act of 1996 (commonly referred to as “HIPAA”), which provide for the privacy and security of personal health information. An increasing focus of the U. S. Federal Trade Commission’s (“FTC’s”) consumer protection regulation is the impact of technological change on protection of consumer privacy. The FTC, as well as state attorneys general, have taken enforcement action against companies that do not abide by their representations to consumers regarding electronic security and privacy. To the extent we or our affiliated operating entities are a covered entity or business associate under HIPAA and the Health Information Technology for Economic and Clinical Health Act (the “HITECH Act”), compliance with those requirements would require us to, among other things, conduct a risk analysis, implement a risk management plan, implement policies and procedures, and conduct employee training. In most cases, we are dependent on our tenants and management companies to fulfill our compliance obligations, and we have developed a program to periodically monitor compliance with such obligations. Because of the far reaching nature of these laws, there can be no assurance we would not be required to alter one or more of our systems and data security procedures to be in compliance with these laws. Our failure to protect health information could subject us to civil or criminal liability and adverse publicity, and could harm our business and impair our ability to attract new customers and residents. We may be required to notify individuals, as well as government agencies and the media, if we experience a data breach.
Reimbursement
Sources of revenue for some of our tenants and operators include, among others, governmental healthcare programs, such as the federal Medicare programs and state Medicaid programs, and non-governmental third-party payors, such as insurance carriers and HMOs. As federal and state governments focus on healthcare reform initiatives, and as the federal government and many states face significant current and future budget deficits, efforts to reduce costs by these payors will likely continue, which may result in reduced or slower growth in reimbursement for certain services provided by some of our tenants and operators. Additionally, new and evolving payor and provider programs in the U.S., including but not limited to Medicare Advantage, Dual Eligible, Accountable Care Organizations, and Bundled Payments could adversely impact our tenants’ and operators’ liquidity, financial condition, or results of operations.
Healthcare Licensure and Certificate of Need
Certain healthcare facilities in our portfolio are subject to extensive national, federal, state, and local licensure, certification, and inspection laws and regulations. A healthcare facility’s failure to comply with these laws and regulations could result in a revocation, suspension, restriction, or non-renewal of the facility’s license and loss of a certificate of need, which could adversely affect the facility’s operations and ability to bill for items and services provided at the facility. In addition, various licenses and permits are required to handle controlled substances (including narcotics), operate pharmacies, handle radioactive materials, and operate equipment. Many states in the U.S. require certain healthcare providers to obtain a certificate of need, which requires prior approval for the construction, expansion, or closure of certain healthcare facilities. The approval process related to state certificate of need laws may impact the ability of some of our tenants and operators to expand or change their businesses.
Product Approvals
While our life science tenants include some well-established companies, other tenants are less established and, in some cases, may not yet have a product approved by the Food and Drug Administration, or other regulatory authorities, for commercial sale. Creating a new pharmaceutical product or medical device requires substantial investments of time and capital, in part because of the extensive regulation of the healthcare industry. It also entails considerable risk of failure in demonstrating that the product is safe and effective and in gaining regulatory approval and market acceptance.
Senior Housing Entrance Fee Communities
Certain of our senior housing facilities, primarily the CCRCs in our unconsolidated joint ventures, are operated as entrance fee communities. Generally, an entrance fee is an upfront fee or consideration paid by a resident, a portion of which may be refundable, in exchange for some form of long-term benefit, typically consisting of a right to receive certain personal or health care services. Some of the entrance fee communities are subject to significant state regulatory oversight, including, for example, oversight of each facility’s financial condition, establishment and monitoring of reserve requirements and other financial restrictions, the right of residents to cancel their contracts within a specified period of time, the right of residents to receive a refund of their entrance fees, lien rights in favor of the residents, restrictions on change of ownership, and similar matters.
Americans with Disabilities Act (“ADA”)
Our properties must comply with the ADA and any similar state or local laws to the extent that such properties are “public accommodations” as defined in those statutes. The ADA may require removal of barriers to access by persons with disabilities in certain public areas of our properties where such removal is readily achievable. To date, we have not received any notices of noncompliance with the ADA that have caused us to incur substantial capital expenditures to address ADA concerns. Should barriers to access by persons with disabilities be discovered at any of our properties, we may be directly or indirectly responsible for additional costs that may be required to make facilities ADA-compliant. Noncompliance with the ADA could result in the imposition of fines or an award of damages to private litigants. The obligation to make readily achievable accommodations pursuant to the ADA is an ongoing one, and we continue to assess our properties and make modifications as appropriate in this respect.
Environmental Matters
A wide variety of federal, state, and local environmental and occupational health and safety laws and regulations affect healthcare facility operations. These complex federal and state statutes, and their enforcement, involve a myriad of regulations, many of which involve strict liability on the part of the potential offender. Some of these federal and state statutes may directly impact us. Under various federal, state, and local environmental laws, ordinances, and regulations, an owner of real property or a secured lender, such as us, may be liable for the costs of removal or remediation of hazardous or toxic substances at, under or disposed of in connection with such property, as well as other potential costs relating to hazardous or toxic substances (including government fines and damages for injuries to persons and adjacent property). The cost of any required remediation, removal, fines or personal or property damages and any related liability therefore could exceed or impair the value of the property and/or the assets. In addition, the presence of such substances, or the failure to properly dispose of or remediate such substances, may adversely affect the value of such property and the owner’s ability to sell or rent such property or to borrow using such property as collateral which, in turn, could reduce our earnings. For a description of the risks associated with environmental matters, see “Item 1A, Risk Factors” in this report.
Insurance
We obtain various types of insurance to mitigate the impact of property, business interruption, liability, flood, windstorm, earthquake, fire, environmental, and terrorism-related losses. We attempt to obtain appropriate policy terms, conditions, limits, and deductibles considering the relative risk of loss, the cost of such coverage, and current industry practice. There are, however, certain types of extraordinary losses, such as those due to acts of war or other events that may be either uninsurable or not economically insurable. In addition, we have a large number of properties that are exposed to earthquake, flood, and windstorm occurrences which carry higher deductibles.
We maintain property insurance for all of our properties. Tenants under triple-net leases, primarily in our senior housing triple-net segment, are required to provide primary property, business interruption, and liability insurance. We maintain separate general and professional liability insurance for our SHOP facilities. Additionally, our corporate general liability insurance program also extends coverage for all of our properties beyond the aforementioned. We periodically review whether we or our RIDEA operators will bear responsibility for maintaining the required insurance coverage for the applicable SHOP properties, but the costs of such insurance are facility expenses paid from the revenues of those properties, regardless of who maintains the insurance.
We also maintain directors and officers liability insurance which provides protection for claims against our directors and officers arising from their responsibilities as directors and officers. Such insurance also extends to us in certain situations.
Sustainability
We believe that sustainability initiatives are a vital part of corporate responsibility, which supports our primary goal of increasing stockholder value through profitable growth. We continue to advance our commitment to sustainability, with a focus on achieving goals in each of the environmental, social, and governance (“ESG”) dimensions of sustainability.
Our environmental management programs strive to capture cost efficiencies that ultimately benefit our investors, tenants, operators, employees, and other stakeholders, while providing a positive impact on the communities in which we operate. Our social responsibility committee leads our local philanthropic and volunteer activities, and our transparent corporate governance initiatives incorporate sustainability as a critical component in achieving our business objectives and properly managing risks.
Our 2019 ESG and sustainability achievements include being recognized by the CDP 2019 Climate Change Program. We completed CDP’s annual investor survey, received a score of A- for our disclosure and were named to the Leadership Band for the seventh consecutive year. CDP collects and publishes the environmental data on behalf of more than 525 investors. We were also named a constituent in the FTSE4Good Index and achieved the Green Star designation from the Global Real Estate Sustainability Benchmark (GRESB) for the eighth consecutive year. We were named a constituent in the North America Dow Jones Sustainability Index (“DJSI”) for the seventh consecutive year. The list is compiled according to the results of RobecoSAM’s annual Corporate Sustainability Assessment, which also determines constituency for the DJSI series. In addition, we were named to the Bloomberg Gender-Equality Index, Investors’ Business Daily’s Top 50 ESG Companies list, and Corporate Responsibility Magazine’s 100 Best Corporate Citizens list. We also won Ethical Boardroom’s Corporate Governance Award for North American REITs and NAREIT’s Diversity and Inclusion Recognition Award. For additional information regarding our ESG initiatives and our approach to climate change, please visit our website at www.healthpeak.com/corporate-responsibility.
Available Information
Our website address is www.healthpeak.com. Our Annual Reports on Form 10-K, Quarterly Reports on Form 10-Q, Current Reports on Form 8-K and any amendments to those reports filed or furnished pursuant to Section 13(a) or 15(d) of the Exchange Act are available on our website, free of charge, as soon as reasonably practicable after we electronically file such materials with, or furnish them to, the U.S. Securities and Exchange Commission (“SEC”). Additionally, the SEC maintains a website that contains reports, proxy and information statements, and other information regarding issuers that file electronically with the SEC, including us, at www.sec.gov. References to our website throughout this Annual Report on Form 10-K are provided for convenience only and the content on our website does not constitute a part of this Annual Report on Form 10-K.
Item 1A. Risk Factors
The section below discusses the most significant risk factors that may materially adversely affect our business, results of operations and financial condition.
As set forth below, we believe that the risks we face generally fall into the following categories:
| • | risks related to our business and operations; |
| • | risks related to our capital structure and market conditions; |
| • | risks related to other events; and |
| • | risks related to tax, including REIT-related risks. |
Risks Related to Our Business and Operations
We assume operational risks with respect to our SHOP properties managed in RIDEA structures that could have a material adverse effect on our business, results of operations and financial condition.
RIDEA permits REITs, such as us, to own or partially own qualified healthcare properties in a structure through which we can participate directly in the cash flow of the properties’ operations (as compared to receiving only contractual rent payments under a triple-net lease) in compliance with REIT requirements. The criteria for operating a qualified healthcare property in a RIDEA structure requires us to lease the property to an affiliate TRS and for such affiliate TRS to engage an independent qualifying management company, or operator (also known as an eligible independent contractor) to manage and operate the day-to-day business of the property. The operator performs its services in exchange for a management fee. As a result, under a RIDEA structure, we are required to rely on our operator to manage and operate the property, including hiring and training all employees, entering into all third-party contracts for the benefit of the property, including resident/patient agreements, complying with laws, including but not limited to healthcare laws, and providing resident care.
We have limited rights to direct or influence the business or operations of these properties. However, as the owner of the property under a RIDEA structure, our TRS, and hence we, are ultimately responsible for all operational risks and other liabilities of the property, other than those arising out of certain actions by our operator, such as gross negligence or willful misconduct. Operational risks include, and our resulting revenues therefore depend on, among other things: (i) occupancy rates; (ii) the entrance fees and rental rates charged to residents; (iii) Medicare and Medicaid reimbursement rates, to the extent applicable; (iv) our operators’ reputations and ability to attract and retain residents; (v) general economic conditions and market factors that impact seniors; (vi) competition from other senior housing providers; (vii) compliance with federal, state, local and industry-regulated licensure, certification and inspection laws, regulations and standards; (viii) litigation involving our properties or residents/patients; (ix) the availability and cost of general and professional liability insurance coverage; and (x) the ability to control operating expenses. Although we are permitted under a RIDEA structure to have certain general oversight approval rights (e.g., budgets, material contracts, etc.) and the right to review operational and financial reporting information, our operators are ultimately in control of the day-to-day business of the property. As a result, we have limited rights to direct or influence the business or operations of our properties in the SHOP segment and we depend on our operators to operate these properties in a manner that complies with applicable law, minimizes legal risk and maximizes the value of our investment. The failure by our operators to adequately manage these risks could have a material adverse effect on our business, results of operations and financial condition.
When we use a RIDEA structure, our TRS is generally required to be the holder of the applicable healthcare license and is the entity that is enrolled in government healthcare programs (e.g., Medicare, Medicaid), where applicable. As the holder of a healthcare license, our TRS and we (through our ownership interest in our TRS) are subject to various regulatory laws. Most states regulate and inspect healthcare property operations, patient care, construction and the safety of the physical environment. However, we are required under RIDEA to rely on our operators to oversee and direct these aspects of the properties’ operations to ensure compliance with these applicable laws and regulations. If one or more of our healthcare properties fails to comply with applicable laws, our TRS would be responsible (except in limited circumstances, such as the gross negligence or willful misconduct of our operators, where we would have a contractual claim against them), which could subject our TRS to penalties including loss or suspension of licenses and certificates of need, certification or accreditation, exclusion from government healthcare programs (i.e., Medicare, Medicaid), administrative sanctions and civil monetary penalties. Some states also reserve the right to sanction affiliates of a licensee when they take administrative action against the licensee. Additionally, when we receive individually identifiable health information relating to residents of our healthcare properties, we are subject to federal and state data privacy and security laws and rules, and could be subject to liability in the event of an audit, complaint, cybersecurity attack or data breach. Furthermore, our TRS has exposure to professional liability claims that could arise out of resident claims, such as quality of care, and the associated litigation costs.
Rents received from the TRS in a RIDEA structure are treated as qualifying rents from real property for REIT tax purposes only if (i) they are paid pursuant to a lease of a “qualified healthcare property” and (ii) the operator qualifies as an “eligible independent contractor,” as defined in the Internal Revenue Code of 1986, as amended (the “Code”). If either of these requirements are not satisfied, then the rents will not be qualifying rents.
Decreases in our tenants’, operators’ or borrowers’ revenues, or increases in their expenses, could affect their ability to meet their financial and other contractual obligations to us.
Our leases consist of triple-net leases, in which we lease our properties directly to tenants and operators, as well as RIDEA leases, in which we lease our properties to an affiliate TRS that enters into a management agreement with an eligible independent contractor, or operator, to manage and oversee the day-to-day business and operations of the properties. We are also a direct or indirect lender to various tenants and operators and separately provide loans to certain third parties. We have very limited control over the success or failure of our tenants’, operators’ and borrowers’ businesses, regardless of the structure of our relationship with them. Any of our triple-net tenants or operators under a RIDEA structure may experience a downturn in their business that materially weakens their financial condition. As a result, they may fail to make payments or perform their obligations when due. Although we generally have arrangements and other agreements that give us the right under specified circumstances to terminate a lease, evict a tenant or terminate our operator, or demand immediate repayment of outstanding loan amounts or other obligations to us, we may not be able to enforce such rights or we may determine not to do so if we believe that enforcement of our rights would be more detrimental to our business than seeking alternative approaches.
Our senior housing tenants and our SHOP segment under a RIDEA structure primarily depend on private sources for their revenues and the ability of their patients and residents to pay fees. Costs associated with independent and assisted living services are not genera
Showing the first 8K of 95K characters. Open the full section
Item 1B. Unresolved Staff Comments
None.
Item 2. Properties
We are organized to invest in income-producing healthcare-related facilities. In evaluating potential investments, we consider a multitude of factors, including:
| • | location, construction quality, age, condition, and design of the property; |
| • | geographic area, proximity to other healthcare facilities, type of property, and demographic profile, including new competitive supply; |
| • | whether the expected risk-adjusted return exceeds the incremental cost of capital; |
| • | whether the rent or operating income provides a competitive market return to our investors; |
| • | duration, rental rates, tenant and operator quality, and other attributes of in-place leases, including master lease structures and coverage; |
| • | current and anticipated cash flow and its adequacy to meet our operational needs; |
| • | availability of security such as letters of credit, security deposits and guarantees; |
| • | potential for capital appreciation; |
| • | expertise and reputation of the tenant or operator; |
| • | occupancy and demand for similar healthcare facilities in the same or nearby communities; |
| • | availability of qualified operators or property managers and whether we can manage the property; |
| • | potential alternative uses of the facilities; |
| • | the regulatory and reimbursement environment in which the properties operate; |
| • | tax laws related to REITs; |
| • | prospects for liquidity through financing or refinancing; and |
| • | our access to and cost of capital. |
Property and Direct Financing Lease Investments
The following table summarizes our consolidated property and direct financing lease ("DFL") investments as of and for the year ended December 31, 2019 (square feet and dollars in thousands):
| Facility Location | Number of Facilities | Capacity | Gross Asset Value**(1)** | Real Estate Revenues**(2)** | Operating Expenses | |||||||||||||
| Senior housing triple-net—real estate: | (Units) | |||||||||||||||||
| Florida | 11 | 1,418 | $ | 209,109 | $ | 24,594 | $ | — | ||||||||||
| Texas | 13 | 1,323 | 181,729 | 19,610 | — | |||||||||||||
| California | 11 | 1,023 | 161,785 | 21,481 | (3,183 | ) | ||||||||||||
| Oregon | 10 | 954 | 73,488 | 12,542 | (121 | ) | ||||||||||||
| Washington | 8 | 562 | 98,167 | 11,336 | (95 | ) | ||||||||||||
| Other (17 States) | 37 | 3,343 | 244,049 | 87,918 | (1,123 | ) | ||||||||||||
| 90 | 8,623 | 968,327 | 177,481 | (4,522 | ) | |||||||||||||
| Senior housing—DFLs*(3)**:* | ||||||||||||||||||
| Other (12 States) | — | — | — | 21,960 | (43 | ) | ||||||||||||
| Total senior housing triple-net | 90 | 8,623 | $ | 968,327 | $ | 199,441 | $ | (4,565 | ) | |||||||||
| SHOP: | (Units) | |||||||||||||||||
| California | 17 | 1,781 | $ | 701,938 | $ | 90,339 | $ | (67,559 | ) | |||||||||
| Florida | 22 | 2,696 | 554,188 | 117,753 | (100,904 | ) | ||||||||||||
| Virginia | 10 | 1,319 | 290,313 | 34,901 | (26,324 | ) | ||||||||||||
| New Jersey | 8 | 825 | 216,576 | 50,672 | (37,249 | ) | ||||||||||||
| Maryland | 9 | 853 | 155,345 | 53,097 | (42,842 | ) | ||||||||||||
| Texas | 8 | 1,132 | 159,755 | 130,773 | (92,266 | ) | ||||||||||||
| Other (19 States) | 41 | 4,570 | 648,990 | 247,636 | (198,569 | ) | ||||||||||||
| Total SHOP | 115 | 13,176 | $ | 2,727,105 | $ | 725,171 | $ | (565,713 | ) |
| Facility Location | Number of Facilities | Capacity | Gross Asset Value**(1)** | Real Estate Revenues**(2)** | Operating Expenses | |||||||||||||
| Life science: | (Sq. Ft.) | |||||||||||||||||
| California | 118 | 6,836 | $ | 4,439,853 | $ | 382,986 | $ | (90,496 | ) | |||||||||
| Other (3 States) | 16 | 1,439 | 1,086,917 | 57,798 | (16,976 | ) | ||||||||||||
| Total life science | 134 | 8,275 | $ | 5,526,770 | $ | 440,784 | $ | (107,472 | ) | |||||||||
| Medical office: | (Sq. Ft.) | |||||||||||||||||
| Texas | 66 | 7,123 | $ | 1,278,337 | $ | 182,228 | $ | (65,412 | ) | |||||||||
| California | 18 | 1,011 | 357,815 | 41,295 | (12,881 | ) | ||||||||||||
| South Carolina | 17 | 1,046 | 336,193 | 24,269 | (4,648 | ) | ||||||||||||
| Pennsylvania | 4 | 1,058 | 336,121 | 28,159 | (13,325 | ) | ||||||||||||
| Colorado | 17 | 1,231 | 269,429 | 40,780 | (16,138 | ) | ||||||||||||
| Other (28 States) | 145 | 9,243 | 1,802,855 | 254,799 | (89,134 | ) | ||||||||||||
| Total medical office | 267 | 20,712 | $ | 4,380,750 | $ | 571,530 | $ | (201,538 | ) | |||||||||
| Other—Hospital*(4)**:* | (Beds) | |||||||||||||||||
| California | 1 | 84 | $ | 88,800 | $ | 13,845 | $ | (1 | ) | |||||||||
| Texas | 3 | 212 | 55,719 | 6,790 | (73 | ) | ||||||||||||
| Other (6 States) | 7 | 946 | 142,110 | 29,006 | (8 | ) | ||||||||||||
| 11 | 1,242 | $ | 286,629 | $ | 49,641 | $ | (82 | ) | ||||||||||
| Other—SNF*(5)**:* | (Beds) | |||||||||||||||||
| Virginia | — | — | — | 972 | — | |||||||||||||
| Total other non-reportable segments | 11 | 1,242 | $ | 286,629 | $ | 50,613 | $ | (82 | ) | |||||||||
| Total properties | 617 | $ | 13,889,581 | $ | 1,987,539 | $ | (879,370 | ) |
_______________________________________
| (1) | Represents gross real estate and the carrying value of DFLs. Gross real estate represents the carrying amount of real estate after adding back accumulated depreciation and amortization. Excludes real estate held for sale with an aggregate gross asset value of $719 million. |
| (2) | Represent the combined amount of rental and related revenues, resident fees and services, and income from DFLs. |
| (3) | Represents income from DFLs that were transitioned or sold in 2019. |
| (4) | Includes leased properties that are classified as DFLs. |
| (5) | Represents revenues generated from a real estate asset that was sold in October 2019. |
Occupancy and Annual Rent Trends
The following table summarizes occupancy and average annual rent trends for our consolidated property and DFL investments for the years ended December 31 (average occupied square feet in thousands):
| 2019 | 2018 | 2017 | 2016 | 2015 | |||||||||||||||
| Senior housing triple-net: | |||||||||||||||||||
| Average annual rent per unit(1) | $ | 17,373 | $ | 16,449 | $ | 15,352 | $ | 14,604 | $ | 14,544 | |||||||||
| Average capacity (available units) | 11,565 | 16,914 | 21,536 | 28,455 | 28,777 | ||||||||||||||
| SHOP: | |||||||||||||||||||
| Average occupancy percentage | 83 | % | 85 | % | 87 | % | 88 | % | 87 | % | |||||||||
| Average annual rent per unit(1) | $ | 49,784 | $ | 48,433 | $ | 41,133 | $ | 42,851 | $ | 41,435 | |||||||||
| Average capacity (available units) | 14,633 | 11,248 | 12,758 | 16,028 | 12,704 | ||||||||||||||
| Life science: | |||||||||||||||||||
| Average occupancy percentage | 97 | % | 95 | % | 96 | % | 98 | % | 97 | % | |||||||||
| Average annual rent per square foot(1) | $ | 57 | $ | 54 | $ | 52 | $ | 48 | $ | 46 | |||||||||
| Average occupied square feet | 7,288 | 7,078 | 6,841 | 7,332 | 7,179 | ||||||||||||||
| Medical office: | |||||||||||||||||||
| Average occupancy percentage | 92 | % | 93 | % | 92 | % | 92 | % | 92 | % | |||||||||
| Average annual rent per square foot(1) | $ | 29 | $ | 29 | $ | 28 | $ | 28 | $ | 28 | |||||||||
| Average occupied square feet | 19,069 | 18,655 | 17,950 | 16,973 | 15,844 | ||||||||||||||
| Other non-reportable segments: | |||||||||||||||||||
| Average annual rent per bed - Hospital(1) | $ | 39,113 | $ | 39,246 | $ | 38,017 | $ | 39,076 | $ | 39,834 | |||||||||
| Average capacity (available beds) - Hospital | 1,304 | 1,300 | 1,337 | 1,478 | 1,487 | ||||||||||||||
| Average annual rent per unit - U.K.(1)(2) | — | — | 9,097 | 9,200 | 10,048 | ||||||||||||||
| Average capacity (available units) - U.K.(2) | — | — | 3,188 | 3,190 | 2,515 | ||||||||||||||
| Average annual rent per bed - SNF(1) | — | 10,504 | 10,298 | 10,803 | 8,292 | ||||||||||||||
| Average capacity (available beds) - SNF | — | 120 | 120 | 426 | 1,047 |
_______________________________________
| (1) | Average annual rent is presented as a ratio of real estate revenues (comprised of rental and related revenues, resident fees and services, and income from DFLs) divided by the average capacity or average occupied square feet of the facilities. Average annual rent for leased properties (including DFLs) excludes termination fees and non-cash revenue adjustments (i.e., straight-line rents, amortization of market lease intangibles, DFL non-cash interest, and the impact of deferred community fee income). |
| (2) | Our previous investments in the U.K. were deconsolidated in June 2018. We then sold our remaining unconsolidated investments in the U.K. in December 2019 (see Note 4 to the Consolidated Financial Statements). |
Tenant Lease Expirations
The following table shows tenant lease expirations, including those related to DFLs, for the next 10 years and thereafter at our consolidated properties, assuming that none of the tenants exercise any of their renewal or purchase options, unless otherwise noted below, and excludes properties in our SHOP segment and assets held for sale as of and for the year ended December 31, 2019 (dollars and square feet in thousands):
| Expiration Year | ||||||||||||||||||||||||||||||||||||||||||||||||
| Segment | Total | 2020**(1)** | 2021 | 2022 | 2023 | 2024 | 2025 | 2026 | 2027 | 2028 | 2029 | Thereafter | ||||||||||||||||||||||||||||||||||||
| Senior housing triple-net: | ||||||||||||||||||||||||||||||||||||||||||||||||
| Properties | 63 | 5 | 3 | — | 8 | 1 | 1 | 6 | 1 | 11 | 7 | 20 | ||||||||||||||||||||||||||||||||||||
| Base rent(2) | $ | 102,946 | $ | 7,684 | $ | 1,861 | $ | — | $ | 20,047 | $ | 1,533 | $ | 1,932 | $ | 4,397 | $ | 5,377 | $ | 16,941 | $ | 6,994 | $ | 36,180 | ||||||||||||||||||||||||
| % of segment base rent | 100 | 7 | 2 | — | 19 | 1 | 2 | 4 | 5 | 16 | 7 | 37 | ||||||||||||||||||||||||||||||||||||
| Life science*:* | ||||||||||||||||||||||||||||||||||||||||||||||||
| Square feet | 7,940 | 520 | 530 | 761 | 768 | 476 | 1,190 | 524 | 781 | 460 | 1,110 | 820 | ||||||||||||||||||||||||||||||||||||
| Base rent(2) | $ | 372,783 | $ | 22,230 | $ | 29,177 | $ | 31,751 | $ | 44,557 | $ | 28,217 | $ | 49,707 | $ | 24,574 | $ | 38,770 | $ | 21,498 | $ | 58,171 | $ | 24,131 | ||||||||||||||||||||||||
| % of segment base rent | 100 | 6 | 8 | 9 | 12 | 8 | 13 | 7 | 10 | 6 | 16 | 5 | ||||||||||||||||||||||||||||||||||||
| Medical office: | ||||||||||||||||||||||||||||||||||||||||||||||||
| Square feet | 18,967 | 3,040 | 2,079 | 2,132 | 1,615 | 1,543 | 3,510 | 935 | 629 | 1,544 | 524 | 1,416 | ||||||||||||||||||||||||||||||||||||
| Base rent(2) | $ | 451,725 | $ | 81,276 | $ | 54,448 | $ | 54,672 | $ | 42,534 | $ | 43,023 | $ | 62,066 | $ | 24,317 | $ | 15,444 | $ | 32,097 | $ | 12,746 | $ | 29,102 | ||||||||||||||||||||||||
| % of segment base rent | 100 | 18 | 12 | 12 | 9 | 10 | 14 | 5 | 3 | 7 | 3 | 7 | ||||||||||||||||||||||||||||||||||||
| Other non-reportable segments*:* | ||||||||||||||||||||||||||||||||||||||||||||||||
| Properties | 11 | 1 | — | 3 | — | 6 | — | — | — | — | — | 1 | ||||||||||||||||||||||||||||||||||||
| Base rent(2) | $ | 49,394 | $ | 8,301 | $ | — | $ | 12,374 | $ | — | $ | 23,260 | $ | — | $ | — | $ | — | $ | — | $ | — | $ | 5,459 | ||||||||||||||||||||||||
| % of segment base rent | 100 | 17 | — | 25 | — | 47 | — | — | — | — | — | 11 | ||||||||||||||||||||||||||||||||||||
| Total: | ||||||||||||||||||||||||||||||||||||||||||||||||
| Base rent(2) | $ | 976,848 | $ | 119,491 | $ | 85,486 | $ | 98,797 | $ | 107,138 | $ | 96,033 | $ | 113,705 | $ | 53,288 | $ | 59,591 | $ | 70,536 | $ | 77,911 | $ | 94,872 | ||||||||||||||||||||||||
| % of total base rent | 100 | 12 | 9 | 10 | 11 | 10 | 12 | 5 | 6 | 7 | 8 | 10 |
_______________________________________
| (1) | Includes month-to-month leases. |
| (2) | The most recent month’s (or subsequent month’s, if acquired in the most recent month) base rent, including additional rent floors and cash income from DFLs, annualized for 12 months. Base rent does not include tenant recoveries, additional rents in excess of floors, and non-cash revenue adjustments (i.e., straight-line rents, amortization of market lease intangibles, DFL non-cash interest and deferred revenues). |
See the “Tenant Purchase Options” section of Note 6 to the Consolidated Financial Statements for additional information on leases subject to purchase options. See Schedule III: Real Estate and Accumulated Depreciation, included in this report, which information is incorporated by reference in this Item 2.
Item 3. Legal Proceedings
Except as described below, we are not aware of any legal proceedings or claims that we believe could have, individually or taken together, a material adverse effect on our financial condition, results of operations, or cash flows.
See “Legal Proceedings” section of Note 11 to the Consolidated Financial Statements for information regarding legal proceedings, which information is incorporated by reference in this Item 3.
Item 4. Mine Safety Disclosures
None.
PART II
Item 5. Market for Registrant’s Common Equity, Related Stockholder Matters and Issuer Purchases of Equity Securities
Our common stock is listed on the New York Stock Exchange under the symbol “PEAK.”
At January 31, 2020, we had 8,504 stockholders of record, and there were 200,205 beneficial holders of our common stock.
Dividends (Distributions)
It has been our policy to declare quarterly dividends to common stockholders so as to comply with applicable provisions of the Code governing REITs. All distributions are made at the discretion of our Board of Directors in accordance with Maryland law. Distributions with respect to our common stock can be characterized for federal income tax purposes as ordinary dividends, capital gains, nondividend distributions or a combination thereof. The following table shows the characterization of our annual common stock distributions per share:
| Year Ended December 31, | |||||||||||
| 2019 | 2018 | 2017 | |||||||||
| Ordinary dividends(1) | $ | 0.7633 | $ | 0.9578 | $ | 1.4800 | |||||
| Capital gains | 0.2714 | 0.5222 | — | ||||||||
| Nondividend distributions | 0.4453 | — | — | ||||||||
| $ | 1.4800 | $ | 1.4800 | $ | 1.4800 |
_______________________________________
| (1) | For the year ended December 31, 2019 all $0.7633 of ordinary dividends qualified as business income for purposes of Code Section 199A. For the year ended December 31, 2018 the amount includes $0.9414 of qualified business income for purposes of Code Section 199A and $0.0164 of qualified dividend income for purposes of Code Section 1(h)(11). |
On January 30, 2020, we announced that our Board of Directors declared a quarterly common stock cash dividend of $0.37 per share. The common stock dividend will be paid on February 28, 2020 to stockholders of record as of the close of business on February 18, 2020.
Issuer Purchases of Equity Securities
The table below sets forth the information with respect to purchases of our common stock made by or on our behalf during the quarter ended December 31, 2019.
| Period Covered | Total Number of Shares Purchased**(1)** | Average Price Paid per Share | Total Number of Shares Purchased as Part of Publicly Announced Plans or Programs | Maximum Number (or Approximate Dollar Value) of Shares that May Yet be Purchased Under the Plans or Programs | |||||||||
| October 1-31, 2019 | 682 | $ | 35.88 | — | — | ||||||||
| November 1-30, 2019 | 2,452 | 35.78 | — | — | |||||||||
| December 1-31, 2019 | — | — | — | — | |||||||||
| Total | 3,134 | $ | 35.80 | — | — |
_______________________________________
| (1) | Represents restricted shares withheld under our equity incentive plans to offset tax withholding obligations that occur upon vesting of restricted shares. The value of the shares withheld is based on the closing price of our common stock on the last trading day prior to the date the relevant transaction occurred. |
Performance Graph
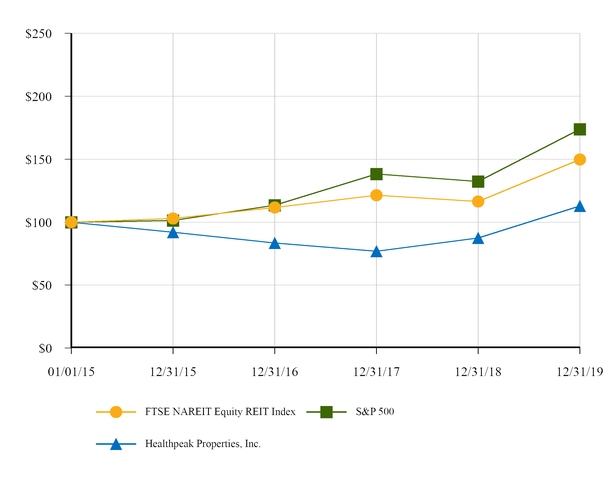
The graph and table below compare the cumulative total return of Healthpeak, the S&P 500 Index and the Equity REIT Index of NAREIT, from January 1, 2015 to December 31, 2019. Total cumulative return is based on a $100 investment in Healthpeak common stock and in each of the indices at the close of trading on December 31, 2014 and assumes quarterly reinvestment of dividends before consideration of income taxes. Stockholder returns over the indicated periods should not be considered indicative of future stock prices or stockholder returns.
COMPARISON OF FIVE-YEAR CUMULATIVE TOTAL RETURN
AMONG S&P 500, EQUITY REITS AND HEALTHPEAK PROPERTIES, INC.
RATE OF RETURN TREND COMPARISON
**JANUARY 1, 2015–**DECEMBER 31, 2019
(JANUARY 1, 2015 = $100)
Performance Graph Total Stockholder Return
| December 31, | |||||||||||||||||||
| 2015 | 2016 | 2017 | 2018 | 2019 | |||||||||||||||
| FTSE NAREIT Equity REIT Index | $ | 102.83 | $ | 111.70 | $ | 121.39 | $ | 116.48 | $ | 149.86 | |||||||||
| S&P 500 | 101.37 | 113.49 | 138.26 | 132.19 | 173.80 | ||||||||||||||
| Healthpeak Properties, Inc. | 91.96 | 83.34 | 76.89 | 87.41 | 112.85 |
Item 6. Selected Financial Data
Set forth below is our selected financial data as of and for each of the years in the five-year period ended December 31 (dollars in thousands, except per share data):
| Year Ended December 31, | |||||||||||||||||||
| 2019 | 2018 | 2017 | 2016 | 2015 | |||||||||||||||
| Statement of operations data: | |||||||||||||||||||
| Total revenues | $ | 1,997,383 | $ | 1,846,689 | $ | 1,848,378 | $ | 2,129,294 | $ | 1,940,489 | |||||||||
| Income (loss) from continuing operations | 60,061 | 1,073,474 | 422,634 | 374,171 | 152,668 | ||||||||||||||
| Net income (loss) applicable to common shares | 43,987 | 1,058,424 | 413,013 | 626,549 | (560,552 | ) | |||||||||||||
| Basic earnings per common share: | |||||||||||||||||||
| Continuing operations | 0.09 | 2.25 | 0.88 | 0.77 | 0.30 | ||||||||||||||
| Discontinued operations | — | — | — | 0.57 | (1.51 | ) | |||||||||||||
| Net income (loss) applicable to common shares | 0.09 | 2.25 | 0.88 | 1.34 | (1.21 | ) | |||||||||||||
| Diluted earnings per common share: | |||||||||||||||||||
| Continuing operations | 0.09 | 2.24 | 0.88 | 0.77 | 0.30 | ||||||||||||||
| Discontinued operations | — | — | — | 0.57 | (1.51 | ) | |||||||||||||
| Net income (loss) applicable to common shares | 0.09 | 2.24 | 0.88 | 1.34 | (1.21 | ) | |||||||||||||
| Balance sheet data: | |||||||||||||||||||
| Total assets | 14,032,891 | 12,718,553 | 14,088,461 | 15,759,265 | 21,449,849 | ||||||||||||||
| Debt obligations(1) | 6,351,613 | 5,567,908 | 7,880,466 | 9,189,495 | 11,069,003 | ||||||||||||||
| Total equity | 6,667,474 | 6,512,591 | 5,594,938 | 5,941,308 | 9,746,317 | ||||||||||||||
| Other data: | |||||||||||||||||||
| Dividends paid | 720,123 | 696,913 | 694,955 | 979,542 | 1,046,638 | ||||||||||||||
| Dividends paid per common share(2) | 1.480 | 1.480 | 1.480 | 2.095 | 2.260 | ||||||||||||||
| Funds from operations (“NAREIT FFO”)(3) | 780,307 | 780,189 | 661,113 | 1,119,153 | (10,841 | ) | |||||||||||||
| Diluted NAREIT FFO per common share(3) | 1.59 | 1.66 | 1.41 | 2.39 | (0.02 | ) | |||||||||||||
| FFO as Adjusted(3) | 864,352 | 857,233 | 918,402 | 1,282,390 | 1,470,167 | ||||||||||||||
| Diluted FFO as Adjusted per common share(3) | 1.76 | 1.82 | 1.95 | 2.74 | 3.16 | ||||||||||||||
| Funds available for distribution (“FAD”)(3) | 745,820 | 746,397 | 803,720 | 1,215,696 | 1,261,849 |
_______________________________________
| (1) | Includes bank line of credit, commercial paper, term loans, senior unsecured notes, mortgage debt and other debt. Excludes mortgage debt on assets held for sale. |
| (2) | Represents cash dividends. Additionally, in October 2016 we issued $6.17 per common share of stock dividends related to the spin-off of Quality Care Properties, Inc. |
| (3) | For a more detailed discussion and reconciliation of NAREIT FFO, FFO as Adjusted and FAD, see "Results of Operations" and “Non-GAAP Financial Measure Reconciliations” in Item 7 of this report. |
Item 7. Management’s Discussion and Analysis of Financial Condition and Results of Operations
The information set forth in this Item 7 is intended to provide readers with an understanding of our financial condition, changes in financial condition and results of operations. We will discuss and provide our analysis in the following order:
| • | 2019 Transaction Overview |
| • | Dividends |
| • | Results of Operations |
| • | Liquidity and Capital Resources |
| • | Contractual Obligations |
| • | Off-Balance Sheet Arrangements |
| • | Inflation |
| • | Non-GAAP Financial Measure Reconciliations |
| • | Critical Accounting Policies |
| • | Recent Accounting Pronouncements |
2019 Transaction Overview
Master Transaction and Cooperation Agreement with Brookdale
In October 2019, Healthpeak and Brookdale Senior Living Inc. (“Brookdale”) entered into a Master Transactions and Cooperation Agreement (the “2019 MTCA”), which includes a series of transactions related to its jointly owned 15-campus continuing care retirement community (“CCRC”) portfolio (the “CCRC JV”) and the portfolio of 43 senior housing properties that Brookdale triple-net leases from us.
In connection with the 2019 MTCA, Healthpeak and Brookdale, and certain of their respective subsidiaries, agreed to the following related to the CCRC JV:
| • | Healthpeak, which owns a 49% interest in the CCRC JV, agreed to purchase Brookdale’s 51% interest in 13 of the 15 communities in the CCRC JV based on a valuation of $1.06 billion (the “CCRC Acquisition”); |
| • | The management agreements related to the CCRC Acquisition communities will be terminated, with management transitioned (under new management agreements) from Brookdale to Life Care Services LLC (“LCS”) simultaneous with closing the CCRC Acquisition; |
| • | We will pay a $100 million management termination fee to Brookdale upon closing the CCRC Acquisition; and |
| • | The remaining two CCRCs will be jointly marketed for sale to third parties. |
In addition, pursuant to the 2019 MTCA, Healthpeak and Brookdale agreed to the following transactions related to properties that Brookdale triple-net leases from us:
| • | Brookdale will acquire 18 of the properties (the “Brookdale Acquisition Assets”) from us for cash proceeds of $385 million; |
| • | We will terminate the triple-net lease related to one property and transition it to a RIDEA structure with LCS as the manager; |
| • | The remaining 24 properties will be restructured into a single master lease with 2.4% annual rent escalators and a maturity date of December 31, 2027 (the “2019 Amended Master Lease”); |
| • | A portion of annual rent (amount in excess of 6.5% of sales proceeds) related to 14 of the 18 Brookdale Acquisition Assets will be reallocated to the remaining properties under the 2019 Amended Master Lease; |
| • | Upon sale of the Brookdale Acquisition Assets, Brookdale will pay down $20 million of future rent under the 2019 Amended Master Lease; and |
| • | We will provide up to $35 million of capital investment in the 2019 Amended Master Lease properties over a five-year term, which will increase rent by 7% of the amount spent, per annum. |
With the exception of the capital investment to be made over the next five years and the sale of the two CCRCs to be marketed to third parties, each of the above transactions, including payment of the $100 million management termination fee, closed on January 31, 2020.
Discovery Portfolio Acquisition
| • | In April 2019, we acquired a portfolio of nine senior housing properties, with a total of 1,242 units, for $445 million. The properties are located across Florida, Georgia, and Texas and are operated by Discovery Senior Living, LLC. |
Oakmont Portfolio Acquisitions
| • | In May 2019, we acquired three newly-built, senior housing communities in California for $113 million. The portfolio is operated by Oakmont Senior Living LLC (“Oakmont”) and includes 132 assisted living units and 68 memory care units with an average occupancy of 96% at closing. |
| • | In July 2019, we acquired five additional senior housing communities in California for $284 million. The portfolio is operated by Oakmont and includes 430 units. The properties are located in the Los Angeles, San Jose, and San Francisco markets. |
Sierra Point Towers Acquisition
| • | In June 2019, we completed the acquisition of two life science buildings in South San Francisco, California adjacent to our The Shore at Sierra Point development, for $245 million. |
Hartwell Innovation Campus Acquisition
| • | In July 2019, we acquired a life science campus in the suburban Boston submarket of Lexington, Massachusetts, for $228 million. The 277,000 square foot campus, comprised of four buildings, is 100% leased to seven biopharmaceutical and medical diagnostics tenants. |
Cambridge Acquisitions
| • | In January and February 2019, we acquired a life science facility for $71 million and development rights at an adjacent undeveloped land parcel for consideration of up to $27 million. The existing facility and land parcel are located in Cambridge, Massachusetts. |
| • | In December 2019, we acquired one life science building, adjacent to our existing properties in Cambridge, Massachusetts, for $333 million. |
Sovereign Wealth Fund Senior Housing Joint Venture
| • | In December 2019, we formed a new joint venture with a sovereign wealth fund ("SWF SH JV") that owns 19 SHOP assets operated by Brookdale. We own 53.5% of the joint venture and contributed all 19 assets with a fair value of $790 million. The joint venture partner owns the other 46.5% and purchased its interest for cash of $367 million. |
United Kingdom Joint Venture
| • | In December 2019, we sold our remaining 49% interest in our United Kingdom investments (the “U.K. JV”) for proceeds of £70 million ($91 million), net of debt assumed. We no longer own any real estate in the United Kingdom. |
Other Real Estate and Loan Transactions
| • | In May 2019, we acquired one medical office building (“MOB”) in Kansas for $15 million. |
| • | In June 2019, we acquired the outstanding equity interests of, and began consolidating, a senior housing joint venture structure (which owned one senior housing facility), in which we previously held an unconsolidated equity investment, for $24 million. |
| • | In July 2019, we acquired a $16 million, Class A two-story building in the Sorrento Mesa submarket of San Diego. The 56,000 square foot property is located on our Directors Place life science campus and is adjacent to our future development site. |
| • | In September 2019, we sold 13 senior housing facilities under DFLs for $274 million. |
| • | During the year ended December 31, 2019, we transitioned 35 senior housing triple-net assets, including a 14-property DFL portfolio, to a RIDEA structure, with Sunrise Senior Living, LLC (“Sunrise”) as the operator. Those 35 assets generated revenue of $67 million during the year ended 2018. We expect to transition two additional senior housing triple-net assets to a RIDEA structure with Sunrise in 2020. |
| • | During the year ended December 31, 2019, we sold 18 SHOP assets for $181 million, 2 senior housing triple-net assets for $26 million, 10 MOBs for |
Showing the first 8K of 139K characters. Open the full section
Item 7A. Quantitative and Qualitative Disclosures About Market Risk
We are exposed to various market risks, including the potential loss arising from adverse changes in interest rates. We use derivative and other financial instruments in the normal course of business to mitigate interest rate. We do not use derivative financial instruments for speculative or trading purposes. Derivatives are recorded on the consolidated balance sheets at fair value (see Note 21 to the Consolidated Financial Statements).
To illustrate the effect of movements in the interest rate markets, we performed a market sensitivity analysis on our hedging instruments. We applied various basis point spreads to the underlying interest rate curves of the derivative portfolio in order to determine the change in fair value. Assuming a one percentage point change in the underlying interest rate curve, the estimated change in fair value of each of the underlying derivative instruments would not be material.
Interest Rate Risk
At December 31, 2019, our exposure to interest rate risk is primarily on our variable rate debt. At December 31, 2019, $42 million of our variable-rate debt was hedged by interest rate swap transactions. The interest rate swaps are designated as cash flow hedges, with the objective of managing the exposure to interest rate risk by converting the interest rates on our variable-rate debt to fixed interest rates.
Interest rate fluctuations will generally not affect our future earnings or cash flows on our fixed rate debt and assets until their maturity or earlier prepayment and refinancing. If interest rates have risen at the time we seek to refinance our fixed rate debt, whether at maturity or otherwise, our future earnings and cash flows could be adversely affected by additional borrowing costs. Conversely, lower interest rates at the time of refinancing may reduce our overall borrowing costs. However, interest rate changes will affect the fair value of our fixed rate instruments. At December 31, 2019, a one percentage point increase or decrease in interest rates would change the fair value of our fixed rate debt by approximately $365 million and $401 million, respectively, and would not materially impact earnings or cash flows. Additionally, a one percentage point increase or decrease in interest rates would change the fair value of our fixed rate debt investments by approximately $2 million and less than $7 million, respectively, and would not materially impact earnings or cash flows. Conversely, changes in interest rates on variable rate debt and investments would change our future earnings and cash flows, but not materially impact the fair value of those instruments. Assuming a one percentage point change in the interest rate related to our variable-rate debt and variable-rate investments, and assuming no other changes in the outstanding balance at December 31, 2019, our annual interest expense and interest income would increase by approximately $3 million and $1 million, respectively.
Market Risk
We have investments in marketable debt securities classified as held-to-maturity because we have the positive intent and ability to hold the securities to maturity. Held-to-maturity securities are recorded at amortized cost and adjusted for the amortization of premiums and discounts through maturity. We consider a variety of factors in evaluating an other-than-temporary decline in value, such as: the length of time and the extent to which the market value has been less than our current adjusted carrying value; the issuer’s financial condition, capital strength and near-term prospects; any recent events specific to that issuer and economic conditions of its industry; and our investment horizon in relationship to an anticipated near-term recovery in the market value, if any. At December 31, 2019, both the fair value and carrying value of marketable debt securities was $20 million.
Item 8. Financial Statements and Supplementary Data
Healthpeak Properties, Inc.
Index to Consolidated Financial Statements
REPORT OF INDEPENDENT REGISTERED PUBLIC ACCOUNTING FIRM
To the stockholders and the Board of Directors of Healthpeak Properties, Inc.
Opinion on the Financial Statements
We have audited the accompanying consolidated balance sheets of Healthpeak Properties, Inc. and subsidiaries (formerly HCP, Inc.) (the "Company") as of December 31, 2019 and 2018, the related consolidated statements of operations, comprehensive income (loss), equity, and cash flows, for each of the three years in the period ended December 31, 2019, and the related notes and the schedules listed in the Index at Item 15 (collectively referred to as the "financial statements"). In our opinion, the financial statements present fairly, in all material respects, the financial position of the Company as of December 31, 2019 and 2018, and the results of its operations and its cash flows for each of the three years in the period ended December 31, 2019, in conformity with accounting principles generally accepted in the United States of America.
We have also audited, in accordance with the standards of the Public Company Accounting Oversight Board (United States) (PCAOB), the Company's internal control over financial reporting as of December 31, 2019, based on criteria established in Internal Control - Integrated Framework (2013) issued by the Committee of Sponsoring Organizations of the Treadway Commission and our report dated February 12, 2020, expressed an unqualified opinion on the Company's internal control over financial reporting.
Change in Accounting Principle
As discussed in Note 2, Summary of Significant Accounting Policies-Recent Accounting Pronouncements, to the financial statements, the Company has changed its method of derecognizing real estate from partial sales effective January 1, 2018 due to the adoption of Accounting Standards Update No. 2017-05, Clarifying the Scope of Asset Derecognition Guidance and Accounting for Partial Sales of Nonfinancial Assets on a modified retrospective basis.
Basis for Opinion
These financial statements are the responsibility of the Company's management. Our responsibility is to express an opinion on the Company's financial statements based on our audits. We are a public accounting firm registered with the PCAOB and are required to be independent with respect to the Company in accordance with the U.S. federal securities laws and the applicable rules and regulations of the Securities and Exchange Commission and the PCAOB.
We conducted our audits in accordance with the standards of the PCAOB. Those standards require that we plan and perform the audit to obtain reasonable assurance about whether the financial statements are free of material misstatement, whether due to error or fraud. Our audits included performing procedures to assess the risks of material misstatement of the financial statements, whether due to error or fraud, and performing procedures that respond to those risks. Such procedures included examining, on a test basis, evidence regarding the amounts and disclosures in the financial statements. Our audits also included evaluating the accounting principles used and significant estimates made by management, as well as evaluating the overall presentation of the financial statements. We believe that our audits provide a reasonable basis for our opinion.
Critical Audit Matters
The critical audit matters communicated below are matters arising from the current-period audit of the financial statements that were communicated or required to be communicated to the audit committee and that (1) relate to accounts or disclosures that are material to the financial statements and (2) involved our especially challenging, subjective, or complex judgments. The communication of critical audit matters does not alter in any way our opinion on the financial statements, taken as a whole, and we are not, by communicating the critical audit matters below, providing separate opinions on the critical audit matters or on the accounts or disclosures to which they relate.
Master Transactions and Cooperation Agreement with Brookdale - Refer to Notes 2, 3, 8, and 18 to the financial statements
Critical Audit Matter Description
The Company consolidates investments in variable interest entities (“VIEs”) when the Company is the primary beneficiary of the VIE. The Company makes judgments about which entities are VIEs, and continually assesses whether events have occurred that require management to reconsider the initial determination of whether an entity is a VIE. Additionally, the Company makes judgments regarding the level of influence or control over the VIE in determining the primary beneficiary, an evaluation performed continuously.
In October 2019, the Company and Brookdale Senior Living Inc. (“Brookdale”) entered into a Master Transactions and Cooperation Agreement (the “2019 MTCA”), which includes a series of transactions, including that related to its jointly owned 15-campus continuing care retirement community portfolio (the “CCRC JV”). In connection with the 2019 MTCA, the Company, which owned a 49% interest in the CCRC JV, agreed to purchase Brookdale’s 51% interest in 13 of the 15 communities in the CCRC JV. The Company completed the acquisition of the 13 communities in the CCRC JV simultaneously with other transactions that were part of the 2019 MTCA on January 31, 2020. Determining that the Company would not consolidate the 13 communities in the CCRC JV upon entering into the 2019 MTCA in the fourth quarter of 2019 required significant judgment by management.
The determination of whether the Company should consolidate the CCRC JV requires a continuous assessment, and specific transactions or events that affect whether the Company holds a controlling financial interest requires significant judgement. Given the judgments necessary to evaluate whether entering into the 2019 MTCA during the fourth quarter of 2019 changed the Company’s previous primary beneficiary and consolidation conclusions, performing audit procedures to evaluate the accounting for these transactions upon execution of the 2019 MTCA involved especially complex and subjective auditor judgment.
How the Critical Audit Matter Was Addressed in the Audit
Our audit procedures related to the Company’s accounting determination upon signing the 2019 MTCA to acquire the 13 communities in the CCRC JV included the following, among others:
| • | We tested the effectiveness of the controls in place to identify transactions requiring evaluation and assessed the application of the consolidation principles of the real estate ventures based on accounting principles generally accepted in the United States. |
Showing the first 8K of 371K characters. Open the full section
Item 9. Changes in and Disagreements with Accountants on Accounting and Financial Disclosure
None.
Item 9A. Controls and Procedures
Disclosure Controls and Procedures. We maintain disclosure controls and procedures that are designed to ensure that information required to be disclosed in our reports under the Exchange Act is recorded, processed, summarized and reported within the time periods specified in the SEC’s rules and forms and that such information is accumulated and communicated to our management, including our Principal Executive Officer and Principal Financial Officer, to allow for timely decisions regarding required disclosure. In designing and evaluating the disclosure controls and procedures, management recognizes that any controls and procedures, no matter how well designed and operated, can provide only reasonable assurance of achieving the desired control objectives, and management is required to apply its judgment in evaluating the cost-benefit relationship of possible controls and procedures.
As required by Rules 13a-15(b) and 15d-15(b) of the Exchange Act, we carried out an evaluation, under the supervision and with the participation of our management, including our Principal Executive Officer and Principal Financial Officer, of the effectiveness of the design and operation of our disclosure controls and procedures as of December 31, 2019. Based upon that evaluation, our Principal Executive Officer and Principal Financial Officer concluded that our disclosure controls and procedures were effective, as of December 31, 2019, at the reasonable assurance level.
Management’s Annual Report on Internal Control over Financial Reporting. Management is responsible for establishing and maintaining adequate internal control over financial reporting, as such term is defined in Exchange Act Rules 13a-15(f) and 15d-15(f). Under the supervision and with the participation of our management, including our Principal Executive Officer and Principal Financial Officer, we conducted an evaluation of the effectiveness of our internal control over financial reporting based on the framework in Internal Control—Integrated Framework (2013) issued by the Committee of Sponsoring Organizations of the Treadway Commission. Based on our evaluation under the framework in Internal Control—Integrated Framework (2013), our management concluded that our internal control over financial reporting was effective as of December 31, 2019.
The effectiveness of our internal control over financial reporting as of December 31, 2019 has been audited by Deloitte & Touche LLP, an independent registered public accounting firm, as stated in their report, which is included herein.
Changes in Internal Control Over Financial Reporting. There were no changes in our internal control over financial reporting (as such term is defined in Rules 13a-15(f) and 15d-15(f) under the Exchange Act) during the fourth quarter of 2019 that have materially affected, or are reasonably likely to materially affect, our internal control over financial reporting.
REPORT OF INDEPENDENT REGISTERED PUBLIC ACCOUNTING FIRM
To the stockholders and the Board of Directors of Healthpeak Properties, Inc.
Opinion on Internal Control over Financial Reporting
We have audited the internal control over financial reporting of Healthpeak Properties, Inc. and subsidiaries (formerly HCP, Inc.) (the “Company”) as of December 31, 2019, based on criteria established in Internal Control - Integrated Framework (2013) issued by the Committee of Sponsoring Organizations of the Treadway Commission (“COSO”). In our opinion, the Company maintained, in all material respects, effective internal control over financial reporting as of December 31, 2019, based on criteria established in Internal Control - Integrated Framework (2013) issued by COSO.
We have also audited, in accordance with the standards of the Public Company Accounting Oversight Board (United States) (PCAOB), the consolidated financial statements as of and for the year ended December 31, 2019, of the Company and our report dated February 12, 2020, expressed an unqualified opinion on those financial statements and included an explanatory paragraph regarding the Company’s adoption of Accounting Standards Update 2017-05*.*
Basis for Opinion
The Company’s management is responsible for maintaining effective internal control over financial reporting and for its assessment of the effectiveness of internal control over financial reporting, included in the accompanying Management’s Annual Report on Internal Control over Financial Reporting. Our responsibility is to express an opinion on the Company’s internal control over financial reporting based on our audit. We are a public accounting firm registered with the PCAOB and are required to be independent with respect to the Company in accordance with the U.S. federal securities laws and the applicable rules and regulations of the Securities and Exchange Commission and the PCAOB.
We conducted our audit in accordance with the standards of the PCAOB. Those standards require that we plan and perform the audit to obtain reasonable assurance about whether effective internal control over financial reporting was maintained in all material respects. Our audit included obtaining an understanding of internal control over financial reporting, assessing the risk that a material weakness exists, testing and evaluating the design and operating effectiveness of internal control based on the assessed risk, and performing such other procedures as we considered necessary in the circumstances. We believe that our audit provides a reasonable basis for our opinion.
Definition and Limitations of Internal Control over Financial Reporting
A company’s internal control over financial reporting is a process designed to provide reasonable assurance regarding the reliability of financial reporting and the preparation of financial statements for external purposes in accordance with generally accepted accounting principles. A company’s internal control over financial reporting includes those policies and procedures that (1) pertain to the maintenance of records that, in reasonable detail, accurately and fairly reflect the transactions and dispositions of the assets of the company; (2) provide reasonable assurance that transactions are recorded as necessary to permit preparation of financial statements in accordance with generally accepted accounting principles, and that receipts and expenditures of the company are being made only in accordance with authorizations of management and directors of the company; and (3) provide reasonable assurance regarding prevention or timely detection of unauthorized acquisition, use, or disposition of the company’s assets that could have a material effect on the financial statements.
Because of its inherent limitations, internal control over financial reporting may not prevent or detect misstatements. Also, projections of any evaluation of effectiveness to future periods are subject to the risk that controls may become inadequate because of changes in conditions, or that the degree of compliance with the policies or procedures may deteriorate.
| /s/ DELOITTE & TOUCHE LLP |
Los Angeles, California
February 12, 2020
Item 9B. Other Information
None.
PART III
Item 10. Directors, Executive Officers and Corporate Governance
We have adopted a Code of Business Conduct and Ethics that applies to all of our directors and employees, including our Chief Executive Officer and all senior financial officers, including our principal financial officer, principal accounting officer and controller. We have also adopted a Vendor Code of Business Conduct and Ethics applicable to our vendors and business partners. Current copies of our Code of Business Conduct and Ethics and Vendor Code of Business Conduct and Ethics are posted on our website at www.healthpeak.com/corporate-responsibility/governance. In addition, waivers from, and amendments to, our Code of Business Conduct and Ethics that apply to our directors and executive officers, including our principal executive officer, principal financial officer, principal accounting officer, or persons performing similar functions, will be timely posted in the Investor Relations section of our website at www.healthpeak.com.
We hereby incorporate by reference the information appearing under the captions “Proposal No. 1 Election of Directors,” “Our Executive Officers,” “Board of Directors and Corporate Governance” and in our definitive proxy statement relating to our 2020 Annual Meeting of Stockholders to be held on April 23, 2020.
Item 11. Executive Compensation
We hereby incorporate by reference the information under the caption “Executive Compensation” in our definitive proxy statement relating to our 2020 Annual Meeting of Stockholders to be held on April 23, 2020.
Item 12. Security Ownership of Certain Beneficial Owners and Management and Related Stockholder Matters
We hereby incorporate by reference the information under the captions “Security Ownership of Principal Stockholders, Directors and Management” and “Equity Compensation Plan Information” in our definitive proxy statement relating to our 2020 Annual Meeting of Stockholders to be held on April 23, 2020.
Item 13. Certain Relationships and Related Transactions, and Director Independence
We hereby incorporate by reference the information under the caption “Board of Directors and Corporate Governance” in our definitive proxy statement relating to our 2020 Annual Meeting of Stockholders to be held on April 23, 2020.
Item 14. Principal Accounting Fees and Services
We hereby incorporate by reference under the caption “Audit and Non-Audit Fees” in our definitive proxy statement relating to our 2020 Annual Meeting of Stockholders to be held on April 23, 2020.
PART IV
Item 15. Exhibits, Financial Statement Schedules
(a) 1. Financial Statement Schedules
The following Consolidated Financial Statements are included in Part II, Item 8-Financial Statements and Supplementary Data of this Annual Report on Form 10-K.
Report of Independent Registered Public Accounting Firm
Consolidated Balance Sheets - December 31, 2019 and 2018
Consolidated Statements of Operations - for the years ended December 31, 2019, 2018 and 2017
Consolidated Statements of Comprehensive Income (Loss) - for the years ended December 31, 2019, 2018 and 2017
Consolidated Statements of Equity - for the years ended December 31, 2019, 2018 and 2017
Consolidated Statements of Cash Flows - for the years ended December 31, 2019, 2018 and 2017
Notes to Consolidated Financial Statements
(a) 2. Financial Statement Schedules
The following Consolidated Financial Statements are included in Part II, Item 8-Financial Statements and Supplementary Data of this Annual Report on Form 10-K.
Schedule II: Valuation and Qualifying Accounts
Schedule III: Real Estate and Accumulated Depreciation
Schedule IV: Mortgage Loans on Real Estate
| (a) 3. | Exhibits |
| 101.INS | XBRL Instance Document.† | |||||
| 101.SCH | XBRL Taxonomy Extension Schema Document.† | |||||
| 101.CAL | XBRL Taxonomy Extension Calculation Linkbase Document.† | |||||
| 101.DEF | XBRL Taxonomy Extension Definition Linkbase Document.† | |||||
| 101.LAB | XBRL Taxonomy Extension Labels Linkbase Document.† | |||||
| 101.PRE | XBRL Taxonomy Extension Presentation Linkbase Document.† | |||||
| 104 | Cover Page Interactive Data File (embedded within the Inline XBRL document). |
_______________________________________
| * | Management Contract or Compensatory Plan or Arrangement. |
| † | Filed herewith. |
| †† | Furnished herewith. |
Item 16. Form 10-K Summary
None.
SIGNATURES
Pursuant to the requirements of Section 13 or 15(d) of the Securities Exchange Act of 1934, the Registrant has duly caused this report to be signed on its behalf by the undersigned, thereunto duly authorized.
Dated: February 12, 2020
| Healthpeak Properties, Inc. (Registrant) | |
| /s/ THOMAS M. HERZOG | |
| Thomas M. Herzog, Chief Executive Officer (Principal Executive Officer) |
Pursuant to the requirements of the Securities Exchange Act of 1934, this report has been signed below by the following persons on behalf of the Registrant and in the capacities and on the dates indicated.
| Signature | Title | Date | ||
| /s/ THOMAS M. HERZOG | Chief Executive Officer | February 12, 2020 | ||
| Thomas M. Herzog | (Principal Executive Officer), Director | |||
| /s/ PETER A. SCOTT | Executive Vice President and Chief Financial Officer | February 12, 2020 | ||
| Peter A. Scott | (Principal Financial Officer) | |||
| /s/ SHAWN G. JOHNSTON | Executive Vice President and Chief Accounting Officer | February 12, 2020 | ||
| Shawn G. Johnston | (Principal Accounting Officer) | |||
| /s/ BRIAN G. CARTWRIGHT | Chairman of the Board | February 12, 2020 | ||
| Brian G. Cartwright | ||||
| /s/ CHRISTINE N. GARVEY | Director | February 12, 2020 | ||
| Christine N. Garvey | ||||
| /s/ R. KENT GRIFFIN, JR. | Director | February 12, 2020 | ||
| R. Kent Griffin, Jr. | ||||
| /s/ DAVID B. HENRY | Director | February 12, 2020 | ||
| David B. Henry | ||||
| /s/ LYDIA H. KENNARD | Director | February 12, 2020 | ||
| Lydia H. Kennard | ||||
| /s/ SARA GROOTWASSINK LEWIS | Director | February 12, 2020 | ||
| Sara Grootwassink Lewis | ||||
| /s/ KATHERINE M. SANDSTROM | Director | February 12, 2020 | ||
| Katherine M. Sandstrom | ||||