 filings.tools
Item 5. Market for Registrant’s Common Equity, Related Stockholder Matters and Issuer Purchases of Equity Securities
8K characters. Original on sec.gov · Markdown
Item 5. Market for Registrant’s Common Equity, Related Stockholder Matters and Issuer Purchases of Equity Securities
Our common stock is listed on the New York Stock Exchange under the symbol “PEAK.”
As of February 5, 2024, we had 6,797 stockholders of record, and there were 283,417 beneficial holders of our common stock.
Dividends (Distributions)
It has been our policy to declare quarterly dividends to common stockholders so as to comply with applicable provisions of the Code governing REITs. All distributions are made at the discretion of our Board of Directors in accordance with Maryland law. Distributions with respect to our common stock can be characterized for federal income tax purposes as ordinary dividends, capital gains, nondividend distributions, or a combination thereof. The following table shows the characterization of our annual common stock distributions per share:
| Year Ended December 31, | |||||||||||||||||
| 2023 | 2022 | 2021 | |||||||||||||||
| Ordinary dividends(1) | $ | 0.909692 | $ | 0.872948 | $ | 0.152336 | |||||||||||
| Capital gains(2)(3) | 0.116992 | 0.183208 | 0.379960 | ||||||||||||||
| Nondividend distributions | 0.173316 | 0.143844 | 0.667704 | ||||||||||||||
| $ | 1.200000 | $ | 1.200000 | $ | 1.200000 |
______________________________________
(1)For the year ended December 31, 2023, the amount includes $0.882312 of ordinary dividends qualified as business income for purposes of Code Section 199A and $0.027380 of qualified dividend income for purposes of Code Section 1(h)(11). For the year ended December 31, 2022, all $0.872948 of ordinary dividends qualified as business income for purposes of Code Section 199A. For the year ended December 31, 2021, the amount includes $0.137064 of ordinary dividends qualified as business income for purposes of Code Section 199A and $0.015272 of qualified dividend income for purposes of Code Section 1(h)(11).
(2)For the years ended December 31, 2023, 2022, and 2021, the amount includes $0.036256, $0.017760, and $0.379960, respectively, of unrecaptured Code Section 1250 gain. Pursuant to Treasury Regulation Section 1.1061-6(c), we are disclosing additional information related to the capital gain dividends for purposes of Section 1061 of the Code. Code Section 1061 is generally applicable to direct and indirect holders of “applicable partnership interests.” For the year ended December 31, 2023, the “One Year Amounts” and “Three Year Amounts” are each zero, since all capital gains relate to Code Section 1231 gains. For the year ended December 31, 2022, the “One Year Amounts” and “Three Year Amounts” are each 89.6708% of the total capital gain distributions and the remaining capital gain distributions are attributable to Code Section 1231 gains, which are not subject to Code Section 1061. For the year ended December 31, 2021, the “One Year Amounts” and “Three Year Amounts” are each zero, since all capital gains relate to Code Section 1231 gains.
(3)For the years ended December 31, 2023, 2022, and 2021, 100%, 10.3292%, and 100%, respectively, of the capital gain distributions represent gains from dispositions of U.S. real property interests pursuant to Code Section 897 for foreign shareholders.
On January 31, 2024, we announced that our Board of Directors declared a quarterly common stock cash dividend of $0.30 per share. The common stock dividend will be paid on February 26, 2024 to stockholders of record as of the close of business on February 14, 2024.
Issuer Purchases of Equity Securities
The following table sets forth information with respect to purchases of our common stock made by or on our behalf during the three months ended December 31, 2023.
| Period Covered | Total Number of Shares Purchased | Average Price Paid per Share | Total Number of Shares Purchased as Part of Publicly Announced Plans or Programs**(1)** | Maximum Number (or Approximate Dollar Value) of Shares that May Yet be Purchased Under the Plans or Programs**(1)** | ||||||||||||||||||||||
| October 1-31, 2023 | — | $ | — | — | $ | 444,018,701 | ||||||||||||||||||||
| November 1-30, 2023 | — | — | — | 444,018,701 | ||||||||||||||||||||||
| December 1-31, 2023 | — | — | — | 444,018,701 | ||||||||||||||||||||||
| — | $ | — | — | $ | 444,018,701 |
_______________________________________
(1)On August 1, 2022, our Board of Directors approved a share repurchase program under which we may acquire shares of our common stock in the open market up to an aggregate purchase price of $500 million (the “Share Repurchase Program”). Purchases of common stock under the Share Repurchase Program may be exercised at our discretion with the timing and number of shares repurchased depending on a variety of factors, including price, corporate and regulatory requirements, and other corporate liquidity requirements and priorities. The Share Repurchase Program expires in August 2024 and may be suspended or terminated at any time without prior notice. During the year ended December 31, 2022, we repurchased 2.1 million shares of our common stock at a weighted average price of $27.16 per share. During the year ended December 31, 2023, there were no repurchases; therefore, at December 31, 2023, $444 million of our common stock remained available for repurchase under the Share Repurchase Program. Amounts do not include the shares of our common stock withheld under our equity incentive plans to offset tax withholding obligations as discussed in footnote 1.
Performance Graph
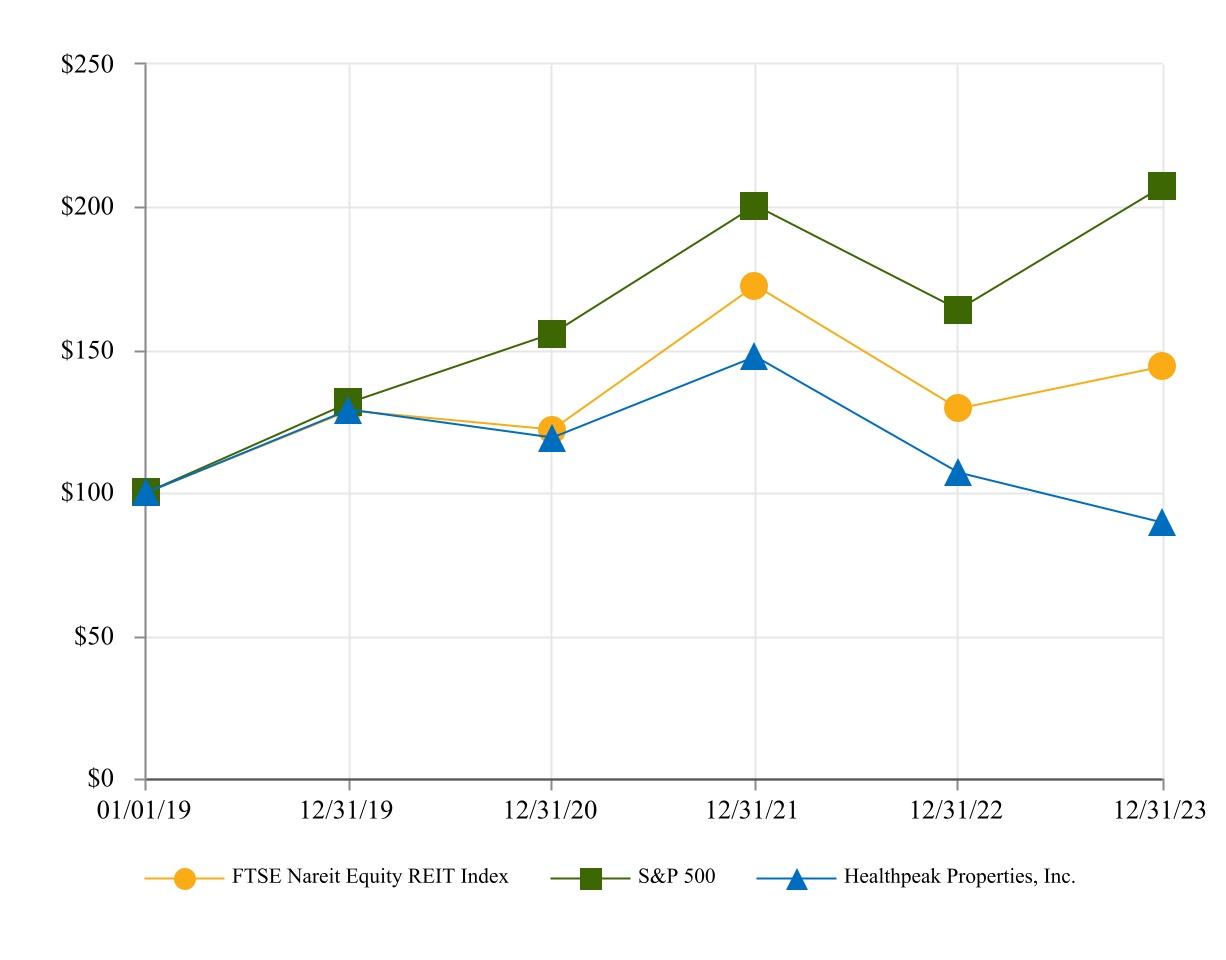
The graph and table below compare the cumulative total return of Healthpeak, the S&P 500 Index, and the Equity REIT Index of Nareit, from January 1, 2019 to December 31, 2023. Total cumulative return is based on a $100 investment in Healthpeak common stock and in each of the indices at the close of trading on December 31, 2018 and assumes quarterly reinvestment of dividends before consideration of income taxes. Stockholder returns over the indicated periods should not be considered indicative of future stock prices or stockholder returns.
COMPARISON OF FIVE-YEAR CUMULATIVE TOTAL RETURN
AMONG S&P 500, EQUITY REITS AND HEALTHPEAK PROPERTIES, INC.
RATE OF RETURN TREND COMPARISON
JANUARY 1, 2019–DECEMBER 31, 2023
(JANUARY 1, 2019 = $100)
Performance Graph Total Stockholder Return
| December 31, | |||||||||||||||||||||||||||||
| 2019 | 2020 | 2021 | 2022 | 2023 | |||||||||||||||||||||||||
| FTSE Nareit Equity REIT Index | $ | 128.66 | $ | 122.07 | $ | 172.49 | $ | 129.45 | $ | 144.16 | |||||||||||||||||||
| S&P 500 | 131.47 | 155.65 | 200.29 | 163.98 | 207.04 | ||||||||||||||||||||||||
| Healthpeak Properties, Inc. | 129.11 | 119.21 | 147.52 | 106.94 | 89.40 |
Previous: Item 4. Mine Safety Disclosures · Next: Item 6. [Reserved]