 filings.tools
Domino's Pizza (DPZ) 10-K risk factor changes: FY2017 vs FY2016
The 2017-01-01 10-K against the 2016-01-03 one, compared heading by heading and sentence by sentence. One of these filings carries no fiscal year tag, so its year is the calendar year of the period end.
Item 1A29 rewritten21 added17 removed276 unchanged
All filing items773 rewritten570 added378 removed1,984 unchanged
Summary
counted, not written
- Item 1A lists 24 risk factor headings: 1 new, 1 reworded and 22 unchanged since FY2016. 1 heading from FY2016 no longer appears.
- Sentence by sentence, 570 added, 378 removed, 773 rewritten and 1,984 unchanged across 22 items that differ.
- New this year: Item 16. Form 10-K Summary..
New Item 1A headings (1)
- _The occurrence of cyber incidents, or a deficiency in cybersecurity, could negatively impact our business by causing a disruption to our operations, a compromise or corruption of confidential information, or damage to our employee and business relationships, any of which could subject us to loss and harm our brand._Cybersecurity
Removed Item 1A headings (1)
- _Interruption, failure or compromise of our information technology, communications systems and electronic data could hurt our ability to effectively serve our customers and protect customer data, which could damage our reputation and adversely affect our business and operating results._
Reworded Item 1A headings (1)
- _The food service market is affected by consumer preferences and perceptions. Changes in these preferences and perceptions may
[removed: lessen][added: reduce] the demand for our products, which would reduce sales and harm our business._
A heading is new when no FY2016 heading matches it after ignoring case and punctuation, and reworded when it shares at least 60 percent of its words with one that went away. All current risk factor headings.
Sentences by item
23 items, with every count and a link to each item that changed
Underlined words on a shaded ground are new in FY2017; struck-through words were in FY2016. Sentences that are wholly new or wholly gone are labelled rather than marked.
Item 1A. Risk Factors.
29 rewritten, 21 added, 17 removed, 276 unchanged
While over 99% of domestic franchisees purchased food, equipment and supplies from us in [removed: 2015,] [added: 2016,] domestic franchisees are not required to purchase food, equipment or supplies from us and they may choose to purchase from outside suppliers.
| • | | selection and availability of suitable [added: new] store [added: sites and the ability to renew leases in quality] locations; |
Changes in these preferences and perceptions may [removed: lessen] [added: reduce] the demand for our products, which would reduce sales and harm our business._
[removed: Coli,] [added: Reports, whether true or not, of food-borne illnesses (such as E. coli,] avian flu, bovine spongiform encephalopathy, hepatitis A, trichinosis or salmonella) and injuries caused by food tampering have in the past severely injured the reputations of participants in the QSR sector and could in the future as well.
The cheese block price per pound averaged [removed: $1.62] [added: $1.56] in [removed: 2015,] [added: 2016,] and the estimated increase in Company-owned store food costs from a hypothetical $0.25 adverse change in the average cheese block price per pound would have been approximately [removed: $2.2] [added: $2.5] million in [removed: 2015.][added: 2016.]
In addition, [removed: the Company has] [added: we have] single suppliers or a limited number of suppliers for certain of [removed: its] [added: our] ingredients, including pizza cheese.
While [removed: the Company believes] [added: we believe] there are adequate reserve quantities and potential alternative suppliers, shortages or interruptions in the supply of food products caused by unanticipated demand, problems in production or distribution, financial or other difficulties of suppliers, inclement weather or other conditions could adversely affect the availability, quality and cost of ingredients, could adversely affect our operating results.
_Our success depends in part upon effective advertising, and lower advertising funds may reduce our ability to adequately market the Domino’s [removed: Pizza_® _brand._][added: Pizza® brand._]
We have been routinely named a Leading National Advertiser by [removed: Advertising Age.][added: _Advertising Age_.]
In fiscal [removed: 2015,] [added: 2016,] each store in the contiguous United States generally was required to contribute 6% of their sales to DNAF (subject, in limited instances, to lower rates based on certain incentives and waivers), which uses such fees for national advertising in addition to contributions for local market-level advertising.
Claims within our industry of improper supplier actions [removed: have] also [removed: recently arisen] [added: occasionally arise] that, if made against one of our suppliers, could potentially damage our brand image.
Approximately [removed: 7.4%] [added: 7.2%] of our total revenues in [removed: 2015, 7.7%] [added: 2016, 7.4%] of our total revenues in [removed: 2014] [added: 2015] and [removed: 7.4%] [added: 7.7%] of our total revenues in [removed: 2013] [added: 2014] were derived from our international franchise segment, a majority of which were denominated in foreign currencies.
A hypothetical 10% adverse change in the foreign currency rates in our international markets would have resulted in a negative impact on international royalty revenues of approximately [removed: $15.6] [added: $16.7] million in [removed: 2015.][added: 2016.]
We [removed: may] [added: may,] from time to [removed: time] [added: time,] be required to institute [added: or defend] litigation to enforce our trademarks or other intellectual property rights, or to protect our trade secrets.
We provide tools for franchisees to use in training their employees, but the quality of franchise store operations [added: and our brand and branded products] may be diminished by any number of factors beyond our control.
[removed: Consequently, franchisees] [added: Franchisees] may not [removed: successfully] operate stores in a manner consistent with our standards and [removed: requirements.][added: requirements or they or their employees may take other actions that adversely affect the value of our brand.]
[removed: If they do not,] [added: In such event,] our [removed: image] [added: business] and reputation may suffer, and as a result our revenues and stock price could decline.
As of January [removed: 3, 2016,] [added: 1, 2017,] we had [removed: 841] [added: 799] domestic franchisees operating [removed: 4,816] [added: 4,979] domestic stores.
[removed: 13] [added: Fourteen] of these franchisees each [added: own and] operate over 50 domestic stores, including our largest domestic franchisee who [added: owns and] operates [removed: 191] [added: 189] stores, and the average franchisee owns and operates six stores.
[removed: In addition, our] [added: Our] international master franchisees are generally responsible for the development of significantly more stores than our domestic franchisees.
Our largest international master franchisee operates [removed: 1,561] [added: 1,990] stores in [removed: six] [added: seven] markets, which accounts for approximately [removed: 21%] [added: 24%] of our total international store count.
We are subject to numerous federal, state, local and foreign laws and regulations, as well [removed: as,] [added: as] requirements issued by other groups, including those relating to:
| • | | compliance with the Payment Card Industry Data Security Standards [removed: (“PCI DSS”)] and similar requirements; |
| • | | compliance with the Patient Protection and Affordable Care Act, and subsequent [removed: amendments;] [added: amendments (the “Affordable Care Act”);] and |
The [removed: Patient Protection and] Affordable Care Act [removed: and subsequent amendments require] [added: requires] employers such as us to provide health insurance for all qualifying employees or pay penalties for not providing coverage.
[removed: While] [added: The majority of] the [added: increases in these costs began in 2015, and while the] incremental costs of this program have not been material to [removed: us,] [added: us to date, we cannot predict what effect] these costs will [removed: likely] have [removed: an adverse effect] on our results of operations and financial position, [removed: as well as an adverse effect] [added: or the effects of the Affordable Care Act] on some of our larger franchisees.
| • | | changes in our dividend [removed: policy;] [added: policy or any share repurchase program;] |
As of January [removed: 3, 2016,] [added: 1, 2017,] our consolidated long-term indebtedness was approximately [removed: $2.24] [added: $2.19] billion.
Additionally, our senior notes have original scheduled principal payments of [removed: $59.0 million in 2016,] $38.6 million in each of 2017 and 2018, $878.5 million in 2019, $488.0 million in 2020, $8.0 million in each of 2021 through 2024 and $728.0 million in 2025.
| --- | --- |
Additionally, our growth strategy and the success of new stores depend in large part on the availability of suitable store sites.
If we and our franchisees are not able to secure leases in desired locations on favorable terms, or to renew such leases, our business and results of operations may be adversely affected.
The preferences of customers also may change as a result of advances in technology or alternative delivery methods or channels.
If we are not able to respond to these changes, or our competitors respond to these changes more effectively, our business and operating results could be adversely affected.
| • | | political and economic instability and uncertainty around the world, including uncertainty arising as a result of the United Kingdom’s referendum in June 2016 in which voters approved an exit from the European Union, commonly referred to as “Brexit”; and |
_The occurrence of cyber incidents, or a deficiency in cybersecurity, could negatively impact our business by causing a disruption to our operations, a compromise or corruption of confidential information, or damage to our employee and business relationships, any of which could subject us to loss and harm our brand._
A cyber incident is considered to be any adverse event that threatens the confidentiality, integrity or availability of information resources.
More specifically, a cyber incident is an intentional attack or an unintentional event that can include gaining unauthorized access to systems to disrupt operations, corrupt data or steal confidential information about customers, franchisees, suppliers or employees.
A number of retailers and other companies have recently experienced serious cyber incidents and breaches of their information technology systems.
As our reliance on technology has increased, so have the risks posed to our systems, both internal and those we have outsourced.
The three primary risks that could directly result from the occurrence of a cyber incident include operational interruption, damage to our relationships with customers, franchisees and employees and private data exposure.
In addition to maintaining insurance coverage to address cyber incidents, we have also implemented processes, procedures and controls to help mitigate these risks.
However, these measures, as well as our increased awareness of the risk of a cyber incident, do not guarantee that our reputation and financial results will not be adversely affected by such an incident.
Because we and our franchisees accept electronic forms of payment from customers, our business requires the collection and retention of customer data, including sensitive data and other personally identifiable information in various information systems that we and our franchisees maintain and in those maintained by third parties with whom we and our franchisees contract to provide payment processing.
We also maintain important internal Company data, such as personally identifiable information about our employees and franchisees and information relating to our operations.
Our use of personally identifiable information is regulated by foreign, federal and state laws, as well as by certain third-party agreements.
As privacy and information security laws and regulations change, we may incur additional costs to ensure that we remain in compliance with those laws and regulations.
If our security and information systems are compromised or if our employees or franchisees fail to comply with these laws, regulations or contract terms, and this information is obtained by unauthorized persons or used inappropriately, it could adversely affect our reputation and could disrupt our operations and result in costly litigation, judgments or penalties.
A cyber incident could also require us to notify customers, employees or other groups, result in adverse publicity, loss of sales and profits, increase fees payable to third parties and result in penalties or remediation and other costs that could adversely affect our business and results of operations.
Modifications to, or repeal of, all or certain provisions of the Affordable Care Act are possible, consistent with statements made by certain elected officials.
##### [Table of Contents](#toc)
Reports, whether true or not, of food-borne illnesses (such as E.
| • | | political and economic instability; and |
While we try to ensure that our franchisees maintain the quality of our brand and branded products, our franchisees may take actions that adversely affect the value of our intellectual property or reputation.
_Interruption, failure or compromise of our information technology, communications systems and electronic data could hurt our ability to effectively serve our customers and protect customer data, which could damage our reputation and adversely affect our business and operating results._
A significant portion of our retail sales depends on the continuing operation of our information technology and communications systems, including but not limited to, Domino’s PULSE™, our online ordering platforms and our credit card processing systems.
Our information technology, communication systems and electronic data may be vulnerable to damage or interruption from earthquakes, terrorist attacks, floods, fires, power loss, telecommunications failures, computer viruses, loss of data, unauthorized data breaches or other attempts to harm our systems.
Additionally, we operate data centers that are also subject to break-ins, sabotage and intentional acts of vandalism that could cause disruptions in our ability to serve our customers and protect customer data.
Some of our systems are not fully redundant, and our disaster recovery planning cannot account for all eventualities.
The occurrence of a natural disaster, intentional sabotage or other unanticipated problems could result in lengthy interruptions in our service.
Any errors or vulnerabilities in our systems, or damage to or failure of our systems, could result in interruptions in our services and non-compliance with certain regulations, which could reduce our revenues and profits, and damage our business and brand.
_We rely on proprietary and commercially available systems, software, tools and monitoring to provide security for processing, transmission and storage of confidential customer information, such as payment card and personal information and any unauthorized data breaches could damage our reputation and adversely affect our business__._
Unauthorized intrusion into the portions of our computer systems or those of our franchisees that process and store information related to customer transactions may result in the theft of customer data.
Furthermore, the systems currently used for transmission and approval of payment card transactions, and the technology utilized in payment cards themselves, all of which can put payment card data at risk, are determined and mandated by payment card industry standards, not by us.
In addition to improper activities by third parties, bugs in newly-deployed or early stage advances in hardware and software capabilities, encryption technology, and other events or developments may facilitate or result in a compromise or breach of our computer systems.
Any such compromises or breaches could cause interruptions in operations and damage to the reputation of the Domino’s Pizza® brand, subject us to costs and liabilities and hurt sales, revenues and profits.
The majority of the increases in these costs began in 2015 and we anticipate that they will escalate in subsequent years.
Item 7. Management’s Discussion and Analysis of Financial Condition and Results of Operations.
143 rewritten, 128 added, 71 removed, 407 unchanged
Fiscal 2015 consisted of 53 weeks, while fiscal [removed: 2014] [added: 2016] and fiscal [removed: 2013] [added: 2014] each consisted of 52 weeks._
Domino’s is the second largest pizza restaurant chain in the world, with more than [removed: 12,500] [added: 13,800] locations in over [removed: 80] [added: 85] markets around the world.
On average, we sell more than [removed: 1.5] [added: 2] million pizzas each day throughout our global system.
We have historically returned cash to shareholders through dividend payments and share [removed: buybacks] [added: repurchases] since becoming a publicly-traded company.
| | • | | Global retail sales (which are total retail sales at Company-owned and franchised stores worldwide) increased [removed: 11.1%] [added: 9.8%] as compared to [removed: 2014.] [added: 2015.] |
| | • | | Same store sales increased 12.0% in our domestic stores [removed: and, when excluding the impact of foreign currency exchange rates,] [added: and] increased 7.8% in our international stores. |
Our international [added: franchise] segment led the way with [removed: a record] 768 net new store openings.
We continued our focus on growing online ordering and the digital customer experience as we introduced several innovative ordering [removed: platforms] [added: platforms,] including Samsung Smart [removed: TV®,] [added: TV®] as well as Twitter and text message using a pizza emoji.
Overall, we believe our focus in [removed: 2015] [added: 2016] on global growth and technology will [added: continue to] strengthen our brand in the future.
Fiscal [removed: 2014] [added: 2016] Highlights
[removed: | | • | | Same store sales increased 7.5% in our domestic stores and, when excluding] [added: Excluding] the impact of foreign currency exchange rates, [added: same store sales] increased [removed: 6.9%] [added: 6.3%] in [removed: our international stores. |][added: 2016 compared to 2015.]
| | • | | Our revenues increased [removed: 10.6%.] [added: 11.6%.] |
| | • | | Our income from operations increased [removed: 10.1%.] [added: 12.0%.] |
| | • | | Our net income increased [removed: 13.7%.] [added: 11.4%.] |
During [removed: 2014,] [added: 2016,] we continued our rapid global expansion with the opening of [removed: 743] [added: 1,281] net new stores.
Our international [added: franchise] segment led the way with [removed: 662] [added: a record 1,110] net new store openings.
Our emphasis on technology innovation helped us generate [removed: approximately 45%] [added: more than half] of U.S. sales from digital channels in [removed: 2014,] [added: 2016,] as well as reach an estimated [removed: $3.6] [added: $5.6] billion in global digital sales.
The following discussion and analysis of financial condition and results of operations is based on our consolidated financial statements, which have been prepared in accordance with accounting principles generally accepted in the United [removed: States of America.][added: States.]
Retail sales are generally reported and related royalties paid to the Company based on a percentage of retail sales, as specified in the related standard franchise agreement (generally 5.5% of domestic franchise retail sales and, on average, [removed: 3.1%] [added: 3.0%] of international franchise retail sales).
Revenues from Company-owned stores and royalty revenues [added: and fees] from franchised stores can fluctuate from time-to-time as a result of store count and sales level changes.
If a Company-owned store that generated $500,000 in revenue in fiscal [removed: 2014] [added: 2015] was sold to a franchisee in fiscal [removed: 2015,] [added: 2016,] revenues from Company-owned stores would have declined by $500,000 in fiscal [removed: 2015,] [added: 2016,] while franchise royalty revenues would have increased by only $27,500 in fiscal [removed: 2015,] [added: 2016,] as we generally collect 5.5% of a domestic franchisee’s retail sales.
Aside from this impairment charge, the Company did not record an impairment charge during fiscal [removed: 2014] [added: 2016, fiscal 2015] or fiscal [removed: 2015.][added: 2014.]
At January [removed: 3, 2016,] [added: 1, 2017,] the fair value of our business operations with associated goodwill exceeded their recorded carrying value, including the related goodwill.
We had accruals for legal matters of approximately [removed: $1.9] [added: $2.7] million at January [removed: 3, 2016] [added: 1, 2017] and [removed: $4.3] [added: $1.9] million at [removed: December 28, 2014.][added: January 3, 2016.]
A 10% change in our self-insurance liability at January [removed: 3, 2016] [added: 1, 2017] would have affected our income before provision for income taxes by approximately [removed: $4.1] [added: $4.4] million for fiscal [removed: 2015.][added: 2016.]
We had accruals for insurance matters of approximately [removed: $40.9] [added: $43.9] million at January [removed: 3, 2016] [added: 1, 2017] and [removed: $41.4] [added: $40.9] million at [removed: December 28, 2014.][added: January 3, 2016.]
[removed: We are] [added: Historically, we have] also [removed: required to estimate] [added: estimated] the expected forfeiture rate and only [removed: recognize] [added: recognized] expense for those awards expected to vest.
The Company had valuation allowances recorded for deferred tax assets of approximately [removed: $0.2] [added: $0.1] million as of January [removed: 3, 2016] [added: 1, 2017] and approximately [removed: $0.5] [added: $0.2] million as of [removed: December 28, 2014.][added: January 3, 2016.]
| | | [removed: 2015] [added: 2016] | | | | [removed: 2014] [added: 2015] | | | | [removed: 2013] [added: 2014] | | |
| Domestic Company-owned stores | | | [removed: 12.2] [added: 10.4] | % | | | [removed: 6.2] [added: 12.2] | % | | | [removed: 3.9] [added: 6.2] | % |
| Domestic franchise stores | | | [removed: 11.9] [added: 10.5] | % | | | [removed: 7.7] [added: 11.9] | % | | | [removed: 5.5] [added: 7.7] | % |
| Domestic stores | | | [removed: 12.0] [added: 10.5] | % | | | [removed: 7.5] [added: 12.0] | % | | | [removed: 5.4] [added: 7.5] | % |
| International stores (excluding foreign currency impact) | | | [removed: 7.8] [added: 6.3] | % | | | [removed: 6.9] [added: 7.8] | % | | | [removed: 6.2] [added: 6.9] | % |
| Closings | | | [removed: —] [added: (1] | [added: )] | | | [removed: (46] [added: (22] | ) | | | [removed: (46] [added: (23] | ) | | | [removed: (38] [added: (68] | ) | | | [removed: (84] [added: (91] | ) |
| (dollars in millions) | | [removed: 2015] [added: 2016] | | | | | | | | [removed: 2014] [added: 2015] | | | | | | | | [removed: 2013] [added: 2014] | | | | | | |
| Domestic Company-owned stores | | $ | [removed: 396.9] [added: 439.0] | | | | | | | $ | [removed: 348.5] [added: 396.9] | | | | | | | $ | [removed: 337.4] [added: 348.5] | | | | | |
| Domestic franchise | | | [removed: 272.8] [added: 312.3] | | | | | | | | [removed: 230.2] [added: 272.8] | | | | | | | | [removed: 212.4] [added: 230.2] | | | | | |
| Supply chain | | | [removed: 1,383.2] [added: 1,544.3] | | | | | | | | [removed: 1,262.5] [added: 1,383.2] | | | | | | | | [removed: 1,118.9] [added: 1,262.5] | | | | | |
| International franchise | | | [removed: 163.6] [added: 177.0] | | | | | | | | [removed: 152.6] [added: 163.6] | | | | | | | | [removed: 133.6] [added: 152.6] | | | | | |
| Total revenues | | | [removed: 2,216.5] [added: 2,472.6] | | | | 100.0 | % | | | [removed: 1,993.8] [added: 2,216.5] | | | | 100.0 | % | | | [removed: 1,802.2] [added: 1,993.8] | | | | 100.0 | % |
| | • | | Same store sales increased 10.5% in our domestic stores and increased 6.3% in our international stores. |
We continued our focus on growing online ordering and the digital customer experience as we introduced new innovative ordering platforms including zero-click ordering, Google Home, Facebook Messenger, Apple Watch, and Amazon Echo.
| | • | | Global retail sales increased 11.1% as compared to 2014. |
| Openings | | | 8 | | | | 186 | | | | 194 | | | | 1,178 | | | | 1,372 | |
| Transfers | | | 1 | | | | (1 | ) | | | — | | | | — | | | | — | |
| Store count at January 1, 2017 | | | 392 | | | | 4,979 | | | | 5,371 | | | | 8,440 | | | | 13,811 | |
| | | | | | | | | | | | | | | | | | | | | | | | | |
2016 compared to 2015
Consolidated revenues increased $256.1 million or 11.6% in 2016.
The increase was due primarily to higher supply chain food volumes as well as higher Company-owned store, domestic franchise and international franchise revenues resulting from same store sales and store count growth.
These increases were offset in part by the inclusion of the 53rd week in 2015, which positively impacted revenues by an estimated $49.7 million in 2015.
| | | 2016 | | | | | | | | 2015 | | | | | | |
| Domestic Company-owned stores | | $ | 439.0 | | | | 58.4 | % | | $ | 396.9 | | | | 59.3 | % |
| Domestic franchise | | | 312.3 | | | | 41.6 | % | | | 272.8 | | | | 40.7 | % |
Revenues further benefited from fees paid by franchisees for our internally developed online ordering platform, and were offset in part by the estimated $6.1 million positive impact in 2015 related to the inclusion of the 53rd week.
| | | 2016 | | | | | | | | 2015 | | | | | | |
| Domestic supply chain | | $ | 1,408.8 | | | | 91.2 | % | | $ | 1,266.4 | | | | 91.6 | % |
| International supply chain | | | 135.5 | | | | 8.8 | % | | | 116.8 | | | | 8.4 | % |
In fiscal 2016, the Company began managing the Alaska and Hawaii supply chain centers as part of its domestic supply chain business.
Prior to fiscal 2016, these centers were managed as part of the Company’s international supply chain business.
Revenues from these supply chain centers are included in the 2016 and 2015 domestic supply chain revenues in the table above.
They were partially offset by lower commodity prices and the estimated $27.8 million positive impact in 2015 related to the inclusion of the 53rd week.
The lower cheese block price (passed through directly in domestic supply chain pricing to franchisees) did not have a material impact on domestic supply chain revenues in 2016.
We estimate that lower commodity prices resulted in an approximate $3.0 million decrease in domestic supply chain revenues during 2016.
| | | 2016 | | | | | | | | 2015 | | | | | | |
| Consolidated cost of sales | | | 1,704.9 | | | | 69.0 | % | | | 1,533.4 | | | | 69.2 | % |
| Consolidated operating margin | | $ | 767.7 | | | | 31.0 | % | | $ | 683.1 | | | | 30.8 | % |
The increase in the consolidated operating margin was offset in part by the estimated $16.6 million positive impact in 2015 related to the inclusion of the 53rd week.
Lower Company-owned stores operating margins as a percentage of their revenues partially offset these increases.
| | | 2016 | | | | | | | | 2015 | | | | | | |
| Revenues | | $ | 439.0 | | | | 100.0 | % | | $ | 396.9 | | | | 100.0 | % |
| Cost of sales | | | 331.9 | | | | 75.6 | % | | | 299.3 | | | | 75.4 | % |
| Store operating margin | | $ | 107.2 | | | | 24.4 | % | | $ | 97.6 | | | | 24.6 | % |
The estimated $3.1 million positive impact in 2015 related to the inclusion of the 53rd week partially offset this increase.
Management has historically included costs to support online ordering as part of labor and related costs.
Costs to support online ordering are now included within transaction-related expenses and the prior year costs have been reclassified to conform to current year presentation.
| | • | | Food costs increased 0.5 percentage points to 26.6% in 2016, due primarily to promotional activities. Lower overall commodity prices partially offset these increases. |
| | • | | Labor costs increased 0.3 percentage points to 28.8% in 2016, due primarily to an increase in labor rates in certain markets as well as higher performance based compensation and overtime as a result of increased same store sales. The leveraging impact of higher same store sales partially offset these increases. |
| | • | | Insurance costs decreased 1.2 percentage points to 2.8% in 2016, due primarily to a $4.3 million insurance expense related to updated actuarial estimates for our casualty insurance program in the third quarter of 2015. |
| | • | | Transaction-related expenses increased 0.9 percentage points to 3.2% in 2016. This increase was primarily attributable to higher credit card-related expenses in certain markets in which we operate. |
| | • | | Global retail sales (which are total retail sales at Company-owned and franchised stores worldwide) increased 11.1% as compared to 2013. |
In 2014 we continued our focus on growing online ordering and the digital customer experience as we introduced “Dom,” a voice ordering application, and we also made the Domino’s Tracker® available on the Pebble smartwatch platform.
| Store count at December 30, 2012 | | | 388 | | | | 4,540 | | | | 4,928 | | | | 5,327 | | | | 10,255 | |
| Openings | | | 2 | | | | 102 | | | | 104 | | | | 611 | | | | 715 | |
| Domestic supply chain | | $ | 1,256.5 | | | | 90.8 | % | | $ | 1,141.1 | | | | 90.4 | % |
| International supply chain | | | 126.6 | | | | 9.2 | % | | | 121.4 | | | | 9.6 | % |
When the impact of foreign currency exchange rates is included, same store sales decreased 4.4% in 2015 compared to 2014.
This variance was caused by a generally stronger U.S. dollar when compared to the currencies in the international markets in which we compete.
2014 compared to 2013
_Revenues._ Consolidated revenues increased $191.6 million or 10.6% in 2014.
The increase was driven by higher supply chain revenues due to higher volumes from increased store order counts, higher commodity prices, and increased sales of equipment to stores in connection with our store reimaging program.
Domestic store revenues rose due to an increase in same store sales and store count growth.
In addition, higher international franchise same store sales and store count growth also increased consolidated revenues.
| | | 2014 | | | | | | | | 2013 | | | | | | |
| Domestic Company-owned stores | | $ | 348.5 | | | | 60.2 | % | | $ | 337.4 | | | | 61.4 | % |
| Domestic franchise | | | 230.2 | | | | 39.8 | % | | | 212.4 | | | | 38.6 | % |
Revenues further benefited from fees paid by franchisees related to our insourced online ordering platform and we also incurred an increase in expenses related to these technology initiatives.
| Domestic supply chain | | $ | 1,141.1 | | | | 90.4 | % | | $ | 1,009.9 | | | | 90.3 | % |
| International supply chain | | | 121.4 | | | | 9.6 | % | | | 109.0 | | | | 9.7 | % |
Changes in U.S. cheese prices increased revenues by approximately $33.0 million in 2014.
Excluding the impact of foreign currency exchange rates, same store sales increased 6.9% in 2014 compared to 2013.
When the impact of foreign currency exchange rates is included, same store sales increased 4.9% in 2014 compared to 2013.
| Consolidated cost of sales | | | 1,399.1 | | | | 70.2 | % | | | 1,253.2 | | | | 69.5 | % |
| Consolidated operating margin | | $ | 594.8 | | | | 29.8 | % | | $ | 549.0 | | | | 30.5 | % |
These changes were primarily a result of higher commodity prices and were offset in part by a higher mix of franchise revenues and are more fully described below.
| Revenues | | $ | 348.5 | | | | 100.0 | % | | $ | 337.4 | | | | 100.0 | % |
| Cost of sales | | | 267.4 | | | | 76.7 | % | | | 256.6 | | | | 76.0 | % |
| Store operating margin | | $ | 81.1 | | | | 23.3 | % | | $ | 80.8 | | | | 24.0 | % |
This was offset in part by an increase in overall commodity prices and labor and related expenses.
| | • | | Food costs increased 0.7 percentage points to 28.3% in 2014, due primarily to higher overall commodity prices. The cheese block price per pound averaged $2.13 in 2014 compared to $1.75 in 2013. |
| | • | | Occupancy costs, which include rent, telephone, utilities and depreciation, decreased 0.1 percentage points to 9.2% in 2014 due primarily to the positive impact of higher sales per store. |
| | • | | Labor and related costs remained flat at 28.0% in 2014. |
| | • | | Insurance costs decreased 0.1 percentage points to 2.7% in 2014, due primarily to the positive impact of higher sales per store. |
| Revenues | | $ | 1,262.5 | | | | 100.0 | % | | $ | 1,118.9 | | | | 100.0 | % |
| Cost of sales | | | 1,131.7 | | | | 89.6 | % | | | 996.7 | | | | 89.1 | % |
| Supply chain operating margin | | $ | 130.8 | | | | 10.4 | % | | $ | 122.2 | | | | 10.9 | % |
As a percentage of supply chain revenues, the supply chain operating margin decreased 0.5 percentage points in 2014 due to higher commodity prices and higher health insurance costs, offset in part by the positive impact of higher volumes.
Changes in U.S. cheese prices increased both revenues and costs by $33.0 million in 2014.
These increases were due in part to an impairment charge of $5.8 million in connection with replacing our corporate airplane, as well as continued investments that we made in technology and international initiatives, including the addition of team members in both areas.
A decrease in non-cash compensation expense of $4.4 million partially offset these increases.
An excerpt. Shown here: 40 of 143 rewritten, 40 of 128 added and 40 of 71 removed. The counts are complete. For every sentence, read Item 7. Management’s Discussion and Analysis of Financial Condition and Results of Operations. in the FY2017 filing and the FY2016 filing.
Item 7A. Quantitative and Qualitative Disclosures About Market Risk.
4 rewritten, 1 added, 2 removed, 13 unchanged
In connection with the 2015 Recapitalization, we issued fixed rate notes and, at January [removed: 3, 2016,] [added: 1, 2017,] we are only exposed to interest rate risk on borrowings under our 2015 Variable Funding Notes.
As of January [removed: 3, 2016,] [added: 1, 2017,] we had no outstanding borrowings under our 2015 Variable Funding Notes.
Approximately [removed: 7.4%] [added: 7.2%] of our total revenues in [removed: 2015, 7.7%] [added: 2016, 7.4%] of our total revenues in [removed: 2014] [added: 2015] and [removed: 7.4%] [added: 7.7%] of our total revenues in [removed: 2013] [added: 2014] were derived from our international franchise segment, a majority of which were denominated in foreign currencies.
A hypothetical 10% adverse change in the foreign currency rates for our international markets would have resulted in a negative impact on royalty revenues of approximately [removed: $15.6] [added: $16.7] million in [removed: 2015.][added: 2016.]
| --- | --- |
Historically, we have entered into interest rate swaps from time to time, collars or similar instruments with the objective of managing volatility relating to our borrowing costs.
We had no outstanding derivative instruments as of January 3, 2016 or December 28, 2014.
Item 1. Business.
56 rewritten, 11 added, 9 removed, 257 unchanged
Domino’s is the second largest pizza restaurant chain in the world, with more than [removed: 12,500] [added: 13,800] locations in over [removed: 80] [added: 85] markets around the world.
On average, we sell more than [removed: 1.5] [added: 2] million pizzas each day throughout our global system.
We have historically returned cash to shareholders through dividend payments and share [removed: buybacks] [added: repurchases] since becoming a publicly-traded company.
The Company’s most recent recapitalization transaction in 2015 (the “2015 Recapitalization”) primarily consisted of the issuance of $1.3 billion of fixed rate notes and the repurchase and retirement of [removed: $551] [added: $551.3] million of previously outstanding fixed rate notes.
Globally, we opened our 10,000th store in [removed: 2012, our 11,000th store in 2014] [added: 2012] and our [removed: 12,000th] [added: 13,000th] store in [removed: 2015.][added: 2016.]
From [removed: 2005] [added: 2006] through [removed: 2015,] [added: 2016,] the U.S. QSR pizza category has grown from [removed: $31.5] [added: $33.1] billion to [removed: $33.8] [added: $35.8] billion.
It is the [removed: third-largest] [added: second-largest] category within the [removed: $273.0] [added: $281.9] billion U.S. QSR sector.
We are the market share leader in the delivery segment and we [removed: have] [added: are amongst] the [removed: second largest] [added: top three chains in] share in the carryout segment.
Delivery segment sales of [removed: $9.7] [added: $10.0] billion in [removed: 2015] [added: 2016] (down from [removed: $11.1] [added: $11.4] billion in [removed: 2005)] [added: 2006)] account for approximately [removed: 29%] [added: 28%] of total U.S. QSR pizza.
The delivery segment declined during the period from [removed: 2005] [added: 2006] to 2012, and has increased slightly since 2012, from [removed: $9.6] [added: $9.7] billion in 2012 to [removed: $9.7] [added: $10.0] billion in [removed: 2015.][added: 2016.]
The three industry leaders, including Domino’s, account for approximately [removed: 58%] [added: 56%] of U.S. pizza delivery, based on reported consumer spending, with the remaining sales going to regional chains and independent establishments.
From [removed: 2005] [added: 2006] to [removed: 2015,] [added: 2016,] the carryout segment grew from [removed: $12.9] [added: $13.9] billion to [removed: $15.6] [added: $16.5] billion.
The four industry leaders, including Domino’s, account for approximately [removed: 42%] [added: 47%] of the carryout segment.
No customer accounted for more than 10% of total consolidated revenues in [removed: 2015, 2014] [added: 2016, 2015] or [removed: 2013.][added: 2014.]
Our largest franchisee based on store count, Domino’s Pizza Enterprises (ASX: DMP), operates [removed: 1,561] [added: 1,990] stores in [removed: six] [added: seven] international markets, and accounts for [removed: 12%] [added: 14%] of our total store count.
Revenues from this master franchisee accounted for [removed: 1.4%] [added: 1.5%] of our consolidated revenues in [removed: 2015.][added: 2016.]
We [removed: operate in,] [added: operate,] and report, three business segments: domestic stores, international franchise and supply chain.
Our domestic stores segment consists primarily of our franchise operations, [removed: through] which [removed: we oversee a network] [added: consist] of [removed: 4,816] [added: 4,979] franchised stores located in the contiguous United States.
We also operate a network of [removed: 384] [added: 392] domestic Company-owned stores located in the contiguous United States.
During [removed: 2015,] [added: 2016,] our domestic stores segment accounted for [removed: $669.7] [added: $751.3] million, or 30% of our consolidated revenues.
As of January [removed: 3, 2016,] [added: 1, 2017,] our [removed: 4,816] [added: network of 4,979] domestic franchise stores were owned and operated by [removed: 841] [added: 799] domestic franchisees.
As of January [removed: 3, 2016,] [added: 1, 2017,] the average domestic franchisee owned and operated six stores and had been in our franchise system for over 17 years.
At the same time, [removed: 13] [added: 14] of our domestic franchisees operated more than 50 stores (including our largest domestic franchisee who operated [removed: 191] [added: 189] stores) and [removed: 303] [added: 277] of our domestic franchisees each operated one store.
Approximately 90% of our [removed: 841] [added: 799] independent domestic franchise owners started their careers with us as delivery drivers or in other in-store positions.
We enter into franchise agreements with domestic franchisees under which the franchisee is [added: generally] granted the right to operate a store in a particular location for a term of ten years, with an ability to renew for an additional term of ten years.
Our international franchise segment is comprised of a network of franchised stores in more than [removed: 80] [added: 85] international markets.
At January [removed: 3, 2016,] [added: 1, 2017,] we had [removed: 7,330] [added: 8,440] international franchise stores.
During [removed: 2015,] [added: 2016,] this segment accounted for [removed: $163.6] [added: $177.0] million, or 7% of our consolidated revenues.
The following table shows our store count as of January [removed: 3, 2016] [added: 1, 2017] in our top ten international markets, which account for approximately [removed: 71%] [added: 67%] of our international stores.
| Market | | [removed: Number of] [added: Number of] stores | | |
| United Kingdom | | | [removed: 868] [added: 947] | |
| South Korea | | | [removed: 417] [added: 433] | |
The master franchisee is also required to pay a continuing royalty fee as a percentage of retail sales, which varies among international markets, and averaged approximately [removed: 3.1%] [added: 3.0%] in [removed: 2015.][added: 2016.]
Our supply chain segment leases a fleet of more than [removed: 500] [added: 650] tractors and trailers.
During [removed: 2015,] [added: 2016,] our supply chain segment accounted for [removed: $1.38] [added: $1.54] billion, or 62% of our consolidated revenues.
We regularly supply over [removed: 5,600] [added: 5,800] stores with various food and supplies.
Our supply chain segment made approximately [removed: 581,000] [added: 593,000] full-service deliveries in [removed: 2015] [added: 2016] or approximately two deliveries per store per week, and we produced over [removed: 415] [added: 462] million pounds of dough during [removed: 2015.][added: 2016.]
The majority of our meat toppings in the U.S. come from a single supplier under [removed: a contract] [added: contracts] that [removed: began in November 2015 and expires] [added: expire] in [removed: December 2016.][added: March of 2017.]
Over the past five years, our U.S. franchise and Company-owned stores have invested an estimated [removed: $1.5] [added: $1.6] billion in national, co-operative and local advertising.
We are the number one pizza delivery company in the United States with a [removed: 28.0%] [added: 27.0%] share of pizza delivery based on reported consumer spending.
| --- | --- |
| India | | | 1,106 | |
| Mexico | | | 655 | |
| Australia | | | 623 | |
| Turkey | | | 477 | |
| Japan | | | 472 | |
| Canada | | | 438 | |
| France | | | 325 | |
| Germany | | | 213 | |
We continued this trend of innovation in 2016 with the introduction of zero-click ordering as well as adding Google Home, Facebook Messenger, Apple Watch, and Amazon Echo to our ordering platforms.
We may also occasionally provide additional opportunities for participating customers to benefit under the “Piece of the Pie Rewards” program.
| India | | | 989 | |
| Mexico | | | 622 | |
| Australia | | | 571 | |
| Turkey | | | 460 | |
| Japan | | | 432 | |
| Canada | | | 402 | |
| France | | | 259 | |
| Saudi Arabia | | | 176 | |
In 2015, Domino’s cut the ribbon on the Domino’s Event Center, a 10,000 square foot addition to the St. Jude campus in Memphis, Tenn., which was part of a $35 million donation pledge over the next eight years.
An excerpt. Shown here: 40 of 56 rewritten, all 11 added and all 9 removed. The counts are complete. For every sentence, read Item 1. Business. in the FY2017 filing and the FY2016 filing.
Item 3. Legal Proceedings.
4 rewritten, 13 added, 1 removed, 12 unchanged
Included in the ordinary course litigation matters referenced above, we are party to [removed: two] [added: three] employment practice cases and two casualty cases.
However, it is reasonably possible that our ultimate losses could exceed the amounts recorded by [removed: $2.0] [added: $6.9] million.
The plaintiff [removed: has] filed a [removed: writ of review] [added: Petition for Review] with the Supreme Court of the State of Texas.
The Company filed opposition to the writ of review and [added: asserted that] the [removed: matter is currently pending before] [added: claims were appropriately dismissed by] the [removed: Supreme] Court of [added: Appeals of] the State of Texas.
| --- | --- |
On February 14, 2011, Domino’s Pizza LLC was named as a defendant in a lawsuit along with Fischler Enterprises of C.F., Inc., a franchisee, and Jeffrey S.
Kidd, the franchisee’s delivery driver, filed by Yvonne Wiederhold, the plaintiff, as Personal Representative of the Estate of Richard E.
Wiederhold, deceased.
The case involved a traffic accident in which the franchisee’s delivery driver is alleged to have caused an accident involving a vehicle driven by Richard Wiederhold.
Mr. Wiederhold sustained spinal injuries resulting in quadriplegia and passed away several months after the accident.
The jury returned a $10.1 million judgment for the plaintiff where the Company and Mr. Kidd were found to be 90% liable (after certain offsets and other deductions the final verdict was $8.9 million).
In the second quarter of 2016, the trial court ruled on all post-judgment motions and entered the judgment.
The Company denies liability and in the third quarter of 2016 filed an appeal of the verdict on a variety of grounds.
In the second quarter of 2016, the Texas Supreme Court rejected the plaintiffs’ writ of certiorari, leaving the appellate court’s favorable decision to stand.
During the fourth quarter of 2016, the Plaintiff filed a petition for writ of certiorari with the United States Supreme Court.
In the fourth quarter of 2016, the United States Supreme Court denied the writ of certiorari.
Plaintiff has exhausted all appellate rights and the Texas Court of Appeals order dismissing all claims against Domino’s Pizza LLC stands.
The Company continues to deny liability in this matter and assert that the claims were appropriately dismissed by the Court of Appeals of the State of Texas.
Cover and table of contents
39 rewritten, 8 added, 6 removed, 49 unchanged
| [removed: x] [added: ☒] | ANNUAL REPORT PURSUANT TO SECTION 13 OR 15(d) OF THE SECURITIES EXCHANGE ACT OF 1934 |
For the fiscal year ended January [removed: 3, 2016][added: 1, 2017]
| [removed: ¨] [added: ☐] | TRANSITION REPORT PURSUANT TO SECTION 13 OR 15(d) OF THE SECURITIES EXCHANGE ACT OF 1934 |
| (State or other jurisdiction of [removed: incorporation or organization)] | | (I.R.S. Employer [removed: Identification No.)] |
| 30 Frank Lloyd Wright Drive [removed: Ann Arbor, Michigan] | | [removed: 48105] |
| Domino’s Pizza, Inc. [added: Common Stock, $0.01 par value] | | New York Stock Exchange |
Indicate by check mark if the registrant is a well-known seasoned issuer, as defined in Rule 405 of the Securities Act: Yes [removed: x] [added: ☒] No [removed: ¨][added: ☐]
Indicate by check mark if the registrant is not required to file reports pursuant to Section 13 or Section 15(d) of the Act: Yes [removed: ¨] [added: ☐] No [removed: x][added: ☒]
Indicate by check mark whether the registrant (1) has filed all reports required to be filed by Section 13 or 15(d) of the Securities Exchange Act of 1934 during the preceding 12 months (or for such shorter period that the registrant was required to file such reports), and (2) has been subject to such filing requirements for the past 90 days: Yes [removed: x] [added: ☒] No [removed: ¨][added: ☐]
Indicate by check mark whether the registrant has submitted electronically and posted on its corporate Web site, if any, every Interactive Data File required to be submitted and posted pursuant to Rule 405 of Regulation S-T (§232.405 of this chapter) during the preceding 12 months (or for such shorter period that the registrant was required to submit and post such files): Yes [removed: x] [added: ☒] No [removed: ¨][added: ☐]
Indicate by check mark if disclosure of delinquent filers pursuant to Item 405 of Regulation S-K (§229.405 of this chapter) is not contained herein, and will not be contained, to the best of registrant’s knowledge, in definitive proxy or information statements incorporated by reference in Part III of this Form 10-K or any amendment to this Form 10-K: [removed: x][added: ☒]
| Large accelerated filer | | [removed: x] [added: ☒] | | Accelerated filer | | [removed: ¨] [added: ☐] |
| Non-accelerated filer | | [removed: ¨] [added: ☐] (do not check if a smaller reporting company) | | Smaller reporting company | | [removed: ¨] [added: ☐] |
Indicate by check mark whether the registrant is a shell company (as defined in Rule 12b-2 of the Act): Yes [removed: ¨] [added: ☐] No [removed: x][added: ☒]
The aggregate market value of the voting and non-voting common stock held by non-affiliates of Domino’s Pizza, Inc. as of June [removed: 14, 2015] [added: 19, 2016] computed by reference to the closing price of Domino’s Pizza, Inc.’s common stock on the New York Stock Exchange on such date was [removed: $6,091,696,809.][added: $6,127,024,302.]
As of February [removed: 18, 2016,] [added: 21, 2017,] Domino’s Pizza, Inc. had [removed: 49,854,019] [added: 48,051,144] shares of common stock, par value $0.01 per share, outstanding.
Portions of the definitive proxy statement to be furnished to shareholders of Domino’s Pizza, Inc. in connection with the annual meeting of shareholders to be held on April [removed: 26, 2016] [added: 25, 2017] are incorporated by reference into Part III.
| Item 1. | | [removed: [Business.](#tx128680_2)] [added: [Business.](#tx350071_2)] | | | 2 | |
| Item 1A. | | [Risk [removed: Factors.](#tx128680_3)] [added: Factors.](#tx350071_3)] | | | 11 | |
| Item 1B. | | [Unresolved Staff [removed: Comments.](#tx128680_4)] [added: Comments.](#tx350071_4)] | | | [removed: 19] [added: 18] | |
| Item 2. | | [removed: [Properties.](#tx128680_5)] [added: [Properties.](#tx350071_5)] | | | [removed: 19] [added: 18] | |
| Item 3. | | [Legal [removed: Proceedings.](#tx128680_6)] [added: Proceedings.](#tx350071_6)] | | | 19 | |
| Item 4. | | [Mine Safety [removed: Disclosures.](#tx128680_7)] [added: Disclosures.](#tx350071_7)] | | | 19 | |
| Item 4A. | | [Executive Officers of the [removed: Registrant.](#tx128680_8)] [added: Registrant.](#tx350071_8)] | | | 19 | |
| Item 5. | | [Market for Registrant’s Common Equity, Related Stockholder Matters and Issuer Purchases of Equity [removed: Securities.](#tx128680_10)] [added: Securities.](#tx350071_10)] | | | 20 | |
| Item 6. | | [Selected Financial [removed: Data.](#tx128680_11)] [added: Data.](#tx350071_11)] | | | 22 | |
| Item 7. | | [Management’s Discussion and Analysis of Financial Condition and Results of [removed: Operations.](#tx128680_12)] [added: Operations.](#tx350071_12)] | | | 24 | |
| Item 7A. | | [Quantitative and Qualitative Disclosures About Market [removed: Risk.](#tx128680_13)] [added: Risk.](#tx350071_13)] | | | [removed: 39] [added: 40] | |
| Item 8. | | [Financial Statements and Supplementary [removed: Data.](#tx128680_14)] [added: Data.](#tx350071_14)] | | | [removed: 40] [added: 41] | |
| Item 9. | | [Changes in and Disagreements with Accountants on Accounting and Financial [removed: Disclosure.](#tx128680_15)] [added: Disclosure.](#tx350071_15)] | | | [removed: 72] [added: 73] | |
| Item 9A. | | [Controls and [removed: Procedures.](#tx128680_16)] [added: Procedures.](#tx350071_16)] | | | [removed: 72] [added: 73] | |
| Item 9B. | | [Other [removed: Information.](#tx128680_17)] [added: Information.](#tx350071_17)] | | | [removed: 72] [added: 73] | |
| [added: [Part III](#tx350071_18)] | | [removed: [Part III](#tx128680_18)] | | | | [added: [](#tx350071_18)] |
| Item 10. | | [Directors, Executive Officers and Corporate [removed: Governance.](#tx128680_19)] [added: Governance.](#tx350071_19)] | | | [removed: 73] [added: 74] | |
| Item 11. | | [Executive [removed: Compensation.](#tx128680_20)] [added: Compensation.](#tx350071_20)] | | | [removed: 76] [added: 77] | |
| Item 12. | | [Security Ownership of Certain Beneficial Owners and Management and Related Stockholder [removed: Matters.](#tx128680_21)] [added: Matters.](#tx350071_21)] | | | [removed: 76] [added: 77] | |
| Item 13. | | [Certain Relationships and Related Transactions, and Director [removed: Independence.](#tx128680_22)] [added: Independence.](#tx350071_22)] | | | [removed: 76] [added: 77] | |
| Item 14. | | [Principal Accountant Fees and [removed: Services.](#tx128680_23)] [added: Services.](#tx350071_23)] | | | [removed: 76] [added: 77] | |
| Item 15. | | [Exhibits, Financial Statement [removed: Schedules.](#tx128680_25)] [added: Schedules.](#tx350071_25)] | | | [removed: 77] [added: 78] | |
10-K 1 d350071d10k.htm FORM 10-K
| incorporation or organization) | | Identification No.) |
| Ann Arbor, Michigan | | 48105 |
| [Part I](#tx350071_1) | | | | | | [](#tx350071_1) |
| [Part II](#tx350071_9) | | | | | | [](#tx350071_9) |
| [Part IV](#tx350071_24) | | | | | | [](#tx350071_24) |
| Item 16. | | [Form 10-K Summary.](#tx350071_26) | | | 82 | |
| [SIGNATURES](#tx350071_27) | | | | | 88 | |
10-K 1 d128680d10k.htm 10-K
| Common Stock, $0.01 par value | | |
| | | [Part I](#tx128680_1) | | | | |
| | | [Part II](#tx128680_9) | | | | |
| | | [Part IV](#tx128680_24) | | | | |
| [SIGNATURES](#tx128680_26) | | | | | 87 | |
Item 1B. Unresolved Staff Comments.
0 rewritten, 1 added, 0 removed, 1 unchanged
| --- | --- |
Item 2. Properties.
1 rewritten, 2 added, 0 removed, 7 unchanged
We lease approximately [removed: 228,000] [added: 235,000] square feet for our World Resource Center located in Ann Arbor, Michigan under an operating lease with Domino’s Farms Office Park, L.L.C., an unrelated company.
| --- | --- |
##### [Table of Contents](#toc)
Item 4. Mine Safety Disclosures.
0 rewritten, 1 added, 0 removed, 1 unchanged
| --- | --- |
Item 4A. Executive Officers of the Registrant.
1 rewritten, 1 added, 0 removed, 3 unchanged
Directors, Executive Officers and Corporate Governance on pages [removed: 73 and 74,] [added: 75 through 77,] which is incorporated herein by reference.
| --- | --- |
Item 5. Market for Registrant’s Common Equity, Related Stockholder Matters and Issuer Purchases of Equity Securities.
11 rewritten, 11 added, 12 removed, 23 unchanged
As of February [removed: 18, 2016,] [added: 21, 2017,] Domino’s Pizza, Inc. had 170,000,000 authorized shares of common stock, par value $0.01 per share, of which [removed: 49,854,019] [added: 48,051,144] were issued and outstanding.
| [removed: 2014:] | | High | | | | Low | | | | Dividends Declared Per Share | | |
Our Board of Directors declared a quarterly dividend of [removed: $0.38] [added: $0.46] per common share on February [removed: 24, 2016] [added: 15, 2017] payable on March 30, [removed: 2016] [added: 2017] to shareholders of record at the close of business on March 15, [removed: 2016.][added: 2017.]
As of February [removed: 18, 2016,] [added: 21, 2017,] there were [removed: 1,162] [added: 1,306] registered holders of record of Domino’s Pizza, Inc.’s common stock.
We have a Board of Directors-approved share repurchase program for up to [removed: $800.0] [added: $250.0] million of our common stock, of which [removed: $200.0] [added: $149.1] million remained available at January [removed: 3, 2016] [added: 1, 2017] for future purchases of our common stock.
The following table summarizes our repurchase activity during the fourth quarter ended January [removed: 3, 2016:][added: 1, 2017:]
| Period | | Total Number of Shares Purchased (1) | | | | Average Price Paid per Share | | | | Total Number of Shares Purchased as Part of Publicly Announced [removed: Program (2)] [added: Program] | | | | Maximum Approximate Dollar Value of Shares that May Yet Be Purchased Under the Program | | |
| (1) | [removed: 4,976] [added: 3,939] shares were purchased as part of the Company’s employee stock purchase discount plan. During the fourth quarter, the shares were purchased at an average price of [removed: $107.94.] [added: $160.85.] |
The following comparative stock performance line graph compares the cumulative shareholder return on the common stock of Domino’s Pizza, Inc. for the five-year period between [removed: the close of trading on] December 31, [removed: 2010 through the close of trading on] [added: 2011 and] December 31, [removed: 2015 (the last trading day during fiscal 2015),] [added: 2016,] with cumulative total return on (i) the Total Return Index for the New York Stock Exchange (the “NYSE Composite Index”), (ii) the Standard & Poor’s 500 Index (the “S&P 500”) and (iii) the peer group, the Standard & Poor’s 400 Restaurant Index (the “S&P 400 Restaurant Index”).
The cumulative total return computations set forth in the performance graph assume the investment of $100 in the Company’s common stock, the NYSE Composite Index, the S&P 500 Index and the S&P 400 Restaurant Index on December 31, [removed: 2010.][added: 2011.]
[removed: 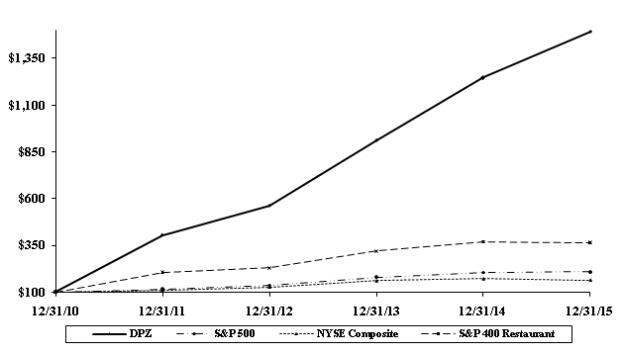][added: ]
| 2016: | | | | | | | | | | | | |
| First quarter (January 4, 2016 – March 27, 2016) | | $ | 134.39 | | | $ | 104.16 | | | $ | 0.38 | |
| Second quarter (March 28, 2016 – June 19, 2016) | | | 140.01 | | | | 118.56 | | | | 0.38 | |
| Third quarter (June 20, 2016 – September 11, 2016) | | | 151.00 | | | | 122.08 | | | | 0.38 | |
| Fourth quarter (September 12, 2016 – January 1, 2017) | | | 172.26 | | | | 149.66 | | | | 0.38 | |
| | | | | | | | | | | | | |
| Period #1 (September 12, 2016 to October 9, 2016) | | | — | | | $ | — | | | | — | | | $ | 165,531,424 | |
| Period #2 (October 10, 2016 to November 6, 2016) | | | 1,827 | | | | 151.85 | | | | — | | | | 165,531,424 | |
| Period #3 (November 7, 2016 to December 4, 2016) | | | 39,939 | | | | 160.57 | | | | 38,894 | | | | 159,295,327 | |
| Period #4 (December 5, 2016 to January 1, 2017) | | | 64,567 | | | | 160.07 | | | | 63,500 | | | | 149,139,484 | |
| Total | | | 106,333 | | | $ | 160.12 | | | | 102,394 | | | $ | 149,139,484 | |
| --- | --- |
| First quarter (December 30, 2013 – March 23, 2014) | | $ | 80.02 | | | $ | 67.17 | | | $ | 0.25 | |
| Second quarter (March 24, 2014 – June 15, 2014) | | | 78.62 | | | | 71.13 | | | | 0.25 | |
| Third quarter (June 16, 2014 – September 7, 2014) | | | 76.43 | | | | 70.17 | | | | 0.25 | |
| Fourth quarter (September 8, 2014 – December 28, 2014) | | | 95.93 | | | | 75.54 | | | | 0.25 | |
| Period #1 (September 7, 2015 to October 4, 2015) | | | — | | | | — | | | | — | | | $ | 159,367,567 | |
| Period #2 (October 5, 2015 to November 1, 2015) | | | 4,860,514 | (2) | | | 105.53 | (3) | | | 4,858,994 | (2) | | | 200,000,000 | |
| Period #3 (November 2, 2015 to November 29, 2015) | | | 2,108 | | | | 108.97 | | | | — | | | | 200,000,000 | |
| Period #4 (November 30, 2015 to January 3, 2016) | | | 1,348 | | | | 109.06 | | | | — | | | | 200,000,000 | |
| Total | | | 4,863,970 | | | $ | 107.94 | | | | 4,858,994 | | | $ | 200,000,000 | |
| (2) | As part of the 2015 Recapitalization, on October 23, 2015, the Company’s Board of Directors authorized a new share repurchase program to repurchase up to $800 million of the Company’s common stock. This share repurchase program replaced a previously existing $200 million share repurchase program. On October 27, 2015, the Company entered into a $600 million accelerated share repurchase agreement (the “ASR Agreement”) with a counterparty. Pursuant to the terms of the ASR Agreement, on October 30, 2015, the Company received and retired 4,858,994 shares of its common stock. At final settlement, which is expected to be completed by the end of the first quarter of 2016, the Company may receive additional shares of common stock, or, under certain circumstances, the Company may be required to deliver shares of its common stock or may elect to make a cash payment to the counterparty, based on the terms of the related ASR Agreement. The total number of shares ultimately delivered will be determined at the end of the applicable purchase period. |
| (3) | The average price paid per share of $105.53 for Period #2 (October 5, 2015 to November 1, 2015) excludes the average price paid per share for shares purchased under the ASR Agreement. Because the total number of shares ultimately delivered will not be determined until the end of the applicable purchase period, the average purchase price per share will not be determinable until the end of such period. |
Item 6. Selected Financial Data.
44 rewritten, 1 added, 2 removed, 36 unchanged
| | | Fiscal year ended [removed: (6)] [added: (5)] | | | | | | | | | | | | | | | | | | |
| (dollars in millions, except per share data) | | January [added: 1, 2017 | | | | January] 3, 2016 [removed: (4)] [added: (3)] | | | | December 28, 2014 | | | | December 29, 2013 | | | | December 30, 2012 [removed: (5) | | | | January 1, 2012] [added: (4)] | | |
| Domestic Company-owned stores | | $ | [removed: 396.9] [added: 439.0] | | | $ | [removed: 348.5] [added: 396.9] | | | $ | [removed: 337.4] [added: 348.5] | | | $ | [removed: 323.7] [added: 337.4] | | | $ | [removed: 336.3] [added: 323.7] | |
| Domestic franchise | | | [removed: 272.8] [added: 312.3] | | | | [removed: 230.2] [added: 272.8] | | | | [removed: 212.4] [added: 230.2] | | | | [removed: 195.0] [added: 212.4] | | | | [removed: 187.0] [added: 195.0] | |
| Domestic stores | | | [removed: 669.7] [added: 751.3] | | | | [removed: 578.7] [added: 669.7] | | | | [removed: 549.8] [added: 578.7] | | | | [removed: 518.7] [added: 549.8] | | | | [removed: 523.4] [added: 518.7] | |
| Supply chain | | | [removed: 1,383.2] [added: 1,544.3] | | | | [removed: 1,262.5] [added: 1,383.2] | | | | [removed: 1,118.9] [added: 1,262.5] | | | | [removed: 1,039.8] [added: 1,118.9] | | | | [removed: 1,021.0] [added: 1,039.8] | |
| International franchise | | | [removed: 163.6] [added: 177.0] | | | | [removed: 152.6] [added: 163.6] | | | | [removed: 133.6] [added: 152.6] | | | | [removed: 120.0] [added: 133.6] | | | | [removed: 107.8] [added: 120.0] | |
| Total revenues | | | [removed: 2,216.5] [added: 2,472.6] | | | | [removed: 1,993.8] [added: 2,216.5] | | | | [removed: 1,802.2] [added: 1,993.8] | | | | [removed: 1,678.4] [added: 1,802.2] | | | | [removed: 1,652.2] [added: 1,678.4] | |
| Cost of sales | | | [removed: 1,533.4] [added: 1,704.9] | | | | [removed: 1,399.1] [added: 1,533.4] | | | | [removed: 1,253.2] [added: 1,399.1] | | | | [removed: 1,177.1] [added: 1,253.2] | | | | [removed: 1,181.7] [added: 1,177.1] | |
| Operating margin | | | [removed: 683.1] [added: 767.7] | | | | [removed: 594.8] [added: 683.1] | | | | [removed: 549.0] [added: 594.8] | | | | [removed: 501.3] [added: 549.0] | | | | [removed: 470.5] [added: 501.3] | |
| General and administrative expense | | | [removed: 277.7] [added: 313.6] | | | | [removed: 249.4] [added: 277.7] | | | | [removed: 235.2] [added: 249.4] | | | | [removed: 219.0] [added: 235.2] | | | | [removed: 211.4] [added: 219.0] | |
| Income from operations | | | [removed: 405.4] [added: 454.0] | | | | [removed: 345.4] [added: 405.4] | | | | [removed: 313.8] [added: 345.4] | | | | [removed: 282.3] [added: 313.8] | | | | [removed: 259.1] [added: 282.3] | |
| Interest income | | | [removed: 0.3] [added: 0.7] | | | | [removed: 0.1] [added: 0.3] | | | | [removed: 0.2] [added: 0.1] | | | | [removed: 0.3] [added: 0.2] | | | | 0.3 | |
| Interest expense | | | [removed: (99.5] [added: (110.1] | ) | | | [removed: (86.9] [added: (99.5] | ) | | | [removed: (88.9] [added: (86.9] | ) | | | [removed: (101.4] [added: (88.9] | ) | | | [removed: (91.6] [added: (101.4] | ) |
| Income before provision for income taxes | | | [removed: 306.2] [added: 344.7] | | | | [removed: 258.6] [added: 306.2] | | | | [removed: 225.1] [added: 258.6] | | | | [removed: 181.2] [added: 225.1] | | | | [removed: 167.8] [added: 181.2] | |
| Provision for income taxes | | | [removed: 113.4] [added: 130.0] | | | | [removed: 96.0] [added: 113.4] | | | | [removed: 82.1] [added: 96.0] | | | | [removed: 68.8] [added: 82.1] | | | | [removed: 62.4] [added: 68.8] | |
| Net income | | $ | [removed: 192.8] [added: 214.7] | | | $ | [removed: 162.6] [added: 192.8] | | | $ | [removed: 143.0] [added: 162.6] | | | $ | [removed: 112.4] [added: 143.0] | | | $ | [removed: 105.4] [added: 112.4] | |
| Common stock – basic | | $ | [removed: 3.58] [added: 4.41] | | | $ | [removed: 2.96] [added: 3.58] | | | $ | [removed: 2.58] [added: 2.96] | | | $ | [removed: 1.99] [added: 2.58] | | | $ | [removed: 1.79] [added: 1.99] | |
| Common stock – diluted | | | [removed: 3.47] [added: 4.30] | | | | [removed: 2.86] [added: 3.47] | | | | [removed: 2.48] [added: 2.86] | | | | [removed: 1.91] [added: 2.48] | | | | [removed: 1.71] [added: 1.91] | |
| Dividends declared per share | | $ | [removed: 1.24] [added: 1.52] | | | $ | [removed: 1.00] [added: 1.24] | | | $ | [removed: 0.80] [added: 1.00] | | | $ | [removed: 3.00] [added: 0.80] | | | $ | [removed: —] [added: 3.00] | |
| Cash and cash equivalents | | $ | [removed: 133.4] [added: 42.8] | | | $ | [removed: 30.9] [added: 133.4] | | | $ | [removed: 14.4] [added: 30.9] | | | $ | [removed: 54.8] [added: 14.4] | | | $ | [removed: 50.3] [added: 54.8] | |
| Restricted cash and cash equivalents | | | [removed: 180.9] [added: 126.5] | | | | [removed: 121.0] [added: 180.9] | | | | [removed: 125.5] [added: 121.0] | | | | [removed: 60.0] [added: 125.5] | | | | [removed: 92.6] [added: 60.0] | |
| Working capital (1) | | | [added: (34.3 | ) | | |] 45.7 | | | | 41.8 | | | | (28.5 | ) | | | 16.8 | | [removed: | | 37.1 | |]
| Total assets [removed: (2)] | | | [removed: 799.8] [added: 716.3] | | | | [removed: 596.3] [added: 799.8] | | | | [removed: 496.6] [added: 596.3] | | | | [removed: 443.4] [added: 496.6] | | | | [removed: 464.4] [added: 443.4] | |
| Total debt [removed: less] net [added: of] debt issuance cost [removed: (2)] | | | [removed: 2,240.8] [added: 2,187.9] | | | | [removed: 1,500.6] [added: 2,240.8] | | | | [removed: 1,507.7] [added: 1,500.6] | | | | [removed: 1,526.0] [added: 1,507.7] | | | | [removed: 1,435.2] [added: 1,526.0] | |
| Total stockholders’ deficit | | | [removed: (1,800.3] [added: (1,883.1] | ) | | | [removed: (1,219.5] [added: (1,800.3] | ) | | | [removed: (1,290.2] [added: (1,219.5] | ) | | | [removed: (1,335.5] [added: (1,290.2] | ) | | | [removed: (1,209.7] [added: (1,335.5] | ) |
| (dollars in millions) | | January [added: 1, 2017 | | | | January] 3, [removed: 2016(4)] [added: 2016(3)] | | | | December 28, 2014 | | | | December 29, 2013 | | | | December 30, 2012 [removed: (5) | | | | January 1, 2012] [added: (4)] | | |
| Depreciation and amortization | | $ | [removed: 32.4] [added: 38.1] | | | $ | [removed: 35.8] [added: 32.4] | | | $ | [removed: 25.8] [added: 35.8] | | | $ | [removed: 23.2] [added: 25.8] | | | $ | [removed: 24.0] [added: 23.2] | |
| Capital expenditures | | | [removed: 62.4] [added: 61.5] | | | | [removed: 71.8] [added: 62.4] | | | | [removed: 40.4] [added: 71.8] | | | | [removed: 29.3] [added: 40.4] | | | | [removed: 24.3] [added: 29.3] | |
| Same store sales growth [removed: (3):] [added: (2):] | | | | | | | | | | | | | | | | | | | | |
| Domestic Company-owned stores | | | [removed: 12.2] [added: 10.4] | % | | | [removed: 6.2] [added: 12.2] | % | | | [removed: 3.9] [added: 6.2] | % | | | [removed: 1.3] [added: 3.9] | % | | | [removed: 4.1] [added: 1.3] | % |
| Domestic franchise stores | | | [removed: 11.9] [added: 10.5] | % | | | [removed: 7.7] [added: 11.9] | % | | | [removed: 5.5] [added: 7.7] | % | | | [removed: 3.2] [added: 5.5] | % | | | [removed: 3.4] [added: 3.2] | % |
| Domestic stores | | | [removed: 12.0] [added: 10.5] | % | | | [removed: 7.5] [added: 12.0] | % | | | [removed: 5.4] [added: 7.5] | % | | | [removed: 3.1] [added: 5.4] | % | | | [removed: 3.5] [added: 3.1] | % |
| International stores | | | [removed: 7.8] [added: 6.3] | % | | | [removed: 6.9] [added: 7.8] | % | | | [removed: 6.2] [added: 6.9] | % | | | [removed: 5.2] [added: 6.2] | % | | | [removed: 6.8] [added: 5.2] | % |
| Domestic Company-owned stores | | | [removed: 384] [added: 392] | | | | [removed: 377] [added: 384] | | | | [removed: 390] [added: 377] | | | | [removed: 388] [added: 390] | | | | [removed: 394] [added: 388] | |
| Domestic franchise stores | | | [removed: 4,816] [added: 4,979] | | | | [removed: 4,690] [added: 4,816] | | | | [removed: 4,596] [added: 4,690] | | | | [removed: 4,540] [added: 4,596] | | | | [removed: 4,513] [added: 4,540] | |
| Domestic stores | | | [removed: 5,200] [added: 5,371] | | | | [removed: 5,067] [added: 5,200] | | | | [removed: 4,986] [added: 5,067] | | | | [removed: 4,928] [added: 4,986] | | | | [removed: 4,907] [added: 4,928] | |
| International stores | | | [removed: 7,330] [added: 8,440] | | | | [removed: 6,562] [added: 7,330] | | | | [removed: 5,900] [added: 6,562] | | | | [removed: 5,327] [added: 5,900] | | | | [removed: 4,835] [added: 5,327] | |
| Total stores | | | [removed: 12,530] [added: 13,811] | | | | [removed: 11,629] [added: 12,530] | | | | [removed: 10,886] [added: 11,629] | | | | [removed: 10,255] [added: 10,886] | | | | [removed: 9,742] [added: 10,255] | |
| (1) | The working capital amounts exclude restricted cash amounts of [added: $126.5 million in 2016,] $180.9 million in 2015, $121.0 million in 2014, $125.5 million in [removed: 2013, $60.0 million in 2012] [added: 2013] and [removed: $92.6] [added: $60.0] million in [removed: 2011.] [added: 2012.] |
| | | Fiscal year ended (5) | | | | | | | | | | | | | | | | | | |
| | | | | | | | | | | | | | | | | | | | | |
| (2) | In April 2015, the Financial Accounting Standards Board (“FASB”) issued Accounting Standards Update 2015-03, _Simplifying the Presentation of Debt Issuance Costs_, (“ASU 2015-03”). ASU 2015-03 requires that debt issuance costs be presented as a direct deduction from the carrying amount of the related debt liability, consistent with the presentation of debt discounts. Prior to the issuance of ASU 2015-03, debt issuance costs were required to be presented as deferred charge assets, separate from the related debt liability. Further discussion on the impact of ASU 2015-03 is included below within the “New Accounting Pronouncement” section. The Company early-adopted ASU 2015-03 as of the end of its fiscal 2015, and applied its provisions retrospectively. The adoption of ASU 2015-03 resulted in the reclassification of $27.9 million and $22.9 million of unamortized debt issuance costs related to the Company’s fixed rate notes from other non-current assets to long-term debt within its consolidated balance sheets as of both January 3, 2016 and December 28, 2014, respectively (refer to Note 4 of the financial statements for additional detail). Total assets for the years ended December 29, 2013, December 30, 2012, and January 1, 2012 were also reduced by unamortized debt issuance costs of $28.7 million, $34.8 million and $16.1 million, respectively, as a result of the adoption of this standard for a consistent presentation. |
An excerpt. Shown here: 40 of 44 rewritten, all 1 added and all 2 removed. The counts are complete. For every sentence, read Item 6. Selected Financial Data. in the FY2017 filing and the FY2016 filing.
Item 8. Financial Statements and Supplementary Data.
325 rewritten, 156 added, 99 removed, 704 unchanged
In our opinion, the consolidated financial statements listed in the index appearing under Item 15(a)(1) present fairly, in all material respects, the financial position of Domino’s Pizza, Inc. and its subsidiaries at January [removed: 3, 2016] [added: 1, 2017] and [removed: December 28, 2014,] [added: January 3, 2016,] and the results of their operations and their cash flows for each of the three years in the period ended January [removed: 3, 2016] [added: 1, 2017] in conformity with accounting principles generally accepted in the United States of America.
Also in our opinion, the Company maintained, in all material respects, effective internal control over financial reporting as of January [removed: 3, 2016,] [added: 1, 2017,] based on criteria established in Internal Control – Integrated Framework (2013) issued by the Committee of Sponsoring Organizations of the Treadway Commission (COSO).
| | | January [added: 1, | | | | January] 3, [removed: 2016] | | | | December 28, [removed: 2014] | | |
| Cash and cash equivalents | | $ | [removed: 133,449] [added: 42,815] | | | $ | [removed: 30,855] [added: 133,449] | |
| Restricted cash and cash equivalents | | | [removed: 180,940] [added: 126,496] | | | | [removed: 120,954] [added: 180,940] | |
| Accounts receivable, net of reserves of [removed: $2,662] [added: $2,342] in [removed: 2015] [added: 2016] and [removed: $3,361] [added: $2,662] in [removed: 2014] [added: 2015] | | | [removed: 131,582] [added: 150,369] | | | | [removed: 118,395] [added: 131,582] | |
| Inventories | | | [removed: 36,861] [added: 40,181] | | | | [removed: 37,944] [added: 36,861] | |
| Prepaid expenses and other | | | [removed: 20,646] [added: 17,635] | | | | [removed: 32,569] [added: 20,646] | |
| Advertising fund assets, restricted | | | [removed: 99,159] [added: 118,377] | | | | [removed: 72,055] [added: 99,159] | |
| Deferred income taxes | | | [removed: —] [added: 8,935] | | | | [removed: 9,857] [added: 5,865] | |
| Total current assets | | | [removed: 602,637] [added: 495,873] | | | | [removed: 428,361] [added: 602,637] | |
| Land and buildings | | | [removed: 29,064] [added: 29,129] | | | | [removed: 25,859] [added: 29,064] | |
| Leasehold and other improvements | | | [removed: 111,071] [added: 120,726] | | | | [removed: 99,804] [added: 111,071] | |
| Equipment | | | [removed: 186,405] [added: 201,827] | | | | [removed: 178,378] [added: 186,405] | |
| Construction in progress | | | [removed: 9,633] [added: 7,816] | | | | [removed: 6,179] [added: 9,633] | |
| Accumulated depreciation and amortization | | | [removed: (204,283] [added: (220,964] | ) | | | [removed: (196,174] [added: (204,283] | ) |
| Property, plant and equipment, net | | | [removed: 131,890] [added: 138,534] | | | | [removed: 114,046] [added: 131,890] | |
| Investments in marketable securities, restricted | | | [removed: 6,054] [added: 7,260] | | | | [removed: 4,586] [added: 6,054] | |
| Goodwill | | | [removed: 16,097] [added: 16,058] | | | | [removed: 16,297] [added: 16,097] | |
| Capitalized software, net of accumulated amortization of [removed: $61,330] [added: $68,727] in [removed: 2015] [added: 2016] and [removed: $54,552] [added: $61,330] in [removed: 2014] [added: 2015] | | | [removed: 28,505] [added: 40,256] | | | | [removed: 20,562] [added: 28,505] | |
| Other assets, net of accumulated amortization of $776 in [removed: 2015] [added: 2016] and $776 in [removed: 2014] [added: 2015] | | | [removed: 8,797] [added: 9,379] | | | | [removed: 10,006] [added: 8,797] | |
| [removed: Deferred] [added: Net deferred] income taxes | | [added: $] | [removed: 5,865] [added: 8,935] | | | [added: $] | [removed: 2,475] [added: 5,865] | |
| Total other assets | | | [removed: 65,318] [added: 81,888] | | | | [removed: 53,926] [added: 65,318] | |
| Total assets | | $ | [removed: 799,845] [added: 716,295] | | | $ | [removed: 596,333] [added: 799,845] | |
| Current portion of long-term debt | | $ | [removed: 59,333] [added: 38,887] | | | $ | [removed: 565] [added: 59,333] | |
| Accounts payable | | | [removed: 106,927] [added: 111,510] | | | | [removed: 86,552] [added: 106,927] | |
| Accrued compensation | | | [removed: 32,999] [added: 42,089] | | | | [removed: 23,618] [added: 32,999] | |
| Accrued interest | | | [removed: 20,459] [added: 18,826] | | | | [removed: 14,008] [added: 20,459] | |
| Insurance reserves | | | [removed: 17,597] [added: 16,742] | | | | [removed: 14,465] [added: 17,597] | |
| Advertising fund liabilities | | | [removed: 99,159] [added: 118,377] | | | | [removed: 72,055] [added: 99,159] | |
| Other accrued liabilities | | | [removed: 38,952] [added: 57,267] | | | | [removed: 39,994] [added: 39,509] | |
| Total current liabilities | | | [removed: 375,983] [added: 403,698] | | | | [removed: 265,608] [added: 375,983] | |
| Long-term debt, less current portion | | | [removed: 2,181,460] [added: 2,148,990] | | | | [removed: 1,500,599] [added: 2,181,460] | |
| Insurance reserves | | | [removed: 23,314] [added: 27,141] | | | | [removed: 26,951] [added: 23,314] | |
| Other accrued liabilities | | | [removed: 19,339] [added: 19,609] | | | | [removed: 17,052] [added: 19,339] | |
| Total long-term liabilities | | | [removed: 2,224,113] [added: 2,195,740] | | | | [removed: 1,550,190] [added: 2,224,113] | |
| Total liabilities | | | [removed: 2,600,096] [added: 2,599,438] | | | | [removed: 1,815,798] [added: 2,600,096] | |
| Common stock, par value $0.01 per share; 170,000,000 shares authorized; [removed: 49,838,221] [added: 48,100,143] in [removed: 2015] [added: 2016] and [removed: 55,553,149] [added: 49,838,221] in [removed: 2014] [added: 2015] issued and outstanding | | | [removed: 498] [added: 481] | | | | [removed: 556] [added: 498] | |
| Additional paid-in capital | | | [removed: 6,942] [added: 1,006] | | | | [removed: 29,561] [added: 6,942] | |
| Retained deficit | | | [removed: (1,804,143] [added: (1,881,520] | ) | | | [removed: (1,246,921] [added: (1,804,143] | ) |
February 28, 2017
| | | January 1, 2017 | | | | January 3, 2016 | | |
| | | | 359,498 | | | | 336,173 | |
| | | January 1, 2017 | | | | January 3, 2016 | | |
| | | 2017 | | | | 2016 | | | | 2014 | | |
| | | 2017 | | | | 2016 | | | | 2014 | | |
| NET INCOME | | $ | 214,678 | | | $ | 192,789 | | | $ | 162,587 | |
| | | Common Stock | | | | | | | | | | | | | | | | | | |
| Net income | | | — | | | | — | | | | — | | | | 214,678 | | | | — | |
| Purchases of common stock | | | (2,816,716 | ) | | | (28 | ) | | | (82,125 | ) | | | (218,097 | ) | | | — | |
| Exercises of stock options | | | 1,045,648 | | | | 10 | | | | 15,224 | | | | — | | | | — | |
| BALANCE AT JANUARY 1, 2017 | | | 48,100,143 | | | $ | 481 | | | $ | 1,006 | | | $ | (1,881,520 | ) | | $ | (3,110 | ) |
| | | January 1, | | | | January 3, | | | | December 28, | | |
| | | 2017 | | | | 2016 | | | | 2014 | | |
| Net income | | $ | 214,678 | | | $ | 192,789 | | | $ | 162,587 | |
Restricted cash at January 1, 2017 includes $99.8 million of cash held for future principal and interest payments and $26.7 million of cash held in a three-month interest reserve.
| | | 2016 | | | | 2015 | | |
In connection with the 2015 Recapitalization, the Company wrote-off approximately $6.9 million of these costs in connection with the extinguishment of $551.3 million of the 2012 Fixed Rate Notes (Note 4).
The Company also received $2.0 million, $1.8 million, and $0.9 million from franchisees for software licenses and software development work during 2016, 2015 and 2014, respectively.
In August 2014, the Financial Accounting Standards Board (“FASB”) issued Accounting Standard Update (“ASU”) 2014-15, _Presentation of Financial Statements – Going Concern (Subtopic 205-40): Disclosure of Uncertainties about an Entity’s Ability to Continue as a Going Concern_.
ASU 2014-15 requires management to evaluate, at each interim and annual reporting period, whether there are conditions or events that raise substantial doubt about the entity’s ability to continue as a going concern within one year after the date the financial statements are issued, and provide related disclosures.
ASU 2014-15 is effective for the annual period ending after December 15, 2016, and for annual periods and interim periods thereafter.
The Company has completed its evaluation as of January 1, 2017, and concluded that there are no conditions or events that raise substantial doubt about the entity’s ability to continue as a going concern under ASU 2014-15.
ASU 2016-02 requires a lessee to recognize assets and liabilities on the balance sheet for leases with lease terms greater than 12 months.
ASU 2016-02 is effective for fiscal years, and interim periods within those years, beginning after December 15, 2018, and early adoption is permitted.
Based on a preliminary assessment, the Company expects the adoption of this guidance to have a material impact on its assets and liabilities due to the recognition of right-of-use assets and lease liabilities on its consolidated balance sheets at the beginning of the earliest period presented.
The Company is continuing its assessment, which may identify additional impacts this guidance will have on its consolidated financial statements and disclosures.
In March 2016, the FASB issued ASU 2016-04, _Liabilities – Extinguishment of Liabilities (Subtopic 405-20): Recognition of Breakage for Certain Prepaid Stored-Value Products_.
ASU 2016-04 aligns recognition of the financial liabilities related to prepaid stored-value products (for example, gift cards) with Topic 606, _Revenues from Contracts with Customers_, for non-financial liabilities.
In general, these liabilities may be extinguished proportionately in earnings as redemptions occur, or when redemption is remote if issuers are not entitled to the unredeemed stored value.
ASU 2016-04 is effective for fiscal years, and interim periods within those years, beginning after December 15, 2017, and early adoption is permitted.
In March 2016, the FASB issued ASU 2016-09, _Compensation – Stock Compensation (Topic 718): Improvements to Employee Share-Based Payment Accounting_.
ASU 2016-09 is intended to simplify several areas of accounting for share-based compensation arrangements, including the income tax impact, classification on the statement of cash flows and forfeitures.
The update is effective for fiscal years, and interim periods within those years, beginning after December 15, 2016, and early adoption is permitted.
Based on a preliminary assessment, the Company expects the initial adoption of this guidance to not be material to its consolidated financial statements.
Subsequent to adoption, the impact of the standard will be dependent on a number of factors, including the market value per share of the Company’s common stock at restricted stock vesting dates and the number of stock options that are exercised, as excess tax benefits or deficiencies will be reflected in the consolidated statements of income as a component of the provision for income taxes.
The Company expects that the subsequent impact of adoption of this guidance will likely be material to the Company’s consolidated financial statements.
In March 2016, the FASB issued ASU 2016-08, _Revenue from Contracts with Customers (Topic 606): Principal versus Agent Considerations (Reporting Revenue Gross versus Net)_.
In April 2016, the FASB issued ASU 2016-10, _Revenue from Contracts with Customers (Topic 606): Identifying Performance Obligations and Licensing_.
In May 2016, the FASB issued ASU 2016-12, _Revenue from Contracts with Customers (Topic 606): Narrow-Scope Improvements and Practical Expedients_ and ASU 2016-11, _Revenue Recognition (Topic 605) and Derivatives and Hedging (Topic 815): Rescission of SEC Guidance Because of Accounting Standards Updates 2014-09 and 2014-16 Pursuant to Staff Announcements at the March_ _3, 2016 EITF Meeting_.
As discussed in Note 1 to the consolidated financial statements, the Company changed the manner in which it accounts for the classification of debt issuance costs and deferred tax assets and liabilities.
February 25, 2016
| | | | | | | | | |
| --- | --- | --- | --- | --- | --- | --- | --- | --- |
| Asset held-for-sale | | | — | | | | 5,732 | |
| | | | 336,173 | | | | 310,220 | |
| Dividends payable | | | 557 | | | | 14,351 | |
| Deferred income taxes | | | — | | | | 5,588 | |
| | | | | | | | | | | | | |
| --- | --- | --- | --- | --- | --- | --- | --- | --- | --- | --- | --- | --- |
| | | | | | | | | | | | | | | | | | | | | |
| BALANCE AT DECEMBER 30, 2012 | | | 56,313,249 | | | $ | 563 | | | $ | 1,664 | | | $ | (1,335,364 | ) | | $ | (2,386 | ) |
| Net income | | | — | | | | — | | | | — | | | | 142,985 | | | | — | |
| Purchase of common stock | | | (1,666,435 | ) | | | (16 | ) | | | (44,240 | ) | | | (52,876 | ) | | | — | |
| Exercise of stock options | | | 928,464 | | | | 9 | | | | 9,442 | | | | — | | | | — | |
Restricted cash at December 28, 2014 included $56.2 million of cash held for future principal and interest payments, $20.8 million of cash held in a three month interest reserve, $43.9 million of cash held as collateral for outstanding letters of credit and $0.1 million of other restricted cash.
Asset Held-for-Sale
During the third quarter of 2014, the Company’s Board of Directors approved the sale of the existing corporate airplane, which the Company began actively marketing in the fourth quarter of 2014.
As a result of these actions, the Company met held-for-sale criteria and classified the asset as held for sale at December 28, 2014.
In the first quarter of 2015, the Company sold the asset for approximately $5.7 million.
| | | |
The third quarter 2015 dividend of approximately $15.3 million was paid to shareholders on December 30, 2015, which is also included in fiscal 2015.
In May 2014, the Financial Accounting Standards Board (“FASB”) issued Accounting Standards Update (“ASU”) 2014-09, _Revenue from Contracts with Customers_ (“ASU 2014-09”).
This guidance outlines a single, comprehensive model for entities to use in accounting for revenue arising from contracts with customers and supersedes most current revenue recognition guidance issued by the FASB, including industry specific guidance.
In August 2015 the FASB issued ASU 2015-14 which defers the effective date of ASU 2014-09 one year making it effective for annual reporting periods beginning or after December 15, 2017 while also providing for early adoption but not before the original effective date.
ASU 2015-02 amends current consolidation guidance by modifying the evaluation of whether limited partnerships and similar legal entities are variable interest entities or voting interest entities, eliminating the presumption that a general partner should consolidate a limited partnership, and affects the consolidation analysis of reporting entities that are involved with variable interest entities.
All legal entities are subject to reevaluation under the revised consolidation model.
The adoption of ASU 2015-02 is not expected to have a material impact on the Company’s consolidated financial position, results of operations or cash flows.
In April 2015, the FASB issued ASU 2015-03, _Simplifying the Presentation of Debt Issuance Costs_, (“ASU 2015-03”).
ASU 2015-03 requires that debt issuance costs be presented as a direct deduction from the carrying amount of the related debt liability, consistent with the presentation of debt discounts.
Prior to the issuance of ASU 2015-03, debt issuance costs were required to be presented as deferred charge assets, separate from the related debt liability.
ASU 2015-03 does not change the recognition and measurement requirements for debt issuance costs.
The Company early-adopted ASU 2015-03 as of the end of fiscal 2015, and applied its provisions retrospectively.
The adoption of ASU 2015-03 resulted in the reclassification of $27.9 million and $22.9 million of unamortized debt issuance costs related to the Company’s Fixed Rate Notes from other non-current assets to long-term debt within its consolidated balance sheets as of both January 3, 2016 and December 28, 2014, respectively (refer to Note 4 of the financial statements for additional detail).
In November 2015, the FASB issued ASU 2015-17, _Balance Sheet Classification of Deferred Taxes_, (“ASU 2015-17”).
ASU 2015-17 simplifies the presentation of deferred taxes by requiring deferred tax assets and liabilities be classified as noncurrent on the balance sheet.
The guidance may be adopted prospectively or retrospectively and early adoption is permitted.
During the fourth quarter of fiscal 2015, the Company elected to early adopt the pronouncement on a prospective basis.
Adoption of this amendment did not have a material impact on the Company’s financial position or results of operations, and prior periods were not retrospectively adjusted.
| | | At December 28, 2014 | | | | | | | | | | | | | | |
An excerpt. Shown here: 40 of 325 rewritten, 40 of 156 added and 40 of 99 removed. The counts are complete. For every sentence, read Item 8. Financial Statements and Supplementary Data. in the FY2017 filing and the FY2016 filing.
Item 9A. Controls and Procedures.
6 rewritten, 0 added, 1 removed, 8 unchanged
[removed: |] (a) [removed: |] Evaluation of Disclosure Controls and Procedures. [removed: |]
[removed: |] (b) [removed: |] Changes in Internal Control over Financial Reporting. [removed: |]
[removed: |] (c) [removed: |] Management’s Annual Report on Internal Control over Financial Reporting. [removed: |]
Under the supervision and with the participation of the Company’s management, including its Chief Executive Officer and Chief Financial Officer, the Company conducted an evaluation of the effectiveness of its internal control over financial reporting as of January [removed: 3, 2016] [added: 1, 2017] based on the framework in _Internal [removed: Control —] [added: Control_ _—] Integrated Framework (2013)_ issued by the Committee of Sponsoring Organizations of the Treadway Commission.
Based on that evaluation, management concluded that its internal control over financial reporting was effective as of January [removed: 3, 2016.][added: 1, 2017.]
The effectiveness of the Company’s internal control over financial reporting as of January [removed: 3, 2016,] [added: 1, 2017,] has been audited by PricewaterhouseCoopers LLP, an independent registered public accounting firm, as stated in their report which appears herein.
| --- | --- |
Item 9B. Other Information.
0 rewritten, 1 added, 4 removed, 3 unchanged
None.
As previously reported on a Current Report on Form 8-K filed with the Securities and Exchange Commission (the “SEC”), on April 22, 2015, our stockholders approved a proposal to amend our Second Restated Certificate of Incorporation to declassify our Board of Directors.
The related Certificate of Amendment to our Second Restated Certificate of Incorporation, dated June 16, 2015, was filed as Exhibit 3.2 to our Quarterly Report on Form 10-Q for the period ended June 14, 2015, as filed with the SEC on July 16, 2015.
On February 24, 2016, our Board of Directors approved, effective immediately, the Second Amended and Restated By-Laws (the “By-Laws”) to implement conforming changes to the By-Laws in light of the declassification of the Board, including the deletion of Sections 3.3 and 3.5 and revisions to Section 3.13 (previously Section 3.15) to allow for the removal of directors with or without cause.
The foregoing description of the By-Laws, as amended and restated, is qualified in its entirety by reference to the full text of the By-Laws, a copy of which is filed as Exhibit 3.3 hereto and incorporated herein by reference.
Item 10. Directors, Executive Officers and Corporate Governance.
50 rewritten, 14 added, 19 removed, 78 unchanged
| David A. Brandon | | [removed: 63] [added: 64] | | Chairman of the Board of Directors |
| J. Patrick Doyle | | [removed: 52] [added: 53] | | President, Chief Executive Officer and Director |
| Jeffrey D. Lawrence | | [removed: 42] [added: 43] | | [removed: Chief Financial Officer and] Executive Vice President, [removed: Finance] [added: Chief Financial Officer] |
| Eric B. Anderson | | [removed: 43] [added: 44] | | Executive Vice President, International Operations |
| Richard E. Allison, Jr. | | [removed: 49] [added: 50] | | President, [added: Domino’s] International |
| Troy A. Ellis | | [removed: 50] [added: 51] | | Executive Vice President, Supply Chain Services |
| Stanley J. Gage | | [removed: 49] [added: 50] | | Executive Vice President, Team USA |
| Scott R. Hinshaw | | [removed: 53] [added: 54] | | Executive Vice President, Franchise Operations and Development |
| [removed: Lynn M. Liddle] [added: Timothy P. McIntyre] | | [removed: 59] [added: 54] | | Executive Vice President, [removed: Communications,] [added: Communication,] Investor [removed: Relations,] [added: Relations and] Legislative Affairs |
| [removed: Kenneth B. Rollin] [added: Kevin S. Morris] | | [removed: 49] [added: 56] | | Executive Vice President, General Counsel |
| J. Kevin Vasconi | | [removed: 55] [added: 56] | | Executive Vice President, Chief Information Officer |
| Russell J. Weiner | | [removed: 47] [added: 48] | | President, Domino’s USA |
| Judith L. Werthauser | | [removed: 50] [added: 51] | | Executive Vice President, [removed: PeopleFirst] [added: Chief People Officer] |
| C. Andrew Ballard | | [removed: 43] [added: 44] | | Director |
| Andrew B. Balson | | [removed: 49] [added: 50] | | Director |
| Diana F. Cantor | | [removed: 58] [added: 59] | | Director |
| Richard L. Federico | | [removed: 61] [added: 62] | | Director |
| James A. Goldman | | [removed: 57] [added: 58] | | Director |
| Gregory A. Trojan | | [removed: 56] [added: 57] | | Director |
Mr. Brandon [removed: has served as our Chairman of the Board of Directors since March 1999 and] also served as Chief Executive Officer from March 1999 to March 2010.
Mr. Doyle serves on the Board of Directors of Best Buy Co., Inc. and also previously served on the [removed: Boards] [added: Board] of Directors of G&K Services, Inc.
Lawrence_ has served as [removed: Chief Financial Officer and] Executive Vice President [added: and Chief Financial Officer] since August 2015.
In 2012, he took over as [removed: regional vice president] [added: Regional Vice President] of Domino’s EMEA (Europe, Middle East, and [removed: Africa) region.][added: Africa).]
Prior to joining Domino’s, [added: Mr.] Anderson was a leader in the restaurant and retail practice of Bain & Company, a global strategic consulting firm, where he was also a founding member of Bain’s Corporate Renewal Group, a specialized turnaround management group that led hands-on turnarounds of distressed companies.
Allison, Jr._ has served as our President, [added: Domino’s] International since October 2014.
Prior to joining Coca-Cola, he worked for [added: PepsiCo and] Kimberly Clark [removed: Corp. and PepsiCo,] [added: Corp.,] after serving in the U.S. Army from 1988-1991.
[removed: Rollin_] [added: Morris_] has served as our Executive Vice President, General Counsel since January [removed: 2008.][added: 2017.]
Mr. [removed: Stansik] [added: McIntyre] joined Domino’s in 1985.
Werthauser_ has served as Executive Vice [removed: President, PeopleFirst] [added: President and Chief People Officer] since January 2016.
Ms. Werthauser previously served as Senior Vice President of [removed: HR] [added: Human Resources] at Target Corp. She joined Target in 2008, holding increasing levels of [removed: HR] [added: human resources] responsibilities there.
Prior to Target, Werthauser was Senior Vice President of [removed: HR] [added: Human Resources] for U.S. Bancorp in Minneapolis.
She also held several senior [removed: HR] [added: human resources] positions at Marshall Field’s department stores and directed student programs at the University of Minnesota.
Andrew Ballard_ has served on our Board of Directors since July 2015 and is a member of the Compensation [removed: Committee.][added: Committee of the Board of Directors.]
In addition, he [removed: serves as the Vice Chairman of Zignal Labs, and] is a Senior Advisor at the private equity firm Hellman & Friedman, where he was previously a Managing Director.
[removed: In addition to serving on Domino’s Board,] Mr. Ballard is the [removed: chair] [added: Chair] of the [removed: board] [added: Board] of [removed: trustees] [added: Trustees] and [removed: chair] [added: Chair] of the [removed: investment committee] [added: Investment Committee] of the San Francisco Foundation.
He is also [removed: currently a board member of I Have a Dream San Francisco, and is] actively involved with Family Connections, a tuition free preschool for under-served families.
[added: In addition to serving on Domino’s Board,] Mr. Ballard [added: is currently Chairman of Datacor and Vice Chairman of Zignal Labs, and] has held previous board roles at Activant Solutions, Catalina Marketing, DoubleClick, Getty Images, Internet Brands and Vertafore.
Balson_ has served on our Board of Directors since March [removed: 1999,] [added: 1999 and also] serves as the Chairperson of the Compensation Committee of the Board of [removed: Directors and also serves on the Nominating and Corporate Governance Committee of the Board of] Directors.
Mr. Balson [removed: serves on the Boards of Directors of Bloomin’ Brands, Inc. Mr. Balson also] previously served on the Boards of Directors of [added: Bloomin’ Brands, Inc.,] FleetCor Technologies, Inc., Dunkin’ Brands, Inc., Skylark Co., Ltd., [added: Bellsystem24, Burger King Corporation,] and [added: Bright Horizons Solutions, as well as] numerous private companies.
Ms. Cantor [removed: joined] [added: is currently a Partner at] Alternative Investment Management, [removed: LLC as] [added: LLC,] a [removed: Partner in] [added: position she has held since] January 2010 and is the Vice Chairman of the Virginia Retirement System, where she also serves on the Audit and Compliance Committee.
_Timothy P.
McIntyre_ has served as Executive Vice President, Communication, Investor Relations and Legislative Affairs since May 2016.
Mr. McIntyre served as Vice President of Communication from August 1997 to May 2016.
Mr. McIntyre serves on the Board of Directors of Food Gatherers, a food rescue organization dedicated to eliminating hunger and its causes in Washtenaw County, MI.
Mr. McIntyre also serves on Eastern Michigan University’s College of Business Marketing Advisory Board.
_Kevin S.
Prior to joining Domino’s, Mr. Morris previously served at New York-based Equinox Holdings, Inc. and its various operating subsidiaries and affiliates from December 2012 to January 2017, most recently as Senior Vice President, General Counsel and Corporate Secretary.
Mr. Morris operated his own private legal practice from July 2009 to November 2012.
Prior to 2009, Mr. Morris served as Vice President and Associate General Counsel at Global Hyatt Corporation (the predecessor in interest to Hyatt Hotels Corporation) from 1999 to 2008.
Prior to 1999, Mr. Morris served as a Senior International Attorney and Staff Director at McDonald’s Corporation after beginning his career as an attorney at Rudnick & Wolfe.
Mr. Weiner serves on the Board of Directors of The Clorox Company.
Mr. Balson is currently the Managing Partner of Cove Hill Partners, a firm formed to make private equity investments.
Previously, Mr. Balson was the CEO of Match Beyond, a position he held from January 2015 to June 2016.
Mr. Goldman is currently a Senior Advisor at Eurazeo, a private equity firm listed on the Paris Stock Exchange.
| James G. Stansik | | 60 | | Executive Vice President, Franchise Relations |
| Vernon “Bud” O. Hamilton | | 73 | | Director |
_Lynn M.
Liddle_ joined Domino’s in November 2002, and serves as Executive Vice President, Communications, Investor Relations and Legislative Affairs.
Ms. Liddle served as Vice President, Investor Relations and Communications Center for Valassis, Inc. from 1992 to November 2002.
_Kenneth B.
From June 2000 through 2007, Mr. Rollin was employed by AutoNation, Inc. where he last served as Vice President and Deputy General Counsel.
From 1996 to June 2000, Mr. Rollin was employed by Walgreen Co. where he last served as a Senior Attorney in charge of litigation.
Prior to 1996, Mr. Rollin was in private practice.
_James G.
Stansik_ has served as our Executive Vice President, Franchise Relations since January 2008.
Mr. Stansik served as our Executive Vice President of Franchise Development from July 2006 through January 2008.
Mr. Stansik served as our Executive Vice President of Flawless Execution – Franchise Operations from December 2003 to July 2006.
Mr. Stansik served as Special Assistant to the Chief Executive Officer from August 1999 through December 2003.
Mr. Balson is currently the CEO of Match Beyond.
_Vernon “Bud” O.
Mr. Hamilton served in various executive positions for Procter & Gamble from 1966 through 2003.
Mr. Hamilton most recently served as Vice President, Innovation-Research & Development-Global from 2002 through 2003 and served as Vice President of Procter & Gamble Customer Business Development-North America from 1999 to 2001, Vice President of Procter & Gamble Customer Marketing-North America from 1996 through 1998 and President of Eurocos, a wholly-owned subsidiary of Procter & Gamble, from 1994 to 1995.
Trojan_ has served on our Board of Directors since March 2010 and also serves on the Audit Committee of the Board of Directors.
An excerpt. Shown here: 40 of 50 rewritten, all 14 added and all 19 removed. The counts are complete. For every sentence, read Item 10. Directors, Executive Officers and Corporate Governance. in the FY2017 filing and the FY2016 filing.
Item 11. Executive Compensation.
1 rewritten, 0 added, 0 removed, 2 unchanged
Information regarding executive compensation is incorporated by reference from Domino’s Pizza, Inc.’s definitive proxy statement, which will be filed within 120 days of January [removed: 3, 2016.][added: 1, 2017.]
Item 12. Security Ownership of Certain Beneficial Owners and Management and Related Stockholder Matters.
1 rewritten, 0 added, 0 removed, 1 unchanged
Information regarding security ownership of certain beneficial owners and management and related [removed: stockholders] [added: stockholder] matters is incorporated by reference from Domino’s Pizza, Inc.’s definitive proxy statement, which will be filed within 120 days of January [removed: 3, 2016.][added: 1, 2017.]
Item 13. Certain Relationships and Related Transactions, and Director Independence.
1 rewritten, 0 added, 0 removed, 1 unchanged
Information regarding certain relationships and related transactions is incorporated by reference from Domino’s Pizza, Inc.’s definitive proxy statement, which will be filed within 120 days of January [removed: 3, 2016.][added: 1, 2017.]
Item 14. Principal Accountant Fees and Services.
1 rewritten, 0 added, 0 removed, 3 unchanged
Information regarding principal accountant fees and services is incorporated by reference from Domino’s Pizza, Inc.’s definitive proxy statement, which will be filed within 120 days of January [removed: 3, 2016.][added: 1, 2017.]
Item 15. Exhibits, Financial Statement Schedules.
56 rewritten, 9 added, 135 removed, 97 unchanged
| [removed: (a)] | [removed: |] [added: (a)] 1. | [removed: |] Financial Statements: The following financial statements for Domino’s Pizza, Inc. and subsidiaries are included in Item 8, “Financial Statements and Supplementary Data”: | [removed: | |]
| [removed: | | | | | |] Report of Independent Registered Public Accounting Firm |
| [removed: | | | | | |] Consolidated Balance Sheets as of January [added: 1, 2017 and January] 3, 2016 [removed: and December 28, 2014] |
| [removed: | | | | | |] Consolidated Statements of Income for the Years Ended January [added: 1, 2017, January] 3, [removed: 2016,] [added: 2016 and] December 28, 2014 [removed: and December 29, 2013] |
| [removed: | | | | | |] Consolidated Statements of Comprehensive Income for the Years Ended January [added: 1, 2017, January] 3, [removed: 2016,] [added: 2016 and] December 28, 2014 [removed: and December 29, 2013] |
| [removed: | | | | | |] Consolidated Statements of Stockholders’ Deficit for the Years Ended January [added: 1, 2017, January] 3, [removed: 2016,] [added: 2016 and] December 28, 2014 [removed: and December 29, 2013] |
| [removed: | | | | | |] Consolidated Statements of Cash Flows for the Years Ended January [added: 1, 2017, January] 3, [removed: 2016,] [added: 2016 and] December 28, 2014 [removed: and December 29, 2013] |
| [removed: | | | | | |] Notes to Consolidated Financial Statements |
| | [removed: |] 2. | [removed: |] Financial Statement Schedules: The following financial statement schedules are attached to this report. | [removed: | |]
[removed: | | | | | | |] Schedule I – Condensed Financial Information of the Registrant [removed: |]
[removed: | | | | | | |] Schedule II – Valuation and Qualifying Accounts [removed: |]
[removed: | | | | |] All other schedules are omitted because they are not applicable, not required, or the information is included in the financial statements or the notes thereto. [removed: | | |]
| | [removed: |] 3. | [removed: |] Exhibits: Certain of the following Exhibits have been previously filed with the Securities and Exchange Commission pursuant to the requirements of the Securities Act of 1933 and the Securities Exchange Act of 1934. Such exhibits are identified by the parenthetical references following the listing of each such exhibit and are incorporated herein by reference. | [removed: | |]
| 3.1 | | Form of Second Restated Certificate of Incorporation of Domino’s Pizza, Inc. (Incorporated by reference to Exhibit 3.1 to the Domino’s Pizza, Inc. registration statement on Form S-1 filed on April 13, 2004 (Reg. No. [removed: 333-114442),] [added: 333-114442)] (the “S-1”)). |
| 3.3 | | Second Amended and Restated By-Laws of Domino’s Pizza, Inc. [added: (Incorporated by reference to Exhibit 3.3 to the registrant’s annual report on Form 10-K for the year ended January 3, 2016).] |
| 10.2 | | Fourth Amendment to the Lease Agreement between Domino’s Farms Office Park, L.L.C. and Domino’s Pizza LLC, dated as of August 28, 2012 (Incorporated by reference to Exhibit 10.2 to the [removed: registrants’] [added: registrant’s] annual report on Form 10-K for the year ended December 30, [removed: 2012,] [added: 2012] (the “2012 10-K”)). |
| [removed: 10.3*] [added: 10.8*] | | Domino’s Pizza, Inc. Deferred Compensation Plan adopted effective January 1, 2005 (Incorporated by reference to Exhibit 10.9 to the [removed: registrants’] [added: registrant’s] annual report on Form 10-K for the year ended January 1, 2006). |
| [removed: 10.4*] [added: 10.9*] | | First Amendment to the Domino’s Pizza Deferred Compensation Plan effective January 1, 2007 (Incorporated by reference to Exhibit 10.9 to the [removed: registrants’] [added: registrant’s] annual report on Form 10-K for the year ended December 31, 2006). |
| [removed: 10.5*] [added: 10.10*] | | Second Amendment to the Domino’s Pizza Deferred Compensation Plan effective February 8, 2013 (Incorporated by reference to Exhibit 10.5 to the 2012 10-K). |
| [removed: 10.7*] [added: 10.11*] | | Amended Domino’s Pizza, Inc. 2004 Equity Incentive Plan (Incorporated by reference to Exhibit 10.1 to the registrant’s quarterly report on Form 10-Q for the quarter ended March 22, [removed: 2009,] [added: 2009] (the “March 2009 10-Q”)). |
| [removed: 10.8*] [added: 10.12*] | | Form of Employee Stock Option Agreement under the Amended Domino’s Pizza, Inc. 2004 Equity Incentive Plan (Incorporated by reference to Exhibit 10.8 to the 2012 10-K). |
| [removed: 10.9*] [added: 10.13*] | | Form of 2013 Special Employee Stock Option Agreement under the Amended Domino’s Pizza, Inc. 2004 Equity Incentive Plan (Incorporated by reference to Exhibit 10.9 to the 2012 10-K). |
| [removed: 10.10*] [added: 10.14*] | | Form of Director Stock Option Agreement under the Amended Domino’s Pizza, Inc. 2004 Equity Incentive Plan (Incorporated by reference to Exhibit 10.3 to the March 2009 10-Q). |
| [removed: 10.11*] [added: 10.15*] | | Form of Amendment to Existing Director Stock Option Grants (Incorporated by reference to Exhibit 10.5 to the March 2009 10-Q). |
| [removed: 10.12*] [added: 10.16*] | | Form of Performance-Based Restricted Stock Agreement (Incorporated by reference to Exhibit 10.12 to the 2012 10-K). |
| [removed: 10.13*] [added: 10.17*] | | Form of 2013 Special Performance-Based Restricted Stock Agreement (Incorporated by reference to Exhibit 10.13 to the 2012 10-K). |
| [removed: 10.14*] [added: 10.18*] | | Form of Performance-Based Restricted Stock Unit Award Agreement (Incorporated by reference to Exhibit 10.14 to the 2012 10-K). |
| [removed: 10.15*] [added: 10.19*] | | Form of 2013 Special Performance-Based Restricted Stock Unit Award Agreement (Incorporated by reference to Exhibit 10.15 to the 2012 10-K). |
| [removed: 10.16*] [added: 10.20*] | | Form of Domino’s Pizza, Inc. 2004 Equity Incentive Plan Restricted Stock Agreement for Directors (Incorporated by reference to Exhibit 10.19 to the [removed: registrants’] [added: registrant’s] annual report on Form 10-K for the year ended January 3, [removed: 2010, (the “2009 10-K”)).] [added: 2010).] |
| [removed: 10.17*] [added: 10.21*] | | Amended and Restated Domino’s Pizza Senior Executive Annual Incentive Plan. (Incorporated by reference to Exhibit 10.20 to the [removed: registrants’] [added: registrant’s] annual report on Form 10-K for the year ended January 2, [removed: 2011, (the “2010 10-K”)).] [added: 2011).] |
| [removed: 10.18*] [added: 10.22*] | | Amended and Restated Domino’s Pizza, Inc. Employee Stock Payroll Deduction Plan (Incorporated by reference to Exhibit 10.18 to the [removed: registrants’] [added: registrant’s] annual report on Form 10-K for the year ended December 29, 2013). |
| [removed: 10.19*] [added: 10.23*] | | Form of Domino’s Pizza, Inc. Dividend Reinvestment & Direct Stock Purchase and Sale Plan (Incorporated by reference to Exhibit 10.32 to the S-1). |
| [removed: 10.20*] [added: 10.24*] | | Employment Agreement dated as of February 23, 2015 between Domino’s Pizza LLC and J. Patrick Doyle (Incorporated by reference to Exhibit 10.20 to the [removed: registrants’] [added: registrant’s] annual report on Form 10-K for the year ended December 28, [removed: 2014,] [added: 2014] (the “2014 10-K”)). |
| [removed: 10.21*] [added: 10.25*] | | Time Sharing Agreement dated as of February 23, 2015 between Domino’s Pizza LLC and J. Patrick Doyle (Incorporated by reference to Exhibit 10.21 to the 2014 10-K). |
| [removed: 10.22*] [added: 10.28*] | | [added: Amendment to the] Employment [removed: Agreement] [added: agreement] dated as of [removed: February 14, 2007] [added: September 2, 2008] between Domino’s Pizza LLC and [removed: Michael T. Lawton] [added: Russell J. Weiner] (Incorporated by reference to Exhibit [removed: 10.44 of] [added: 10.4 to] the registrant’s [removed: annual] [added: current] report on Form [removed: 10-K for the year ended] [added: 8-K filed on] December [removed: 28, 2008, (the “2008 10-K”)).] [added: 24, 2008).] |
| [removed: 10.23*] [added: 10.27*] | | [removed: Amendment to the] Employment [removed: agreement] [added: Agreement] dated as of [removed: February 14, 2007] [added: September 2, 2008] between Domino’s Pizza LLC and [removed: Michael T. Lawton] [added: Russell J. Weiner] (Incorporated by reference to Exhibit [removed: 10.45 of] [added: 1.01 to] the [removed: 2008 10-K).] [added: registrant’s current report on Form 8-K filed on September 4, 2008).] |
| [removed: 10.24*] [added: 10.29*] | | Amendment to the Employment Agreement dated as of July 26, 2010 between Domino’s Pizza LLC and [removed: Michael T. Lawton] [added: Russell J. Weiner] (Incorporated by reference to Exhibit [removed: 10.4] [added: 10.3] to the registrant’s quarterly report on Form 10-Q for the quarter ended June 20, [removed: 2010, (the “June 2010 10-Q”)).] [added: 2010).] |
| [removed: 10.25*] [added: 10.26*] | | Employment Agreement dated as of August 28, 2015 between Domino’s Pizza LLC and Jeffrey Lawrence (Incorporated by reference to Exhibit 10.1 to the registrant’s quarterly report on Form 10-Q for the quarter ended September 6, 2015). |
| [removed: 10.26*] [added: 10.30*] | | Employment Agreement dated as of [removed: September 2, 2008] [added: March 14, 2011] between Domino’s Pizza LLC and [removed: Russell J. Weiner] [added: Richard E. Allison, Jr.] (Incorporated by reference to Exhibit [removed: 1.01] [added: 10.1] to the registrant’s [removed: current] [added: quarterly] report on Form [removed: 8-K filed on September 4, 2008).] [added: 10-Q for the quarter ended March 27, 2011).] |
| [removed: 10.31] [added: 10.32] | | Form of Indemnification Agreement (Incorporated by reference to Exhibit 10.33 to the S-1). |
| 10.3 | | Fifth Amendment to a Lease Agreement between Domino’s Farms Office Park, L.L.C. and Domino’s Pizza LLC, dated as of February 1, 2015. |
| 10.4 | | Sixth Amendment to a Lease Agreement between Domino’s Farms Office Park, L.L.C. and Domino’s Pizza LLC, dated as of February 1, 2015. |
| 10.5 | | Seventh Amendment to a Lease Agreement between Domino’s Farms Office Park, L.L.C. and Domino’s Pizza LLC, dated as of April 19, 2016. |
| 10.6 | | Eighth Amendment to a Lease Agreement between Domino’s Farms Office Park, L.L.C. and Domino’s Pizza LLC, dated as of November 4, 2016. |
| 10.7 | | Ninth Amendment to a Lease Agreement between Domino’s Farms Office Park, L.L.C. and Domino’s Pizza LLC, dated as of February 16, 2017. |
| --- | --- | --- |
| 10.31* | | Employment Agreement dated as of November 20, 2015 between Domino’s Pizza LLC and Judith L. Werthauser. |
| --- | --- | --- |
| --- | --- | --- |
| --- | --- |
| | | | | | | |
| --- | --- | --- | --- | --- | --- | --- |
| | | |
| 10.6* | | TISM, Inc. Fourth Amended and Restated Stock Option Plan (“TISM Option Plan”) (Incorporated by reference to Exhibit 10.6 to the Domino’s, Inc. current report on Form 8-K filed on June 26, 2003 (Reg. No. 333-74797)). |
##### [Table of Contents](#toc)
| 10.27* | | Amendment to the Employment agreement dated as of September 2, 2008 between Domino’s Pizza LLC and Russell J. Weiner (Incorporated by reference to Exhibit 10.4 to the registrants’ current report on Form 8-K filed on December 24, 2008). |
| 10.28* | | Amendment to the Employment Agreement dated as of July 26, 2010 between Domino’s Pizza LLC and Russell J. Weiner (Incorporated by reference to Exhibit 10.3 to the June 2010 10-Q). |
| 10.29* | | Employment Agreement dated as of July 21, 2011 between Domino’s Pizza LLC and Scott R. Hinshaw (Incorporated by reference to Exhibit 10.36 to the registrant’s annual report on Form 10-K for the year ended January 1, 2012). |
| 10.30* | | Employment Agreement dated as of March 14, 2011 between Domino’s Pizza LLC and Richard E. Allison, Jr. (Incorporated by reference to Exhibit 10.1 of the registrant’s quarterly report on Form 10-Q for the quarter ended March 27, 2011). |
| 10.48 | | Letter of Credit Agreement dated as of June 22, 2009 between Domino’s Pizza LLC and Barclays Bank PLC (Incorporated by reference to Exhibit 10.1 to the registrant’s current report on Form 8-K filed on June 26, 2009). |
SCHEDULE I – CONDENSED FINANCIAL INFORMATION OF THE REGISTRANT
DOMINO’S PIZZA, INC.
PARENT COMPANY CONDENSED BALANCE SHEETS
(In thousands, except share and per share amounts)
| | | | | | | | | |
| --- | --- | --- | --- | --- | --- | --- | --- | --- |
| | | January 3, | | | | December 28, | | |
| | | 2016 | | | | 2014 | | |
| ASSETS | | | | | | | | |
| ASSETS: | | | | | | | | |
| Cash and cash equivalents | | $ | 6 | | | $ | 6 | |
| Total assets | | $ | 6 | | | $ | 6 | |
| LIABILITIES AND STOCKHOLDERS’ DEFICIT | | | | | | | | |
| LIABILITIES: | | | | | | | | |
| Equity in net deficit of subsidiaries | | $ | 1,800,251 | | | $ | 1,219,465 | |
| Due to subsidiary | | | 6 | | | | 6 | |
| Total liabilities | | | 1,800,257 | | | | 1,219,471 | |
| STOCKHOLDERS’ DEFICIT: | | | | | | | | |
| Common stock, par value $0.01 per share; 170,000,000 shares authorized; 49,838,221 in 2015 and 55,553,149 in 2014 issued and outstanding | | | 498 | | | | 556 | |
| Preferred stock, par value $0.01 per share; 5,000,000 shares authorized, none issued | | | — | | | | — | |
| Additional paid-in capital | | | 6,942 | | | | 29,561 | |
| Retained deficit | | | (1,804,143 | ) | | | (1,246,921 | ) |
| Accumulated other comprehensive loss | | | (3,548 | ) | | | (2,661 | ) |
| Total stockholders’ deficit | | | (1,800,251 | ) | | | (1,219,465 | ) |
| Total liabilities and stockholders’ deficit | | $ | 6 | | | $ | 6 | |
See accompanying notes to the Schedule I.
PARENT COMPANY CONDENSED STATEMENTS OF INCOME AND COMPREHENSIVE INCOME
(In thousands, except per share amounts)
| | | | | | | | | | | | | |
An excerpt. Shown here: 40 of 56 rewritten, all 9 added and 40 of 135 removed. The counts are complete. For every sentence, read Item 15. Exhibits, Financial Statement Schedules. in the FY2017 filing and the FY2016 filing.
Item 16. Form 10-K Summary.
0 rewritten, 191 added, 0 removed, 0 unchanged
New section this year
| --- | --- |
Not applicable.
##### [Table of Contents](#toc)
SCHEDULE I – CONDENSED FINANCIAL INFORMATION OF THE REGISTRANT
DOMINO’S PIZZA, INC.
PARENT COMPANY CONDENSED BALANCE SHEETS
(In thousands, except share and per share amounts)
| | | | | | | | | |
| --- | --- | --- | --- | --- | --- | --- | --- | --- |
| | | January 1, | | | | January 3, | | |
| | | 2017 | | | | 2016 | | |
| ASSETS | | | | | | | | |
| | | | | | | | | |
| ASSETS: | | | | | | | | |
| Cash and cash equivalents | | $ | 6 | | | $ | 6 | |
| | | | | | | | | |
| Total assets | | $ | 6 | | | $ | 6 | |
| | | | | | | | | |
| | | | | | | | | |
| LIABILITIES AND STOCKHOLDERS’ DEFICIT | | | | | | | | |
| | | | | | | | | |
| LIABILITIES: | | | | | | | | |
| Equity in net deficit of subsidiaries | | $ | 1,883,143 | | | $ | 1,800,251 | |
| Due to subsidiary | | | 6 | | | | 6 | |
| | | | | | | | | |
| Total liabilities | | | 1,883,149 | | | | 1,800,257 | |
| | | | | | | | | |
| STOCKHOLDERS’ DEFICIT: | | | | | | | | |
| Common stock, par value $0.01 per share; 170,000,000 shares authorized; 48,100,143 in 2016 and | | | | | | | | |
| 49,838,221 in 2015 issued and outstanding | | | 481 | | | | 498 | |
| Preferred stock, par value $0.01 per share; 5,000,000 shares authorized, none issued | | | — | | | | — | |
| Additional paid-in capital | | | 1,006 | | | | 6,942 | |
| Retained deficit | | | (1,881,520 | ) | | | (1,804,143 | ) |
| Accumulated other comprehensive loss | | | (3,110 | ) | | | (3,548 | ) |
| | | | | | | | | |
| Total stockholders’ deficit | | | (1,883,143 | ) | | | (1,800,251 | ) |
| | | | | | | | | |
| Total liabilities and stockholders’ deficit | | $ | 6 | | | $ | 6 | |
| | | | | | | | | |
See accompanying notes to the Schedule I.
An excerpt. Shown here: all 0 rewritten, 40 of 191 added and all 0 removed. The counts are complete. For every sentence, read Item 16. Form 10-K Summary. in the FY2017 filing.