 filings.tools
Domino's Pizza (DPZ) 10-K risk factor changes: FY2020 vs FY2019
The 2021-01-03 10-K against the 2019-12-29 one, compared heading by heading and sentence by sentence.
Item 1A110 rewritten145 added37 removed268 unchanged
All filing items1,126 rewritten1,035 added743 removed1,797 unchanged
Summary
counted, not written
- Item 1A headings could not be compared: only 0 carried over between the two years, which usually means one filing was read wrongly, so none is reported as new or removed.
- Sentence by sentence, 1,035 added, 743 removed, 1,126 rewritten and 1,797 unchanged across 19 items that differ.
Sentences by item
23 items, with every count and a link to each item that changed
Underlined words on a shaded ground are new in FY2020; struck-through words were in FY2019. Sentences that are wholly new or wholly gone are labelled rather than marked.
Item 1A. Risk Factors.
110 rewritten, 145 added, 37 removed, 268 unchanged
We could experience increased competition from existing or new companies in the delivery and [added: carryout pizza category that could create increasing pressures to grow our business in order to maintain our market share.]
Competition from order and delivery aggregators and other food delivery services has also increased in recent [removed: years.][added: years and order and delivery aggregators have continued to grow in size and scale.]
| | • | [added: |] consumer tastes; |
| | • | [added: |] international, national, regional or local economic conditions; |
| | • | [added: |] disposable purchasing power; |
| | • | [added: |] marketing, advertising and pricing, including discounting; |
| | • | [added: |] demographic trends; and |
| | • | [added: |] currency fluctuations related to international operations. |
We compete within the food service market and the quick service restaurant market not only for customers, but also for management and hourly employees, including [removed: drivers,] [added: store team members, drivers and qualified franchisees, as well as] suitable real estate [removed: sites and qualified franchisees.][added: sites.]
While substantially all U.S. franchisees purchased food, equipment and supplies from us in [removed: 2019,] [added: 2020,] U.S. franchisees are not required to purchase food, equipment or supplies from us and they may choose to purchase from outside suppliers.
| | • | [added: |] availability of financing with acceptable terms; |
| | • | [added: |] selection and availability of suitable new store sites and the ability to renew leases in quality locations; |
| | • | [added: |] negotiation of acceptable lease or financing terms; |
| | • | [added: |] securing required U.S. or foreign governmental permits, licenses and approvals; |
| | • | [added: |] employment and training of qualified personnel; and |
| | • | [added: |] general economic and business conditions. |
Therefore, as we continue to [removed: expand internationally,] [added: expand,] we or our franchisees may not experience the operating margins we expect, our results of operations may be negatively impacted, and our common stock price may decline.
In addition, we expect to continue our strategy of building additional stores in markets and regions where we have existing stores, [added: a strategy we refer to as “fortressing,”] which may negatively impact sales at existing stores.
[removed: In recent years, there has been a marked increase in the] [added: The] use of social media platforms, including blogs, chat platforms, social media websites, and other forms of internet-based communications that allow individuals access to a broad audience of consumers and other [removed: persons.][added: persons, including to our customers and the general public, and other consumer-oriented technologies has increased the speed and accessibility of information dissemination and given users the ability to more effectively organize collective actions such as boycotts and other brand-damaging behaviors.]
[removed: The dissemination of information via social media] [added: Negative publicity related to our food products or stores or negative publicity related to actions by our executives, team members or franchisees and their team members] could harm our business, brand, reputation, marketing partners, financial condition, and results of operations, regardless of the [removed: information’s accuracy.][added: accuracy of such negative publicity.]
Failure to use [added: or respond to] social media [added: campaigns] effectively could lead to a decline in brand value and revenue.
[removed: A] [added: In addition, a] failure of us, our employees, our franchisees or third parties acting at our direction to abide by applicable laws and regulations in the use of social media could adversely impact our brand, reputation, marketing partners, financial condition, and results of operations or subject us or our franchisees to fines or other [removed: penalties.Other risks associated with the use of social media include improper disclosure of proprietary information, negative comments about our brand, exposure of personally identifiable information, fraud, hoaxes or malicious dissemination of false information.][added: penalties.]
The potential for acts of terrorism affecting our global food supply also exists and, if such an event occurs, [removed: it] could have a negative impact on us and could severely hurt sales and profits.
[removed: Further, the occurrence of a widespread illness, health epidemic] or other general health concern could adversely affect us on a local, regional or international basis.
Although in the past we have not experienced significant problems with our suppliers, our suppliers may implement significant price increases or may not meet our [removed: requirements] [added: requirements, including those that may result from increases] in [added: volume, in] a timely [removed: fashion,] [added: fashion] or at all.
[removed: Shortages or] [added: Shortages,] interruptions [added: or disruptions] in the supply or delivery of fresh food products could adversely affect our operating results.
While we believe there are adequate reserve quantities and potential alternative suppliers, [removed: shortages or] [added: shortages,] interruptions [added: or disruptions] in the supply of food products caused by increased demand, capacity constraints, problems in production or distribution, [added: product recalls,] financial or other difficulties of suppliers, inclement weather or other conditions could adversely affect the availability, quality and cost of ingredients.
Several [removed: states] [added: jurisdictions] in which we operate have recently approved minimum wage increases.
As [added: more jurisdictions implement] minimum wage [removed: increases are implemented in these states or if such increases are approved and implemented in other states in which we operate,] [added: increases,] we expect our labor costs will continue to increase.
We operate [removed: 19] [added: 21] regional dough manufacturing and supply chain [removed: centers, one] [added: centers in the U.S., two] thin crust manufacturing [removed: center] [added: facilities] and one vegetable processing center in the U.S. and five dough manufacturing and supply chain centers in Canada.
As a result, any prolonged disruption in the operations of any of these facilities, whether due to [removed: technical] [added: technical, operational] or labor difficulties, destruction or damage to the facility, real estate issues, limited capacity or other reasons, could adversely affect our business and operating results.
Each Domino’s store located in the [removed: contiguous] U.S. is obligated to contribute 6% of its sales (subject, in certain instances, to lower rates based on certain incentives and waivers) to DNAF, which uses such fees for national advertising in addition to contributions for local market-level advertising.
We face risks of litigation, investigations, enforcement actions and negative publicity from customers, franchisees, suppliers, employees, regulators and others in the ordinary course of business, which [removed: can or] could divert our financial and management resources.
In addition to decreasing our sales and profitability and diverting our management resources, adverse publicity resulting from such allegations may materially and adversely affect us and our brand, regardless of whether such allegations are valid or whether we are [removed: liable.][added: liable, and could result in a substantial settlement, fine, penalty or judgment against us.]
Further, we may be subject to employee, franchisee and other claims in the future based on, among other things, discrimination, harassment, [added: working and safety conditions,] wrongful termination and wage, [added: expense reimbursement,] rest break and meal break issues, including claims relating to overtime compensation.
[added: Our success in the highly competitive pizza delivery and carryout] business will continue to depend to a significant extent on our leadership team and other key management personnel.
| | • | [added: |] recessionary or expansive trends in international markets; |
| | • | [added: |] changing labor conditions and difficulties in staffing and managing our foreign operations; |
| | • | [added: |] increases in the taxes we pay and other changes in applicable tax [removed: laws;] [added: laws both in the U.S. and globally;] |
| | • | [added: |] tariffs and trade barriers; |
For a business as large and globally diverse as the Company, a wide range of factors could materially affect future developments and performance.
In addition to the factors affecting specific business operations identified in connection with the description of these operations and the financial results of these operations elsewhere in this report and our other filings with the SEC, we believe the most significant risk factors affecting our business include the following:
Business, Operational and Industry Risks
| --- | --- | --- | --- |
| --- | --- | --- | --- |
| --- | --- | --- | --- |
| --- | --- | --- | --- |
| --- | --- | --- | --- |
| --- | --- | --- | --- |
Worldwide economic activity has been and is expected to continue to be adversely affected by the
COVID-19
pandemic, the scale and scope of which is ultimately unknown, which could adversely affect our business, financial condition and results of operations.
The global
COVID-19
pandemic continues to impact worldwide economic activity.
A public health pandemic such as
COVID-19
poses the risk that we and/or our employees, franchisees, supply chain centers, suppliers, customers and other partners may be, or may continue to be, prevented from conducting business activities for an indefinite period of time, including due to shutdowns, travel restrictions, social distancing requirements, stay at home orders and advisories and other restrictions that have been or may be suggested or mandated by governmental authorities, or due to the impact of the disease itself on a business’ workforces.
In addition,
COVID-19
may impact the willingness of customers to purchase food prepared outside of the home.
The
COVID-19
pandemic may also have the effect of heightening many of the other risks described throughout this report, including but not limited to those relating to our growth strategy, our supply chain and increased food and labor costs, disruption in operations, loss of key employees, our indebtedness, general economic conditions and our international operations.
In response to governmental requirements, we and our franchisees have implemented a number of measures, including, among others, temporarily closing certain of our stores, modifying certain stores’ hours and closing locations to
in-store
dining, and we continue to monitor additional developments.
We have also made additional operating changes in response to changes in consumer behavior and preferences resulting from
COVID-19,
including offering contactless delivery and carryout options to our customers.
While it is not possible at this time to estimate the full impact that
COVID-19
could have on our business going forward, the continued spread of the virus and the measures taken in response have disrupted our operations and could disrupt our supply chain, including our access to face coverings for use in our operations, which could adversely impact our business, financial condition and results of operations.
The
COVID-19
pandemic and mitigation measures have also had an adverse impact on global economic conditions, which could have an adverse effect on our business and financial condition.
The Company’s sales and operating results may be affected by uncertain or changing economic and market conditions arising in connection with and in response to the
COVID-19
pandemic, including inflation, deflation, prolonged weak consumer demand, political instability or other changes.
While the Company has seen an increase in sales in certain markets, including within the U.S., during the
carry-out
pizza category that could create increasing pressures to grow our business in order to maintain our market share.
| --- | --- | --- |
The rising popularity of social media and other consumer-oriented technologies has increased the speed and accessibility of information dissemination and given users the ability to more effectively organize collective actions such as boycotts and other brand-damaging behaviors.
This could include negative publicity related to our food products or stores or negative publicity related to actions by our executives, team members or franchisees.
In addition, we frequently use social media to communicate with consumers and the public in general.
In addition, laws and regulations, including FTC enforcement, rapidly evolve to govern social media platforms and communications.
Further, a substantial settlement, fine, penalty or judgment against us could negatively impact our financial condition, results of operations and brand reputation, thereby hindering our ability to attract and retain franchisees and grow our business.
Our success in the highly competitive pizza delivery and
As of December 29, 2019, we had 777 U.S. franchisees operating 5,784 U.S. stores.
An increase in such fees would cause an increase in our operating expenses and those of our franchisees and could require an increase in the prices charged for our products, either of which could harm our operating results.
| | • | public company compliance, disclosure and governance matters; |
| | • | discrimination; |
While the National Labor Relations Board has formally proposed a rule that would reinstate the standard that was in place before August 2015 and invited public comment, a final rule has not yet been issued.
The Tax Cuts and Jobs Act of 2017 (the “2017 Tax Act”) was signed into law on December 22, 2017, significantly reforming the Internal Revenue Code of 1986, as amended.
The 2017 Tax Act, among other things, changed U.S. Federal corporate income tax rates, imposed significant additional limitations on the deductibility of interest, allowed for the expensing of capital expenditures, put into effect the migration from a “worldwide” system of taxation to a territorial system and modified or repealed many business deductions and credits.
Rulings and regulations continue to be issued related to the 2017 Tax Act, and we continue to examine the impact these updates to the 2017 Tax Act may have on our business.
The estimated impact of the 2017 Tax Act is based on our management’s current knowledge and assumptions and recognized impacts could be materially different from current estimates based on our actual results and our further analysis of the law.
We revalued our net deferred tax assets and liabilities at the newly enacted corporate tax rate in fiscal 2017 and recorded a significantly lower effective tax rate in 2019 and 2018.
We currently expect the lower effective tax rates for the Company recognized in 2019 and 2018 will continue in future periods.
Among other provisions, the 2017 Tax Act (effective for taxable years beginning on January 1, 2018) amended Section 163(j) of the Code to impose significant additional limitations on the deductibility of business interest expense.
While we do not currently expect the interest limitation under Section 163(j) to materially limit our ability to deduct business interest, the finalization of the current proposed Treasury Regulations and other future guidance could change this and materially limit our ability to deduct business interest in the future.
We have retention programs for workers’ compensation, general liability and owned and
automobile liabilities.
Our common stock price could be subject to significant fluctuations and/or may decline.
The market price of our common stock could be subject to significant fluctuations.
Among the factors that could affect our stock price are:
| | • | variations in our operating results; |
| | • | changes in revenues or earnings estimates or publication of research reports by analysts; |
| | • | speculation in the press or investment community; |
| | • | strategic actions by us or our competitors, such as sales promotions, acquisitions or restructurings; |
| | • | actions by institutional and other stockholders; |
| | • | changes in the market values of public companies that operate in our business segments; |
| | • | maintenance and growth of the value of our brand; |
| | • | U.S. and international economic factors unrelated to our performance. |
The stock markets in general have experienced volatility that has sometimes been unrelated to the operating performance of particular companies.
These broad market fluctuations may cause the trading price of our common stock to decline.
An excerpt. Shown here: 40 of 110 rewritten, 40 of 145 added and all 37 removed. The counts are complete. For every sentence, read Item 1A. Risk Factors. in the FY2020 filing and the FY2019 filing.
Item 7. Management’s Discussion and Analysis of Financial Condition and Results of Operations.
196 rewritten, 282 added, 119 removed, 237 unchanged
Fiscal [removed: 2019, 2018] [added: 2020 consisted of 53 weeks] and [removed: 2017] [added: fiscal 2019 and 2018] each consisted of 52 weeks.
In this section, we discuss the results of our operations for the year ended [removed: December 29, 2019] [added: January 3, 2021] compared to the year ended December [removed: 30, 2018.][added: 29, 2019.]
For a discussion of the year ended December [removed: 30, 2018] [added: 29, 2019] compared to the year ended December [removed: 31, 2017,] [added: 30, 2018,] please refer to Part II, Item 7, “Management’s Discussion and Analysis of Financial Condition and Results of Operations” in our Annual Report on Form
for the year ended December [removed: 30, 2018.][added: 29, 2019.]
Domino’s is the largest pizza company in the world based on global retail sales, with more than [removed: 17,000] [added: 17,600] locations in over 90 markets around the world.
Domino’s generates revenues and earnings by charging royalties and fees to our [added: independent] franchisees.
We also generate revenues and earnings by selling food, equipment and supplies to franchisees primarily in the U.S. and Canada, and by operating a number of [removed: our own stores.][added: Company-owned stores in the U.S. Franchisees profit by selling pizza and other complementary items to their local customers.]
These master franchisees are charged with developing their geographical area, and they [removed: may] [added: can] profit by
as well as by running pizza [removed: stores.][added: stores directly.]
Everyone in the system can benefit, including the end consumer, who can [removed: purchase Domino’s menu items for themselves and] [added: feed] their family conveniently and economically.
Our business model can yield strong returns for our franchise owners and [added: our] Company-owned stores.
Fiscal [removed: 2019] [added: 2020] Highlights
| | • | [added: |] Global retail sales, excluding foreign currency impact (which includes total retail sales at Company-owned and franchised stores worldwide) increased [removed: 8.0%] [added: 13.2%] as compared to [removed: 2018.] [added: 2019. U.S. retail sales increased 17.6% and international retail sales, excluding foreign currency impact, increased 8.8% as compared to 2019.] |
| | • | [added: |] Same store sales increased [removed: 3.2%] [added: 11.5%] in our U.S. stores and increased [removed: 1.9%] [added: 4.4%] in our international stores. |
| | • | [added: |] Our revenues increased [removed: 5.4%.] [added: 13.8%.] |
| | • | [added: |] Our income from operations increased [removed: 10.1%.] [added: 15.3%.] |
| | • | [added: |] Our net income increased [removed: 10.7%.] [added: 22.6%.] |
| | • | [added: |] Our diluted earnings per share increased [removed: 14.5%.] [added: 29.6%.] |
During [removed: 2019,] [added: 2020,] we continued our [removed: rapid] global expansion with the opening of [removed: 1,106] [added: 624] net [removed: new] stores.
We also continued our strong U.S. and international same store sales performance with [removed: 35] [added: 39] straight quarters of positive U.S. same store sales and [removed: 104] [added: 108] straight quarters of positive international same store sales.
[removed: While our overall U.S. delivery business continues to grow, our] [added: Our] U.S. [removed: delivery] [added: and international] same store sales growth has [added: also] been pressured by our fortressing strategy, which includes increasing store concentration in certain markets where we compete, as well as from aggressive competitive activity.
We remained focused on improving the customer experience through our technology initiatives, including the recent launch of our GPS delivery tracking technology, which allows customers to [removed: track] [added: monitor] the progress of their [removed: pizza delivery through] [added: food, from] the [removed: Domino’s ordering platforms.][added: preparation stages to the time it is in the oven, to the time it arrives at their doors.]
Our emphasis on [removed: technology] [added: technological] innovation helped the Domino’s system generate more than half of global retail sales from digital channels in [removed: 2019.][added: 2020.]
Retail sales from [removed: franchise] [added: franchised] stores are reported to us by our franchisees and are not included in our revenues.
Retail sales are generally [removed: reported] [added: reported,] and [added: the] related royalties paid to us based on a percentage of retail sales, as specified in the related standard franchise agreement (generally 5.5% of U.S. franchise retail sales [removed: and,] [added: and were] on average, [removed: 3.0%] [added: 2.9%] of international franchise retail [removed: sales).][added: sales in 2020).]
We had accruals for legal matters of approximately [removed: $1.8] [added: $1.3] million [removed: at December 29, 2019] and [removed: $1.9] [added: $1.8] million at [added: January 3, 2021] December [removed: 30, 2018.][added: 29, 2019, respectively.]
A 10% change in our insurance liability at [removed: December 29, 2019] [added: January 3, 2021] would have affected our income before provision for income taxes by approximately [removed: $5.8] [added: $6.4] million in [removed: 2019.][added: 2020.]
We had accruals for insurance matters of approximately [removed: $58.4] [added: $63.5] million [removed: at December 29, 2019] and [removed: $53.3] [added: $58.4] million at [added: January 3, 2021 and] December [removed: 30, 2018.][added: 29, 2019, respectively.]
On an ongoing basis, management will assess whether it remains more likely than not that the [removed: net] deferred tax assets will be realized.
Our accounting for deferred tax assets [added: and liabilities] represents our best estimate of future events.
Our [removed: net] deferred tax assets assume that we will generate sufficient taxable income in specific tax jurisdictions, based on our estimates and assumptions.
| | | [removed: 2019] [added: 2020] | | | | [removed: 2018 (1)] [added: 2019] | | | | [removed: 2017] [added: 2018] | | |
| U.S. Company-owned stores | | | [removed: 2.8] [added: 11.0] | % | | | [removed: 4.8] [added: 2.8] | % | | | [removed: 8.7] [added: 4.8] | % |
| U.S. franchise stores | | | [removed: 3.2] [added: 11.5] | % | | | [removed: 6.8] [added: 3.2] | % | | | [removed: 7.6] [added: 6.8] | % |
| U.S. stores | | | [removed: 3.2] [added: 11.5] | % | | | [removed: 6.6] [added: 3.2] | % | | | [removed: 7.7] [added: 6.6] | % |
| International stores (excluding foreign currency impact) | | | [removed: 1.9] [added: 4.4] | % | | | [removed: 3.5] [added: 1.9] | % | | | [removed: 3.4] [added: 3.5] | % |
| (1) | In 2018, we began managing our franchised stores in Alaska and Hawaii as part of our U.S. Stores segment. Prior to 2018, store [removed: counts, retail sales and royalty revenues] [added: counts] from these franchised stores were included in our international [removed: operations] [added: stores] in the [removed: tables] [added: table] above. [removed: Consolidated results have not been impacted by this change and prior year amounts have not been reclassified to conform to the current year presentation due to immateriality.] |
| U.S. Company-owned stores | | $ | [removed: 453.6] [added: 485.6] | | | | | | | $ | [removed: 514.8] [added: 453.6] | | | | | | | $ | [removed: 490.8] [added: 514.8] | | | | | |
| U.S. franchise royalties and fees | | | [removed: 428.5] [added: 503.2] | | | | | | | | [removed: 391.5] [added: 428.5] | | | | | | | | [removed: 351.4] [added: 391.5] | | | | | |
| Supply chain | | | [removed: 2,104.9] [added: 2,416.7] | | | | | | | | [removed: 1,943.3] [added: 2,104.9] | | | | | | | | [removed: 1,739.0] [added: 1,943.3] | | | | | |
Our financial results are driven largely by retail sales at our franchise and Company-owned stores.
Changes in retail sales are driven by changes in same store sales and store counts.
We monitor both of these metrics very closely, as they directly impact our revenues and profits, and we strive to consistently increase both metrics.
Retail sales drive royalty payments from franchisees, as well as Company-owned store and supply chain revenues.
Retail sales are primarily impacted by the strength of the Domino’s Pizza
brand, the results of our extensive advertising through various media channels, the impact of technological innovation and digital ordering, our ability to execute our strong and proven business model and the overall global economic environment.
These factors emphasize our focus on our stakeholders, including our customers, team members, franchisees, communities and shareholders.
U.S. and international franchise fee revenue primarily relates to
per-transaction
technology fees that are recognized as the related sales occur.
auto liabilities.
We are generally responsible for up to $2.0 million per occurrence under these retention programs for workers’ compensation and general liability, depending on policy year and line of coverage.
We are generally responsible for up to between $500,000 and $5.5 million per occurrence under these retention programs for owned and
non-owned
automobile liabilities, depending on policy year and line of coverage.
| --- | --- | --- | --- |
| --- | --- | --- | --- |
| --- | --- | --- | --- |
| --- | --- | --- | --- |
| --- | --- | --- | --- |
| --- | --- | --- | --- |
| | • | | The inclusion of the 53 rd week in 2020 positively impacted our results. |
| --- | --- | --- | --- |
During 2020, we experienced global retail sales growth and U.S. and international same store sales growth.
We believe our commitment to value, convenience, quality and new products continues to keep consumers engaged with the brand.
We launched three new products in the U.S., including new and improved chicken wings and the new chicken taco and cheeseburger specialty pizzas, each of which has been positively received by consumers.
Beginning at the end of the first quarter of 2020, changes in consumer ordering behavior due to the
COVID-19
pandemic resulted in a significant increase in U.S. same store sales.
We did not experience significant temporary closures in our U.S. business.
Additionally, our U.S. supply chain experienced higher volumes from the increases in U.S. store sales.
COVID-19
pandemic negatively impacted our international franchise revenues during the second quarter of 2020 due to temporary store closures in certain markets as well as changes in operating procedures and store hours resulting from actions taken to increase social distancing across our international franchise markets.
In the third and fourth quarters of 2020, these negative impacts lessened due to the reopening and resumption of normal store hours at the majority of our international franchised stores that had been temporarily closed for portions of the second quarter.
We had 229 net stores open in the U.S and 395 net stores open internationally.
Although 718 gross stores opened internationally, 323 stores closed, primarily in India and South Africa.
The
COVID-19
pandemic has had a negative impact on anticipated store openings in our international business
to-date
| --- | --- |
Royalties are ongoing
percent-of-sales
fees for use of the Domino’s brand marks.
Franchisees profit by selling pizza and other complementary items to their local customers.
| --- | --- | --- |
Our international franchise segment led the way with 856 net new store openings.
Our U.S. carryout business experienced continued strong growth.
Overall, we believe our focus in 2019 on global growth and technology will continue to strengthen our brand in the future.
auto liability under insurance policies requiring payment of a deductible for each occurrence up to between $500,000 and $3.0 million, depending on the policy year and line of coverage.
ten-year
| | | | | | | | | | | | | |
| Store count at January 1, 2017 | | | 392 | | | | 4,979 | | | | 5,371 | | | | 8,440 | | | | 13,811 | |
| Openings | | | 16 | | | | 213 | | | | 229 | | | | 891 | | | | 1,120 | |
| Closings | | | — | | | | (13 | ) | | | (13 | ) | | | (62 | ) | | | (75 | ) |
| Transfers | | | (16 | ) | | | 16 | | | | — | | | | — | | | | — | |
| (dollars in millions) | | 2019 | | | | | | | | 2018 (1) | | | | | | | | 2017 | | | | | | |
| (1) | In 2018, we began managing our franchised stores in Alaska and Hawaii as part of our U.S. Stores segment. Prior to 2018, store counts, retail sales and royalty revenues from these franchised stores were included in our international operations in the tables above. Consolidated results have not been impacted by this change and prior year amounts have not been reclassified to conform to the current year presentation due to immateriality. Also, see Note 13 to the consolidated financial statements for additional information related to the store transfers between U.S. Company-owned stores and U.S. franchise stores. |
| (2) | The adoption of ASC 606 in 2018 resulted in the recognition of revenue related to U.S. franchise contributions to DNAF. In prior years, under accounting standards in effect at that time, we had presented these contributions net with the related disbursements in our consolidated statement of income. Refer to Note 1 to the consolidated financial statements for additional information related to the adoption of this accounting standard. |
Revenues.
U.S. stores.
Revenues from U.S. stores are primarily comprised of retail sales from U.S. Company-owned store operations and royalties, advertising contributions and other fees from U.S. franchised stores, as summarized in the following table.
This decrease in revenues was partially offset by a 2.8% increase in same store sales as compared to 2018.
Supply chain.
Revenues from supply chain operations are primarily comprised of sales of food, equipment and supplies from our supply chain centers to substantially all of our U.S. franchised stores and certain international franchised stores.
Supply chain revenues increased $161.6 million, or 8.3%, in 2019.
This increase was due primarily to higher volumes from increased orders resulting from an increase in the average number of U.S. franchise stores open during the year and an increase in market basket pricing to stores.
International franchise revenues primarily consist of royalties from retail sales and other fees from our international franchise stores.
Revenues from international franchise operations increased $16.3 million, or 7.2%, in 2019.
The negative impact of changes in foreign currency exchange rates of approximately $8.9 million in 2019 partially offset these increases.
The changes to the consolidated operating margin, which we define as revenues less cost of sales are summarized in the following table.
The $99.8 million, or 7.7%, increase in consolidated operating margin was primarily driven by higher global franchise revenues and higher supply chain volumes, but was partially offset by lower Company-owned store margins resulting from the 2019 Store Sale.
As a percentage of total revenues, our consolidated operating margin increased 0.9 percentage points in 2019 due to higher global royalty revenues and an increase in Company-owned store and supply chain operating margins.
Operating margin in 2019 was also negatively impacted by higher labor costs, partially offset by higher same store sales.
| | • | Labor costs decreased 1.1 percentage points to 29.0% in 2019. The 2019 Store Sale contributed to the reduction in labor costs as a percentage of store revenues due to the high labor rates in the market in which the sold stores operated. The reduction in labor costs as a percentage of store revenues was partially offset by an increase in average labor rates in our remaining Company-owned store markets. |
| | • | Insurance costs increased 0.4 percentage points to 3.4% in 2019, due primarily to unfavorable claims experience. |
The $23.5 million, or 11.2%, increase in the supply chain operating margin was due primarily to higher volumes from increased franchise retail sales.
General and administrative expenses increased $9.8 million, or 2.6%, in 2019.
pre-tax
gain of $5.9 million recognized from the sale of 12 Company-owned stores in 2018 resulted in an increase in general and administrative expenses as compared to the prior year.
An excerpt. Shown here: 40 of 196 rewritten, 40 of 282 added and 40 of 119 removed. The counts are complete. For every sentence, read Item 7. Management’s Discussion and Analysis of Financial Condition and Results of Operations. in the FY2020 filing and the FY2019 filing.
Item 7A. Quantitative and Qualitative Disclosures About Market Risk.
5 rewritten, 0 added, 0 removed, 19 unchanged
[removed: In connection with the 2017 Recapitalization, we issued fixed and floating rate notes and, at December 29, 2019, we] [added: We] are exposed to interest rate risk on borrowings under our 2017 Five-Year Floating Rate Notes and our 2019 Variable Funding Notes.
As of [removed: December 29, 2019,] [added: January 3, 2021,] we did not have any outstanding borrowings under our 2019 Variable Funding Notes.
A hypothetical 1.0% adverse change in the LIBOR rate would have resulted in higher interest expense of approximately [removed: $3.1] [added: $3.2] million in [removed: 2019.][added: 2020.]
Approximately [removed: 6.7%] [added: 6.1%] of our total revenues in [removed: 2019, 6.5%] [added: 2020, 6.7%] of our total revenues in [removed: 2018] [added: 2019] and [removed: 7.4%] [added: 6.5%] of our total revenues in [removed: 2017] [added: 2018] were derived from our international franchise segment, a majority of which were denominated in foreign currencies.
A hypothetical 10% adverse change in the foreign currency rates for our international markets would have resulted in a negative impact on royalty revenues of approximately [removed: $21.2] [added: $22.2] million in [removed: 2019.][added: 2020.]
Item 1. Business.
91 rewritten, 45 added, 75 removed, 239 unchanged
Domino’s is the largest pizza company in the world based on global retail sales, with more than [removed: 17,000] [added: 17,600] locations in over 90 markets around the world as of [removed: December 29, 2019.][added: January 3, 2021.]
[removed: Although we] [added: We] are a highly-recognized global [removed: brand,] [added: brand and] we focus on serving neighborhoods locally through our large global network of franchise owners and U.S. Company-owned stores.
[removed: The Company is] [added: We are] primarily a franchisor, with approximately 98% of Domino’s stores currently owned and operated by [added: our] independent franchisees.
Franchising enables an individual to be his or her own employer and maintain control over all employment-related matters and pricing decisions, while also benefiting from the strength of the Domino’s global [removed: brand,] [added: brand and] operating system [removed: and financial resources.][added: with limited capital investment by us.]
[removed: The Company] [added: We] also [removed: generates] [added: generate] revenues and earnings by selling food, equipment and supplies to franchisees through our supply chain operations, primarily in the U.S. and Canada, and by operating a number of [removed: our own stores.][added: Company-owned stores in the U.S. Franchisees profit by selling pizza and other complementary items to their local customers.]
The Domino’s business model can yield strong returns for our franchise owners and [added: our] Company-owned stores.
[removed: We pioneered] [added: Over] the [removed: pizza delivery business and] [added: last 60 years, we have] built Domino’s into one of the most widely-recognized consumer brands in the world.
As of [removed: December 29, 2019,] [added: January 3, 2021,] the Company had [removed: $4.11] [added: $4.12] billion in total debt, which included debt from its 2019 Recapitalization and its previous recapitalization transactions in 2018, 2017 and 2015 (the “2018 Recapitalization,” “2017 Recapitalization” and the “2015 Recapitalization,” respectively, and together with the 2019 Recapitalization, the “2019, 2018, 2017 and 2015 Recapitalizations”).
[removed: During this timeframe,] [added: In the U.S.,] we [removed: also began expanding our focus on technology through our development of] [added: have developed several] innovative ordering platforms, including those [removed: developed] for Google Home, Facebook Messenger, Apple Watch, Amazon [removed: Echo] [added: Echo, Twitter] and [removed: Twitter, as well as other technological advancements, such as the launch of our Piece of the Pie Rewards][added: more.]
From [removed: 2014] [added: 2015] through [removed: 2019,] [added: 2020,] the U.S. QSR pizza category has grown from [removed: $34.8] [added: $36.0] billion to [removed: $37.8] [added: $38.2] billion.
It is the second-largest category within the [removed: $279] [added: $272.0] billion U.S. QSR sector.
In the U.S., we compete primarily in the delivery and carryout segments of the pizza industry, and we are the dollar market share leader for delivery and [removed: second-largest dollar market share] [added: a growing] leader [removed: for] [added: in] carryout.
Delivery segment dollars of [removed: $11.0] [added: $14.0] billion in [removed: 2019] [added: 2020] (up from [removed: $10.2] [added: $10.4] billion in [removed: 2014)] [added: 2015)] account for approximately [removed: 29%] [added: 37%] of total U.S. QSR pizza.
The four industry leaders, including Domino’s, account for over [removed: 61%] [added: 63%] of U.S. pizza delivery, based on reported consumer spending, with the remaining dollars going to regional chains and independent establishments.
From [removed: 2014] [added: 2015] to [removed: 2019,] [added: 2020,] the carryout segment grew from [removed: $16.9] [added: $17.5] billion to [removed: $18.8] [added: $20.3] billion.
The four industry leaders, including Domino’s, account for approximately [removed: 51%] [added: 48%] of the carryout segment.
, year ending November [removed: 2019).][added: 2020).]
We believe that demand for pizza [added: delivery] and pizza [removed: delivery] [added: carryout] is large and growing throughout the world, driven by international consumers’ increasing emphasis on convenience, and our proven success of more than 35 years of conducting business abroad.
Our business and those of our competitors can be affected by changes in consumer tastes, economic conditions, demographic [removed: trends] [added: trends, marketing, advertising, pricing] and consumers’ disposable income.
We also compete with other food, food delivery and order and delivery aggregation [removed: companies.][added: companies, which have continued to grow in size and scale in recent years.]
We compete not only for customers, but also for [added: management and hourly] employees, [removed: drivers,] [added: including store team members, drivers and qualified franchisees, as well as] suitable real estate [removed: sites and qualified franchisees.][added: sites.]
No customer accounted for more than 10% of total consolidated revenues in [removed: 2019, 2018] [added: 2020, 2019] or [removed: 2017.][added: 2018.]
As of [removed: December 29, 2019,] [added: January 3, 2021,] our largest franchisee based on store count, Domino’s Pizza Enterprises (DMP: ASX), [removed: operates 2,604] [added: operated 2,797] stores in nine international markets, and [removed: accounts] [added: accounted] for [removed: 15%] [added: 16%] of our total store count.
Revenues from this master franchisee accounted for [removed: 1.4%] [added: 1.5%] of our consolidated revenues in [removed: 2019.][added: 2020.]
Our international [removed: business unit] [added: franchise segment] only requires a modest amount of general and administrative expenses to support its markets and does not have a cost of sales component.
We have been focused [removed: primarily] on pizza delivery for [removed: nearly] 60 years, and we also [removed: place focus on] [added: emphasize] carryout as a significant component of our business.
[removed: In 2012, we introduced our carryout-friendly Pizza Theater store design; the] [added: The] majority of our U.S. and international stores [removed: have converted to this design as of] [added: are constructed in] the [removed: end of 2019.][added: carryout-friendly Pizza Theater design.]
Many [added: of these] stores offer casual seating and enable customers to watch the preparation of their orders, but do not offer a full-service
Our U.S. stores segment consists primarily of our franchise operations, which [removed: consist] [added: consisted] of [removed: 5,784] [added: 5,992] franchised stores located in the United [removed: States.][added: States as of January 3, 2021.]
During [removed: 2019,] [added: 2020,] our U.S. stores segment accounted for [removed: $1.27] [added: $1.45] billion, or 35% of our consolidated revenues.
As of [removed: December 29, 2019,] [added: January 3, 2021,] franchised stores represented [added: approximately] 94% of our total store count within our U.S. stores segment.
As of [removed: December 29, 2019,] [added: January 3, 2021,] our network of [removed: 5,784] [added: 5,992] U.S. franchise stores was owned and operated by [removed: 777] [added: 762] independent U.S. franchisees.
As of [removed: December 29, 2019,] [added: January 3, 2021,] the average U.S. franchisee owned and operated approximately seven stores and had been in our franchise system for over 18 years.
Additionally, [removed: 20] [added: 19] of our U.S. franchisees operated more than 50 stores (including our largest U.S. franchisee who operated [removed: 176] [added: 178] stores) and [removed: 240] [added: 228] of our U.S. franchisees each operated one [removed: store.][added: store, each as of that date.]
We generally require them to manage a store for at least one year and graduate from our franchise management school program before being granted [removed: a] [added: the right to] franchise.
Substantially all of our [removed: 777] independent U.S. franchise owners started their careers with us as delivery drivers or in other
We [removed: have] [added: had] a franchise agreement renewal rate of approximately [removed: 99%.][added: 99% in 2020.]
Each franchisee is generally required to pay a 5.5% royalty fee on [removed: sales] [added: sales,] as well as certain technology fees.
Our stores in the [removed: contiguous] United States currently contribute 6% of their sales to fund national marketing and advertising campaigns (subject, in certain instances, to lower rates based on certain incentives and waivers).
[removed: Our international franchise] [added: This] segment is comprised of a network of franchised stores in more than 90 international markets.
These factors emphasize our focus on our stakeholders, including our customers, team members, franchisees, communities and shareholders.
We pioneered the pizza delivery business and have been delivering quality, affordable food to our customers since 1960.
We believe our commitment to value, convenience, quality and new products continues to keep consumers engaged with the brand.
During 2020, in the midst of the uncertain environment created by the novel coronavirus
(“COVID-19”)
pandemic, we continued to increase global retail sales, and our supply chain operations experienced higher volumes as a result of the increase in U.S. retail sales.
We also launched three new products in the U.S., including new and improved chicken wings and the new chicken taco and cheeseburger specialty pizzas, each of which has been positively received by consumers.
Additionally, emphasis on technological innovation helped us achieve more than half of all global retail sales in 2020 from digital channels.
In 2020, we added GPS to our Domino’s Tracker
, which allows customers to monitor the progress of their food, from the preparation stages to the time it is in the oven, to the time it arrives at their doors.
Most recently, we launched a new way to order contactless carryout nationwide – via Domino’s Carside Delivery
, which customers can choose when placing a prepaid online order.
This new service method emphasizes our commitment to serving hot and delicious pizza in a convenient, contactless manner.
International markets vary toppings by country and culture, such as the Indi Tandoori Paneer pizza in India, featuring spicy paneer, peppers and mint mayo, or the Octopus Bomb Shrimp in Korea, featuring shrimp, octopus, vegetables, feta cream and horseradish sauce.
We also operated a network of 363 U.S. Company-owned stores as of January 3, 2021.
| Canada | | | 541 | |
| China | | | 363 | |
We also have agreements with certain of our international master franchisees with respect to certain technology fees.
We plan to continue investing in additional supply chain capacity in the future.
profit from our supply chain center operations.
, year ending November 2020).
Emphasis on technological innovation helped us achieve more than half of all global retail sales in 2020 from digital channels.
In the U.S., we have developed several innovative ordering platforms, including those for Google Home, Facebook Messenger, Apple Watch, Amazon Echo, Twitter and more.
In 2019, we announced a partnership with Nuro to further our exploration and testing of autonomous pizza delivery.
In 2020, we added GPS to our Domino’s Tracker, which allows customers to monitor the progress of their food, from the preparation stages to the time it is in the oven, to the time it arrives at their doors.
In
mid-2020,
we launched a new way to order contactless carryout nationwide – via Domino’s Carside Delivery
, which customers can choose when placing a prepaid online order.
Our Piece of the Pie Rewards
Our 60 years of innovation have resulted in numerous new product developments.
During 2020, we launched three new products in the U.S., including new and improved chicken wings and the new chicken taco and cheeseburger specialty pizzas, each of which has been positively received by consumers.
Human Capital
As of January 3, 2021, we had approximately 14,400 employees, including 10,400 employees supporting our U.S. Company-owned stores and U.S. franchise operations (our U.S. stores segment), approximately 2,900 employees supporting our U.S. and Canadian supply chain operations (our supply chain segment), approximately 100 employees supporting our international franchise operations (our international franchise segment) and approximately 1,000 corporate employees.
Approximately 7,500 of our employees are part-time and approximately 6,900 are full-time equivalent.
We have also recently increased the recycled content of our pizza boxes and launched a nationwide campaign to educate municipalities on the recyclability of pizza boxes.
You can find more information about these initiatives at
stewardship.dominos.com
In 2020, we announced a
10-year,
| --- | --- |
Franchisees profit by selling pizza and other complementary items to their local customers.
We have been delivering quality, affordable food to our customers since 1960, when brothers Thomas and James Monaghan borrowed $900 to purchase a small pizza store in Ypsilanti, Michigan.
Thomas purchased his brother’s share of the business shortly thereafter.
Concentrating first on building stores near college campuses and military bases in the 1960s and 1970s, the brand grew quickly in the 1980s in urban markets and near residential communities.
The first international stores opened in 1983, in Canada and Australia.
Monaghan sold 93% of his economic stake in the Company in 1998 to Bain Capital, LLC, and then later sold and transferred his remaining stake in the Company in 2004, when we completed our initial public offering.
Excess proceeds from our 2019, 2018, 2017 and 2015 Recapitalizations were used primarily to repurchase shares of our common stock.
We
re-launched
our brand in the U.S. in late 2009 by introducing a new recipe for our core pizza product.
Since 2008, the majority of our menu has changed, either through the improvement of existing products or the introduction of new products, such as our Handmade Pan Pizza and Specialty Chicken.
loyalty program in 2015 and the launch of Domino’s Delivery HotSpots
in 2018.
Globally, we opened our 10,000
th
store in 2012 and our 17,000
store in 2019.
In 2012, we announced a plan requiring all stores to adopt our new
carry-out
friendly “Pizza Theater” store design, which is more inviting to customers and allows them to see their orders being made fresh in front of them.
The majority of our U.S. and international stores have completed these remodels as of the end of 2019.
International markets vary toppings by country and culture, such as a squid topping in Japan or spicy cheese in India, and often feature regional specialty items, such as a banana and cinnamon dessert pizza in Brazil.
We also operate a network of 342 U.S. Company-owned stores.
in-store
| Canada | | | 520 | |
| Germany (DMP: ASX) | | | 325 | |
We plan to continue investing in additional supply chain centers and capacity initiatives in the future, including two additional regional dough manufacturing and food supply chain centers that are expected to open in fiscal 2020.
We also operate five dough manufacturing and food supply chain centers in Canada.
profits.
New stores built in our Pizza Theater design are often slightly larger than stores we have built in the past to create a better experience for our carryout customers; however, they are still generally smaller and less expensive to build, furnish and maintain than many other restaurant concepts.
Digital ordering is critical to competing in the global pizza industry.
In 2019, more than half of all global retail sales were derived from digital channels, primarily through our online ordering website and mobile applications.
We believe we are among the largest
e-commerce
retailers in terms of annual transactions.
After launching digital ordering and the Domino’s Tracker
in the U.S. in 2008, we made the strategic decision in 2010 to develop our own online ordering platform and to manage this important and growing area of our business internally.
Over the next five years, we launched mobile applications that cover the majority of the smartphones and tablets on the U.S. market.
In 2013, we launched an enhanced online ordering profiles platform, allowing customers the ability to reorder their favorite order in as few as five clicks, or 30 seconds.
An excerpt. Shown here: 40 of 91 rewritten, 40 of 45 added and 40 of 75 removed. The counts are complete. For every sentence, read Item 1. Business. in the FY2020 filing and the FY2019 filing.
Item 3. Legal Proceedings.
0 rewritten, 0 added, 8 removed, 7 unchanged
On February 14, 2011, Domino’s Pizza LLC was named as a defendant in a lawsuit along with Fischler Enterprises of C.F., Inc., a franchisee, and Jeffrey S.
Kidd, the franchisee’s delivery driver, filed by Yvonne Wiederhold, the plaintiff, as Personal Representative of the Estate of Richard E.
Wiederhold, deceased.
The case involved a traffic accident in which the franchisee’s delivery driver is alleged to have caused an accident involving a vehicle driven by Richard Wiederhold.
Mr. Wiederhold sustained spinal injuries resulting in quadriplegia and passed away several months after the accident.
The case went to trial in 2016 and the Company was found liable, but the verdict was reversed by the Florida Fifth District Court of Appeals in May 2018 and was remanded to the Ninth Judicial Circuit Court of Florida for a new trial.
The case was tried again in June 2019 and the jury returned a $9.0 million judgment for the plaintiff where the Company and Mr. Kidd were found to be 100% liable (after certain offsets and other deductions the final verdict was $8.0 million).
The Company continues to deny liability and has filed an appeal.
Cover and table of contents
31 rewritten, 10 added, 6 removed, 74 unchanged
For the fiscal year ended [added: January 3, 2021]
| (State or other jurisdiction of [removed: incorporation or organization)] | | (I.R.S. Employer [removed: Identification No.)] |
Indicate by check mark if the registrant is a well-known seasoned issuer, as defined in Rule 405 of the Securities Act: Yes [added: ☒ No ☐]
Indicate by check mark if the registrant is not required to file reports pursuant to Section 13 or Section 15(d) of the Act: Yes [added: ☐ No ☒]
Indicate by check mark whether the registrant (1) has filed all reports required to be filed by Section 13 or 15(d) of the Securities Exchange Act of 1934 during the preceding 12 months (or for such shorter period that the registrant was required to file such reports), and (2) has been subject to such filing requirements for the past 90 days: Yes [added: ☒ No ☐]
(§232.405 of this chapter) during the preceding 12 months (or for such shorter period that the registrant was required to submit such files): Yes [added: ☒ No ☐]
| [removed: Emerging growth company] | | [removed: ☐] | | [added: Emerging growth company] | | [added: ☐] |
of the Act): Yes [added: ☐ No ☒]
of Domino’s Pizza, Inc. as of June [removed: 16, 2019] [added: 14, 2020] computed by reference to the closing price of Domino’s Pizza, Inc.’s common stock on the New York Stock Exchange on such date was [removed: $11,503,936,585.][added: $14,785,755,999.]
As of February [removed: 13, 2020,] [added: 18, 2021,] Domino’s Pizza, Inc. had [removed: 38,667,039] [added: 38,803,504] shares of common stock, par value $0.01 per share, outstanding.
Portions of the definitive proxy statement to be furnished to shareholders of Domino’s Pizza, Inc. in connection with the annual meeting of shareholders to be held on April [removed: 21, 2020] [added: 27, 2021] are incorporated by reference into Part III.
| | | [removed: Part I] | | Page No. | | |
| [removed: [Item 1A.](#tx796357_2)] [added: Item 1A.] | | [Risk [removed: Factors.](#tx796357_2)] [added: Factors](#tx326373_2)] | | | 11 | |
| [removed: [Item 1B.](#tx796357_3)] [added: Item 1B.] | | [Unresolved Staff [removed: Comments.](#tx796357_3)] [added: Comments](#tx326373_3)] | | | 24 | |
| [removed: [Item 4.](#tx796357_6)] [added: Item 4.] | | [Mine Safety [removed: Disclosures.](#tx796357_6)] [added: Disclosures](#tx326373_6)] | | | 24 | |
| [removed: [Item 4A.](#tx796357_7)] [added: Item 4A.] | | [Executive Officers of the [removed: Registrant.](#tx796357_7)] [added: Registrant](#tx326373_7)] | | | 24 | |
| [removed: [Item 5.](#tx796357_8)] [added: Item 5.] | | [Market for Registrant’s Common Equity, Related Stockholder Matters and Issuer Purchases of Equity [removed: Securities.](#tx796357_8)] [added: Securities](#tx326373_8)] | | | 25 | |
| [removed: [Item 6.](#tx796357_9)] [added: Item 6.] | | [Selected Financial [removed: Data.](#tx796357_9)] [added: Data](#tx326373_9)] | | | 27 | |
| [removed: [Item 7.](#tx796357_10)] [added: Item 7.] | | [Management’s Discussion and Analysis of Financial Condition and Results of [removed: Operations.](#tx796357_10)] [added: Operations](#tx326373_10)] | | | [removed: 29] [added: 27] | |
| [removed: [Item 7A.](#tx796357_11)] [added: Item 7A.] | | [Quantitative and Qualitative Disclosures About Market [removed: Risk.](#tx796357_11)] [added: Risk](#tx326373_11)] | | | [removed: 41] [added: 42] | |
| [removed: [Item 8.](#tx796357_12)] [added: Item 8.] | | [Financial Statements and Supplementary [removed: Data.](#tx796357_12)] [added: Data](#tx326373_12)] | | | [removed: 42] [added: 43] | |
| [removed: [Item 9.](#tx796357_13)] [added: Item 9.] | | [Changes in and Disagreements with Accountants on Accounting and Financial [removed: Disclosure.](#tx796357_13)] [added: Disclosure](#tx326373_13)] | | | [removed: 74] [added: 75] | |
| [removed: [Item 9A.](#tx796357_14)] [added: Item 9A.] | | [Controls and [removed: Procedures.](#tx796357_14)] [added: Procedures](#tx326373_14)] | | | [removed: 74] [added: 75] | |
| [removed: [Item 9B.](#tx796357_15)] [added: Item 9B.] | | [Other [removed: Information.](#tx796357_15)] [added: Information](#tx326373_15)] | | | [removed: 74] [added: 75] | |
| [removed: [Item 10.](#tx796357_16)] [added: Item 10.] | | [Directors, Executive Officers and Corporate [removed: Governance.](#tx796357_16)] [added: Governance](#tx326373_16)] | | | [removed: 75] [added: 76] | |
| [removed: [Item 11.](#tx796357_17)] [added: Item 11.] | | [Executive [removed: Compensation.](#tx796357_17)] [added: Compensation](#tx326373_17)] | | | [removed: 78] [added: 79] | |
| [removed: [Item 12.](#tx796357_18)] [added: Item 12.] | | [Security Ownership of Certain Beneficial Owners and Management and Related Stockholder [removed: Matters.](#tx796357_18)] [added: Matters](#tx326373_18)] | | | [removed: 78] [added: 79] | |
| [removed: [Item 13.](#tx796357_19)] [added: Item 13.] | | [Certain Relationships and Related Transactions, and Director [removed: Independence.](#tx796357_19)] [added: Independence](#tx326373_19)] | | | [removed: 78] [added: 79] | |
| [removed: [Item 14.](#tx796357_20)] [added: Item 14.] | | [Principal Accountant Fees and [removed: Services.](#tx796357_20)] [added: Services](#tx326373_20)] | | | [removed: 78] [added: 79] | |
| [removed: [Item 15.](#tx796357_21)] [added: Item 15.] | | [Exhibits, Financial Statement [removed: Schedules.](#tx796357_21)] [added: Schedules](#tx326373_21)] | | | [removed: 79] [added: 80] | |
| [removed: [Item 16.](#tx796357_22)] [added: Item 16.] | | [Form 10-K [removed: Summary.](#tx796357_22)] [added: Summary](#tx326373_22)] | | | [removed: 84] [added: 91] | |
##### [Table of Contents](#toc)
| incorporation or organization) | | Identification No.) |
| | | |
Indicate by check mark whether the registrant has filed a report on and attestation to its management’s assessment of the effectiveness of its internal control over financial reporting under Section 404(b) of the Sarbanes-Oxley Act (15 U.S.C. 7262(b)) by the registered public accounting firm that prepared or issued its audit report.
| | | Part I | | | | |
| Item 1. | | [Business](#tx326373_1) | | | 2 | |
| Item 2. | | [Properties](#tx326373_4) | | | 24 | |
| Item 3. | | [Legal Proceedings](#tx326373_5) | | | 24 | |
| | | | | | | |
| [SIGNATURES](#tx326373_23) | | | | | 92 | |
December 29, 2019
No
| [Item 1.](#tx796357_1) | | [Business.](#tx796357_1) | | | 2 | |
| [Item 2.](#tx796357_4) | | [Properties.](#tx796357_4) | | | 24 | |
| [Item 3.](#tx796357_5) | | [Legal Proceedings.](#tx796357_5) | | | 24 | |
| [SIGNATURES](#tx796357_23) | | | | | 90 | |
Item 2. Properties.
2 rewritten, 0 added, 1 removed, 9 unchanged
All [removed: other] [added: buildings for] U.S. Company-owned stores are leased by us, typically under
All other U.S. and international supply chain centers are leased by us, [removed: typically] under leases ranging between five and 21 years with one or two five-year renewal options.
We also own one store building that we lease to a U.S. franchisee.
Item 4A. Executive Officers of the Registrant.
1 rewritten, 0 added, 0 removed, 3 unchanged
Directors, Executive Officers and Corporate Governance on pages [removed: 75] [added: 76] through [removed: 78,] [added: 79,] which is incorporated herein by reference.
Item 5. Market for Registrant’s Common Equity, Related Stockholder Matters and Issuer Purchases of Equity Securities.
10 rewritten, 9 added, 5 removed, 14 unchanged
As of February [removed: 13, 2020,] [added: 18, 2021,] Domino’s Pizza, Inc. had 170,000,000 authorized shares of common stock, par value $0.01 per share, of which [removed: 38,667,039] [added: 38,803,504] were issued and outstanding.
Our Board of Directors declared a quarterly dividend of [removed: $0.78] [added: $0.94] per common share on February [removed: 19, 2020] [added: 24, 2021] payable on March 30, [removed: 2020] [added: 2021] to shareholders of record at the close of business on March [removed: 13, 2020.][added: 15, 2021.]
As of February [removed: 13, 2020,] [added: 18, 2021,] there were [removed: 1,510] [added: 1,578] registered holders of record of Domino’s Pizza, Inc.’s common stock.
As of [removed: December 29, 2019,] [added: January 3, 2021,] we had a Board of Directors-approved share repurchase program for up to $1.0 billion of our common stock, of which [removed: $406.1] [added: $101.6] million remained available for future purchases of our common stock.
The following table summarizes our repurchase activity during the fourth quarter ended [removed: December 29, 2019:][added: January 3, 2021:]
| (1) | [removed: 3,471] [added: 3,014] shares were purchased as part of the Company’s employee stock purchase discount plan. During the fourth quarter, the shares were purchased at an average price of [removed: $264.65.] [added: $398.48.] |
[removed: | (2) | From December 29, 2019 through February 13, 2020, the Company repurchased and retired 271,064 shares of common stock for a total of approximately $79.6 million, or an average price of $293.62 per share. Authorization for the repurchase program may be modified, suspended, or discontinued at any time.] The repurchase of shares in any particular period and the actual amount of such purchases remain at the discretion of the Board of Directors, and no assurance can be given that shares will be repurchased in the future. [removed: |]
The following comparative stock performance line graph compares the cumulative shareholder return on the common stock of Domino’s Pizza, Inc. (NYSE: DPZ) for the five-year period between December 31, [removed: 2014] [added: 2015] and December 31, [removed: 2019,] [added: 2020,] with cumulative total return on (i) the Standard & Poor’s 500 Index (the “S&P 500”) and (ii) the peer group, the Standard & Poor’s 400 Restaurant Index (the “S&P 400 Restaurant Index”).
The cumulative total return computations set forth in the performance graph assume the investment of $100 in the Company’s common stock, the S&P 500 Index and the S&P 400 Restaurant Index on December 31, [removed: 2014.][added: 2015.]
[removed: 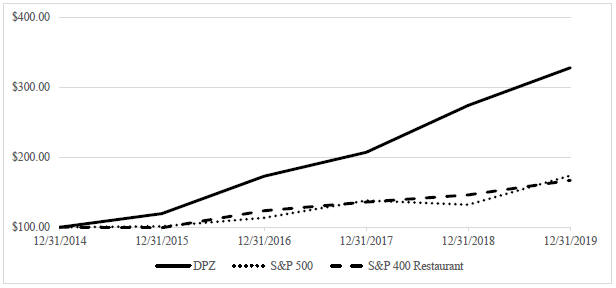][added: 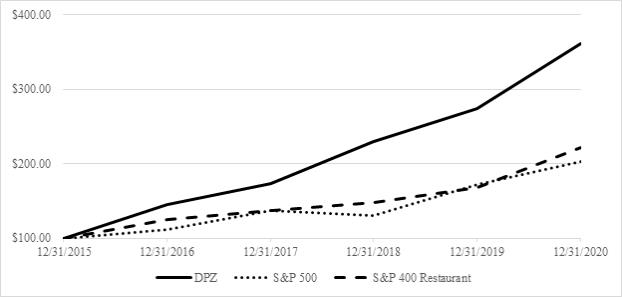]
| Period #10 (September 7, 2020 to October 4, 2020) | | | 933 | | | $ | 430.25 | | | | — | | | $ | 326,552 | |
| Period #11 (October 5, 2020 to November 1, 2020) | | | 503,202 | | | | 398.39 | | | | 501,956 | | | | 126,552 | |
| Period #12 (November 2, 2020 to November 29, 2020) | | | 65,851 | | | | 379.64 | | | | 65,851 | | | | 101,552 | |
| Period #13 (November 30, 2020 to January 3, 2021) | | | 835 | | | | 391.53 | | | | — | | | | 101,552 | |
| Total | | | 570,821 | | | $ | 396.27 | | | | 567,807 | | | $ | 101,552 | |
| (2) | From January 4, 2021 through February 18, 2021, the Company repurchased and retired an additional 65,870 shares of common stock for approximately $25.0 million, or an average price of $379.53 per share. |
On February 24, 2021, the Company’s Board of Directors authorized a new share repurchase program to repurchase up to $1.0 billion of the Company’s common stock.
This repurchase program replaces the remaining availability of approximately $76.6 million under the Company’s previously approved $1.0 billion share repurchase program.
Authorization for the repurchase program may be modified, suspended, or discontinued at any time.
| Period #10 (September 9, 2019 to October 6, 2019) | | | 1,281 | | | $ | 244.16 | | | | — | | | $ | 1,000,000 | |
| Period #11 (October 7, 2019 to November 3, 2019) | | | 4,441 | | | | 239.20 | | | | 3,300 | | | | 999,242 | |
| Period #12 (November 4, 2019 to December 1, 2019) | | | 933,055 | | | | 285.26 | | | | 933,055 | | | | 733,078 | |
| Period #13 (December 2, 2019 to December 29, 2019) | | | 1,128,072 | | | | 290.09 | | | | 1,127,023 | | | | 406,142 | |
| Total | | | 2,066,849 | | | $ | 287.81 | | | | 2,063,378 | | | $ | 406,142 | |
Item 6. Selected Financial Data.
0 rewritten, 2 added, 62 removed, 1 unchanged
The Company has applied the amendment to Regulation
S-K
| --- | --- |
The following selected financial data set forth should be read in conjunction with, and is qualified by reference to, Management’s Discussion and Analysis of Financial Condition and Results of Operations and the consolidated financial statements and related notes included in this Form
10-K.
The selected financial data, with the exception of store counts, global retail sales growth and same store sales growth, has been derived from the audited consolidated financial statements of Domino’s Pizza, Inc. and subsidiaries.
This historical data is not necessarily indicative of results to be expected for any future period.
| | | | | | | | | | | | | | | | | | | | | |
| --- | --- | --- | --- | --- | --- | --- | --- | --- | --- | --- | --- | --- | --- | --- | --- | --- | --- | --- | --- | --- |
| | | Fiscal year ended (8) | | | | | | | | | | | | | | | | | | |
| (dollars in millions, except per share data) | | December 29, 2019 | | | | December 30, 2018 (4) | | | | December 31, 2017 | | | | January 1, 2017 | | | | January 3, 2016 | | |
| Income statement data: | | | | | | | | | | | | | | | | | | | | |
| Revenues: | | | | | | | | | | | | | | | | | | | | |
| U.S. Company-owned stores | | $ | 453.6 | | | $ | 514.8 | | | $ | 490.8 | | | $ | 439.0 | | | $ | 396.9 | |
| U.S. franchise royalties and fees | | | 428.5 | | | | 391.5 | | | | 351.4 | | | | 312.3 | | | | 272.8 | |
| U.S. franchise advertising (1) | | | 390.8 | | | | 358.5 | | | | — | | | | — | | | | — | |
| U.S. stores | | | 1,272.9 | | | | 1,264.8 | | | | 842.2 | | | | 751.3 | | | | 669.7 | |
| Supply chain | | | 2,104.9 | | | | 1,943.3 | | | | 1,739.0 | | | | 1,544.3 | | | | 1,383.2 | |
| International franchise royalties and fees | | | 241.0 | | | | 224.7 | | | | 206.7 | | | | 177.0 | | | | 163.6 | |
| Total revenues | | | 3,618.8 | | | | 3,432.9 | | | | 2,788.0 | | | | 2,472.6 | | | | 2,216.5 | |
| Cost of sales | | | 2,216.3 | | | | 2,130.2 | | | | 1,922.0 | | | | 1,704.9 | | | | 1,533.4 | |
| Operating margin | | | 1,402.5 | | | | 1,302.7 | | | | 866.0 | | | | 767.7 | | | | 683.1 | |
| General and administrative expense | | | 382.3 | | | | 372.5 | | | | 344.8 | | | | 313.6 | | | | 277.7 | |
| Income from operations | | | 629.4 | | | | 571.7 | | | | 521.2 | | | | 454.0 | | | | 405.4 | |
| Interest income | | | 4.0 | | | | 3.3 | | | | 1.5 | | | | 0.7 | | | | 0.3 | |
| Interest expense | | | (150.8 | ) | | | (146.3 | ) | | | (122.5 | ) | | | (110.1 | ) | | | (99.5 | ) |
| Income before provision for income taxes | | | 482.6 | | | | 428.7 | | | | 400.2 | | | | 344.7 | | | | 306.2 | |
| Provision for income taxes | | | 81.9 | | | | 66.7 | | | | 122.2 | | | | 130.0 | | | | 113.4 | |
| Net income | | $ | 400.7 | | | $ | 362.0 | | | $ | 277.9 | | | $ | 214.7 | | | $ | 192.8 | |
| Earnings per share: | | | | | | | | | | | | | | | | | | | | |
| Common stock – basic | | $ | 9.83 | | | $ | 8.65 | | | $ | 6.05 | | | $ | 4.41 | | | $ | 3.58 | |
| Common stock – diluted | | | 9.56 | | | | 8.35 | | | | 5.83 | | | | 4.30 | | | | 3.47 | |
| Balance sheet data (at end of period): | | | | | | | | | | | | | | | | | | | | |
| Cash and cash equivalents | | $ | 190.6 | | | $ | 25.4 | | | $ | 35.8 | | | $ | 42.8 | | | $ | 133.4 | |
| Restricted cash and cash equivalents | | | 209.3 | | | | 167.0 | | | | 191.8 | | | | 126.5 | | | | 180.9 | |
| Cash and cash equivalents included in advertising fund assets, restricted | | | 84.0 | | | | 45.0 | | | | 27.3 | | | | 25.1 | | | | 19.9 | |
| Working capital (2) | | | 121.0 | | | | 14.6 | | | | (10.3 | ) | | | (34.3 | ) | | | 45.7 | |
| Total assets (3) | | | 1,382.1 | | | | 907.4 | | | | 836.8 | | | | 716.3 | | | | 799.8 | |
| Total debt net of debt issuance cost | | | 4,114.4 | | | | 3,531.6 | | | | 3,153.8 | | | | 2,187.9 | | | | 2,240.8 | |
| Total stockholders’ deficit | | | (3,415.8 | ) | | | (3,039.9 | ) | | | (2,735.4 | ) | | | (1,883.1 | ) | | | (1,800.3 | ) |
| Other financial data: | | | | | | | | | | | | | | | | | | | | |
| Depreciation and amortization | | $ | 59.9 | | | $ | 53.7 | | | $ | 44.4 | | | $ | 38.1 | | | $ | 32.4 | |
An excerpt. Shown here: all 0 rewritten, all 2 added and 40 of 62 removed. The counts are complete. For every sentence, read Item 6. Selected Financial Data. in the FY2020 filing and the FY2019 filing.
Item 8. Financial Statements and Supplementary Data.
505 rewritten, 229 added, 284 removed, 785 unchanged
We have audited the accompanying consolidated balance sheets of Domino’s Pizza, Inc. and its subsidiaries (the “Company”) as of [removed: December 29, 2019] [added: January 3, 2021] and December [removed: 30, 2018,] [added: 29, 2019,] and the related consolidated statements of income, comprehensive income, stockholders’ deficit and cash flows for each of the three years in the period ended [removed: December 29, 2019,] [added: January 3, 2021,] including the related [removed: notes,] [added: notes and] the [removed: schedules] [added: schedule] of condensed financial information of the registrant as of [removed: December 29, 2019 and December 30, 2018] [added: January 3, 2021] and [removed: for each of the three years in the period ended] December 29, 2019 and [removed: of valuation and qualifying accounts] for each of the three years in the period ended [removed: December 29, 2019] [added: January 3, 2021] appearing under Item [removed: 16] [added: 15] (collectively referred to as [added: the] “consolidated financial statements”).
We also have audited the Company’s internal control over financial reporting as of [removed: December 29, 2019,] [added: January 3, 2021,] based on criteria established in
Internal [removed: Control - Integrated] [added: Control—Integrated] Framework
In our opinion, the consolidated financial statements referred to above present fairly, in all material respects, the financial position of the Company as of [removed: December 29, 2019] [added: January 3, 2021] and December [removed: 30, 2018,][added: 29, 2019,]
and the results of its operations and its cash flows for each of the three years in the period ended [removed: December 29, 2019][added: January 3, 2021]
Also in our opinion, the Company maintained, in all material respects, effective internal control over financial reporting as of [removed: December 29, 2019,] [added: January 3, 2021,] based on criteria established in
As discussed in Note 1 to the consolidated financial statements, the Company changed the manner in which it accounts for leases in [removed: 2019,] [added: 2019] and the manner in which it accounts for revenue in 2018.
The communication of critical audit matters does not alter in any way our opinion on the consolidated [added: financial statements, taken as a whole, and we are not, by communicating the critical audit matter below, providing a separate opinion on the critical audit matter or on the accounts or disclosures to which it relates.]
As of [removed: December 29, 2019,] [added: January 3, 2021,] the Company had accruals for these insurance matters of [removed: $50.3] [added: $54.6] million.
[removed: The Company] [added: Management] utilizes various methods, including analyses of historical trends and actuarial valuation methods, to estimate the cost to settle reported claims and claims incurred but not yet reported.
[removed: This in turn led] [added: The principal considerations for our determination that performing procedures relating] to [added: the valuation of insurance reserves is] a [added: critical audit matter are (i) the significant judgment by management when developing the estimated reserves; (ii) a] high degree of auditor judgment and effort in performing procedures relating to the [removed: auditing of the] actuarial valuation methods used to develop future ultimate claim [removed: costs, including] [added: costs and actuarial] assumptions related to the severity, duration and frequency of claims, legal cost associated with claims, healthcare trends and projected [removed: inflation.][added: inflation; and (iii) the audit effort involved the use of professionals with specialized skill and knowledge.]
These procedures included testing the effectiveness of controls relating to the valuation of insurance [removed: reserves, including controls over the assumptions and data used in the actuarial valuation methods.][added: reserves.]
Professionals with specialized skill and knowledge were used to assist in testing management’s process for estimating the valuation of insurance reserves, including evaluating the appropriateness of the actuarial valuation methods and the reasonableness of [added: actuarial] assumptions related to the severity, duration and frequency of claims, legal cost associated with claims, healthcare trends and projected inflation.
[removed: |] /s/ PricewaterhouseCoopers LLP [removed: |]
[removed: |] Detroit, Michigan [removed: |]
[removed: | February 20, 2020 |][added: 2020-04,]
| | | [removed: December 29,] [added: 2021 | | | |] 2019 | | | | [removed: December 30,] 2018 | | |
| Cash and cash [removed: equivalents] [added: equivalents, beginning of period] | | [removed: $] | 190,615 | | | [removed: $] | 25,438 | | [added: | | 35,768 | |]
| Restricted cash and cash [removed: equivalents] [added: equivalents, beginning of period] | | | 209,269 | | | | 166,993 | | [added: | | 191,762 | |]
| Accounts receivable, net of reserves of [removed: $2,856] [added: $1,793] in [removed: 2019] [added: 2020] and [removed: $1,879] [added: $2,856] in [removed: 2018] [added: 2019] | | | [removed: 210,260] [added: 244,560] | | | | [removed: 190,091] [added: 210,260] | |
| Inventories | | | [removed: 52,955] [added: 66,683] | | | | [removed: 45,975] [added: 52,955] | |
| Prepaid expenses and other | | | [removed: 19,129] [added: 24,169] | | | | [removed: 25,710] [added: 19,129] | |
| Advertising fund assets, restricted | | | [removed: 105,389] [added: 147,698] | | | | [removed: 112,744] [added: 105,389] | |
| Total current assets | | | [removed: 787,617] [added: 869,384] | | | | [removed: 566,951] [added: 787,617] | |
| Land and buildings | | | [removed: 44,845] [added: 88,063] | | | | [removed: 41,147] [added: 44,845] | |
| Leasehold and other improvements | | | [removed: 164,071] [added: 186,456] | | | | [removed: 170,498] [added: 164,071] | |
| Equipment | | | [removed: 243,708] [added: 292,456] | | | | [removed: 243,654] [added: 243,708] | |
| Construction in progress | | | [removed: 42,705] [added: 13,014] | | | | [removed: 31,822] [added: 42,705] | |
| Accumulated depreciation and amortization | | | [removed: (252,448] [added: (282,625] | ) | | | [removed: (252,182] [added: (252,448] | ) |
| Property, plant and equipment, net | | | [removed: 242,881] [added: 297,364] | | | | [removed: 234,939] [added: 242,881] | |
| Operating lease right-of-use assets | | | [removed: 228,785] [added: 228,268] | | | | [removed: —] [added: 228,785] | |
| Investments in marketable securities, restricted | | | [removed: 11,982] [added: 13,251] | | | | [removed: 8,718] [added: 11,982] | |
| Goodwill | | | [removed: 15,093] [added: 15,061] | | | | [removed: 14,919] [added: 15,093] | |
| Capitalized software, net of accumulated amortization of [removed: $104,237] [added: $124,043] in [removed: 2019] [added: 2020] and [removed: $89,161] [added: $104,237] in [removed: 2018] [added: 2019] | | | [removed: 73,140] [added: 81,306] | | | | [removed: 63,809] [added: 73,140] | |
| Deferred income taxes | | | [removed: 10,073] [added: 1,904] | | | | [removed: 5,526] [added: 10,073] | |
| Total other assets | | | [removed: 351,594] [added: 400,420] | | | | [removed: 105,495] [added: 351,594] | |
| Total assets | | $ | [removed: 1,382,092] [added: 1,567,168] | | | $ | [removed: 907,385] [added: 1,382,092] | |
| Current portion of long-term debt | | $ | [removed: 43,394] [added: 2,855] | | | $ | [removed: 35,893] [added: 43,394] | |
| Accounts payable | | | [removed: 111,101] [added: 94,499] | | | | [removed: 92,546] [added: 111,101] | |
| Accrued compensation | | | [removed: 46,214] [added: 58,520] | | | | [removed: 40,962] [added: 46,214] | |
Internal Control—Integrated Framework
February 25, 2021
| Cash and cash equivalents | | $ | 168,821 | | | $ | 190,615 | |
| | | | 579,989 | | | | 495,329 | |
| Other assets | | | 60,630 | | | | 12,521 | |
| Deferred income taxes | | | 6,099 | | | | — | |
| U.S. franchise advertising | | | 462,238 | | | | 390,799 | | | | 358,526 | |
| | | January 3, | | | | December 29, | | | | December 30, | | |
| Net income | | $ | 491,296 | | | $ | 400,709 | | | $ | 361,972 | |
| | | | | | | | | | | Paid-in | | | | Retained | | | | Comprehensive | | |
| | | Shares | | | | Amount | | | | Capital | | | | Deficit | | | | Income (Loss) | | |
| Net income | | | — | | | | — | | | | — | | | | 491,296 | | | | — | |
| Purchases of common stock | | | (838,871 | ) | | | (8 | ) | | | (43,524 | ) | | | (261,058 | ) | | | — | |
| Exercises of stock options | | | 756,683 | | | | 8 | | | | 30,962 | | | | — | | | | — | |
| Adoption of ASC 326 (Note 1) | | | — | | | | — | | | | — | | | | 1,102 | | | | — | |
| Balance at January 3, 2021 | | | 38,868,350 | | | $ | 389 | | | $ | 5,122 | | | $ | (3,303,492 | ) | | $ | (2,424 | ) |
| | | January 3, | | | | December 29, | | | | December 30, | | |
| Net income | | $ | 491,296 | | | $ | 400,709 | | | $ | 361,972 | |
| Purchase of investments (Note 9) | | | (40,000 | ) | | | — | | | | — | |
As of
Allowances for Credit Losses
The Company closely monitors accounts and notes receivable balances and estimates the allowance for credit losses.
These estimates are based on historical collection experience and other factors, including those related to current market conditions and events.
The Company’s allowances for accounts and notes receivable have not historically been material.
The Company also monitors its off-balance sheet exposures under its letters of credit (Note 4), lease guarantees (Note 5) and surety bonds.
Total conditional commitments under surety bonds
were $11.0 million as of January 3, 2021 and $7.6 million as of December 29, 2019.
None of these arrangements has had or is likely to have a material effect on the Company’s results of operations, financial condition, revenues, expenses or liquidity.
Inventories at January 3, 2021 and December 29, 2019
were
This intangible asset had a net carrying value, inclusive of accumulated amortization, of $0.9 million and
1.3
| | | |
| --- | --- | --- |
Equity investments without readily determinable fair values
Equity investments without readily determinable fair values are recorded at cost with adjustments for observable changes in prices resulting from orderly transactions for the identical or a similar investment of the same issuer or impairments and are classified as long-term other assets in the Company’s consolidated balance sheet.
Any adjustments to the carrying amount are recognized in other income (expense), net in the Company’s
consolidated statements of income.
The Company evaluates the potential impairment of its investments based on various analyses including financial results and operating trends, implied values from recent similar transactions and other relevant available information.
If the carrying amount of the investment exceeds the estimated fair value of the investment, an impairment loss is recognized, and the investment is written down to its estimated fair value.
| --- | --- |
financial statements, taken as a whole, and we are not, by communicating the critical audit matter below, providing a separate opinion on the critical audit matter or on the accounts or disclosures to which it relates.
The principal considerations for our determination that performing procedures relating to the valuation of insurance reserves is a critical audit matter are there was significant judgment by management when developing the estimated reserves.
In addition, the audit effort involved the use of professionals with specialized skill and knowledge to assist in performing these procedures.
| |
| --- |
| | | | | | | | | |
| | | | 495,329 | | | | 487,121 | |
| Other assets, net of accumulated amortization of $56 in 2019 and $776 in 2018 | | | 12,521 | | | | 12,523 | |
| | | | | | | | | | | | | | | | | | | | | |
| --- | --- | --- | --- | --- | --- | --- | --- | --- | --- | --- | --- | --- | --- | --- | --- | --- | --- | --- | --- | --- |
| | | Shares | | | | Amount | | | | | | | | | | | | | | |
| Balance at January 1, 2017 | | | 48,100,143 | | | $ | 481 | | | $ | 1,006 | | | $ | (1,881,520 | ) | | $ | (3,110 | ) |
| Net income | | | — | | | | — | | | | — | | | | 277,905 | | | | — | |
| Purchases of common stock | | | (5,576,249 | ) | | | (56 | ) | | | (12,590 | ) | | | (1,051,607 | ) | | | — | |
| Exercises of stock options | | | 357,925 | | | | 4 | | | | 6,095 | | | | — | | | | — | |
| Other | | | — | | | | — | | | | (122 | ) | | | — | | | | — | |
| Other | | | — | | | | — | | | | (205 | ) |
| Cash and cash equivalents, beginning of period | | | 25,438 | | | | 35,768 | | | | 42,815 | |
Restricted cash and cash equivalents at December 29, 2019 includes approximately $157.4
48.7
3.2
million of other restricted cash.
84.0
Restricted cash and cash equivalents at December 30, 2018 includes approximately $130.3
structure
, $36.5 million of restricted cash equivalents held in a three-month interest reserve as required by the related debt agreements and $0.2 million of other restricted cash.
not-to-compete
and other intangible assets primarily arising from franchise acquisitions.
As of December 30, 2018, all intangible assets with useful lives were fully amortized.
| | | | | |
| --- | --- | --- | --- | --- |
As of December 29, 2019, scheduled amortization
for
4.2 million and $4.0
16.3 million and $15.9
| Deferred franchise fees and deferred development fees at end of period | | $ | 20,463 | | | $ | 19,900 | |
fee on sales.
relocation
incentives and new store incentives.
An excerpt. Shown here: 40 of 505 rewritten, 40 of 229 added and 40 of 284 removed. The counts are complete. For every sentence, read Item 8. Financial Statements and Supplementary Data. in the FY2020 filing and the FY2019 filing.
Item 9A. Controls and Procedures.
11 rewritten, 1 added, 1 removed, 11 unchanged
[removed: |] (a) [removed: |] Evaluation of Disclosure Controls and Procedures. [removed: |]
The Company carried out an evaluation as of the end of the period covered by this report, under the supervision and with the participation of the Company’s management, including the Company’s Chief Executive Officer and Chief Financial Officer, of the effectiveness of the design and operation of the Company’s disclosure controls and procedures pursuant to [removed: Rules]
[added: Rules] 13a-15
[removed: |] (b) [removed: |] Changes in Internal Control over Financial Reporting. [removed: |]
[removed: |] (c) [removed: |] Management’s Annual Report on Internal Control over Financial Reporting. [removed: |]
Internal control over financial reporting is defined in [removed: Rule]
[added: Rule] 13a-15(f)
Under the supervision and with the participation of the Company’s management, including its Chief Executive Officer and Chief Financial Officer, the Company conducted an evaluation of the effectiveness of its internal control over financial reporting as of [removed: December 29, 2019] [added: January 3, 2021] based on the framework in
[removed: Internal Control] — Integrated Framework (2013)
Based on that evaluation, management concluded that its internal control over financial reporting was effective as of [removed: December 29, 2019.][added: January 3, 2021.]
The effectiveness of the Company’s internal control over financial reporting as of [removed: December 29, 2019,] [added: January 3, 2021,] has been audited by PricewaterhouseCoopers LLP, an independent registered public accounting firm, as stated in their report which appears herein.
Internal Control
| --- | --- |
Item 10. Directors, Executive Officers and Corporate Governance.
51 rewritten, 28 added, 27 removed, 93 unchanged
| Name | | Age | | [removed: | |] Position |
| David A. Brandon | | [removed: | 67 |] [added: 68] | | Chairman of the Board of Directors |
| Richard E. Allison, Jr. | | [removed: | 53 |] [added: 54] | | Chief Executive Officer [added: and Director] |
| [removed: Jeffrey D. Lawrence | |] [added: Stuart A. Levy] | [removed: 46] | [added: 49] | | Executive Vice President, Chief Financial Officer |
| Russell J. Weiner | | [removed: | 51 |] [added: 52] | | Chief Operating Officer and [removed: President of the Americas] [added: President—Domino’s U.S.] |
| Thomas B. Curtis | | [removed: | 56 |] [added: 57] | | Executive Vice President, [removed: Corporate] [added: U.S.] Operations [added: and Support] |
| Joseph H. Jordan | | [removed: | 46 |] [added: 47] | | Executive Vice President, International |
| [removed: Stuart] [added: Cynthia] A. [removed: Levy | |] [added: Headen] | [removed: 48] | [added: 52] | | Executive Vice President, Supply Chain Services |
| Timothy P. McIntyre | | [removed: | 57 |] [added: 58] | | Executive Vice President, [removed: Communication, Investor Relations] [added: Communications] and Legislative Affairs |
| Kevin S. Morris | | [removed: | 59 |] [added: 60] | | Executive Vice President, General Counsel [added: and Corporate Secretary] |
| Lisa V. Price | | [removed: | 47 |] [added: 48] | | Executive Vice President, Chief Human Resources Officer |
| [removed: J. Kevin Vasconi | |] [added: Arthur P. D’Elia] | [removed: 59] | [added: 43] | | Executive Vice President, Chief [removed: Information] [added: Marketing] Officer |
| C. Andrew Ballard | | [removed: | 47 |] [added: 48] | | Director |
| Andrew B. Balson | | [removed: | 53 |] [added: 54] | | Director |
| Corie S. Barry | | [removed: | 44 |] [added: 45] | | Director |
| Diana F. Cantor | | [removed: | 62 |] [added: 63] | | Director |
| Richard L. Federico | | [removed: | 65 |] [added: 66] | | Director |
| James A. Goldman | | [removed: | 61 |] [added: 62] | | Director |
| Patricia E. Lopez | | [removed: | 58 |] [added: 59] | | Director |
[added: Mr. Brandon] most recently served as Chairman and Chief Executive Officer of Toys “R” Us, Inc., formerly the world’s largest specialty retailer of toy and baby products, a position he held from July 2015 to December 2018.
Mr. Brandon [removed: has] served as [removed: Chairman of] Domino’s [removed: Board of Directors since March 1999 and also served as] Chief Executive Officer from March 1999 to March 2010.
has served as Domino’s Executive Vice President and Chief Financial Officer since August [removed: 2015.][added: 2020.]
has served as [added: Chief Operating Officer and President,] Domino’s [added: U.S. since July 2020 and as] Chief Operating Officer and President of the Americas [removed: since] [added: from] July [removed: 2018.][added: 2018 to July 2020.]
Prior to [removed: his appointment,] [added: this,] Mr. Curtis served as Vice President of Franchise Relations and Operations Innovation from March 2017 to July 2018, after serving as Vice President of Operations Support from August 2016 to March 2017 and as West Region Vice President from November 2012 to August 2016.
has served as Domino’s Executive Vice President, [removed: Franchise Operations] [added: Communications] and [removed: Development] [added: Legislative Affairs] since [removed: January 2008.][added: May 2016.]
Prior to his [removed: appointment,] [added: current role,] Mr. Jordan had served as Senior Vice President and Chief Marketing Officer since May 2015, after joining Domino’s as Vice President of Innovation in September 2011.
has served as Domino’s Executive Vice President, Supply Chain Services since [removed: January 2019.][added: August 2020.]
Prior to joining Domino’s, Mr. Levy served as Executive Vice President, Chief Transformation Officer for Republic Services, Inc. [removed: since 2015.][added: from January 2015 to November 2017.]
Prior to joining Republic Services, Mr. Levy was employed by Bain & Company [removed: since 2001,] [added: from 2001 to 2014,] serving most recently as a Partner [removed: since 2008.][added: from 2008 to 2014.]
has served as Domino’s Executive Vice [removed: President and] [added: President,] Chief [removed: Information] [added: Technology] Officer since [removed: March 2012.][added: October 2020.]
[removed: Mr. Ballard] has served on Domino’s Board of Directors since July [removed: 2015] [added: 2018] and is a member of the [removed: Compensation] [added: Audit] Committee [added: and the Inclusion and Diversity Committee] of the Board of Directors.
[added: In addition to serving on Domino’s Board of Directors,] Mr. Ballard is currently Chairman of Datacor, Inc. and Vice Chairman of Zignal Labs, and has held previous board roles at Activant Solutions Inc., Catalina Marketing Corporation, DoubleClick Inc., Getty Images, Inc., Internet Brands, Inc. and Vertafore, Inc. Mr. Ballard was the Chair of the Board of Trustees and Chair of the Investment Committee of the San Francisco Foundation.
[added: Mr. Balson] is currently the Managing Partner of Cove Hill Partners, L.P., a firm formed to make private equity investments.
[removed: Mr. Balson] has served on Domino’s Board of Directors since March 1999 and serves as the Chairperson of the Compensation Committee of the Board of Directors.
[added: Ms. Barry] currently serves as Chief Executive Officer and as a member of the Board of Directors of Best Buy Co., Inc., a specialty retailer of consumer electronics, personal computers, entertainment software and appliances, roles held since June 2019.
[removed: Ms. Barry] has served on Domino’s Board of Directors since July 2018 and [removed: became] [added: is] a member of the [removed: Audit] [added: Nominating and Corporate Governance] Committee [added: and the Inclusion and Diversity Committee] of the Board of [removed: Directors in February 2019.][added: Directors.]
[added: Ms. Cantor] is currently a Partner at Alternative Investment Management, LLC, a position she has held since January 2010, and [removed: she] is [removed: the Vice] [added: a past] Chairman of the Virginia Retirement System, where she [removed: also serves on] [added: served as a Trustee and a member of] the Audit and Compliance [removed: Committee.][added: Committee from 2010 through 2020.]
Ms. Cantor served as [added: the] founding [added: Chief] Executive [removed: Director] [added: Officer] of the Virginia College Savings Plan, the state’s 529 college savings program, from 1996 to January 2008.
[removed: Ms. Cantor] has served on Domino’s Board of Directors since October 2005 and serves as the Chairperson of the Audit Committee of the Board of Directors.
[added: In addition to serving on Domino’s Board of Directors,] Ms. Cantor serves on the Boards of Directors of Universal Corporation [added: (Chairman of the Nominating] and [added: Corporate Governance Committee) and] VICI Properties [removed: Inc.,] [added: Inc. (Chairman of the Audit Committee),] and she previously served on the Boards of Directors of Media General, Inc., Revlon, Inc., The Edelman Financial Group Inc., Vistage International, Inc., Knowledge Universe Education LLC, Edelman Financial Services, LLC and Service King Body and Paint LLC.
| | | | | |
| --- | --- | --- | --- | --- |
| Kelly E. Garcia | | 45 | | Executive Vice President, Chief Technology Officer |
has served as the Chairman of the Domino’s Board of Directors since March 1999.
Mr. Levy joined Domino’s as Executive Vice President, Supply Chain Services in January 2019.
has served as Domino’s Executive Vice President, U.S. Operations and Support since March 2020 and as Executive Vice President, Corporate Operations from July 2018 to March 2020.
Arthur P.
D’Elia
has served as Domino’s Executive Vice President, Chief Marketing Officer since July 2020 and as Senior Vice President, Chief Marketing Officer from February 2020 to July 2020.
Mr. D’Elia joined Domino’s in January 2018 as Senior Vice President, Chief Brand and Innovation Officer.
Prior to Domino’s, Mr. D’Elia served as Chief Marketing Officer for Danone Dairy’s UBN business unit from July 2017 to January 2018, after joining Danone U.S. in 2010.
Kelly E.
Garcia
Prior to his current role, Mr. Garcia served as Senior Vice President, Chief Technology Officer from April 2020 to October 2020.
Mr. Garcia joined Domino’s in July 2012 as Vice President, eCommerce Development.
Prior to Domino’s, Mr. Garcia was with R.L. Polk & Co. from 2004 to 2012, most recently as Vice President of Business Intelligence and North American Operations.
Cynthia A.
Headen
Ms. Headen previously served as Senior Vice President, Global Procurement and Supply Chain Operations from January 2019 to August 2020, after joining Domino’s as Vice President of Procurement and Product Management in November 2015.
Prior to Domino’s, Ms. Headen spent nearly 15 years with PepsiCo, where she was responsible for global procurement.
He also serves on the Communications Committee of the Innovation Center for U.S. Dairy.
has served on Domino’s Board of Directors since July 2015.
Mr. Ballard serves as the Chairperson of the Inclusion and Diversity Committee and is a member of the Compensation Committee of the Board of Directors.
Mr. Ballard
Mr. Federico served as
Mr. Federico previously served as Chairman of the Board of Directors of Jamba, Inc. He is a Founding Director of Chances for Children.
Prior to his work at Nabisco, Mr. Goldman was a senior consulting associate at McKinsey & Company, Inc. In addition to serving on Domino’s Board of Directors, Mr. Goldman serves on the Board of Directors of Abercrombie & Fitch Co. where he is a member of the Compensation Committee and Nominating and Corporate Governance Committee.
Ms. Lopez
| | | | | | | |
| --- | --- | --- | --- | --- | --- | --- |
| Scott R. Hinshaw | | | 57 | | | Executive Vice President, Franchise Operations and Development |
Jeffrey D.
Lawrence
He previously served as Vice President – Finance and Treasurer from January 2014 to August 2015, and as Vice President of International Finance, Strategy & Insights and Administration from 2008 to January 2014.
Prior to joining the International team, Mr. Lawrence served as Vice President and Corporate Controller from 2002 to 2008.
Mr. Lawrence began his career at Domino’s in 2000.
Prior to joining Domino’s, Mr. Lawrence was a Manager of Audit and Business Advisory Services in the Detroit office of Arthur Andersen LLP.
has served as Domino’s Executive Vice President, Corporate Operations (which represents our Company-owned store division) since July 2018.
Effective March 1, 2020, Mr. Curtis will serve as Domino’s Executive Vice President, U.S. Operations and Support.
Scott R.
Hinshaw
Mr. Hinshaw served as Executive Vice President, Team USA from September 2007 to January 2008.
Mr. Hinshaw also served as a Vice President within Team USA from 1994 through September 2007.
Mr. Hinshaw joined Domino’s in 1986.
In January 2020, Mr. Hinshaw announced that he will retire from his position as Executive Vice President, Franchise Operations and Development effective February 28, 2020.
has served as Domino’s Executive Vice President, Communication, Investor Relations and Legislative Affairs since May 2016.
In 2019, Mr. McIntyre was named to the Executive Board of the DETermined to Assist Foundation.
J.
Kevin Vasconi
Mr. Vasconi served as Chief Information Officer and Vice President of Engineering at Stanley Black & Decker – Stanley Security Solutions from 2011 to March 2012.
Prior to his role at Stanley Security Solutions, Mr. Vasconi served in a variety of roles at R.L. Polk & Co. from 2003 to 2011, most recently as Senior Vice President and Chief Information Officer of Polk Global Automotive.
served as
Mr. Goldman served in various executive positions at Nabisco, Inc. from 1992 to 2000.
Mr. Goldman served on the Board of Directors of The Children’s Place, Inc. and served on its Compensation Committee.
Ms. Lopez has served on Domino’s Board of Directors since July 2018 and became a member of the Nominating and Corporate Governance Committee in February 2019.
An excerpt. Shown here: 40 of 51 rewritten, all 28 added and all 27 removed. The counts are complete. For every sentence, read Item 10. Directors, Executive Officers and Corporate Governance. in the FY2020 filing and the FY2019 filing.
Item 11. Executive Compensation.
1 rewritten, 0 added, 0 removed, 3 unchanged
Information regarding executive compensation is incorporated by reference from Domino’s Pizza, Inc.’s definitive proxy statement, which will be filed within 120 days of [removed: December 29, 2019.][added: January 3, 2021.]
Item 12. Security Ownership of Certain Beneficial Owners and Management and Related Stockholder Matters.
1 rewritten, 0 added, 0 removed, 1 unchanged
Information regarding security ownership of certain beneficial owners and management and related stockholder matters is incorporated by reference from Domino’s Pizza, Inc.’s definitive proxy statement, which will be filed within 120 days of [removed: December 29, 2019.][added: January 3, 2021.]
Item 13. Certain Relationships and Related Transactions, and Director Independence.
1 rewritten, 0 added, 0 removed, 1 unchanged
Information regarding certain relationships and related transactions is incorporated by reference from Domino’s Pizza, Inc.’s definitive proxy statement, which will be filed within 120 days of [removed: December 29, 2019.][added: January 3, 2021.]
Item 14. Principal Accountant Fees and Services.
1 rewritten, 0 added, 0 removed, 2 unchanged
Information regarding principal accountant fees and services is incorporated by reference from Domino’s Pizza, Inc.’s definitive proxy statement, which will be filed within 120 days of [removed: December 29, 2019.][added: January 3, 2021.]
Item 15. Exhibits, Financial Statement Schedules.
91 rewritten, 252 added, 4 removed, 12 unchanged
Consolidated Balance Sheets as of [added: January 3, 2021 and] December 29, 2019 [removed: and December 30, 2018]
Consolidated Statements of Income for the Years Ended [added: January 3, 2021,] December 29, [removed: 2019,] [added: 2019 and] December 30, 2018 [removed: and December 31, 2017]
Consolidated Statements of Comprehensive Income for the Years Ended [added: January 3, 2021,] December 29, [removed: 2019,] [added: 2019 and] December 30, 2018 [removed: and December 31, 2017]
Consolidated Statements of Stockholders’ Deficit for the Years Ended [added: January 3, 2021,] December 29, [removed: 2019,] [added: 2019 and] December 30, 2018 [removed: and December 31, 2017]
Consolidated Statements of Cash Flows for the Years Ended [added: January 3, 2021,] December 29, [removed: 2019,] [added: 2019 and] December 30, 2018 [removed: and December 31, 2017]
| | 2. | Financial Statement Schedules: The following financial statement [removed: schedules are] [added: schedule is] attached to this report. |
| Exhibit Number | | [removed: | |] Description |
| [removed: |] 3.1 | | [removed: |] [Form of Second Restated Certificate of Incorporation of Domino’s Pizza, Inc. (Incorporated by reference to Exhibit 3.1 to the Domino’s Pizza, Inc. registration statement on Form S-1 filed on April 13, 2004 (Reg. No. 333-114442) (the “S-1”)).](http://www.sec.gov/Archives/edgar/data/1286681/000119312504091718/dex31.htm) |
| [removed: |] 3.2 | | [removed: |] [Certificate of Amendment to the Second Restated Certificate of Incorporation of Domino’s Pizza, Inc. (Incorporated by reference to Exhibit 3.2 to the Form 10-Q for the quarter ended June 14, 2015).](http://www.sec.gov/Archives/edgar/data/1286681/000156459015005457/dpz-ex32_20150614137.htm) |
| [removed: |] 3.3 | | [removed: |] [Second Amended and Restated By-Laws of Domino’s Pizza, Inc. (Incorporated by reference to Exhibit 3.3 to the registrant’s annual report on Form 10-K for the year ended January 3, 2016).](http://www.sec.gov/Archives/edgar/data/1286681/000119312516476935/d128680dex33.htm) |
| [removed: |] 4.1 | | [removed: |] [Description of Securities of the [removed: Registrant.](https://www.sec.gov/Archives/edgar/data/1286681/000119312520042675/d796357dex41.htm)] [added: Registrant. (Incorporated by reference to Exhibit 4.1 to the registrant’s annual report on Form 10-K for the year ended December 29, 2019 (the “2019 10-K”)).](http://www.sec.gov/Archives/edgar/data/1286681/000119312520042675/d796357dex41.htm)] |
| [removed: |] 10.1 | | [removed: |] [Lease Agreement dated as of December 21, 1998 by and between Domino’s Farms Office Park Limited Partnership and Domino’s, Inc. (Incorporated by reference to Exhibit 10.3 to the Domino’s, Inc. registration statement on Form S-4 filed on March 22, 1999 (Reg. No. 333-74797)).](http://www.sec.gov/Archives/edgar/data/1079458/0000927016-99-001033.txt) |
| [removed: |] 10.2 | | [removed: |] [Fourth Amendment to the Lease Agreement between Domino’s Farms Office Park, L.L.C. and Domino’s Pizza LLC, dated as of August 28, 2012 (Incorporated by reference to Exhibit 10.2 to the registrant’s annual report on Form 10-K for the year ended December 30, 2012 (the “2012 10-K”)).](http://www.sec.gov/Archives/edgar/data/1286681/000119312513081957/d466015dex102.htm) |
| [removed: |] 10.3 | | [removed: |] [Fifth Amendment to a Lease Agreement between Domino’s Farms Office Park, L.L.C. and Domino’s Pizza LLC, dated as of February 1, 2015 (Incorporated by reference to Exhibit 10.3 to the registrant’s annual report on Form 10-K for the year ended January 1, 2017 (the “2016 10-K”)).](http://www.sec.gov/Archives/edgar/data/1286681/000119312517060262/d350071dex103.htm) |
| [removed: |] 10.4 | | [removed: |] [Sixth Amendment to a Lease Agreement between Domino’s Farms Office Park, L.L.C. and Domino’s Pizza LLC, dated as of February 1, 2015 (Incorporated by reference to Exhibit 10.4 to the 2016 10-K).](http://www.sec.gov/Archives/edgar/data/1286681/000119312517060262/d350071dex104.htm) |
| [removed: |] 10.5 | | [removed: |] [Seventh Amendment to a Lease Agreement between Domino’s Farms Office Park, L.L.C. and Domino’s Pizza LLC, dated as of April 19, 2016 (Incorporated by reference to Exhibit 10.5 to the 2016 10-K).](http://www.sec.gov/Archives/edgar/data/1286681/000119312517060262/d350071dex105.htm) |
| [removed: |] 10.6 | | [removed: |] [Eighth Amendment to a Lease Agreement between Domino’s Farms Office Park, L.L.C. and Domino’s Pizza LLC, dated as of November 4, 2016 (Incorporated by reference to Exhibit 10.6 to the 2016 10-K).](http://www.sec.gov/Archives/edgar/data/1286681/000119312517060262/d350071dex106.htm) |
| [removed: |] 10.7 | | [removed: |] [Ninth Amendment to a Lease Agreement between Domino’s Farms Office Park, L.L.C. and Domino’s Pizza LLC, dated as of February 16, 2017 (Incorporated by reference to Exhibit 10.7 to the 2016 10-K).](http://www.sec.gov/Archives/edgar/data/1286681/000119312517060262/d350071dex107.htm) |
| [removed: |] 10.8 | | [removed: |] [Tenth Amendment to a Lease Agreement between Domino’s Farms Office Park, L.L.C. and Domino’s Pizza LLC, dated as of November 7, 2017 (Incorporated by reference to Exhibit 10.8 to the registrant’s annual report on Form 10-K for the year ended December 31, 2017).](http://www.sec.gov/Archives/edgar/data/1286681/000119312518049576/d531906dex108.htm) |
| [removed: |] 10.9 | | [removed: |] [Eleventh Amendment to a Lease Agreement between Domino’s Farms Office Park, L.L.C. and Domino’s Pizza LLC, dated as of July 13, 2018 (Incorporated by reference to Exhibit 10.1 to the registrant’s quarterly report on Form 10-Q for the quarter ended September 9, 2018 (the “September 2018 10-Q”)).](http://www.sec.gov/Archives/edgar/data/1286681/000119312518299738/d632190dex101.htm) |
| [removed: |] 10.10 | | [removed: |] [Twelfth Amendment to a Lease Agreement between Domino’s Farms Office Park, L.L.C. and Domino’s Pizza LLC, dated as of July 13, 2018 (Incorporated by reference to Exhibit 10.2 to the September 2018 10-Q).](http://www.sec.gov/Archives/edgar/data/1286681/000119312518299738/d632190dex102.htm) |
| [removed: |] 10.11 | | [removed: |] [Thirteenth Amendment to a Lease Agreement between Domino’s Farms Office Park, L.L.C. and Domino’s Pizza LLC, dated as of May 14, 2019 (Incorporated by reference to Exhibit 10.1 to the registrant’s quarterly report on Form 10-Q for the quarter ended June 16, 2019 (the “June 2019 10-Q”)).](http://www.sec.gov/Archives/edgar/data/1286681/000119312519194379/d774471dex101.htm) |
| [removed: |] 10.12 | | [removed: |] [Fourteenth Amendment to a Lease Agreement between Domino’s Farms Office Park, L.L.C. and Domino’s Pizza LLC, dated as of May 31, 2019 (Incorporated by reference to Exhibit 10.1 to the June 2019 10-Q).](http://www.sec.gov/Archives/edgar/data/1286681/000119312519194379/d774471dex102.htm) |
| [removed: |] 10.13* | | [removed: |] [Domino’s Pizza, Inc. Deferred Compensation Plan adopted effective January 1, 2005 (Incorporated by reference to Exhibit 10.9 to the registrant’s annual report on Form 10-K for the year ended January 1, 2006).](http://www.sec.gov/Archives/edgar/data/1079458/000119312506045179/dex109.htm) |
| [removed: |] 10.14* | | [removed: |] [First Amendment to the Domino’s Pizza Deferred Compensation Plan effective January 1, 2007 (Incorporated by reference to Exhibit 10.9 to the registrant’s annual report on Form 10-K for the year ended December 31, 2006).](http://www.sec.gov/Archives/edgar/data/1079458/000119312507037666/dex109.htm) |
| [removed: |] 10.15* | | [removed: |] [Second Amendment to the Domino’s Pizza Deferred Compensation Plan effective February 8, 2013 (Incorporated by reference to Exhibit 10.5 to the 2012 10-K).](http://www.sec.gov/Archives/edgar/data/1286681/000119312513081957/d466015dex105.htm) |
| [removed: |] 10.16* | | [removed: |] [Amended Domino’s Pizza, Inc. 2004 Equity Incentive Plan (Incorporated by reference to Exhibit 10.1 to the registrant’s quarterly report on Form 10-Q for the quarter ended March 22, 2009 (the “March 2009 10-Q”)).](http://www.sec.gov/Archives/edgar/data/1286681/000119312509093037/dex101.htm) |
| [removed: |] 10.17* | | [removed: |] [Form of Employee Stock Option Agreement under the Amended Domino’s Pizza, Inc. 2004 Equity Incentive Plan (Incorporated by reference to Exhibit 10.8 to the 2012 10-K).](http://www.sec.gov/Archives/edgar/data/1286681/000119312513081957/d466015dex108.htm) |
| [removed: |] 10.18* | | [removed: |] [Form of 2013 Special Employee Stock Option Agreement under the Amended Domino’s Pizza, Inc. 2004 Equity Incentive Plan (Incorporated by reference to Exhibit 10.9 to the 2012 10-K).](http://www.sec.gov/Archives/edgar/data/1286681/000119312513081957/d466015dex109.htm) |
| [removed: |] 10.19* | | [removed: |] [Form of Director Stock Option Agreement under the Amended Domino’s Pizza, Inc. 2004 Equity Incentive Plan (Incorporated by reference to Exhibit 10.3 to the March 2009 10-Q).](http://www.sec.gov/Archives/edgar/data/1286681/000119312509093037/dex103.htm) |
| [removed: |] 10.20* | | [removed: |] [Form of Amendment to Existing Director Stock Option Grants (Incorporated by reference to Exhibit 10.5 to the March 2009 10-Q).](http://www.sec.gov/Archives/edgar/data/1286681/000119312509093037/dex105.htm) |
| [removed: |] 10.21* | | [removed: |] [Form of Performance-Based Restricted Stock Agreement (Incorporated by reference to Exhibit 10.12 to the 2012 10-K).](http://www.sec.gov/Archives/edgar/data/1286681/000119312513081957/d466015dex1012.htm) |
| [removed: |] 10.22* | | [removed: |] [Form of 2013 Special Performance-Based Restricted Stock Agreement (Incorporated by reference to Exhibit 10.13 to the 2012 10-K).](http://www.sec.gov/Archives/edgar/data/1286681/000119312513081957/d466015dex1013.htm) |
| [removed: |] 10.23* | | [removed: |] [Form of Performance-Based Restricted Stock Unit Award Agreement (Incorporated by reference to Exhibit 10.14 to the 2012 10-K).](http://www.sec.gov/Archives/edgar/data/1286681/000119312513081957/d466015dex1014.htm) |
| [removed: |] 10.24* | | [removed: |] [Form of 2013 Special Performance-Based Restricted Stock Unit Award Agreement (Incorporated by reference to Exhibit 10.15 to the 2012 10-K).](http://www.sec.gov/Archives/edgar/data/1286681/000119312513081957/d466015dex1015.htm) |
| [removed: |] 10.25* | | [removed: |] [Form of Domino’s Pizza, Inc. 2004 Equity Incentive Plan Restricted Stock Agreement for Directors (Incorporated by reference to Exhibit 10.19 to the registrant’s annual report on Form 10-K for the year ended January 3, 2010).](http://www.sec.gov/Archives/edgar/data/1286681/000119312510045334/dex1019.htm) |
| [removed: |] 10.26* | | [removed: |] [Amended and Restated Domino’s Pizza Senior Executive Annual Incentive [removed: Plan.] [added: Plan] (Incorporated by reference to Exhibit 10.20 to the registrant’s annual report on Form 10-K for the year ended January 2, 2011).](http://www.sec.gov/Archives/edgar/data/1286681/000119312511050979/dex1020.htm) |
| [removed: |] 10.27* | | [removed: |] [Amended and Restated Domino’s Pizza, Inc. Employee Stock Payroll Deduction Plan (Incorporated by reference to Exhibit 10.18 to the registrant’s annual report on Form 10-K for the year ended December 29, 2013).](http://www.sec.gov/Archives/edgar/data/1286681/000119312514066092/d661353dex1018.htm) |
| [removed: |] 10.28* | | [removed: |] [First Amendment to the Amended and Restated Domino’s Pizza, Inc. Employee Stock Payroll Deduction Plan Dated as of January 1, 2019 (Incorporated by reference to Exhibit 10.1 to the registrant’s quarterly report on Form 10-Q for the quarter ended March 24, 2019).](http://www.sec.gov/Archives/edgar/data/1286681/000119312519115719/d661429dex101.htm) |
| [removed: |] 10.29* | | [removed: |] [Form of Domino’s Pizza, Inc. Dividend Reinvestment & Direct Stock Purchase and Sale Plan (Incorporated by reference to Exhibit 10.32 to the S-1).](http://www.sec.gov/Archives/edgar/data/1286681/000119312504102056/dex1032.htm) |
| | | |
| --- | --- | --- |
| | | |
| | | |
| | | |
| | | |
| | | |
| | | |
| | | |
| | | |
| | | |
| | | |
| --- | --- | --- |
| | | |
| | | |
| | | |
| | | |
| | | |
| | | |
| | | |
| | | |
| | | |
| | | |
| | | |
| | | |
| | | |
| | | |
| | | |
| | | |
| | | |
| --- | --- | --- |
| | | |
| | | |
| | | |
| | | |
| | | |
| | | |
| | | |
| | | |
| | | |
Schedule II – Valuation and Qualifying Accounts
| | | | | |
| --- | --- | --- | --- | --- |
| | 10.65 | | | [Fixed Dollar Accelerated Share Repurchase Transaction Confirmation, dated August 2, 2017 (Incorporated by reference to Exhibit 10.1 to the Domino’s Pizza, Inc. Current Report on Form 8-K, filed on August 2, 2017).](http://www.sec.gov/Archives/edgar/data/1286681/000119312517244950/d413019dex101.htm) |
An excerpt. Shown here: 40 of 91 rewritten, 40 of 252 added and all 4 removed. The counts are complete. For every sentence, read Item 15. Exhibits, Financial Statement Schedules. in the FY2020 filing and the FY2019 filing.
Item 16. Form 10-K Summary.
18 rewritten, 32 added, 114 removed, 9 unchanged
| /s/ Richard E. Allison, Jr. | | | [added: | |]
| Richard E. Allison, Jr. [removed: February 20, 2020] | | [added: | |] Chief Executive Officer and Director [removed: (Principal Executive Officer)] |
| /s/ David A. Brandon | | | [added: | |]
| David A. Brandon [removed: February 20, 2020] | | [added: | |] Chairman of the Board of Directors |
| /s/ C. Andrew Ballard | | | [added: | |]
| C. Andrew Ballard [removed: February 20, 2020] | | [added: | |] Director |
| /s/ Andrew B. Balson | | | [added: | |]
| Andrew B. Balson [removed: February 20, 2020] | | [added: | |] Director |
| /s/ Corie S. Barry | | | [added: | |]
| Corie S. Barry [removed: February 20, 2020] | | [added: | |] Director |
| /s/ Diana F. Cantor | | | [added: | |]
| Diana F. Cantor [removed: February 20, 2020] | | [added: | |] Director |
| /s/ Richard L. Federico | | | [added: | |]
| Richard L. Federico [removed: February 20, 2020] | | [added: | |] Director |
| /s/ James A. Goldman | | | [added: | |]
| James A. Goldman [removed: February 20, 2020] | | [added: | |] Director |
| /s/ Patricia E. Lopez | | | [added: | |]
| Patricia E. Lopez [removed: February 20, 2020] | | [added: | |] Director |
| /s/ Stuart A. Levy |
| Stuart A. Levy |
| Executive Vice President, Chief Financial Officer |
| (Principal Financial Officer) |
| February 25, 2021 |
| | | | | |
| --- | --- | --- | --- | --- |
| February 25, 2021 | | | | (Principal Executive Officer) |
| | | | | |
| /s/ Stuart A. Levy | | | | |
| Stuart A. Levy | | | | Executive Vice President, Chief Financial Officer |
| February 25, 2021 | | | | (Principal Financial Officer) |
| | | | | |
| /s/ Jessica L. Parrish | | | | |
| Jessica L. Parrish | | | | Vice President, Corporate Controller |
| February 25, 2021 | | | | |
| | | | | |
| February 25, 2021 | | | | |
| | | | | |
| February 25, 2021 | | | | |
| | | | | |
| February 25, 2021 | | | | |
| | | | | |
| February 25, 2021 | | | | |
| | | | | |
| February 25, 2021 | | | | |
| | | | | |
| February 25, 2021 | | | | |
| | | | | |
| February 25, 2021 | | | | |
| | | | | |
| February 25, 2021 | | | | |
| --- | --- |
SCHEDULE I – CONDENSED FINANCIAL INFORMATION OF THE REGISTRANT
Domino’s Pizza, Inc.
PARENT COMPANY CONDENSED BALANCE SHEETS
(In thousands, except share and per share amounts)
| | | | | | | | | |
| --- | --- | --- | --- | --- | --- | --- | --- | --- |
| | | December 29, 2019 | | | | December 30, 2018 | | |
| ASSETS | | | | | | | | |
| ASSETS: | | | | | | | | |
| Cash | | $ | 6 | | | $ | 6 | |
| Total assets | | $ | 6 | | | $ | 6 | |
| LIABILITIES AND STOCKHOLDERS’ DEFICIT | | | | | | | | |
| LIABILITIES: | | | | | | | | |
| Equity in net deficit of subsidiaries | | $ | 3,415,759 | | | $ | 3,039,921 | |
| Due to subsidiary | | | 6 | | | | 6 | |
| Total liabilities | | | 3,415,765 | | | | 3,039,927 | |
| STOCKHOLDERS’ DEFICIT: | | | | | | | | |
| Common stock, par value $0.01 per share; 170,000,000 shares authorized; 38,934,009 in 2019 and 40,977,561 in 2018 issued and outstanding | | | 389 | | | | 410 | |
| Preferred stock, par value $0.01 per share; 5,000,000 shares authorized, none issued | | | — | | | | — | |
| Additional paid-in capital | | | 243 | | | | 569 | |
| Retained deficit | | | (3,412,649 | ) | | | (3,036,471 | ) |
| Accumulated other comprehensive loss | | | (3,742 | ) | | | (4,429 | ) |
| Total stockholders’ deficit | | | (3,415,759 | ) | | | (3,039,921 | ) |
| Total liabilities and stockholders’ deficit | | $ | 6 | | | $ | 6 | |
See accompanying notes to the Schedule I.
PARENT COMPANY CONDENSED STATEMENTS OF INCOME AND COMPREHENSIVE INCOME
| | | | | | | | | | | | | |
| --- | --- | --- | --- | --- | --- | --- | --- | --- | --- | --- | --- | --- |
| | | For the Years Ended | | | | | | | | | | |
| | | December 29, 2019 | | | | December 30, 2018 | | | | December 31, 2017 | | |
| REVENUES | | $ | — | | | $ | — | | | $ | — | |
| Total revenues | | | — | | | | — | | | | — | |
| OPERATING EXPENSES | | | — | | | | — | | | | — | |
| Total operating expenses | | | — | | | | — | | | | — | |
| INCOME FROM OPERATIONS | | | — | | | | — | | | | — | |
| Equity earnings in subsidiaries | | | 400,709 | | | | 361,972 | | | | 277,905 | |
| INCOME BEFORE PROVISION FOR INCOME TAXES | | | 400,709 | | | | 361,972 | | | | 277,905 | |
| PROVISION FOR INCOME TAXES | | | — | | | | — | | | | — | |
| NET INCOME | | $ | 400,709 | | | $ | 361,972 | | | $ | 277,905 | |
An excerpt. Shown here: all 18 rewritten, all 32 added and 40 of 114 removed. The counts are complete. For every sentence, read Item 16. Form 10-K Summary. in the FY2020 filing and the FY2019 filing.