 filings.tools
Item 5. MARKET FOR REGISTRANT’S COMMON EQUITY, RELATED SHAREHOLDER MATTERS AND ISSUER PURCHASES OF EQUITY SECURITIES
7K characters. Original on sec.gov · Markdown
Item 5. MARKET FOR REGISTRANT’S COMMON EQUITY, RELATED SHAREHOLDER MATTERS AND ISSUER PURCHASES OF EQUITY SECURITIES
Market Information.
The common shares of Group trade on the New York Stock Exchange under the symbol, “EG”. The quarterly high and low closing market prices of Group’s common shares for the periods indicated were:
| 2023 | 2022 | ||||||||||||||||||||||
| High | Low | High | Low | ||||||||||||||||||||
| First Quarter | $ | 390.84 | $ | 333.38 | $ | 304.72 | $ | 267.35 | |||||||||||||||
| Second Quarter | 387.10 | 332.87 | 307.10 | 265.00 | |||||||||||||||||||
| Third Quarter | 392.47 | 339.63 | 285.67 | 245.79 | |||||||||||||||||||
| Fourth Quarter | 414.59 | 350.69 | 337.94 | 260.84 |
Number of Holders of Common Shares.
The number of record holders of common shares as of February 1, 2024 was 863. That number does not include the beneficial owners of shares held in “street” name or held through participants in depositories, such as The Depository Trust Company.
Dividend History and Restrictions.
The Company’s Board has an established policy of declaring regular quarterly cash dividends and has paid a regular quarterly dividend in each quarter since the fourth quarter of 1995. The Company declared and paid its quarterly cash dividend of $1.55 per share for the first quarter of 2022, declared and paid its quarterly cash dividend of $1.65 per share for the second quarter of 2022 through the second quarter of 2023, and declared and paid its quarterly cash dividend of $1.75 per share for the remaining two quarters of 2023.
The declaration and payment of future dividends, if any, by the Company will be at the discretion of the Board and will depend upon many factors, including the Company’s earnings, financial condition, business needs and growth objectives, capital and surplus requirements of its operating subsidiaries, regulatory restrictions, rating agency considerations and other factors. As an insurance holding company, the Company is partially dependent on dividends and other permitted payments from its subsidiaries to pay cash dividends to its shareholders. The payment of dividends to Group by Holdings and to Holdings by Everest Re is subject to Delaware regulatory restrictions and the payment of dividends to Group by Bermuda Re is subject to Bermuda insurance regulatory restrictions. See “Regulatory Matters - Dividends” and ITEM 8, “Financial Statements and Supplementary Data”- Note 17 of Notes to Consolidated Financial Statements.
Table of Contents
Purchases of Equity Securities by the Issuer and Affiliated Purchasers
| Issuer Purchases of Equity Securities | ||||||||||||||
| (a) | (b) | (c) | (d) | |||||||||||
| Period | Total Number of Shares (or Units) Purchased | Average Price Paid per Share (or Unit) | Total Number of Shares (or Units) Purchased as Part of Publicly Announced Plans or Programs | Maximum Number (or Approximate Dollar Value) of Shares (or Units) that May Yet Be Purchased Under the Plans or Programs (1) | ||||||||||
| January 1 - 31, 2023 | 0 | $ | — | 0 | 1,228,908 | |||||||||
| February 1 - 28, 2023 | 44,937 | $ | 382.9829 | 0 | 1,228,908 | |||||||||
| March 1 - 31, 2023 | 6,273 | $ | 340.8460 | 0 | 1,228,908 | |||||||||
| April 1 - 30, 2023 | 78 | $ | 374.9276 | 0 | 1,228,908 | |||||||||
| May 1 - 31, 2023 | 619 | $ | 372.0318 | 0 | 1,228,908 | |||||||||
| June 1 - 30, 2023 | 205 | $ | 341.5675 | 0 | 1,228,908 | |||||||||
| July 1 - 31, 2023 | 69 | $ | 349.7200 | 0 | 1,228,908 | |||||||||
| August 1 - 31, 2023 | 0 | $ | — | 0 | 1,228,908 | |||||||||
| September 1 - 30, 2023 | 6,934 | $ | 377.3661 | 0 | 1,228,908 | |||||||||
| October 1 - 31, 2023 | 0 | $ | — | 0 | 1,228,908 | |||||||||
| November 1 - 30, 2023 | 3,750 | $ | 397.1126 | 0 | 1,228,908 | |||||||||
| December 1 - 31, 2023 | 84 | $ | 352.7550 | 0 | 1,228,908 | |||||||||
| Total | 62,949 | $ | — | 0 | 1,228,908 |
(1) On May 22, 2020, the Company’s executive committee of the Board approved an amendment to the share repurchase program authorizing the Company and/or its subsidiary Holdings, to purchase up to a current aggregate of 32.0 million of the Company’s shares (recognizing that the number of shares authorized for repurchase has been reduced by those shares that have already been purchased) in open market transactions, privately negotiated transactions or both. As of December 31, 2023, the Company and/or its subsidiary Holdings have repurchased 30.8 million of the Company’s shares.
Recent Sales of Unregistered Securities.
None.
Table of Contents
Performance Graph.
The following Performance Graph compares cumulative total shareholder returns on the Common Shares (assuming reinvestment of dividends) from December 31, 2018 through December 31, 2023, with the cumulative total return of the Standard & Poor’s 500 Index and the Standard & Poor’s Insurance (Property and Casualty) Index.
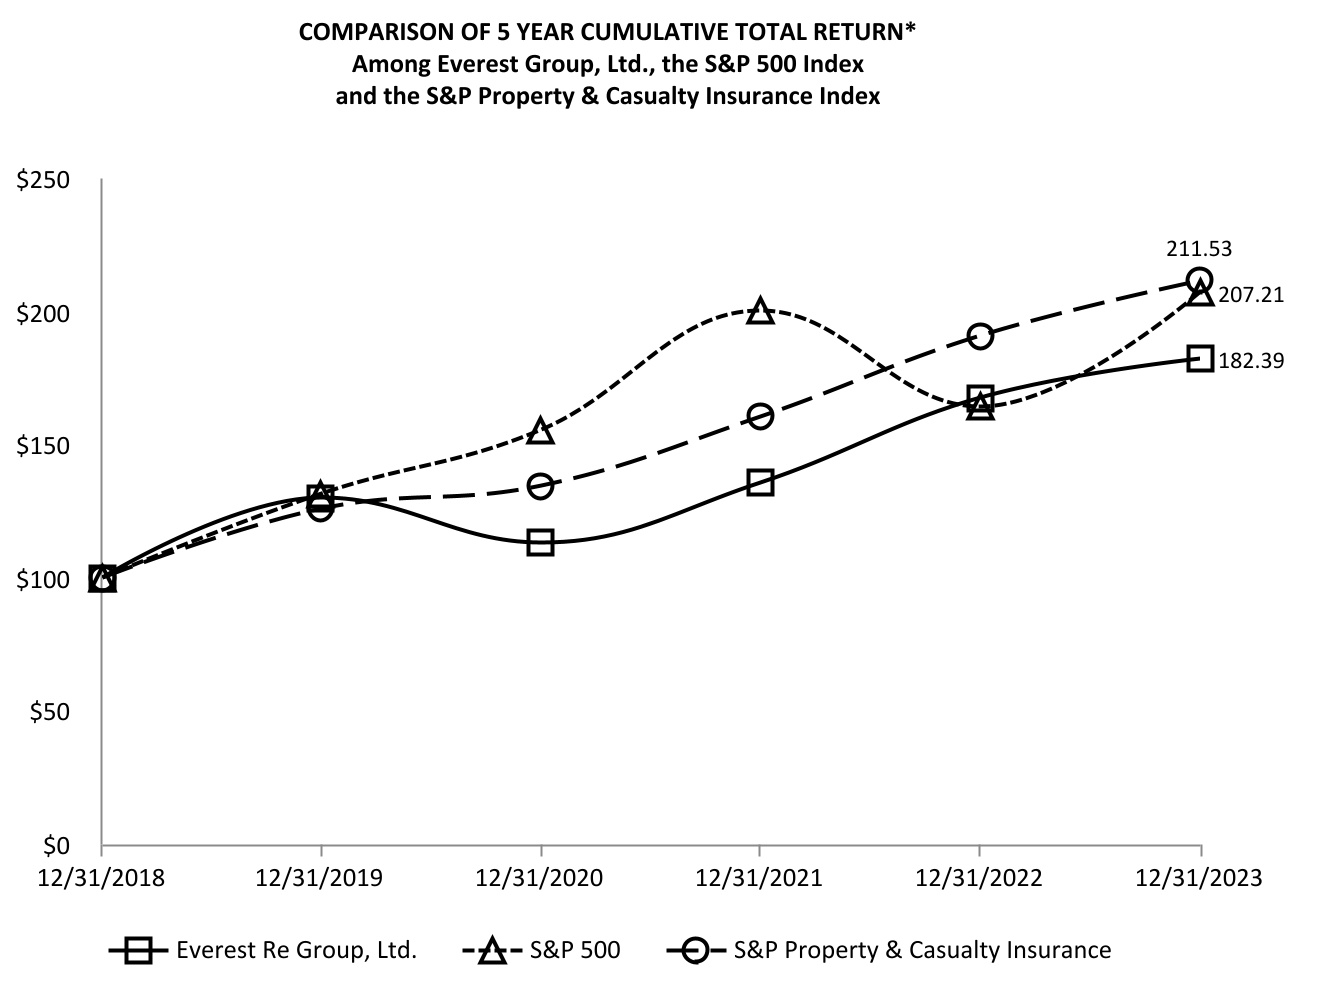
| 12/18 | 12/19 | 12/20 | 12/21 | 12/22 | 12/23 | ||||||||||||||||||||||||||||||
| Everest Group, Ltd. | 100.00 | 130.16 | 113.17 | 135.62 | 167.77 | 182.39 | |||||||||||||||||||||||||||||
| S&P 500 | 100.00 | 131.49 | 155.68 | 200.37 | 164.08 | 207.21 | |||||||||||||||||||||||||||||
| S&P Property & Casualty Insurance | 100.00 | 125.87 | 134.63 | 160.58 | 190.89 | 211.53 |
*$100 invested on 12/31/18 in stock or index, including reinvestment of dividends.
Fiscal year ending December 31.
Copyright© 2024 Standard & Poor's, a division of S&P Global. All rights reserved.
Previous: Item 4. MINE SAFETY DISCLOSURES · Next: Item 6. [RESERVED]