 filings.tools
Item 5. MARKET FOR REGISTRANT’S COMMON EQUITY, RELATED STOCKHOLDER MATTERS AND ISSUER PURCHASES OF EQUITY SECURITIES.
5K characters. Original on sec.gov · Markdown
Item 5. MARKET FOR REGISTRANT’S COMMON EQUITY, RELATED STOCKHOLDER MATTERS AND ISSUER PURCHASES OF EQUITY SECURITIES.
Market Information
Our common stock, par value $0.01 per share, is listed on the NYSE under the symbol “ANTM.”
Holders
As of February 7, 2019, there were 60,778 shareholders of record of our common stock.
Securities Authorized for Issuance under Equity Compensation Plans
The information required by this Item concerning securities authorized for issuance under our equity compensation plans is set forth in or incorporated by reference into Part III, Item 12 “Security Ownership of Certain Beneficial Owners and Management and Related Stockholder Matters” in this Annual Report on Form 10-K.
Issuer Purchases of Equity Securities
The following table presents information related to our repurchases of common stock for the periods indicated:
| Period | Total Number of Shares Purchased1 | Average Price Paid per Share | Total Number of Shares Purchased as Part of Publicly Announced Programs2 | Approximate Dollar Value of Shares that May Yet Be Purchased Under the Programs | |||||||||||
| (In millions, except share and per share data) | |||||||||||||||
| October 1, 2018 to October 31, 2018 | 618,636 | $ | 273.13 | 612,200 | $ | 5,819 | |||||||||
| November 1, 2018 to November 30, 2018 | 443,657 | 277.54 | 438,100 | 5,697 | |||||||||||
| December 1, 2018 to December 31, 2018 | 772,820 | 264.85 | 770,300 | 5,493 | |||||||||||
| 1,835,113 | 1,820,600 | ||||||||||||||
| 1 | Total number of shares purchased includes 14,513 shares delivered to or withheld by us in connection with employee payroll tax withholding upon exercise or vesting of stock awards. Stock grants to employees and directors and stock issued for stock option plans and stock purchase plans in the consolidated statements of shareholders’ equity are shown net of these shares purchased. |
| 2 | Represents the number of shares repurchased through the common stock repurchase program authorized by our Board of Directors, which the Board evaluates periodically. During the year ended December 31, 2018, we repurchased 6,783,692 shares at a cost of $1,685 under the program, including the cost of options to purchase shares. The Board of Directors has authorized our common stock repurchase program since 2003. The Board’s most recent authorized increase to the program was $5,000 on December 7, 2017. Between January 1, 2019 and February 7, 2019, we repurchased 631,943 shares at a cost of $165, bringing our current availability to $5,328 at February 7, 2019. No duration has been placed on our common stock repurchase program and we reserve the right to discontinue the program at any time. |
-39-
Performance Graph
The following Performance Graph and related information compares the cumulative total return to shareholders of our common stock for the period from December 31, 2013 through December 31, 2018, with the cumulative total return over such period of (i) the Standard & Poor’s 500 Stock Index (the “S&P 500 Index”) and (ii) the Standard & Poor’s Managed Health Care Index (the “S&P Managed Health Care Index”). The graph assumes an investment of $100 on December 31, 2013 in each of our common stock, the S&P 500 Index and the S&P Managed Health Care Index (and the reinvestment of all dividends).
The comparisons shown in the graph below are based on historical data and we caution that the stock price performance shown in the graph below is not indicative of, and is not intended to forecast, the potential future performance of our common stock. Information used in the graph was obtained from S&P Global Market Intelligence, a source believed to be reliable, but we are not responsible for any errors or omissions in such information. The following graph and related information shall not be deemed “soliciting materials” or to be “filed” with the SEC, nor shall such information be incorporated by reference into any future filing under the Exchange Act, except to the extent that we specifically incorporate it by reference into such filing.
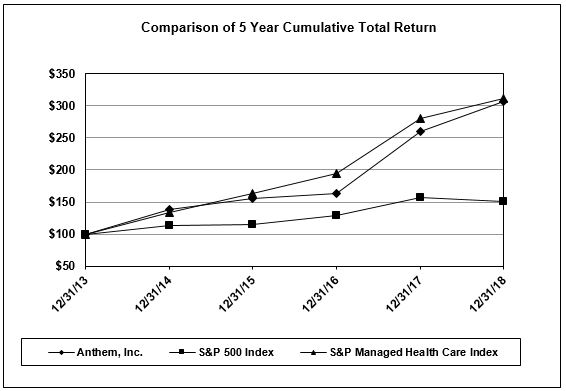
| December 31, | ||||||||||||||||||||||||
| 2013 | 2014 | 2015 | 2016 | 2017 | 2018 | |||||||||||||||||||
| Anthem, Inc. | $ | 100 | $ | 138 | $ | 156 | $ | 164 | $ | 260 | $ | 307 | ||||||||||||
| S&P 500 Index | 100 | 114 | 115 | 129 | 157 | 150 | ||||||||||||||||||
| S&P Managed Health Care Index | 100 | 134 | 163 | 195 | 280 | 311 | ||||||||||||||||||
Based upon an initial investment of $100 on December 31, 2013 with dividends reinvested.
-40-
Previous: Item 4. MINE SAFETY DISCLOSURES. · Next: Item 6. SELECTED FINANCIAL DATA.