 filings.tools
Item 5. Market for Registrant's Common Equity, Related Stockholder Matters and Issuer Purchases of Equity Securities
5K characters. Original on sec.gov · Markdown
Item 5. Market for Registrant's Common Equity, Related Stockholder Matters and Issuer Purchases of Equity Securities
EOG's common stock is traded on the New York Stock Exchange under the ticker symbol "EOG."
As of February 12, 2021, there were approximately 2,060 record holders and approximately 321,000 beneficial owners of EOG's common stock.
The following table sets forth, for the periods indicated, EOG's share repurchase activity:
| Period | (a) Total Number of Shares Purchased (1) | (b) Average Price Paid per Share | (c) Total Number of Shares Purchased as Part of Publicly Announced Plans or Programs | (d) Maximum Number of Shares that May Yet Be Purchased Under the Plans or Programs (2) | ||||||||||||||||||||||
| October 1, 2020 - October 31, 2020 | 3,892 | $ | 34.56 | — | 6,386,200 | |||||||||||||||||||||
| November 1, 2020 - November 30, 2020 | 3,678 | 41.84 | — | 6,386,200 | ||||||||||||||||||||||
| December 1, 2020 - December 31, 2020 | 19,548 | 52.21 | — | 6,386,200 | ||||||||||||||||||||||
| Total | 27,118 | $ | 48.27 |
(1)The 27,118 total shares for the quarter ended December 31, 2020, and the 389,613 total shares for the full year 2020, consist solely of shares that were withheld by or returned to EOG (i) in satisfaction of tax withholding obligations that arose upon the exercise of employee stock options or stock-settled stock appreciation rights or the vesting of restricted stock, restricted stock unit or performance unit grants or (ii) in payment of the exercise price of employee stock options. These shares do not count against the 10 million aggregate share repurchase authorization of EOG's Board discussed below.
(2)In September 2001, the Board authorized the repurchase of up to 10,000,000 shares of EOG's common stock. During 2020, EOG did not repurchase any shares under the Board-authorized repurchase program. EOG last repurchased shares under this program in March 2003.
Comparative Stock Performance
The following performance graph and related information shall not be deemed "soliciting material" or to be "filed" with the United States Securities and Exchange Commission, nor shall such information be incorporated by reference into any future filing under the Securities Act of 1933, as amended, or Securities Exchange Act of 1934, as amended, except to the extent that EOG specifically requests that such information be treated as "soliciting material" or specifically incorporates such information by reference into such a filing.
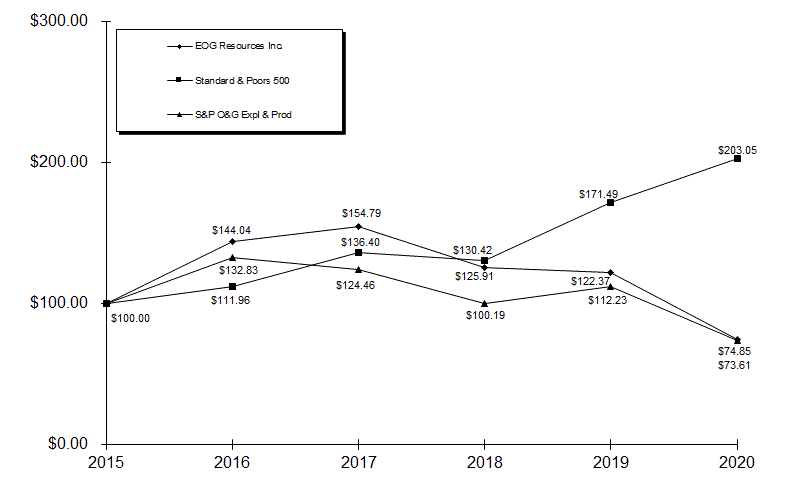
The performance graph shown below compares the cumulative five-year total return to stockholders on EOG's common stock as compared to the cumulative five-year total returns on the Standard and Poor's 500 Index (S&P 500) and the Standard and Poor's 500 Oil & Gas Exploration & Production Index (S&P O&G E&P). The comparison was prepared based upon the following assumptions:
1.$100 was invested on December 31, 2015 in each of the following: common stock of EOG, the S&P 500 and the S&P O&G E&P.
- Dividends are reinvested.
Comparison of Five-Year Cumulative Total Returns
EOG, S&P 500 and S&P O&G E&P
(Performance Results Through December 31, 2020)
| 2015 | 2016 | 2017 | 2018 | 2019 | 2020 | ||||||||||||||||||||||||||||||
| EOG | $ | 100.00 | $ | 144.04 | $ | 154.79 | $ | 125.91 | $ | 122.37 | $ | 74.85 | |||||||||||||||||||||||
| S&P 500 | $ | 100.00 | $ | 111.96 | $ | 136.40 | $ | 130.42 | $ | 171.49 | $ | 203.05 | |||||||||||||||||||||||
| S&P O&G E&P | $ | 100.00 | $ | 132.83 | $ | 124.46 | $ | 100.19 | $ | 112.23 | $ | 73.61 |
Previous: Item 4. Mine Safety Disclosures · Next: Item 6. Selected Financial Data