 filings.tools
EOG Resources 10-K 2021-12-31
Filed 2022-02-24. 23 sections, 522K characters. Original on sec.gov · Markdown · JSON
Cover and table of contents
UNITED STATES
SECURITIES AND EXCHANGE COMMISSION
Washington, D.C. 20549
FORM 10-K
(Mark One)
☒ ANNUAL REPORT PURSUANT TO SECTION 13 OR 15(d) OF THE SECURITIES EXCHANGE ACT OF 1934
For the fiscal year ended December 31, 2021
or
☐ TRANSITION REPORT PURSUANT TO SECTION 13 OR 15(d) OF THE SECURITIES EXCHANGE ACT OF 1934
Commission file number: 1-9743
EOG RESOURCES, INC.
(Exact name of registrant as specified in its charter)
| Delaware | 47-0684736 | |||||||
| (State or other jurisdiction of incorporation or organization) | (I.R.S. Employer Identification No.) |
1111 Bagby, Sky Lobby 2, Houston, Texas 77002
(Address of principal executive offices) (Zip Code)
Registrant's telephone number, including area code: 713-651-7000
Securities registered pursuant to Section 12(b) of the Act:
| Title of each class | Trading Symbol(s) | Name of each exchange on which registered | ||||||
| Common Stock, par value $0.01 per share | EOG | New York Stock Exchange |
Securities registered pursuant to Section 12(g) of the Act:
None.
Indicate by check mark if the registrant is a well-known seasoned issuer, as defined in Rule 405 of the Securities Act. Yes ☒ No ☐
Indicate by check mark if the registrant is not required to file reports pursuant to Section 13 or Section 15(d) of the Exchange Act. Yes ☐ No ☒
Indicate by check mark whether the registrant (1) has filed all reports required to be filed by Section 13 or 15(d) of the Securities Exchange Act of 1934 during the preceding 12 months (or for such shorter period that the registrant was required to file such reports), and (2) has been subject to such filing requirements for the past 90 days. Yes ☒ No ☐
Indicate by check mark whether the registrant has submitted electronically every Interactive Data File required to be submitted pursuant to Rule 405 of Regulation S-T (§ 232.405 of this chapter) during the preceding 12 months (or for such shorter period that the registrant was required to submit such files). Yes ☒ No ☐
Indicate by check mark whether the registrant is a large accelerated filer, an accelerated filer, a non-accelerated filer, a smaller reporting company, or an emerging growth company. See the definitions of "large accelerated filer," "accelerated filer," "smaller reporting company," and "emerging growth company" in Rule 12b-2 of the Exchange Act.
Large accelerated filer ☒ Accelerated filer ☐ Non-accelerated filer ☐
Smaller reporting company ☐ Emerging growth company ☐
If an emerging growth company, indicate by check mark if the registrant has elected not to use the extended transition period for complying with any new or revised financial accounting standards provided pursuant to Section 13(a) of the Exchange Act. ☐
Indicate by check mark whether the registrant has filed a report on and attestation to its management's assessment of the effectiveness of its internal control over financial reporting under Section 404(b) of the Sarbanes-Oxley Act (15 U.S.C. 7262(b)) by the registered public accounting firm that prepared or issued its audit report. ☒
Indicate by check mark whether the registrant is a shell company (as defined in Rule 12b-2 of the Exchange Act). Yes ☐ No ☒
State the aggregate market value of the voting and non-voting common equity held by non-affiliates computed by reference to the price at which the common equity was last sold, or the average bid and asked price of such common equity, as of the last business day of the registrant's most recently completed second fiscal quarter. Common Stock aggregate market value held by non-affiliates as of June 30, 2021: $48,608 million.
Indicate the number of shares outstanding of each of the registrant's classes of common stock, as of the latest practicable date. Class: Common Stock, par value $0.01 per share, 585,419,164 shares outstanding as of February 11, 2022.
Documents incorporated by reference. Portions of the Definitive Proxy Statement for the registrant's 2022 Annual Meeting of Stockholders, to be filed within 120 days after December 31, 2021, are incorporated by reference into Part III of this report.
TABLE OF CONTENTS
| Page | ||||||||
| PART I | ||||||||
| ITEM 1. | Business | 1 | ||||||
| General | 1 | |||||||
| Exploration and Production | 1 | |||||||
| Marketing | 3 | |||||||
| Wellhead Volumes and Prices | 4 | |||||||
| Human Capital Management | 6 | |||||||
| Competition | 7 | |||||||
| Regulation | 7 | |||||||
| Other Matters | 11 | |||||||
| Information About Our Executive Officers | 13 | |||||||
| ITEM 1A. | Risk Factors | 14 | ||||||
| ITEM 1B. | Unresolved Staff Comments | 27 | ||||||
| ITEM 2. | Properties | 27 | ||||||
| Oil and Gas Exploration and Production - Properties and Reserves | 27 | |||||||
| ITEM 3. | Legal Proceedings | 30 | ||||||
| ITEM 4. | Mine Safety Disclosures | 31 | ||||||
| PART II | ||||||||
| ITEM 5. | Market for Registrant's Common Equity, Related Stockholder Matters and Issuer Purchases of Equity Securities | 32 | ||||||
| ITEM 6. | Reserved | 34 | ||||||
| ITEM 7. | Management's Discussion and Analysis of Financial Condition and Results of Operations | 34 | ||||||
| ITEM 7A. | Quantitative and Qualitative Disclosures About Market Risk | 54 | ||||||
| ITEM 8. | Financial Statements and Supplementary Data | 54 | ||||||
| ITEM 9. | Changes in and Disagreements with Accountants on Accounting and Financial Disclosure | 54 | ||||||
| ITEM 9A. | Controls and Procedures | 54 | ||||||
| ITEM 9B. | Other Information | 55 | ||||||
| ITEM 9C. | Disclosure Regarding Foreign Jurisdictions that Prevent Inspections | 55 | ||||||
| PART III | ||||||||
| ITEM 10. | Directors, Executive Officers and Corporate Governance | 55 | ||||||
| ITEM 11. | Executive Compensation | 56 | ||||||
| ITEM 12. | Security Ownership of Certain Beneficial Owners and Management and Related Stockholder Matters | 56 | ||||||
| ITEM 13. | Certain Relationships and Related Transactions, and Director Independence | 57 | ||||||
| ITEM 14. | Principal Accounting Fees and Services | 57 | ||||||
| PART IV | ||||||||
| ITEM 15. | Exhibits, Financial Statement Schedules | 58 | ||||||
| ITEM 16. | Form 10-K Summary | 58 | ||||||
| SIGNATURES |
(i)
PART I
Item 1. Business
General
EOG Resources, Inc., a Delaware corporation organized in 1985, together with its subsidiaries (collectively, EOG), explores for, develops, produces and markets crude oil, natural gas liquids (NGLs) and natural gas primarily in major producing basins in the United States of America (United States or U.S.), The Republic of Trinidad and Tobago (Trinidad) and, from time to time, select other international areas. EOG's principal producing areas are further described in "Exploration and Production" below. EOG's Annual Reports on Form 10-K, Quarterly Reports on Form 10‑Q, Current Reports on Form 8-K and any amendments to those reports (including related exhibits and supplemental schedules) filed or furnished pursuant to Section 13(a) or 15(d) of the Securities Exchange Act of 1934 (as amended) are made available, free of charge, through EOG's website, as soon as reasonably practicable after such reports have been filed with, or furnished to, the United States Securities and Exchange Commission (SEC). EOG's website address is www.eogresources.com. Information on our website is not incorporated by reference into, and does not constitute a part of, this report.
At December 31, 2021, EOG's total estimated net proved reserves were 3,747 million barrels of oil equivalent (MMBoe), of which 1,548 million barrels (MMBbl) were crude oil and condensate reserves, 829 MMBbl were NGLs reserves and 8,222 billion cubic feet (Bcf), or 1,370 MMBoe, were natural gas reserves (see "Supplemental Information to Consolidated Financial Statements"). At such date, approximately 99% of EOG's net proved reserves, on a crude oil equivalent basis, were located in the United States and 1% in Trinidad. Crude oil equivalent volumes are determined using a ratio of 1.0 barrel of crude oil and condensate or NGLs to 6.0 thousand cubic feet (Mcf) of natural gas.
EOG's operations are all crude oil and natural gas exploration and production related. For information regarding the risks associated with EOG's domestic and foreign operations, see ITEM 1A, Risk Factors.
EOG's business strategy is to maximize the rate of return on investment of capital by controlling operating and capital costs and maximizing reserve recoveries. Pursuant to this strategy, each prospective drilling location is evaluated by its estimated rate of return. This strategy is intended to enhance the generation of cash flow and earnings from each unit of production on a cost-effective basis, allowing EOG to deliver long-term growth in shareholder value and maintain a strong balance sheet. EOG is focused on innovation and cost-effective utilization of advanced technology associated with three-dimensional seismic and microseismic data, the development of reservoir simulation models and the use of improved drilling equipment and completion technologies for horizontal drilling and formation evaluation. These advanced technologies are used, as appropriate, throughout EOG to reduce the risks and costs associated with all aspects of oil and gas exploration, development and exploitation. EOG implements its strategy primarily by emphasizing the drilling of internally generated prospects in order to find and develop low-cost reserves. Maintaining the lowest possible operating cost structure, coupled with efficient and safe operations and robust environmental stewardship practices and performance, is integral in the implementation of EOG's strategy.
With respect to information on EOG's working interest in wells or acreage, "net" oil and gas wells or acreage are determined by multiplying "gross" oil and gas wells or acreage by EOG's working interest in the wells or acreage.
Exploration and Production
United States Operations
EOG's operations are located in most of the productive basins in the United States with a focus on crude oil and, to a lesser extent, liquids-rich natural gas plays.
At December 31, 2021, on a crude oil equivalent basis, 42% of EOG's net proved reserves in the United States were crude oil and condensate, 22% were NGLs and 36% were natural gas. The majority of these reserves are in long-lived fields with well-established production characteristics. EOG believes that opportunities exist to increase production through continued development in and around many of these fields and through the utilization of applicable technologies. EOG also maintains an active exploration program designed to extend fields and add new trends and resource plays to its already broad portfolio.
The following is a summary of wellhead volume statistics and net well completions for the year ended December 31, 2021, total net acres at December 31, 2021, and expected net well completions planned for 2022 for certain areas of EOG's United States operations.
| 2021 | 2022 | |||||||||||||||||||||||||
| Area of Operation | Crude Oil & Condensate Volumes (MBbld) (1) | Natural Gas Liquids Volumes (MBbld) (1) | Natural Gas Volumes (MMcfd) (1) | Total Net Acres (in thousands) | Net Well Completions | Expected Net Well Completions | ||||||||||||||||||||
| Delaware Basin | 231.1 | 84.6 | 651 | 395 | 288 | 375 | ||||||||||||||||||||
| South Texas | 149.5 | 29.3 | 273 | 1,131 | 166 | 125 | ||||||||||||||||||||
| Rocky Mountain | 50.3 | 16.9 | 182 | 1,037 | 50 | <50 | ||||||||||||||||||||
| Other Areas | 12.5 | 13.7 | 104 | 1,130 | 12 | 20 | ||||||||||||||||||||
| Total | 443.4 | 144.5 | 1,210 | 3,693 | 516 | 520 |
(1)Thousand barrels per day or million cubic feet per day, as applicable.
In the Delaware Basin, EOG completed 288 net wells during 2021, primarily in the Delaware Basin Wolfcamp, Bone Spring and Leonard plays. The Delaware Basin consists of approximately 4,800 feet of oil rich stacked pay potential offering EOG multiple co-development opportunities throughout its 395,000 net acre position.
In the Delaware Basin Wolfcamp play, EOG has completed 189 net wells in 2021. Continued improvement and excellent results in the Delaware Basin Wolfcamp program were supported by optimized well spacing and co-development, enhanced well completions, precision drilling and continued cost reductions. In 2022, the Delaware Basin Wolfcamp play will continue to be a primary area of focus.
In the Bone Spring play, EOG has three main sub-plays: the First, Second and Third Bone Spring. In 2021, EOG completed 79 total net Bone Spring wells within the three sub-plays. Of the three sub-plays, the Second Bone Spring had the majority of the activity in 2021 with EOG completing 63 net wells. The Bone Spring play continues to be an integral part of EOG's Delaware Basin plans and portfolio.
In the Leonard play, EOG maintained its development plan with 20 net wells completed in 2021. EOG has tested co-development of up to three Leonard zones simultaneously, and expects the Leonard play to become a more active part of EOG's program in the next several years.
Activity in 2022 will remain focused on the Delaware Basin Wolfcamp, Bone Spring, and Leonard plays, where EOG expects to complete approximately 375 net wells.
The South Texas area includes our Eagle Ford oil play and our Dorado gas play. EOG holds approximately 516,000 total net acres in the prolific oil window of the Eagle Ford oil play and approximately 160,000 net acres in the Dorado gas play. In the Dorado gas play, EOG has continued to delineate the Eagle Ford and Austin Chalk formatio
Showing the first 8K of 61K characters. Open the full section
Item 1A. Risk Factors
Our business and operations are subject to many risks. The risks described below may not be the only risks we face, as our business and operations may also be subject to risks that we do not yet know of, or that we currently believe are immaterial. If any of the events or circumstances described below actually occurs, our business, financial condition, results of operations or cash flows could be materially and adversely affected and the trading price of our common stock could decline. The following risk factors should be read in conjunction with the other information contained herein, including the consolidated financial statements and the related notes. Unless the context requires otherwise, "we," "us," "our" and "EOG" refer to EOG Resources, Inc. and its subsidiaries.
Risks Related to our Financial Condition, Results of Operations and Cash Flows
Crude oil, NGLs and natural gas prices are volatile, and a substantial and extended decline in commodity prices can have a material and adverse effect on us.
Prices for crude oil and natural gas (including prices for natural gas liquids (NGLs) and condensate) fluctuate widely. Among the interrelated factors that can or could cause these price fluctuations are:
-
domestic and worldwide supplies of, and consumer and industrial/commercial demand for, crude oil, NGLs and natural gas;
-
domestic and international drilling activity;
-
the actions of other crude oil producing and exporting nations, including the Organization of Petroleum Exporting Countries;
-
worldwide economic conditions, geopolitical factors and political conditions, including, but not limited to, the imposition of tariffs or trade or other economic sanctions, political instability or armed conflict in oil and gas producing regions;
-
the duration and economic and financial impact of epidemics, pandemics or other public health issues, such as the ongoing COVID-19 pandemic;
-
the availability, proximity and capacity of appropriate transportation, gathering, processing, compression, storage, refining and export facilities;
-
the price and availability of, and demand for, competing energy sources, including alternative energy sources;
-
the effect of worldwide energy conservation measures, alternative fuel requirements and climate change-related policies, initiatives and developments;
-
technological advances and consumer and industrial/commercial behavior, preferences and attitudes, in each case affecting energy generation, transmission, storage and consumption;
-
the nature and extent of governmental regulation, including environmental and other climate change-related regulation, regulation of derivatives transactions and hedging activities, tax laws and regulations and laws and regulations with respect to the import and export of crude oil, NGLs, and natural gas and related commodities;
-
the level and effect of trading in commodity futures markets, including trading by commodity price speculators and others; and
-
natural disasters, weather conditions and changes in weather patterns.
The above-described factors and the volatility of commodity prices make it difficult to predict crude oil, NGLs and natural gas prices in 2022 and thereafter. As a result, there can be no assurance that the prices for crude oil, NGLs and/or natural gas will sustain, or increase from, their current levels, nor can there be any assurance that the prices for crude oil, NGLs and/or natural gas will not decline.
Our cash flows, financial condition and results of operations depend to a great extent on prevailing commodity prices. Accordingly, substantial and extended declines in commodity prices can materially and adversely affect the amount of cash flows we have available for our capital expenditures and operating expenses; the terms on which we can access the credit and capital markets; our results of operations; and our financial condition, including (but not limited to) our ability to pay dividends on our common stock. As a result, the trading price of our common stock may be materially and adversely affected.
Lower commodity prices can also reduce the amount of crude oil, NGLs and natural gas that we can produce economically. Substantial and extended declines in the prices of these commodities can render uneconomic a portion of our exploration, development and exploitation projects, resulting in our having to make downward adjustments to our estimated proved reserves and also possibly shut in or plug and abandon certain wells. In addition, significant prolonged decreases in commodity prices may cause the expected future cash flows from our properties to fall below their respective net book values, which would require us to write down the value of our properties. Such reserve write-downs and asset impairments can materially and adversely affect our results of operations and financial position and, in turn, the trading price of our common stock.
Developments related to climate change may have a material and adverse effect on us.
Governmental and regulatory bodies, investors, consumers, industry and other stakeholders have been increasingly focused on climate change matters in recent years. This focus, together with changes in consumer and industrial/commercial behavior, preferences and attitudes with respect to the generation and consumption of energy, the use of crude oil, NGLs and natural gas and the use of products manufactured with, or powered by, crude oil, NGLs and natural gas, may result in (i) the enactment of climate change-related regulations, policies and initiatives (at the government, corporate and/or investor community levels), including alternative energy requirements and energy conservation measures, (ii) technological advances with respect to the generation, transmission, storage and consumption of energy (e.g., wind, solar and hydrogen power, smart grid technology and battery technology) and (iii) increased availability of, and increased consumer and industrial/commercial demand for, non-hydrocarbon energy sources (e.g., alternative energy sources) and products manufactured with, or powered by, non-hydrocarbon sources (e.g., electric vehicles and renewable residential and commercial power supplies). These developments may adversely affect the demand for products manufactured with, or powered by, crude oil, NGLs and natural gas and the demand for, and in turn the prices of, the crude oil, NGLs and natural gas that we sell. See the risk factor above for a discussion of the impact of commodity prices (including fluctuations in commodity prices) on our financial condition, cash flows and results of operations.
In addition to potentially adversely affecting the demand for, and prices of, the crude oil, NGLs and natural gas that we sell, such developments may also adversely impact, among other things, the availability to us of necessary third-party services and facilities that we rely on, which may increase our operational costs and adversely affect our ability to explore for, produce, transport and process crude oil, NGLs and natural gas and successfully carry out our business strategy. For further discussion of the potential impact of such risks on our financial condition and results of operations, see the discussion in the section below entitled "Risks Related to our Operations."
Further, climate change-related developments may result in negative perceptions of the oil and gas industry and, in turn, reputational risks associated with the exploration for, and production of, hydrocarbons. Such negative perceptions and reputational risks may adversely affect our ability to successfully carry out our business strategy, for example, by adversely affecting the availability and cost to us of capital. For further discussion of the potential impact of such risks on our financial condition, cash flows and results of operations, see the discussion below in this section and in the section below entitled "Risks Related to Regulatory
Showing the first 8K of 69K characters. Open the full section
Item 1B. Unresolved Staff Comments
Not applicable.
Item 2. Properties
Oil and Gas Exploration and Production - Properties and Reserves
Reserve Information. For estimates and discussions of EOG's net proved reserves of crude oil and condensate, natural gas liquids (NGLs) and natural gas, the qualifications of the preparers of EOG's reserve estimates, EOG's independent petroleum consultants and EOG's processes and controls with respect to its reserve estimates, see "Supplemental Information to Consolidated Financial Statements."
There are numerous uncertainties inherent in estimating quantities of proved reserves and in projecting future rates of production and timing of development expenditures, including many factors beyond the control of the producer. The reserve data set forth in "Supplemental Information to Consolidated Financial Statements" represent only estimates. Reserve engineering is a complex, subjective process of estimating underground accumulations of crude oil and condensate, NGLs and natural gas that cannot be measured in an exact manner. The accuracy of any reserve estimate is a function of the amount and quality of available data and of engineering and geological interpretation and judgment. As a result, estimates by different engineers normally vary. In addition, results of drilling, testing and production or fluctuations in commodity prices subsequent to the date of an estimate may justify revision of such estimate (upward or downward). Accordingly, reserve estimates are often different from the quantities ultimately recovered. Further, the meaningfulness of such estimates is highly dependent upon the accuracy of the assumptions upon which they were based. For related discussion, see ITEM 1A, Risk Factors, and "Supplemental Information to Consolidated Financial Statements."
In general, the rate of production from crude oil and natural gas properties declines as reserves are produced. Except to the extent EOG acquires additional properties containing proved reserves, conducts successful exploration, exploitation and development activities or, through engineering studies, identifies additional behind-pipe zones or secondary recovery reserves, the proved reserves of EOG will decline as reserves are produced. Future production is, therefore, highly dependent upon the level of success of these activities. For related discussion, see ITEM 1A, Risk Factors. EOG's estimates of reserves filed with other federal agencies are consistent with the information set forth in "Supplemental Information to Consolidated Financial Statements."
Acreage. The following table summarizes EOG's gross and net developed and undeveloped acreage at December 31, 2021 (in thousands). Excluded is acreage in which EOG's interest is limited to owned royalty, overriding royalty and other similar interests.
| Developed | Undeveloped | Total | |||||||||||||||||||||||||||||||||
| Gross | Net | Gross | Net | Gross | Net | ||||||||||||||||||||||||||||||
| United States | 2,329 | 1,829 | 2,852 | 1,864 | 5,181 | 3,693 | |||||||||||||||||||||||||||||
| Trinidad | 80 | 67 | 216 | 125 | 296 | 192 | |||||||||||||||||||||||||||||
| Oman | — | — | 4,585 | 4,585 | 4,585 | 4,585 | |||||||||||||||||||||||||||||
| Australia | — | — | 1,009 | 1,009 | 1,009 | 1,009 | |||||||||||||||||||||||||||||
| Total | 2,409 | 1,896 | 8,662 | 7,583 | 11,071 | 9,479 |
Most of our undeveloped oil and gas leases, particularly in the United States, are subject to lease expiration if initial wells are not drilled within a specified period, generally between three to five years. Approximately 0.2 million net acres will expire in 2022, 0.1 million net acres will expire in 2023 and 0.1 million net acres will expire in 2024 if production is not established or we take no other action to extend the terms of the leases or obtain concessions. As of December 31, 2021, there were no proved undeveloped reserves (PUDs) associated with such undeveloped acreage. In the ordinary course of business, based on our evaluations of certain geologic trends and prospective economics, we have allowed certain lease acreage to expire and may allow additional acreage to expire in the future.
Many of our oil and gas leases are large enough to accommodate more than one producing unit. Included in our undeveloped acreage is non-producing acreage within such larger producing leases.
Acreage associated with EOG's exploration program in Oman was reduced as of December 31, 2021, due to EOG contractually agreeing with its partner in Block 49 to withdraw. Additionally, EOG does not intend to proceed with additional work commitments and therefore anticipates relinquishing its Block 36 acreage in the third quarter of 2022.
The agreement governing the acreage associated with our exploration program in offshore Australia is set to expire at various dates through 2025 depending on EOG's decision to move forward with its defined work program or unless EOG is granted a production license.
Productive Well Summary. The following table represents EOG's gross and net productive wells, including 2,427 wells in which we hold a royalty interest.
| Crude Oil | Natural Gas | Total | |||||||||||||||||||||||||||||||||
| Gross | Net | Gross | Net | Gross | Net | ||||||||||||||||||||||||||||||
| United States | 8,999 | 6,402 | 4,756 | 2,850 | 13,755 | 9,252 | |||||||||||||||||||||||||||||
| Trinidad | 2 | 2 | 33 | 26 | 35 | 28 | |||||||||||||||||||||||||||||
| Total (1) | 9,001 | 6,404 | 4,789 | 2,876 | 13,790 | 9,280 |
(1) EOG operated 10,233 gross and 9,064 net producing crude oil and natural gas wells at December 31, 2021. Gross crude oil and natural gas wells include 129 wells with multiple completions.
Drilling and Acquisition Activities. During the years ended December 31, 2021, 2020 and 2019, EOG expended $4.0 billion, $3.7 billion and $6.6 billion, respectively, for exploratory and development drilling, facilities and acquisition of leases and producing properties, including asset retirement costs of $127 million, $117 million and $186 million, respectively. The following tables set forth the results of the gross crude oil and natural gas wells completed for the years ended December 31, 2021, 2020 and 2019:
| Gross Development Wells Completed | Gross Exploratory Wells Completed | ||||||||||||||||||||||||||||||||||||||||||||||
| Crude Oil | Natural Gas | Dry Hole | Total | Crude Oil | Natural Gas | Dry Hole | Total | ||||||||||||||||||||||||||||||||||||||||
| 2021 | |||||||||||||||||||||||||||||||||||||||||||||||
| United States | 474 | 72 | 5 | 551 | 10 | 1 | 1 | 12 | |||||||||||||||||||||||||||||||||||||||
| Trinidad | — | — | — | — | — | — | — | — | |||||||||||||||||||||||||||||||||||||||
| Oman | — | — | — | — | — | — | 3 | 3 | |||||||||||||||||||||||||||||||||||||||
| Total | 474 | 72 | 5 | 551 | 10 | 1 | 4 | 15 | |||||||||||||||||||||||||||||||||||||||
| 2020 | |||||||||||||||||||||||||||||||||||||||||||||||
| United States | 580 | 13 | 15 | 608 | 3 | — | 4 | 7 | |||||||||||||||||||||||||||||||||||||||
| Trinidad | — | — | — | — | — | 3 | — | 3 | |||||||||||||||||||||||||||||||||||||||
| Total | 580 | 13 | 15 | 608 | 3 | 3 | 4 | 10 | |||||||||||||||||||||||||||||||||||||||
| 2019 | |||||||||||||||||||||||||||||||||||||||||||||||
| United States | 833 | 26 | 14 | 873 | 4 | — | 1 | 5 | |||||||||||||||||||||||||||||||||||||||
| Trinidad | — | 1 | — | 1 | — | — | 1 | 1 | |||||||||||||||||||||||||||||||||||||||
| China | — | 2 | — | 2 | — | — | 1 | 1 | |||||||||||||||||||||||||||||||||||||||
| Total | 833 | 29 | 14 | 876 | 4 | — | 3 | 7 |
The following tables set forth the results of the net crude oil and natural gas wells completed for the years ended December 31, 2021, 2020 and 2019:
| Net Development Wells Completed | Net Exploratory Wells Completed | ||||||||||||||||||||||||||||||||||||||||||||||
| Crude Oil | Natural Gas | Dry Hole | Total | Crude Oil | Natural Gas | Dry Hole | Total | ||||||||||||||||||||||||||||||||||||||||
| 2021 | |||||||||||||||||||||||||||||||||||||||||||||||
| United States | 434 | 66 | 4 | 504 | 10 | 1 | 1 | 12 | |||||||||||||||||||||||||||||||||||||||
| Trinidad | — | — | — | — | — | — | — | — | |||||||||||||||||||||||||||||||||||||||
| Oman | — | — | — | — | — | — | 3 | 3 | |||||||||||||||||||||||||||||||||||||||
| Total | 434 | 66 | 4 | 504 | 10 | 1 | 4 | 15 | |||||||||||||||||||||||||||||||||||||||
| 2020 | |||||||||||||||||||||||||||||||||||||||||||||||
| United States | 516 | 12 | 15 | 543 | 2 | — | 3 | 5 | |||||||||||||||||||||||||||||||||||||||
| Trinidad | — | — | — | — | — | 2 | — | 2 | |||||||||||||||||||||||||||||||||||||||
| Total | 516 | 12 | 15 | 543 | 2 | 2 | 3 | 7 | |||||||||||||||||||||||||||||||||||||||
| 2019 | |||||||||||||||||||||||||||||||||||||||||||||||
| United States | 721 | 22 | 12 | 755 | 4 | — | 1 | 5 | |||||||||||||||||||||||||||||||||||||||
| Trinidad | — | 1 | — | 1 | — | — | 1 | 1 | |||||||||||||||||||||||||||||||||||||||
| China | — | 2 | — | 2 | — | — | 1 | 1 | |||||||||||||||||||||||||||||||||||||||
| Total | 721 | 25 | 12 | 758 | 4 | — | 3 | 7 |
EOG participated in the drilling of wells that were in the process of being drilled or completed at the end of the period as set out in the table below for the years ended December 31, 2021, 2020 and 2019:
| Wells in Progress at End of Period | |||||||||||||||||||||||||||||||||||
| 2021 | 2020 | 2019 | |||||||||||||||||||||||||||||||||
| Gross | Net | Gross | Net | Gross | Net | ||||||||||||||||||||||||||||||
| United States | 191 | 167 | 155 | 147 | 317 | 286 | |||||||||||||||||||||||||||||
| Trinidad | 1 | 1 | 1 | 1 | 1 | 1 | |||||||||||||||||||||||||||||
| China | — | — | 3 | 3 | 3 | 3 | |||||||||||||||||||||||||||||
| Oman | — | — | 1 | 1 | — | — | |||||||||||||||||||||||||||||
| Total | 192 | 168 | 160 | 152 | 321 | 290 |
Included in the previous table of wells in progress at the end of the period were wells which had been drilled, but were not completed (DUCs). In order to effectively manage its capital expenditures and to provide flexibility in managing its drilling rig and well completion schedules, EOG, from time to time, will have an inventory of DUCs. At December 31, 2021, there were approximately 72 MMBoe of net PUDs associated with EOG's inventory of DUCs. Under EOG's current drilling plan, all such DUCs are expected to be completed within five years from the original booking date of such reserves. The following table sets forth EOG's DUCs, for which PUDs had been booked, as of the end of each period.
| Drilled Uncompleted Wells at End of Period | |||||||||||||||||||||||||||||||||||
| 2021 | 2020 | 2019 | |||||||||||||||||||||||||||||||||
| Gross | Net | Gross | Net | Gross | Net | ||||||||||||||||||||||||||||||
| United States | 121 | 105 | 89 | 86 | 188 | 165 | |||||||||||||||||||||||||||||
| China | — | — | 3 | 3 | 3 | 3 | |||||||||||||||||||||||||||||
| Total | 121 | 105 | 92 | 89 | 191 | 168 |
EOG acquired wells as set forth in the following table (excluding the acquisition of additional interests in 5, 8 and 11 net wells in which EOG previously owned an interest for the years ended December 31, 2021, 2020 and 2019, respectively) for the years ended December 31, 2021, 2020 and 2019:
| Gross Acquired Wells | Net Acquired Wells | ||||||||||||||||||||||||||||||||||
| Crude Oil | Natural Gas | Total | Crude Oil | Natural Gas | Total | ||||||||||||||||||||||||||||||
| 2021 | |||||||||||||||||||||||||||||||||||
| United States | 2 | 14 | 16 | 1 | 13 | 14 | |||||||||||||||||||||||||||||
| Total | 2 | 14 | 16 | 1 | 13 | 14 | |||||||||||||||||||||||||||||
| 2020 | |||||||||||||||||||||||||||||||||||
| United States | 80 | 3 | 83 | 70 | 3 | 73 | |||||||||||||||||||||||||||||
| Total | 80 | 3 | 83 | 70 | 3 | 73 | |||||||||||||||||||||||||||||
| 2019 | |||||||||||||||||||||||||||||||||||
| United States | 9 | 45 | 54 | 9 | 37 | 46 | |||||||||||||||||||||||||||||
| Total | 9 | 45 | 54 | 9 | 37 | 46 |
Other Property, Plant and Equipment. EOG's other property, plant and equipment primarily includes gathering, transportation and processing infrastructure assets and buildings which support EOG's exploration and production activities. EOG does not own drilling rigs, hydraulic fracturing equipment or rail cars. All of EOG's drilling and completion activities are conducted on a contractual basis with independent drilling contractors and other third-party service contractors.
Item 3. Legal Proceedings
See the information set forth under the "Contingencies" caption in Note 8 of the Notes to Consolidated Financial Statements, which is incorporated by reference herein.
Item 103 of Regulation S-K promulgated under the Securities Exchange Act of 1934, as amended, requires disclosure regarding certain proceedings arising under federal, state or local environmental laws when a governmental authority is a party to the proceedings and such proceedings involve potential monetary sanctions that EOG reasonably believes will exceed a specified threshold. Pursuant to this item, EOG uses a threshold of $1 million for purposes of determining whether disclosure of any such proceedings is required; EOG believes proceedings under this threshold are not material to EOG's business and financial condition. Applying this threshold, there are no environmental proceedings to disclose for the quarter and year ended December 31, 2021.
Item 4. Mine Safety Disclosures
The information concerning mine safety violations and other regulatory matters required by Section 1503(a) of the Dodd-Frank Wall Street Reform and Consumer Protection Act and Item 104 of Regulation S-K (17 CFR 229.104) is included in Exhibit 95 to this report.
PART II
Item 5. Market for Registrant's Common Equity, Related Stockholder Matters and Issuer Purchases of Equity Securities
EOG's common stock is traded on the New York Stock Exchange under the ticker symbol "EOG."
As of February 11, 2022, there were approximately 2,000 record holders and approximately 749,000 beneficial owners of EOG's common stock.
EOG expects to continue to pay dividends to its stockholders; however, EOG's Board may reduce the dividend or cease declaring dividends at any time, including if it determines that EOG's current or forecasted future cash flows provided by its operating activities (after deducting capital expenditures and other commitments) are not sufficient to pay EOG's desired levels of dividends to its stockholders or to pay dividends to its stockholders at all. For additional discussion, see ITEM 1A, Risk Factors.
The following table sets forth, for the periods indicated, EOG's share repurchase activity:
| Period | (a) Total Number of Shares Purchased (1) | (b) Average Price Paid per Share | (c) Total Number of Shares or Value of Shares Purchased as Part of Publicly Announced Plans or Programs | (d) Maximum Number (or Approximate Dollar Value) of Shares that May Yet Be Purchased Under the Plans or Programs (2)(3) | ||||||||||||||||||||||
| October 1, 2021 - October 31, 2021 | 40,557 | $ | 89.42 | — | 6,386,200 | |||||||||||||||||||||
| November 1, 2021 - November 30, 2021 | 22,852 | 94.24 | — | $ | 5,000,000,000 | |||||||||||||||||||||
| December 1, 2021 - December 31, 2021 | 15,351 | 86.38 | — | $ | 5,000,000,000 | |||||||||||||||||||||
| Total | 78,760 | $ | 90.22 |
(1)The 78,760 total shares for the quarter ended December 31, 2021, and the 503,667 total shares for the full year 2021, consist solely of shares that were withheld by or returned to EOG (i) in satisfaction of tax withholding obligations that arose upon the exercise of employee stock options or stock-settled stock appreciation rights or the vesting of restricted stock, restricted stock unit or performance unit grants or (ii) in payment of the exercise price of employee stock options. These shares do not count against either the September 2001 Authorization or the November 2021 Authorization (each as defined and further discussed below).
(2)In September 2001, the Board authorized the repurchase of up to 10,000,000 shares of EOG's common stock (September 2001 Authorization). The September 2001 Authorization was announced on October 2, 2001. EOG did not repurchase any shares under the September 2001 Authorization during the fourth quarter 2021 (through November 3, 2021) and last repurchased shares under the September 2001 Authorization in March 2003.
(3)Effective November 4, 2021, the Board (i) established a new share repurchase authorization to allow for the repurchase by EOG of up to $5 billion of its common stock (November 2021 Authorization) and (ii) revoked and terminated the September 2001 Authorization. Under the November 2021 Authorization (which was announced November 4, 2021), EOG may repurchase shares from time to time, at management's discretion, in accordance with applicable securities laws, including through open market transactions, privately negotiated transactions or any combination thereof. The timing and amount of repurchases, if any, will be at the discretion of EOG's management and will depend on a variety of factors, including the then-trading price of EOG's common stock, corporate and regulatory requirements, and other market and economic conditions. Repurchased shares will be held as treasury shares and will be available for general corporate purposes. The November 2021 Authorization has no time limit, does not require EOG to repurchase a specific number of shares and may be modified, suspended, or terminated by the Board at any time. EOG did not repurchase any shares under the November 2021 Authorization during the period from November 4, 2021 through December 31, 2021.
Comparative Stock Performance
The following performance graph and related information shall not be deemed "soliciting material" or to be "filed" with the United States Securities and Exchange Commission, nor shall such information be incorporated by reference into any future filing under the Securities Act of 1933, as amended, or Securities Exchange Act of 1934, as amended, except to the extent that EOG specifically requests that such information be treated as "soliciting material" or specifically incorporates such information by reference into such a filing.
The performance graph shown below compares the cumulative five-year total return to stockholders on EOG's common stock as compared to the cumulative five-year total returns on the Standard and Poor's 500 Index (S&P 500) and the Standard and Poor's 500 Oil & Gas Exploration & Production Index (S&P O&G E&P). The comparison was prepared based upon the following assumptions:
1.$100 was invested on December 31, 2016 in each of the following: common stock of EOG, the S&P 500 and the S&P O&G E&P.
- Dividends are reinvested.
Comparison of Five-Year Cumulative Total Returns
EOG, S&P 500 and S&P O&G E&P
(Performance Results Through December 31, 2021)
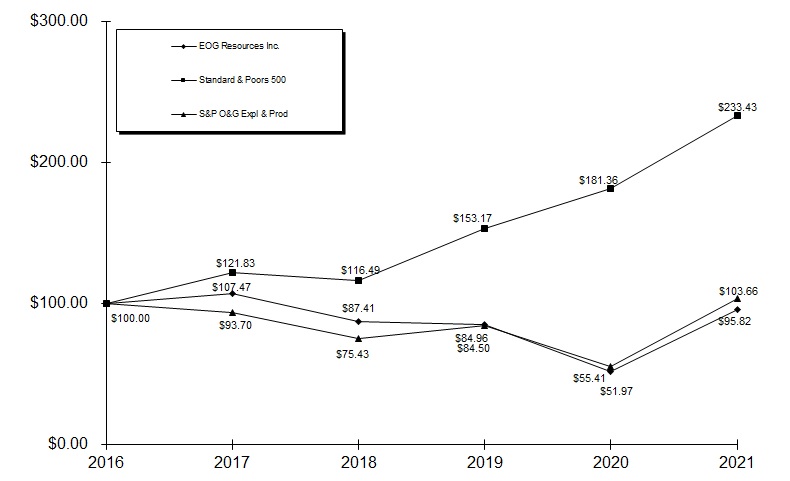
| 2016 | 2017 | 2018 | 2019 | 2020 | 2021 | ||||||||||||||||||||||||||||||
| EOG | $ | 100.00 | $ | 107.47 | $ | 87.41 | $ | 84.96 | $ | 51.97 | $ | 95.82 | |||||||||||||||||||||||
| S&P 500 | $ | 100.00 | $ | 121.83 | $ | 116.49 | $ | 153.17 | $ | 181.36 | $ | 233.43 | |||||||||||||||||||||||
| S&P O&G E&P | $ | 100.00 | $ | 93.70 | $ | 75.43 | $ | 84.50 | $ | 55.41 | $ | 103.66 |
Item 6. Reserved
Item 7. Management's Discussion and Analysis of Financial Condition and Results of Operations
Overview
EOG Resources, Inc., together with its subsidiaries (collectively, EOG), is one of the largest independent (non-integrated) crude oil and natural gas companies in the United States with proved reserves in the United States and Trinidad. EOG operates under a consistent business and operational strategy that focuses predominantly on maximizing the rate of return on investment of capital by controlling operating and capital costs and maximizing reserve recoveries. Pursuant to this strategy, each prospective drilling location is evaluated by its estimated rate of return. This strategy is intended to enhance the generation of cash flow and earnings from each unit of production on a cost-effective basis, allowing EOG to deliver long-term growth in shareholder value and maintain a strong balance sheet. EOG implements its strategy primarily by emphasizing the drilling of internally generated prospects in order to find and develop low-cost reserves. Maintaining the lowest possible operating cost structure, coupled with efficient and safe operations and robust environmental stewardship practices and performance, is integral in the implementation of EOG's strategy.
EOG realized net income of $4,664 million during 2021 as compared to a net loss of $605 million for 2020. At December 31, 2021, EOG's total estimated net proved reserves were 3,747 million barrels of oil equivalent (MMBoe), an increase of 527 MMBoe from December 31, 2020. During 2021, net proved crude oil and condensate and natural gas liquids (NGLs) reserves increased by 50 million barrels (MMBbl), and net proved natural gas reserves increased by 2,862 billion cubic feet or 477 MMBoe, in each case from December 31, 2020.
Recent Developments
Commodity Prices. In 2020, the COVID-19 pandemic and the measures taken to address and limit the spread of the virus adversely affected the economies and financial markets of the world, resulting in an economic downturn beginning in early 2020 that negatively impacted global demand and prices for crude oil and condensate, NGLs and natural gas. In response, OPEC+, a consortium of OPEC (Organization of Petroleum Exporting Countries) and certain non-OPEC global producers (Russia, Kazakhstan and others), agreed to voluntarily curtail crude oil supplies beginning in April 2020 with a schedule to bring back some of these curtailments through April 2021. Certain other non-OPEC+ countries also curtailed production and/or reduced investments in existing and new crude oil projects. This response started the process of balancing supply with demand.
In 2021, the effects of global COVID-19 mitigation efforts, including extensive global fiscal stimulus and the availability of vaccines, tempered by new COVID-19 variant strains and corresponding containment measures in certain parts of the world, have resulted in overall increased demand for crude oil and condensate, NGLs and natural gas. See ITEM 1A, Risk Factors for discussion of risks related to the COVID-19 pandemic.
During 2021 and into early 2022, OPEC+ continued their schedule of gradually returning all curtailed production through 2022 in response to expected increases in demand for crude oil. The continuing rebalancing of crude oil demand and supply resulting from improving or stabilizing conditions in certain economies and financial markets of the world, combined with the continuing actions taken by OPEC+, had a positive impact on crude oil prices in 2021. Prices for crude oil and condensate and NGLs returned to prepandemic levels in the first quarter of 2021, while natural gas prices returned to pre-pandemic levels at the beginning of 2021.
As a result of the many uncertainties associated with (i) the world economic and political environment, (ii) the COVID-19 pandemic and its continuing effect on the economies and financial markets of the world and (iii) any future actions by the members of OPEC+, and the effect of these uncertainties on worldwide supplies of, and demand for, crude oil and condensate, NGLs and natural gas, EOG is unable to predict what changes may occur in crude oil and condensate, NGLs and natural gas prices in the future. However, prices for crude oil and condensate, NGLs and natural gas have historically been volatile, and this volatility is expected to continue. For related discussion, see ITEM 1A, Risk Factors.
EOG will continue to monitor future market conditions and adjust its capital allocation strategy and production outlook accordingly in order to maximize shareholder value while maintaining its strong financial position.
Climate Change. For a discussion of climate change matters and related regulatory matters, including potential developments related to climate change and the potential impacts and risks of such developments on EOG, see ITEM 1A, Risk Factors, and the related discussion in ITEM 1, Business – Regulation. EOG will continue to monitor and assess any climate change-related developments that could impact EOG and the oil and gas industry, to determine the impact on its business and operations, and take appropriate actions where necessary.
Operations
Several important developments have occurred since January 1, 2021.
United States. EOG's efforts to identify plays with large reserve potential have proven to be successful. EOG continues to drill numerous wells in large acreage plays, which in the aggregate have contributed substantially to, and are expected to continue to contribute substantially to, EOG's crude oil and condensate, NGLs and natural gas production. EOG has placed an emphasis on applying its horizontal drilling and completion expertise to unconventional crude oil and, to a lesser extent, liquids-rich natural gas plays.
During 2021, EOG continued to focus on increasing drilling, completion and operating efficiencies gained in prior years. Such efficiencies resulted in lower operating, drilling and completion costs in 2021. In addition, EOG continued to evaluate certain potential crude oil and condensate, NGLs and natural gas exploration and development prospects and to look for opportunities to add drilling inventory through leasehold acquisitions, farm-ins, exchanges or tactical acquisitions. On a volumetric basis, as calculated using a ratio of 1.0 barrel of crude oil and condensate or NGLs to 6.0 thousand cubic feet of natural gas, crude oil and condensate and NGLs production accounted for approximately 75% and 76% of United States production during 2021 and 2020, respectively. During 2021, drilling and completion activities occurred primarily in the Delaware Basin play, Eagle Ford oil play and Rocky Mountain area. EOG's major producing areas in the United States are in Texas and New Mexico. EOG faced interruptions to sales in certain markets due to disruptions throughout the United States from Winter Storm Uri in the first quarter of 2021. Winter Storm Uri also negatively impacted Lease and Well, Transportation and Gathering and Processing Costs in the first quarter of 2021. See ITEM 1, Business - Exploration and Production for further discussion regarding EOG's 2021 United States operations.
Trinidad. In the Republic of Trinidad and Tobago (Trinidad), EOG continues to deliver natural gas under existing supply contracts. Several fields in the South East Coast Consortium Block, Modified U(a) Block, Block 4(a), Modified U(b) Block, the Banyan Field and the Sercan Area have been developed and are producing natural gas, which is sold to the National Gas Company of Trinidad and Tobago Limited and its subsidiary, and crude oil and condensate which is sold to Heritage Petroleum Company Limited (Heritage).
In March 2021, EOG signed a farmout agreement with Heritage, which allows EOG to earn a 65% working interest in a portion of the contract area (EOG Area) governed by the Trinidad Northern Area License. The EOG Area is located offshore the southwest coast of Trinidad. EOG continues to make progress on the design and fabrication of
Showing the first 8K of 91K characters. Open the full section
Item 7A. Quantitative and Qualitative Disclosures About Market Risk
The information required by this Item is incorporated by reference from Item 7 of this report, specifically the information set forth under the captions "Commodity Derivative Transactions," "Financing," "Foreign Currency Exchange Rate Risk" and "Outlook" in "Management's Discussion and Analysis of Financial Condition and Results of Operations - Capital Resources and Liquidity."
Item 8. Financial Statements and Supplementary Data
The information required by this Item is included in this report as set forth in the "Index to Financial Statements" on page F-1 and is incorporated by reference herein.
Item 9. Changes in and Disagreements with Accountants on Accounting and Financial Disclosure
None.
Item 9A. Controls and Procedures
Disclosure Controls and Procedures. EOG's management, with the participation of EOG's principal executive officer and principal financial officer, evaluated the effectiveness of EOG's disclosure controls and procedures (as defined in Rules 13a-15(e) and 15d-15(e) promulgated under the Securities Exchange Act of 1934, as amended (Exchange Act)) as of December 31, 2021. EOG's disclosure controls and procedures are designed to provide reasonable assurance that information that is required to be disclosed in the reports EOG files or submits under the Exchange Act is accumulated and communicated to EOG's management, as appropriate, to allow timely decisions regarding required disclosure and is recorded, processed, summarized and reported within the time periods specified in the rules and forms of the United States Securities and Exchange Commission. Based on that evaluation, EOG's principal executive officer and principal financial officer have concluded that EOG's disclosure controls and procedures were effective as of December 31, 2021.
Management's Annual Report on Internal Control over Financial Reporting. EOG's management is responsible for establishing and maintaining adequate internal control over financial reporting (as defined in Rules 13a-15(f) and 15d-15(f) promulgated under the Exchange Act). Even an effective system of internal control over financial reporting, no matter how well designed, has inherent limitations, including the possibility of human error, circumvention of controls or overriding of controls and, therefore, can provide only reasonable assurance with respect to reliable financial reporting. Furthermore, the effectiveness of a system of internal control over financial reporting in future periods can change as conditions change.
EOG's management assessed the effectiveness of EOG's internal control over financial reporting as of December 31, 2021. In making this assessment, it used the criteria set forth by the Committee of Sponsoring Organizations of the Treadway Commission (COSO) in Internal Control - Integrated Framework (2013). Based on this assessment and such criteria, EOG's management believes that EOG's internal control over financial reporting was effective as of December 31, 2021. See also "Management's Responsibility for Financial Reporting" appearing on page F-2 of this report, which is incorporated herein by reference.
The report of EOG's independent registered public accounting firm relating to the consolidated financial statements and effectiveness of internal control over financial reporting is set forth on page F-3 of this report.
There were no changes in EOG's internal control over financial reporting that occurred during the quarter ended December 31, 2021, that have materially affected, or are reasonably likely to materially affect, EOG's internal control over financial reporting.
Item 9B. Other Information
None.
Item 9C. Disclosure Regarding Foreign Jurisdictions that Prevent Inspection
None.
PART III
Item 10. Directors, Executive Officers and Corporate Governance
The information required by this Item is incorporated by reference from (i) EOG's Definitive Proxy Statement with respect to its 2022 Annual Meeting of Stockholders to be filed not later than April 30, 2022 and (ii) Item 1 of this report, specifically the information therein set forth under the caption "Information About Our Executive Officers."
Pursuant to Rule 303A.10 of the New York Stock Exchange and Item 406 of Regulation S-K promulgated under the Securities Exchange Act of 1934, as amended, EOG has adopted a Code of Business Conduct and Ethics for Directors, Officers and Employees (Code of Conduct) that applies to all EOG directors, officers and employees, including EOG's principal executive officer, principal financial officer and principal accounting officer. EOG has also adopted a Code of Ethics for Senior Financial Officers (Code of Ethics) that, along with EOG's Code of Conduct, applies to EOG's principal executive officer, principal financial officer, principal accounting officer and controllers.
You can access the Code of Conduct and Code of Ethics on the "Governance" page under "Investors" on EOG's website at www.eogresources.com, and any EOG stockholder who so requests may obtain a printed copy of the Code of Conduct and Code of Ethics by submitting a written request to EOG's Corporate Secretary.
EOG intends to disclose any amendments to the Code of Conduct or Code of Ethics, and any waivers with respect to the Code of Conduct or Code of Ethics granted to EOG's principal executive officer, principal financial officer, principal accounting officer, any of our controllers or any of our other employees performing similar functions, on its website at www.eogresources.com within four business days of the amendment or waiver. In such case, the disclosure regarding the amendment or waiver will remain available on EOG's website for at least 12 months after the initial disclosure. There have been no waivers granted with respect to EOG's Code of Conduct or Code of Ethics.
Item 11. Executive Compensation
The information required by this Item is incorporated by reference from EOG's Definitive Proxy Statement with respect to its 2022 Annual Meeting of Stockholders to be filed not later than April 30, 2022. The Compensation and Human Resources Committee Report and related information incorporated by reference herein shall not be deemed "soliciting material" or to be "filed" with the United States Securities and Exchange Commission, nor shall such information be incorporated by reference into any future filing under the Securities Act of 1933, as amended, or Securities Exchange Act of 1934, as amended, except to the extent that EOG specifically incorporates such information by reference into such a filing.
Item 12. Security Ownership of Certain Beneficial Owners and Management and Related Stockholder Matters
The information required by this Item with respect to security ownership of certain beneficial owners and management is incorporated by reference from EOG's Definitive Proxy Statement with respect to its 2022 Annual Meeting of Stockholders to be filed not later than April 30, 2022.
Equity Compensation Plan Information
Stock Plans Approved by EOG Stockholders. EOG's stockholders approved the EOG Resources, Inc. 2021 Omnibus Equity Compensation Plan (2021 Plan) at the 2021 Annual Meeting of Stockholders in April 2021. From and after the April 29, 2021 effective date of the 2021 Plan, no further grants have been (or will be) made from the Amended and Restated EOG Resources, Inc. 2008 Omnibus Equity Compensation Plan (Amended and Restated 2008 Plan).
The 2021 Plan provides for grants of stock options, SARs, restricted stock and restricted stock units and other stock-based awards, up to an aggregate maximum of 20 million shares of EOG common stock, plus any shares that were subject to outstanding awards under the Amended and Restated 2008 Plan as of April 29, 2021 that subsequently are canceled or forfeited, expire or are otherwise not issued or are settled in cash. Under the 2021 Plan, grants may be made to employees and non-employee members of EOG's Board of Directors (Board).
EOG's stockholders approved the EOG Resources, Inc. 2008 Omnibus Equity Compensation Plan (2008 Plan) at the 2008 Annual Meeting of Stockholders in May 2008. The 2008 Plan provided for grants of stock options, SARs, restricted stock, restricted stock units, performance units and other stock-based awards to employees and non-employee members of EOG's Board. At the 2010 Annual Meeting of Stockholders in April 2010 (2010 Annual Meeting), EOG's stockholders approved an amendment to the 2008 Plan, authorizing an additional 13.8 million shares of EOG common stock for grant under the plan. At the 2013 Annual Meeting of Stockholders in May 2013, EOG's stockholders approved the Amended and Restated 2008 Plan, authorizing an additional 31.0 million shares of EOG common stock for grant under the plan and extending the expiration date of the plan to May 2023.
Also at the 2010 Annual Meeting, an amendment to the EOG Resources, Inc. Employee Stock Purchase Plan (ESPP) was approved to increase the shares available for grant by 2.0 million shares and extend the term of the ESPP to December 31, 2019, unless terminated earlier by its terms or by EOG. The ESPP was originally approved by EOG's stockholders in 2001 and would have expired on July 1, 2011. At the 2018 Annual Meeting of Stockholders in April 2018, stockholders approved an amendment and restatement of the ESPP to (among other changes) increase the number of shares available for grant by 2.5 million shares and further extend the term of the ESPP to December 31, 2027, unless terminated earlier by its terms or by EOG.
Stock Plans Not Approved by EOG Stockholders. In December 2008, the Board approved the amendment and continuation of the 1996 Deferral Plan as the "EOG Resources, Inc. 409A Deferred Compensation Plan" (Deferral Plan). Under the Deferral Plan (as subsequently amended), payment of up to 50% of base salary and 100% of annual cash bonus, director's fees, vestings of restricted stock units granted to non-employee directors (and dividends credited thereon) under the 2008 Plan and the 2021 Plan and 401(k) refunds (as defined in the Deferral Plan) may be deferred into a phantom stock account. In the phantom stock account, deferrals are treated as if shares of EOG common stock were purchased at the closing stock price on the date of deferral. Dividends are credited quarterly and treated as if reinvested in EOG common stock. Payment of the phantom stock account is made in actual shares of EOG common stock in accordance with the Deferral Plan and the individual's deferral election. A total of 540,000 shares of EOG common stock have been authorized by the Board and registered for issuance under the Deferral Plan. As of December 31, 2021, 401,535 phantom shares had been issued. The Deferral Plan is currently EOG's only stock plan that has not been approved by EOG's stockholders.
The following table sets forth data for EOG's equity compensation plans aggregated by the various plans approved by EOG's stockholders and those plans not approved by EOG's stockholders, in each case as of December 31, 2021.
| Plan Category | (a) Number of Securities to be Issued Upon Exercise of Outstanding Options, Warrants and Rights | (b) Weighted-Average Exercise Price of Outstanding Options, Warrants and Rights (1) | (c) Number of Securities Remaining Available for Future Issuance Under Equity Compensation Plans (Excluding Securities Reflected in Column (a)) | ||||||||||||||||||||
| Equity Compensation Plans Approved by EOG Stockholders | 11,524,127 | (2) | $ | 84.37 | 19,079,181 | (3) | |||||||||||||||||
| Equity Compensation Plans Not Approved by EOG Stockholders | 300,920 | (4) | N/A | 138,465 | (5) | ||||||||||||||||||
| Total | 11,825,047 | $ | 84.37 | 19,217,646 |
(1)The weighted-average exercise price is calculated based solely on the exercise prices of the outstanding stock option and SAR grants and does not reflect (i) shares that will be issued upon the vesting of outstanding grants of restricted stock units or the vesting of outstanding grants of performance units and restricted stock units with performance-based conditions (collectively, performance units) or (ii) shares that will be issued in respect of issued and outstanding Deferral Plan phantom shares, all of which have no exercise price.
(2)Amount includes (i) 9,968,540 outstanding stock option and SAR grants, (ii) 876,476 outstanding restricted stock units, for which shares of EOG common stock will be issued, on a one-for-one basis, upon the vesting of such grants, and (iii) 679,111 outstanding performance units and assumes, for purposes of this table, (A) the application of a 100% performance multiple upon the completion of each of the remaining performance periods in respect of such grants and (B) accordingly, the issuance, on a one-for-one basis, of an aggregate 679,111 shares of EOG common stock upon the vesting of such grants. As more fully discussed in Note 7 to Consolidated Financial Statements, upon the application of the relevant performance multiple at the completion of each of the remaining performance periods in respect of such grants, (A) a minimum of 0 and a maximum of 1,358,222 performance units could be outstanding and (B) accordingly, a minimum of 0 and a maximum of 1,358,222 shares of EOG common stock could be issued upon the vesting of such grants.
(3)Consists of (i) 17,500,011 shares remaining available for issuance under the 2021 Plan and (ii) 1,579,170 shares remaining available for purchase under the ESPP. As noted above, from and after the April 29, 2021 effective date of the 2021 Plan, no further grants have been (or will be) made from the Amended and Restated 2008 Plan.
(4)Consists of shares of EOG common stock to be issued in accordance with the Deferral Plan and participant deferral elections (i.e., in respect of the 300,920 phantom shares issued and outstanding under the Deferral Plan as of December 31, 2021).
(5)Represents phantom shares that remain available for issuance under the Deferral Plan.
Item 13. Certain Relationships and Related Transactions, and Director Independence
The information required by this Item is incorporated by reference from EOG's Definitive Proxy Statement with respect to its 2022 Annual Meeting of Stockholders to be filed not later than April 30, 2022.
Item 14. Principal Accounting Fees and Services
The information required by this Item is incorporated by reference from EOG's Definitive Proxy Statement with respect to its 2022 Annual Meeting of Stockholders to be filed not later than April 30, 2022.
PART IV
Item 15. Exhibits, Financial Statement Schedules
(a)(1) and (a)(2) Financial Statements and Financial Statement Schedule
See "Index to Financial Statements" set forth on page F-1.
(a)(3), (b) Exhibits
See pages E-1 through E-6 for a listing of the exhibits.
Item 16. Form 10-K Summary
None.
EOG RESOURCES, INC.
INDEX TO FINANCIAL STATEMENTS
| Page | |||||
| Consolidated Financial Statements: | |||||
| Management's Responsibility for Financial Reporting | F-2 | ||||
| Report of Independent Registered Public Accounting Firm (PCAOB ID No. 34) | F-3 | ||||
| Consolidated Statements of Income (Loss) and Comprehensive Income (Loss) for Each of the Three Years in the Period Ended December 31, 2021 | F-5 | ||||
| Consolidated Balance Sheets - December 31, 2021 and 2020 | F-6 | ||||
| Consolidated Statements of Stockholders' Equity for Each of the Three Years in the Period Ended December 31, 2021 | F-7 | ||||
| Consolidated Statements of Cash Flows for Each of the Three Years in the Period Ended December 31, 2021 | F-8 | ||||
| Notes to Consolidated Financial Statements | F-9 | ||||
| Supplemental Information to Consolidated Financial Statements | F-39 |
F-1
MANAGEMENT'S RESPONSIBILITY FOR FINANCIAL REPORTING
The following consolidated financial statements of EOG Resources, Inc., together with its subsidiaries (collectively, EOG), were prepared by management, which is responsible for the integrity, objectivity and fair presentation of such financial statements. The statements have been prepared in conformity with generally accepted accounting principles in the United States of America and, accordingly, include some amounts that are based on the best estimates and judgments of management.
EOG's management is also responsible for establishing and maintaining adequate internal control over financial reporting as well as designing and implementing programs and controls to prevent and detect fraud. The system of internal control of EOG is designed to provide reasonable assurance regarding the reliability of financial reporting and the preparation of financial statements for external purposes in accordance with generally accepted accounting principles in the United States of America. This system consists of 1) entity level controls, including written policies and guidelines relating to the ethical conduct of business affairs, 2) general computer controls and 3) process controls over initiating, authorizing, recording, processing and reporting transactions. Even an effective internal control system, no matter how well designed, has inherent limitations, including the possibility of human error, circumvention of controls or overriding of controls and, therefore, can provide only reasonable assurance with respect to reliable financial reporting. Furthermore, the effectiveness of a system of internal control over financial reporting in future periods can change as conditions change.
The adequacy of EOG's financial controls and the accounting principles employed by EOG in its financial reporting are under the general oversight of the Audit Committee of the Board of Directors. No member of this committee is an officer or employee of EOG. Moreover, EOG's independent registered public accounting firm and internal auditors have full, free, separate and direct access to the Audit Committee and meet with the committee periodically to discuss accounting, auditing and financial reporting matters.
EOG's management assessed the effectiveness of EOG's internal control over financial reporting as of December 31, 2021. In making this assessment, EOG used the criteria set forth by the Committee of Sponsoring Organizations of the Treadway Commission (COSO) in Internal Control - Integrated Framework (2013). These criteria cover the control environment, risk assessment process, control activities, information and communication systems, and monitoring activities. Based on this assessment and those criteria, management believes that EOG maintained effective internal control over financial reporting as of December 31, 2021.
Deloitte & Touche LLP, independent registered public accounting firm, was engaged to audit the consolidated financial statements of EOG and audit EOG's internal control over financial reporting and issue a report thereon. In the conduct of the audits, Deloitte & Touche LLP was given unrestricted access to all financial records and related data, including all minutes of meetings of stockholders, the Board of Directors and committees of the Board of Directors. Management believes that all representations made to Deloitte & Touche LLP during the audits were valid and appropriate. Their audits were made in accordance with the standards of the Public Company Accounting Oversight Board (United States). Their report appears on page F-3.
| EZRA Y. YACOB | TIMOTHY K. DRIGGERS | |||||||
| Chief Executive Officer | Executive Vice President and Chief | |||||||
| Financial Officer | ||||||||
| Houston, Texas | ||||||||
| February 24, 2022 |
F-2
REPORT OF INDEPENDENT REGISTERED PUBLIC ACCOUNTING FIRM
To the Stockholders and the Board of Directors of
EOG Resources, Inc.
Houston, Texas
Opinions on the Financial Statements and Internal Control over Financial Reporting
We have audited the accompanying consolidated balance sheets of EOG Resources, Inc. and subsidiaries (the "Company") as of December 31, 2021 and 2020, the related consolidated statements of income (loss) and comprehensive income (loss), stockholders' equity, and cash flows for each of the three years in the period ended December 31, 2021, and the related notes (collectively referred to as the “financial statements”). We also have audited the Company's internal control over financial reporting as of December 31, 2021, based on criteria established in Internal Control — Integrated Framework (2013) issued by the Committee of Sponsoring Organizations of the Treadway Commission (COSO).
In our opinion, the financial statements referred to above present fairly, in all material respects, the financial position of the Company as of December 31, 2021 and 2020, and the results of its operations and its cash flows for each of the three years in the period ended December 31, 2021, in conformity with accounting principles generally accepted in the United States of America. Also, in our opinion, the Company maintained, in all material respects, effective internal control over financial reporting as of December 31, 2021, based on the criteria established in Internal Control — Integrated Framework (2013) issued by COSO.
Basis for Opinions
The Company's management is responsible for these financial statements, for maintaining effective internal control over financial reporting, and for its assessment of the effectiveness of internal control over financial reporting, included in the accompanying Management’s Annual Report on Internal Control over Financial Reporting. Our responsibility is to express an opinion on these financial statements and an opinion on the Company's internal control over financial reporting based on our audits. We are a public accounting firm registered with the Public Company Accounting Oversight Board (United States) (PCAOB) and are required to be independent with respect to the Company in accordance with the U.S. federal securities laws and the applicable rules and regulations of the Securities and Excha
Showing the first 8K of 250K characters. Open the full section