 filings.tools
Equinix 10-K 2021-12-31
Filed 2022-02-18. 23 sections, 728K characters. Original on sec.gov · Markdown · JSON
Cover and table of contents
UNITED STATES
SECURITIES AND EXCHANGE COMMISSION
WASHINGTON, D.C. 20549
__________________________
FORM 10-K
| ☒ | ANNUAL REPORT PURSUANT TO SECTION 13 OR 15(d) OF THE SECURITIES EXCHANGE ACT OF 1934 |
For the fiscal year ended December 31, 2021
OR
| ☐ | TRANSITION REPORT PURSUANT TO SECTION 13 OR 15(d) OF THE SECURITIES EXCHANGE ACT OF 1934 |
For the transition period from _____________ to _____________
Commission file number 001-40205
______________________

EQUINIX, INC.
(Exact name of registrant as specified in its charter)
| Delaware | 77-0487526 | |||||||
| (State of incorporation) | (IRS Employer Identification No.) |
One Lagoon Drive, Redwood City, California 94065
(Address of principal executive offices, including ZIP code)
(650) 598-6000
(Registrant's telephone number, including area code)
Securities registered pursuant to Section 12(b) of the Act:
| Title of each class | Trading Symbol | Name of each exchange on which registered | ||||||||||||
| Common Stock, $0.001 | EQIX | The Nasdaq Stock Market LLC | ||||||||||||
| 0.250% Senior Notes due 2027 | The Nasdaq Stock Market LLC | |||||||||||||
| 1.000% Senior Notes due 2033 | The Nasdaq Stock Market LLC |
Securities registered pursuant to Section 12(g) of the Act: None
Indicate by check mark if the registrant is a well-known seasoned issuer, as defined in Rule 405 of the Act. Yes ☒ No ☐
Indicate by check mark if the registrant is not required to file reports pursuant to Section 13 or Section 15(d) of the Act. Yes ☐ No ☒
Indicate by check mark whether the registrant (1) has filed all reports required to be filed by Section 13 or 15(d) of the Securities Exchange Act of 1934 during the preceding 12 months (or for such shorter period that the registrant was required to file such reports), and (2) has been subject to such filing requirements for the past 90 days. Yes ☒ No ☐
Indicate by check mark whether the registrant has submitted electronically every Interactive Data File required to be submitted pursuant to Rule 405 of Regulation S-T (§ 232.405 of this chapter) during the preceding 12 months (or for such shorter period that the registrant was required to submit and post such files). Yes ☒ No ☐
Indicate by check mark whether the registrant is a large accelerated filer, an accelerated filer, a non-accelerated filer, a smaller reporting company, or an emerging growth company. See definitions of "large accelerated filer," "accelerated filer," "smaller reporting company," and "emerging growth company" in Rule 12b-2 of the Exchange Act.
| Large accelerated filer | ☒ | Accelerated filer | ☐ | ||||||||
| Non-accelerated filer | ☐ | Smaller reporting company | ☐ | ||||||||
| Emerging growth company | ☐ |
If an emerging growth company, indicate by check mark if the registrant has elected not to use the extended transition period for complying with any new or revised financial accounting standards provided pursuant to Section 13(a) of the Exchange Act. ☐
Indicate by check mark whether the registrant has filed a report on and attestation to its management’s assessment of the effectiveness of its internal control over financial reporting under Section 404(b) of the Sarbanes-Oxley Act (15 U.S.C. 7262(b)) by the registered public accounting firm that prepared or issued its audit report. ☒
Indicate by check mark whether the registrant is a shell company (as defined in Rule 12b-2 of the Exchange Act). Yes ☐ No ☒
The aggregate market value of the voting and non-voting common stock held by non-affiliates computed by reference to the price at which the common stock was last sold as of the last business day of the registrant's most recently completed second fiscal quarter was approximately $72.0 billion. As of February 17, 2022, a total of 90,721,039 shares of the registrant's common stock were outstanding.
DOCUMENTS INCORPORATED BY REFERENCE
Part III – Portions of the registrant's definitive proxy statement to be issued in conjunction with the registrant's 2022 Annual Meeting of Stockholders, which is expected to be filed not later than 120 days after the registrant's fiscal year ended December 31, 2021. Except as expressly incorporated by reference, the registrant's proxy statement shall not be deemed to be a part of this report on Form 10-K.
TABLE OF CONTENTS
PART I
Forward-Looking Statements
The words "Equinix", "we", "our", "ours", "us" and the "Company" refer to Equinix, Inc. All statements in this discussion that are not historical are forward-looking statements within the meaning of Section 21E of the Securities Exchange Act of 1934, as amended, including statements regarding Equinix's "expectations", "beliefs", "intentions", "strategies", "forecasts", "predictions", "plans" or the like. Such statements are based on management's current expectations and are subject to a number of factors and uncertainties that could cause actual results to differ materially from those described in the forward-looking statements. Equinix cautions investors that there can be no assurance that actual results or business conditions will not differ materially from those projected or suggested in such forward-looking statements as a result of various factors, including, but not limited to, the risk factors discussed in this Annual Report on Form 10-K. Equinix expressly disclaims any obligation or undertaking to release publicly any updates or revisions to any forward looking statements contained herein to reflect any change in Equinix's expectations with regard thereto or any change in events, conditions, or circumstances on which any such statements are based.
Summary of Risk Factors
Our business is subject to numerous risks and uncertainties that make an investment in our securities speculative or risky, any one of which could materially adversely affect our results of operations, financial condition or business. These risks include, but are not limited to, those listed below. This list is not complete, and should be read together with the section titled “Risk Factors” in this Annual Report on Form 10-K, as well as the other information in this Annual Report on Form 10-K and the other filings that we make with the U.S. Securities and Exchange Commission (the “SEC”).
Risks Related to Our Business and Our Operations
-
The ongoing COVID-19 pandemic could have a negative effect on our business, results of operations and financial condition.
-
We experienced an information technology security breach in the past and may be vulnerable to future security breaches, which could disrupt our operations and have a material adverse effect on our business, results of operation and financial condition.
-
Terrorist activity, or other acts of violence, including violence stemming from the current climate of political and economic uncertainty, could adversely impact our business.
-
Our offerings have a long sales cycle that may harm our revenue and results of operations.
-
Any failure of our physical infrastructure or negative impact on our ability to meet our obligations to our customers or damage to customer infrastructure within our IBX data centers, could lead to significant costs and disruptions that could reduce our revenue and harm our business reputation and financial condition.
-
We are currently making significant investments in our back-office information technology systems and processes. Difficulties from or disruptions to these efforts may interrupt our normal operations and adversely affect our business and results of operations.
-
The level of insurance coverage that we purchase may prove to be inadequate.
-
The use of high power density equipment may limit our ability to fully utilize our older IBX data centers.
-
If we are unable to implement our evolving organizational structure or if we are unable to recruit or retain key executives and qualified personnel, our business could be harmed.
-
We may not be able to compete successfully against current and future competitors.
-
If we cannot continue to develop, acquire, market and provide new offerings or enhancements to existing offerings that meet customer requirements and differentiate us from our competitors, our results of operations could suffer.
-
Our results of operations may fluctuate.
-
Our days sales outstanding ("DSO") may be negatively impacted by process and system upgrades and acquisitions.
-
We may incur goodwill and other intangible asset impairment charges, or impairment charges to our property, plant and equipment, which could result in a significant reduction to our earnings.
-
We have incurred substantial losses in the past and may incur additional losses in the future.
-
The failure to obtain favorable terms when we renew our IBX data center leases, or the failure to renew such leases, could harm our business and results of operations.
-
We depend on a number of third parties to provide internet connectivity to our IBX data centers; if connectivity is interrupted or terminated, our results of operations and cash flow could be materially and adversely affected.
-
We have government customers, which subjects us to risks including early termination, audits, investigations, sanctions and penalties.
-
Because we depend on the development and growth of a balanced customer base, including key magnet customers, failure to attract, grow and retain this base of customers could harm our business and results of operations.
-
Industry consolidation may have a negative impact on our business model.
-
Our business could be harmed by increased costs to procure power, prolonged power outages, shortages or capacity constraints.
Risks Related to Our Expansion Plans
-
Our construction of new IBX data centers or IBX data center expansions could involve significant risks to our business.
-
Acquisitions present many risks, and we may not realize the financial or strategic goals that were contemplated at the time of any transaction.
-
The anticipated benefits of our joint ventures may not be fully realized or take longer to realize than expected.
-
Joint venture investments could expose us to risks and liabilities in connection with the formation of the new joint ventures, the operation of such joint ventures without sole decision-making authority, and our reliance on joint venture partners who may have economic and business interests that are inconsistent with our business interests.
-
If we cannot effectively manage our international operations, and successfully implement our international expansion plans, or comply with evolving laws and regulations, our revenues may not increase, and our business and results of operations would be harmed.
-
We are continuing to invest in our expansion efforts but may not have sufficient customer demand in the future to realize expected returns on these investments.
Risks Related to Our Capital Needs and Capital Strategy
-
Our substantial debt could adversely affect our cash flows and limit our flexibility to raise additional capital.
-
Sales or issuances of shares of our common stock may adversely affect the market price of our common stock.
-
If we are not able to generate sufficient operating cash flows or obtain external financing, our ability to fund incremental expansion plans may be limited.
-
Fluctuations in foreign currency exchange rates in the markets in which we operate internationally could harm our results of operations.
-
Our derivative transactions expose us to counterparty credit risk.
Risks Related to Environmental Laws and Climate Change Impacts
-
Environmental regulations may impose upon us new or unexpected costs.
-
Our business may be adversely affected by climate change and responses to it.
-
We may fail to achieve our environmental goals which may adversely affect public perception of our business and affect our relationship with our customers and our stockholders.
Risks Related to Certain Regulations and Laws, Including Tax Laws
-
Changes in U.S. or foreign tax laws, regulations, or interpretations thereof, including changes to tax rates, may adversely affect our financial statements and cash taxes.
-
Government regulation or failure to comply with laws and regulations may adversely affect our business.
Risks Related to Our Taxation as a REIT
- We have a number of risks related to our qualification as a real estate investment trust for federal income tax purposes ("REIT"), including the risk that we may not be able to maintain our qualification as a REIT which could expose us to substantial corporate income tax and have a materially adverse effect on our business, financial condition, and results of operations.
Item 1. Business
Overview: Powering the World’s Digital Leaders
Equinix is the world's digital infrastructure companyTM. Digital leaders harness our trusted platform to bring together and interconnect the foundational infrastructure that powers their success. We enable our customers to access all the right places, partners and possibilities they need to accelerate their advantage. Platform Equinix® combines a global footprint of International Business Exchange™ ("IBX®") data centers in the Americas ("AMER"), Asia-Pacific ("APAC"), and Europe, the Middle East and Africa ("EMEA") regions, interconnection solutions, edge services, unique business and digital ecosystems and expert consulting and support. Equinix was incorporated on June 22, 1998 as a Delaware corporation and operates as a REIT for federal income tax purposes.
Al Avery and Jay Adelson founded Equinix as a vendor-neutral multi-tenant data center ("MTDC") provider where competing networks could connect and share data traffic to help scale the rapid growth of the early internet. The company’s name, Equinix (composed from the words "equality", "neutrality" and "internet exchange"), reflects that vision. The founders also believed they not only had the opportunity but also the responsibility to create a company that would be the steward of some of the most important digital infrastructure assets in the world. Two decades later, we have expanded upon that vision to build Platform Equinix, with unmatched scale and reach.
Our interconnected data centers around the world allow our customers to bring together and interconnect the infrastructure they need to fast-track their digital advantage. With Equinix, they can scale with agility, speed the launch of digital services, deliver world-class experiences and multiply their value. We enable them to differentiate by distributing infrastructure and removing the distance between clouds, users and applications in order to reduce latency and deliver a superior customer, partner and employee experience. The Equinix global platform, and the quality of our IBX data centers, interconnection offerings and edge services, have enabled us to establish a critical mass of customers. As more customers choose Platform Equinix for bandwidth cost and performance reasons, it benefits their suppliers and business partners to colocate in the same data centers and connect directly with each other. This adjacency creates a network effect that attracts new customers, continuously compounds our existing customers' value and enables them to capture further economic and performance benefits from our offerings.
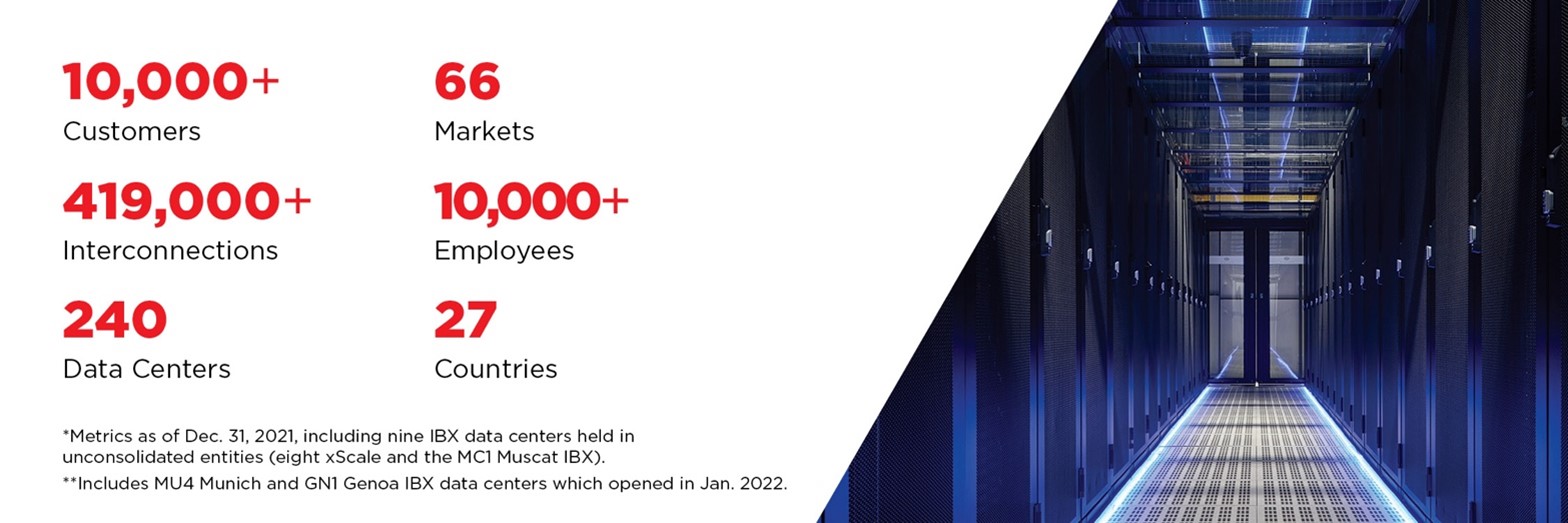
In 2021, we opened nine new IBX data centers, opened six new xScaleTM data centers via our joint ventures, and entered three new markets resulting in an increase in our total number of IBX and xScale data center facilities to 240, which includes the MU4 and GN1 data centers which opened in January 2022. 2021 highlights include:
-
New data center openings included nine new IBX sites in the following metros: Bordeaux, Frankfurt, Genoa, Milan, Munich, Osaka, Perth, Silicon Valley and Singapore, with Bordeaux and Genoa being new market entries.
-
Six additional xScale sites opened in 2021 in Frankfurt, London, Osaka, Paris, Sao Paulo and Tokyo, bringing the total number of xScale data centers to eight. xScale data centers serve the needs of the growing hyperscale data center market, including the world's largest cloud service providers, and are engineered to meet the technical and operational requirements and price points of core hyperscale workload deployments. xScale data centers also offer access to our comprehensive suite of interconnection and edge services that tie into the hyperscale companies' existing access points at Equinix, thereby increasing the speed of connectivity to their existing and future enterprise customers. In xScale sites, hyperscale companies can consolidate core and access point deployments into one global provider to streamline and simplify their growth.
-
In December, we announced our expansion into Africa through the planned acquisition of MainOne, a leading West African data center and connectivity solutions provider, with presence in Nigeria, Ghana and Côte d'Ivoire. The transaction has an enterprise value of $320 million and marks the first step in Equinix's long-term strategy to become a leading African carrier neutral digital infrastructure company. The acquisition is expected to close in Q2 of 2022, subject to the satisfaction of customary closing conditions including the requisite regulatory approvals.
*•*In September, we announced that we extended Platform Equinix into the strategic Indian market, following the completion of the acquisition of the India operations of GPX Global Systems, Inc. ("GPX India"). The $170.5 million transaction includes a fiber-connected campus in Mumbai with two data centers. The expansion into India is intended to unlock opportunities for Indian businesses expanding internationally and for multinational corporations pursuing growth and innovation in the Indian market.
-
In June, we entered into an agreement to form another joint venture in the form of a limited liability partnership with GIC, Singapore’s sovereign wealth fund, to develop and operate additional xScaleTM data centers in Europe and the Americas (the “EMEA 2 Joint Venture”). In October, we also entered into an agreement to form a joint venture in the form of a limited liability partnership with PGIM Real Estate ("PGIM"), to develop and operate xScale data centers in Asia-Pacific (the "Asia-Pacific 2 Joint Venture"). Combined with our existing xScale joint ventures in Europe, Asia-Pacific and the Americas, these joint ventures will bring our global xScale data center portfolio to more than $7.5 billion across 34 facilities when completed and fully constructed.
-
In June, we opened our first data center in Bordeaux, France ("BX1"). With direct fiber links to Equinix's International Business Exchange™ (IBX®) sites in Paris, this new facility will provide global businesses and local authorities located in the region with the ability to connect directly and securely to the world's digital economy, via comprehensive digital ecosystems. Increasing connectivity opportunities further, BX1 will provide a landing hub for the new submarine cable, AMITIE, which will link France to the United States and Great Britain, creating a new European gateway for data traffic between the United States and Europe.
-
In March, we announced that Equinix Metal™ had significantly advanced its global scale, features and ability to enable as a service consumption of the full value of Platform Equinix®. With these new and enhanced capabilities, Equinix Metal customers can consume interconnected infrastructure with the control of physical hardware and the low overhead and developer experience of the cloud, helping them move faster in today's competitive environment. This announcement also included the expanded availability of Equinix Metal in 18 global metros, the addition of new networking features to support hybrid multicloud architectures, the certification of new software integrations on Equinix Metal and the launch of a managed appliance as a service solution.
Industry Trends: Large-scale global trends are driving a digital-first strategy
Digital transformation is changing where and how businesses deploy and deliver IT services to employees and is creating new digital business models for partners and customers. The convergence of these global trends and the impact of the ongoing COVID-19 pandemic have created additional pressure for many companies to transform. The collective influence of these trends is driving complexity and risk that must be addressed in multiple locations for companies to effectively compete in the global digital economy. These trends include:
-
The Digital services trend** is the continued digitizing of the back office to support digital business throughput. By 2022, 65% of global GDP will be digitalized, and most organizations will realize greater value by combining digitization and sustainability. This trend forces the need for a digital infrastructure optimized for proximity to, and interconnection with, networks and clouds. This in turn enables digital development with elastic scale and has contributed to a 3x increase in the multicloud, multiregion adoption rate over the last two years as businesses scale the digital core.
-
The Digital participation trend** is digitizing trade and accessing digital marketplaces (digital B2B commerce). By 2025, 75% of organization leaders will leverage digital platforms and ecosystem capabilities to adapt their value chains to new markets, industries and ecosystems. This forces the need for organizations to interconnect digital infrastructure with research communities, supply chains and marketplaces, which enables composable business models. The fifth annual Global Interconnection Index ("GXI"), a market study published by Equinix, shows that SaaS is now the largest IT spend line item as companies move to public and private SaaS alternatives. Organizations that fail to leverage cloud, SaaS or partner digital ecosystems have shown two to three times slower growth over the past two years.
-
The Digital proximity trend** means digitizing the front office for localized and personalized delivery—to customers, employees and operations where business happens, as well as digitizing the physical world for the physical infrastructure and operations intelligence needed to optimize commercial and environmental impact. Data shows that shifts in population and commerce centers will result in over 50% of new infrastructure being local by 2023, which will require a digital infrastructure in proximity to, and interconnecting, experiences, things (IoT) and intelligent operations.
These trends are accelerating the need for companies like Equinix who can provide a secure, agile global business platform that leverages digital interconnection—or private data exchange—to deliver real-time interactions around the world.
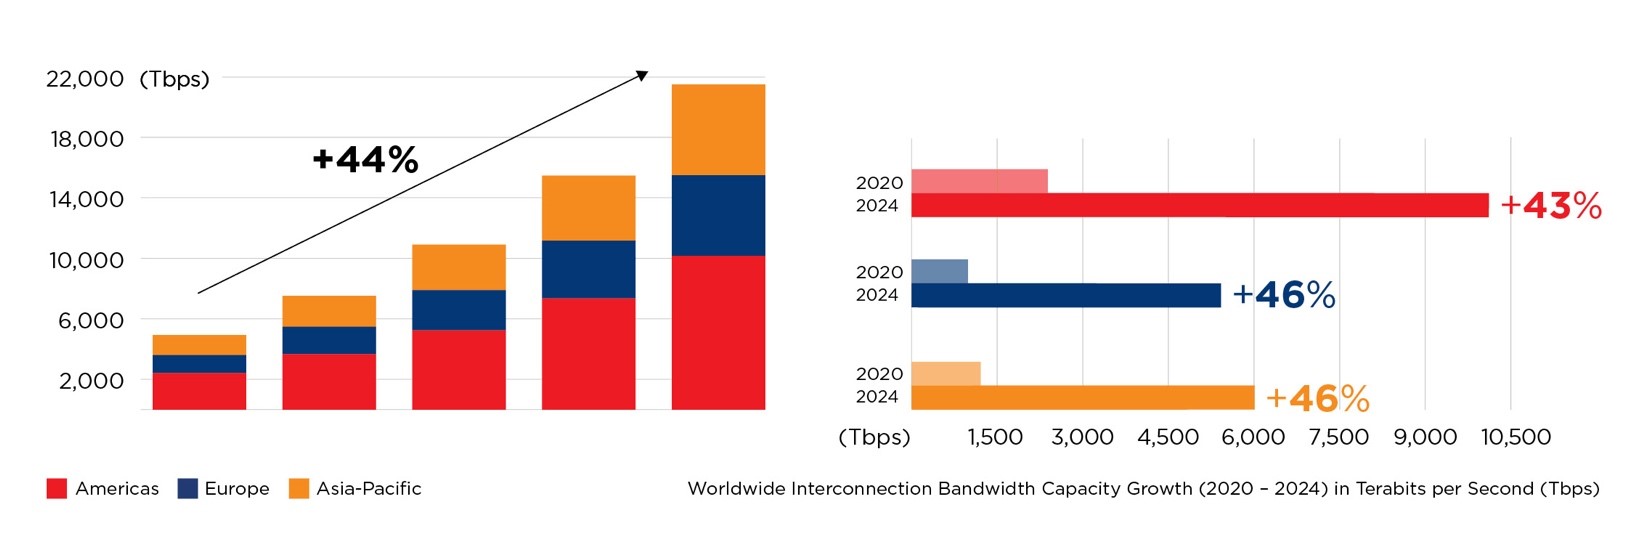
As part of their digital transformation, businesses in most industries are shifting their centralized IT infrastructures to the edge to bring digital services closer to users for better performance, which has become a significant driver of digital business value. To realize the full potential of the edge, IT organizations require greater interconnection bandwidth. Interconnection bandwidth is defined as the total capacity provisioned to privately and directly exchange traffic, with a diverse set of partners and providers, at distributed IT exchange points inside carrier-neutral colocation data centers. Private interconnection capacity between businesses, as reported in the GXI, is anticipated to grow at a compound annual growth rate of 44% by 2024, reaching 21,485+ terabits per second of data exchanged annually.
Worldwide Interconnection Bandwidth Capacity Growth (2020 - 2024) in Terabits per Second (Tbps)
Source: GXI Volume 5
Equinix Business Proposition: To be the platform where the world comes together, enabling the innovations that enrich our work, life and planet
In 2021, we continued to build new data center, interconnection and edge services capabilities to further our vision to power the world’s digital leaders. On Platform Equinix, digital leaders can reach the most strategic global markets with the largest ecosystem of digital partners, with infrastructure that assembles and deploys virtually in minutes. We offer a comprehensive, integrated suite of data center, interconnection, edge services and products to over 10,000 enterprise and service provider customers worldwide.
The following are the leading revenue generating product and other offerings that collectively make up Platform Equinix:
Data Center Solutions
Our global, state-of-the-art data centers meet strict standards of security, reliability, certification and sustainability. Offerings in these data centers are typically billed based on the space and power a customer consumes, are delivered under a fixed duration contract and generate monthly recurring revenue ("MRR").
-
International Business Exchange****TM** Data Centers consist of more than 230 IBX vendor-neutral colocation data centers worldwide, providing our customers with secure, reliable and robust environments (including space and power) that are necessary to aggregate and distribute information and connect digital and business ecosystems globally. IBX data centers provide access to vital ecosystems where enterprises, network, cloud and SaaS providers, and business partners, directly and securely interconnect to each other.
-
xScale****TM** Data Centers are designed to serve the unique core workload deployment needs of a targeted group of hyperscale companies, which include the world's largest cloud service providers. With xScale data
centers, hyperscale customers add to their core hyperscale data center deployments and existing customer access points at Equinix, allowing streamlined expansion with a single global vendor.
- IBX SmartView** is a fully integrated monitoring software which provides customers visibility into the operating data relevant to their specific Equinix footprint as if they were in-house. The software provides online access to real-time environmental and operating data through the Equinix Customer Portal or API integrations. With real-time alerts and configurable reporting, IBX SmartView allows customers to maintain their IBX operations and plan for future growth.
Interconnection Solutions
Our interconnection solutions connect businesses directly, securely and dynamically within and between our data centers across our global platform. Our interconnection solutions are typically billed based on the outbound connections from a customer and generate MRR.
-
Equinix Fabric™** provides secure, on-demand, software-defined interconnection. Built specifically for digital infrastructure, Equinix Fabric enables businesses to connect globally to their choice of thousands of networking, storage, compute and application service providers in the industry’s largest infrastructure ecosystem. As the foundation of Platform Equinix’s interconnection capability, Equinix Fabric enables customers to quickly and easily connect their physical and virtual digital infrastructures.
-
Cross Connects** provide a point-to-point cable link between two Equinix customers in the same IBX data center. Cross Connects deliver fast, convenient, affordable and highly reliable connectivity and data exchange with business partners and service providers within the Equinix ecosystem.
-
Equinix Internet Exchange™** enables networks, content providers and large enterprises to exchange internet traffic through the largest global peering solution. Service providers can aggregate traffic to multiple counterparties, called peers, on one physical port and handle multiple small peers while moving high-traffic peers to private interconnections. This reduces latency for end-users when accessing content and applications.
-
Equinix Connect** is an agile, scalable, resilient and high performing internet access solution. With at least two upstream ISPs in each market, Equinix Connect offers the resiliency that organizations demand and direct connections to major content destinations, resulting in superior performance. It provides the convenience of a one-stop shop and the flexibility required to connect to the internet as a primary or secondary access solution. Available globally in more than 40 markets, Equinix Connect allows businesses to grow as their needs grow with scalable bandwidth options to meet their emerging usage requirements.
-
Fiber Connect** provides dark fiber links between customers and partners in multiple Equinix IBX data centers. Fiber Connect enables fast, convenient and affordable integration with partners, customers and service providers across the global Equinix digital ecosystem. It supports highly reliable, extremely low-latency communication, system integration and data exchange.
Edge Services
Our edge services help businesses rapidly deploy as-a-service networking, security and hardware across our global data center footprint - as an alternative to buying, owning and managing the physical infrastructure. Our edge services are typically billed based on the number of instances and the capacity used by a customer and generate MRR.
-
Network Edge** allows customers to modernize networks within minutes, by deploying network functions virtualization ("NFV") from multiple vendors across Equinix metros. Companies can select, deploy and connect virtual network services at the edge quickly, with no additional hardware requirements.
-
Equinix Metal™** allows enterprises, SaaS companies and digital service providers to provision interconnected bare metal resources in minutes instead of months, while reducing the capital expenditures and operational requirements of owning hardware. They can also reduce cloud costs while retaining the flexibility and operational expenditures of cloud services via on demand, reserved or spot market capacity in Equinix’s global data centers using the Equinix Metal portal or DevOps-friendly APIs and integrations.
-
Equinix Precision Time™** provides secure Precision Time Protocol ("PTP") and Network Time Protocol ("NTP") Time as a service for distributed enterprise applications on Platform Equinix®. The service uses redundant and strategically located equipment and the high-performance network backbone of Equinix
Fabric™ to deliver secure, reliable and precise time synchronization. Customers gain access to the product portal, allowing them to provision, manage and monitor their service.
Colocation Offerings
Equinix offers a variety of colocation offerings designed to speed and streamline digital transformation and data center deployments for its customers. These services are typically billed based on consumption and generate non-recurring revenue ("NRR").
-
Equinix Smart Hands** provides around-the-clock, on-site, operational support service for remote management, installation and troubleshooting of customer data center equipment. Using Equinix IBX data center technicians, Smart Hands allows customers to manage and outsource their business operations and maximize uptime whether from within an IBX data center or from a remote location.
-
Equinix Infrastructure Services** (EIS) provides customers with a one-stop shop for data center installation, migration and equipment procurement. With proven practices developed over many years of successfully building, migrating and optimizing our customers’ data center needs, EIS services lend expertise to address larger, more complex data center jobs including installation and implementation of new builds, planned migrations, structured cabling, labelling and documentation, procurement recommendations and coordination, and secure de-installation.
Competition
While a large number of enterprises and service providers, such as hyperscale cloud service providers, own their own data centers, we believe the industry is shifting away from single-tenant solutions to outsourcing some or all of their IT housing and interconnection requirements to third party facilities, such as those operated by us.
Historically, the outsourcing market was served by large telecommunications carriers who bundled their products and services with their colocation offerings. The data center market landscape has evolved to include private and vendor-neutral MTDC providers, hyperscale cloud providers, managed infrastructure and application hosting providers, and systems integrators. It is estimated that Equinix is one of more than 2,200 companies that provide MTDC offerings around the world. The global MTDC market is highly fragmented. Each of these data center solutions providers can bundle various colocation, interconnection and network offerings and outsourced IT infrastructure solutions. We believe that this outsourcing trend has accelerated and is likely to continue to accelerate in the coming years, especially in light of the movement to digital business as a result of the ongoing COVID-19 pandemic.
Equinix is differentiated in this market by being able to offer customers a global platform that reaches 27 countries and contains the industry’s largest and most active ecosystem of partners in our sites. This ecosystem creates a “network effect” which improves performance and lowers cost for our customers and is a significant source of competitive advantage for Equinix.
Customers
Our customers include telecommunications carriers, mobile and other network services providers, cloud and IT services providers, digital media and content providers, financial services companies, and global enterprise ecosystems in various industries. We provide each company access to a choice of business partners and solutions based on their colocation, interconnection and managed IT service needs, and delivered 99.999% operational uptime across our global data centers in 2021. As of December 31, 2021, we had over 10,000 customers worldwide. No one customer made up 10% or more of our total business revenues for the year ended December 31, 2021.
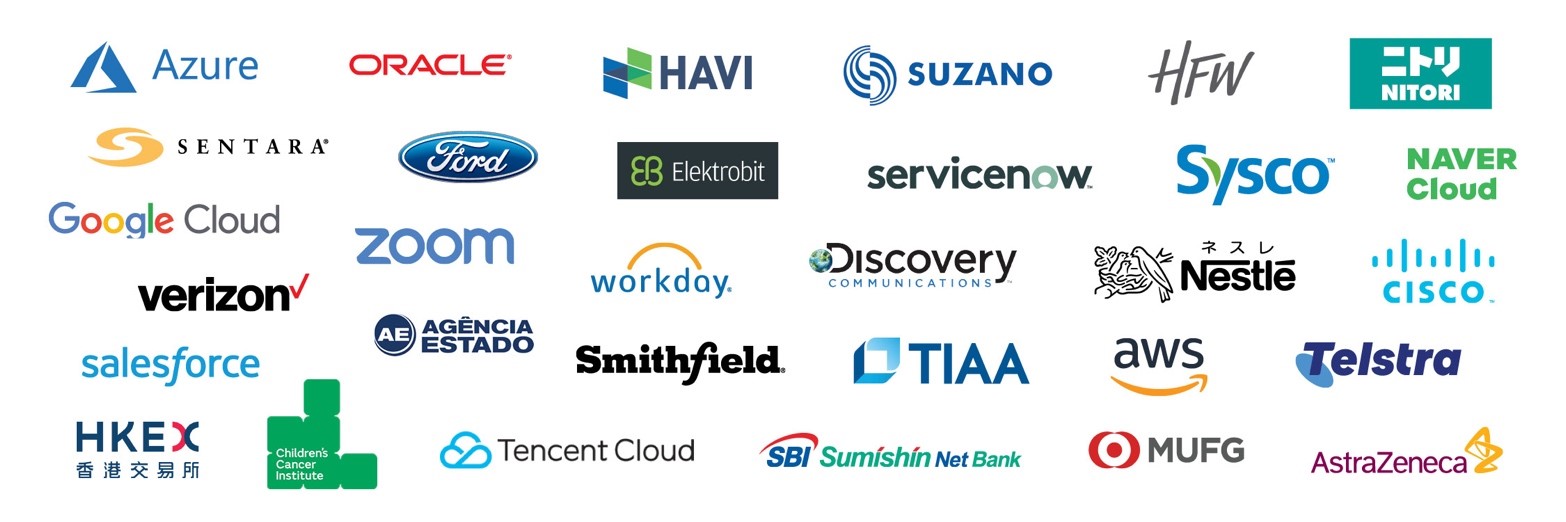
The following companies represent some of our leading customers and partners:
We serve our customers with a direct sales force and channel marketing program. We organize our sales force by customer type, as well as by establishing a sales presence in diverse geographic regions, which enables efficient servicing of the customer base from a network of regional offices. We also support our customers with a global customer care organization.
Human Capital
As of December 31, 2021, we had 10,944 employees worldwide with 5,056 based in the Americas, 3,611 based in EMEA and 2,277 based in APAC. Of those employees, 4,693 employees were in engineering and operations, 1,855 employees were in sales and marketing and 4,396 employees were in management, finance and administration. As of December 31, 2021, approximately 74% of our workforce identified as men and approximately 25% identified as women. Women's representation in leadership (VP and above) increased from 28% to 31% year-over-year.
At Equinix, we strive to build a culture where every employee, every day, can say “I’m Safe, I Belong and I Matter” and where our workforce, at all levels, reflects and represents the communities in which we operate. Our objective is to continue to make our culture a critical competitive advantage, engaging every leader and every employee in the process. To ensure we are upholding our core corporate values and making progress towards our aspirational goals, we monitor employee satisfaction through a quarterly pulse survey, which is one of our listening mechanisms. In 2021, employee satisfaction scores ranged between 82 - 84 out of a 100 each quarter. We recognize that attracting, developing and retaining talent at all levels is vital to continuing our success and offer industry competitive compensation and benefits, along with development opportunities to help every employee achieve their full potential. The virtual recruiting environment necessitated by the global pandemic has created new opportunities for Equinix to find talent. We have benefited from new talent sourcing programs such as our global new-to-career programs as well as a pathways program to enable career transition for veterans and women returning to the workforce. In 2021, we continued to enhance our portfolio of development programs for our employees and introduced a system-enabled approach to goal setting and development planning to drive objectivity and achievement. We also continued to offer development tools and opportunities to our employees such as online learning, manager training, professional coaching and 360 degree assessments for eligible employees.
We are integrating a focus on diversity, inclusion and belonging ("DIB") into every aspect of how we run our business. In 2020, we embarked on a multi-year DIB strategy with governance through a DIB Council chaired by our CEO and CHRO, and in partnership with our Sustainability Program Office, that oversees our progress on environmental, social and governance ("ESG") matters. Our DIB strategy focuses on attracting, retaining and developing a diverse, global workforce; building leadership capability; and empowering our people to bring DIB to life. We are focused on creating multiple pathways to reach new talent from diverse communities. In 2021, we forged partnerships and invested in tools and systems to grow and support our inclusive hiring practices and made updates to our recruitment marketing to reach a wider candidate pool more effectively. We also embedded diversity and inclusive competencies and behaviors in our leadership profiles and added coaching tools as well as manager training on leading inclusive teams to our development program. Our Equinix Employee-led Connection Networks ("EECNs") are integral to our DIB strategy and play an important role in creating belonging and advocating for the needs and goals of communities with common identities, cultures or backgrounds. Each of our nine EECNs represents an identity/community that has faced historical discrimination or shares unique challenges. We recognize that creating the best workplace and culture we can requires a global effort with localized awareness and approaches. Late in 2020, we launched WeAreEquinix employee teams empowered to create, localize and promote purpose, inclusion and belonging for their locations across the world. Through live and virtual events, campaigns, and collaboration with the business, these volunteer leaders bring local opportunities to engage in the following areas: Wellbeing, Green and Sustainability, Community Impact, Fun and Creativity, Diversity, Inclusion and Belonging, and Employee Networks. We currently have WeAreEquinix teams in 15 locations.
In 2021, we launched our “I Matter” initiative to enable employees to voluntarily self-identify by adding their data across dimensions of diversity, including race/ethnicity, sexual orientation, gender identity, and disability in accordance with country regulations so that we may better understand the global employee experience.
Equinix representatives have joined the G100 Talent Consortium Task Force on Racial Inequity in Business to consider core inequity issues, including anti-racism, bias, and hiring and promotability practices, in order to develop tangible best practices that companies can use as guide rails to increase representation and career mobility for black, indigenous and people of color ("BIPOC") employees. In 2021, we hosted a Days of Understanding event as part of an initiative of CEO ACT!ON, a pledge Equinix has taken along with hundreds of other companies to embrace difference in our organizations, educate our people and build more inclusive cultures inside and outside of our workplaces. As part of this partnership, three Equinix employees joined ACT!ON’s inaugural two-year fellowship program focused on identifying, developing, and promoting scalable and sustainable policies and corporate best practices that address systemic racism and social injustice to improve societal wellbeing. Equinix also joined the Alliance for Global Inclusion, a coalition of global organizations working together to bring inclusivity and full equity to the workplace. Finally, in 2021 Equinix partnered with McKinsey to provide leadership development to our Black/African American leaders through the Black Leadership Academy.
Our Community Impact program promotes connection and belonging, and enables employees to give back, with the support of Equinix, to the communities in which we work and live. In 2021, our employees volunteered at approximately 2,230 nonprofits worldwide.
We believe our commitment to the highest standards of honesty, integrity and ethical behavior differentiates our business as much as our technology. We promote these high standards through a number of policies including the Equinix Code of Business Conduct. All employees are required to complete trainings on ethics and the company’s anti-bribery and corruption policies. In addition, we maintain a confidential ethics helpline where employees are encouraged to speak up if they have any questions or concerns that our code is being violated. We have a zero-tolerance, non-retaliation policy that protects our employees when they speak up.
In a year again disrupted by the unprecedented global pandemic caused by COVID-19, we continued a number of precautionary measures in line with our business continuity and pandemic plans to minimize the risk of operational impacts and to protect the health and safety of employees, customers, partners and our communities. During the pandemic, we have focused on a careful, safe and responsible opening of our offices based on guidance from health experts and other leaders from around the world. As we look forward to the future of work, and more importantly amplifying Equinix’s vibrant culture, we are providing flexible, hybrid work opportunities in many roles, enhanced collaboration technologies for everyone, and activity-based workspaces at home or onsite. We recognize that the new normal will require changing behaviors. As such, we are providing learning opportunities and best practices to ensure our meetings, events and work sessions are inclusive and equitable for virtual and in-person participation. Employee well-being has been central to these efforts, driven globally through offerings such as health programs, ergonomic support, technology reimbursements, and wellness days.
We believe that all of these programs and initiatives support our human capital goals, align with our company culture, and increase employee satisfaction.

Sustainability
At Equinix, our Future First sustainability strategy rallies our people and partners to envision a better future and then do what it takes to make it happen. As the world’s digital infrastructure leader, we have the responsibility to harness the power of technology to create a more accessible, equitable and sustainable future. The ESG initiatives comprising our Future First strategy focus on the material issues that have the greatest impact on our stakeholders and our business. We continue to progress on our sustainability goals and look to build a business and world that reflects our purpose to bring the world together on our platform to create the innovations that will enrich our work, life and planet. We document our ESG progress in our Annual Report as well as in the annual Corporate Sustainability Report located on our sustainability website: sustainability.equinix.com.
In 2021, we committed to becoming climate neutral across our global operations by 2030 and set a validated science-based target (“SBT”) for emissions reduction across our global operations and supply chain. Our climate commitments are a critical step to ensure that we continue to advance investments and innovations to reduce greenhouse gas ("GHG") emissions and keep global warming to 1.5 degrees Celsius in alignment with the Paris Climate Agreement.
As a part of our Future First sustainability strategy, we published an Environmental Sustainability and Global Climate Change Policy in 2021 to detail our approach and practices related to the environment, climate change, resource efficiency and reporting. In alignment with our strategy and policy, we are also evaluating our material climate change risks and opportunities based on the recommendations of the Task Force on Climate Related Financial Disclosures (“TCFD”). We are continuing our work to embed climate change risk management into our business where relevant.
Environmental Performance
Equinix was the first data center company to commit to a long-term goal of 100% renewable energy across our global portfolio. We use local renewable energy sources where possible, seek new or recently built renewable sources and advocate for favorable renewable energy policies. In the U.S., we purchase more than 2.3 million megawatt-hours (MWh) of green power annually from a portfolio of renewable energy projects, including 225 MW of wind power under long-term virtual power purchase agreements (VPPAs) located in Texas and Oklahoma. In 2020, over 90% of our global electricity consumption, and 100% of U.S. electricity consumption, was covered by renewable energy sources.
We are committed to transparently measuring and reporting our global carbon footprint across direct (Scope 1), indirect energy (Scope 2) and indirect value chain (Scope 3) emissions. Since 2015, we have achieved a 50% reduction in GHG emissions on an absolute basis (Scope 1 and Scope 2 market-based metric tons of carbon dioxide-equivalent (mtCO2e)), even as the company doubled its footprint in both energy consumption and number of sites. In 2021, CDP, a global non-governmental organization dedicated to helping investors and companies measure and manage their climate risks, recognized our commitments, actions and progress on climate change.
We received an 'A-' CDP leadership score for climate action and annual disclosures within the CDP Climate Change survey.
We are leveraging technology and innovation to encourage commercialization of solutions that will enable the “Data Center of the Future”. To support our ongoing sustainability initiatives and commitment to innovation, we issued green bonds totaling $1.4 billion in 2020 and an additional $2.3 billion in 2021. Our Green Finance Framework aligns our sustainability commitments with our long-term financing needs and highlights our pipeline of green projects and data center innovations. In 2021, we allocated $2.9 billion in net proceeds to finance or refinance, in whole or in part, ongoing and new projects in categories of green buildings, renewable energy and energy efficiency.
We are committed to advancing environmental progress across other areas of our operations. While energy usage, specifically electricity, is our largest environmental impact, to address the growing importance of water within our operations, we launched a Sustainable Water Management Program in 2021. We consider the consumption of water in the design and operation of our facilities and are developing a coordinated global approach to water measurement and management. Through our efforts to establish the European Climate-Neutral Data Centre Operator Pact in 2021, Equinix and the EU data center industry have also committed to advancing initiatives beyond renewable energy and energy efficiency, including water efficiency, waste reduction, and circular economy principles.
Sustainability Accounting Standards Board ("SASB") Disclosures
SASB published the Sustainability Accounting Standard ("Standard") for the Real Estate Industry in October 2018. We have aligned our SASB disclosures with the Real Estate Standard to enhance corporate disclosure around ESG performance. In our comprehensive disclosures in our annual Corporate Sustainability Report we also document our progress against metrics as outlined in other frameworks such as the Global Reporting Initiative ("GRI"), UN Sustainable Development Goals ("SDGs") and TCFD. The following tables detail our energy metrics, aligned with the SASB Real Estate Standard. We intend to expand our reporting around the Real Estate Standard in the coming years.
The following metrics represent our colocation facilities performance in the calendar years specified. Energy, renewable energy and GHG emissions are independently assured to ISO 14064-3:2006 Standards for the quantification and reporting of GHG emissions (Scope 1, 2 and 3). Calendar year data for 2021 will become available in Q2 2022 and published in our annual Corporate Sustainability Report located on our sustainability website.
Energy Management: Energy Consumption
| Year | Energy Consumption Data as a % of Floor Area | Total Energy Consumed by Portfolio Area with Data Coverage (MWh)****(1) | Like-for-Like Change in Energy Consumption of Portfolio Area with Data Coverage (MWh)****(2) | Grid Electricity Consumption as a % of Energy Consumption | Energy Consumption from Renewable Sources**(3)** (kWh) | Renewable Energy as a % of Energy Consumption (4) | Like-for-Like Change in Energy Consumption from Renewable Sources of Portfolio Area with Data Coverage (MWh) (2) (3) | Renewable Energy as a % of Electricity Consumption | ||||||||||||||||||
| 2019**(5)(6)** | 94.9% | 5,711,000 | N/A | 94.4% | 5,168,000 | 91% | N/A | 91% | ||||||||||||||||||
| 2020**(7)(8)** | 95.8% | 6,432,000 | 6.2% | 93.2% | 5,695,000 | 89% | 5.3% | 91% |
(1)The scope of energy includes: energy used onsite (natural gas, diesel, chilled water), energy procured (purchased electricity, electric power from fuel cells under power purchase agreements).
(2)Like-for-like computed for stabilized asset list for the overlapping list of sites designated as stabilized in 2019 and 2020.
(3)Excludes renewable energy inherently supplied by the standard utility grid mix. Equinix buys renewable energy for the entire electricity consumption of sites including customer and overhead load. The instruments used include: Renewable Energy Certificates (RECs) from Virtual Power Purchase Agreements (VPPAs), RECs, International RECs (I-RECs), Guarantees of Origin (GOOs) and Renewable Energy Guarantees of Origin (REGOs) from suppliers, green tariffs and bundled contracts.
(4)Equinix's global renewable energy percentage reported for RE100 and CDP was 91%, which is comprised of 5,844 GWh of renewables out of 6,427 GWh of electric power consumption. The discrepancy in the totals arises from non-IBX data center sites' energy usage and non-electric power energy consumption
(5)2019 portfolio coverage excludes xScaleTM sites: PA8x, LD13x.
(6)2019 portfolio coverage excludes reseller sites: DA99, JK1, OS99, SH1.
(7)Recently constructed or acquired sites for which no utility data is available are excluded from the 2020 SASB metrics reporting boundary. These include certain data centers in AMER (DC21) and EMEA (MC1). Reseller sites are also excluded in the energy metrics (OS99, SH1).
(8)2020 portfolio coverage excludes xScaleTM sites: LD10x, LD13x, FR11x, SP5x, PA8x.
Energy Management: Green Building Ratings
Our environmental efforts aim to deliver meaningful and measurable progress against sustainability goals that positively impact our customers, partners, investors and employees. Our data centers are designed with high operational standards and energy efficiency in mind. Our data centers are planned holistically to incorporate the needs of our communities and we aim to minimize the use of all resources in our operations. We evaluate cost-efficient opportunities to enhance energy efficiency and buy renewable energy for existing or acquired sites.
We are protecting our planet's resources by pioneering green data center innovations and building and operating energy-efficient data centers around the world. Our Energy Efficiency Center of Excellence is driving a global approach to cooling our existing data centers more efficiently. The program engages customers to manage their implementations more sustainably at our facilities, leading to overall improved site efficiencies.
We certify our data centers to numerous green buildings and energy management certifications and schemes. These include USGBC LEED green buildings certifications, ISO 14001:2015 Environmental Management Standard, ISO 50001:2011 Energy Management Standard, BCA Green Mark, U.S. EPA Energy Star for Data Centers and others.
Data centers receiving green building ratings in 2020 and 2021 covered 1.1 million gross sq. ft. While we have additional certifications that are pending final submissions, the following new sites received ratings in 2020 or 2021:
| Data Center | Metro Area | Rating Scheme | Level Achieved | ||||||||
| DA11 | Dallas, Texas | LEED | Silver | ||||||||
| DC15 | Washington, DC | Green Globes | 3 Globes | ||||||||
| SV11 | Silicon Valley, California | LEED | Silver | ||||||||
| SG4 | Singapore | BCA Green Mark | GoldPlus | ||||||||
| SG5 | Singapore | LEED | Pending | ||||||||
| ML5 | Milan, Italy | LEED | Pending |
In 2021, we had 16.8 million gross sq. ft., or 71% of our global footprint, in operation with green buildings and energy management certifications. Within the U.S., we had 3.7 million gross sq. ft., or 43% of our footprint, under certification, including 0.3 million of gross sq. ft., or 3% of U.S. footprint, having achieved U.S. EPA Energy Star for Data Centers. We are currently evaluating enrolling additional sites in the Energy Star program. We disclose these and other site-level details about our data centers on our sustainability website.
| Year | Total Gross sq. ft. (million) | Area of Eligible Portfolio with Green Building Rating (million sq. ft.)****(1) | Eligible Portfolio with Green Building Rating (%) | ||||||||
| Global Total through 2021 | 23.8 | 16.8 | 71% | ||||||||
| U.S. Total through 2021 | 8.5 | 3.7 (LEED and Energy Star) 0.3 (Energy Star)(2) | 43% (LEED and Energy Star) 3% (Energy Star) |
(1)Ratings included in our totals: ISO 50001 Energy Management, ISO 14001 Environmental Management, LEED green buildings certifications, U.S. Environmental Protection Agency Energy Star for Data Centers, BCA Green Mark, NABERS and Green Globes.
(2)We are currently evaluating our approach to U.S. EPA Energy Star for Data Centers. In 2020, two sites received Energy Star for Data Centers recognition, representing 3% of our U.S. portfolio. In contrast, our U.S. portfolio has 18 LEED-certified data centers or 32% of the U.S. portfolio by gross square footage.
Our Business Segment Financial Information
We currently operate in three reportable segments comprised of our Americas, EMEA and Asia-Pacific geographic regions. Information attributable to each of our reportable segments is set forth in Note 17 within the Consolidated Financial Statements.
Available Information
Equinix owns and maintains intellectual property in the form of trademarks, patents, application programming interfaces, customer portals and a variety of products and other offerings.
We were incorporated in Delaware in June 1998. We are required to file reports under the Securities Exchange Act of 1934, as amended, with the Securities and Exchange Commission ("SEC"). The SEC maintains an internet website at http://www.sec.gov that contains reports, proxy and information statements and other information.
You may also obtain copies of our annual reports on Form 10-K, our quarterly reports on Form 10-Q and our current reports on Form 8-K, and any amendments to such reports, free of charge by visiting the Investor Relations page on our website, www.equinix.com. These reports are available as soon as reasonably practical after we file them with the SEC. Information contained on or accessible through our website is not part of this Annual Report on Form 10-K.
Item 1A. Risk Factors
In addition to the other information contained in this report, the following risk factors should be considered carefully in evaluating our business:
Risk Factors
Risks Related to Our Business and Our Operations
The ongoing COVID-19 pandemic could have a negative effect on our business, results of operations and financial condition.
We have continuously monitored our global operations as the COVID-19 pandemic has spread across the globe and as variants and vaccines have developed. We have implemented procedures focusing on the health and safety of our employees, customers, partners and communities, the continuity of our business offerings and compliance with governmental regulations and local public health guidance and ordinances. We have activated our business continuity and pandemic plans and while our business operations have continued without interruption and our IBX data centers have remained fully operational to date, we cannot guarantee our business operations or our IBX data centers will not be negatively impacted in the future. Our IBX data centers have been designated “essential businesses” or “critical infrastructure” for purposes of remaining open during the COVID-19 pandemic in all of the jurisdictions that have published these exemptions but not all jurisdictions have created such designations. Any change in these classifications could cause operational disruptions or closures of the affected IBX data centers.
We implemented processes to limit and schedule access to certain IBX data centers based on infection rates and case counts as well as implemented social distancing and hygiene protocols. We have continued to track infections and adapt our policies and procedures based on a number of factors including the COVID-19 pandemic severity in each office and IBX location. These proactive actions we have taken or may take in the future and any restrictions imposed by the government could result in business delays, operational disruption and customer dissatisfaction. Employee illnesses resulting from the pandemic could result in further inefficiencies or delays and a suspected or confirmed case in an IBX data center could require temporary closure of the affected IBX data center for cleaning or until local regulatory requirements are fulfilled. Any closure of an IBX data center or limitation of customer access could cause customer dissatisfaction if customers are unable to access their equipment within the IBX data center. We also have service level agreements which could be affected if we are required to close an IBX data center for any reason.
Preventative measures instituted by governments and businesses to mitigate the spread of COVID-19, including travel restrictions, social distancing requirements, shelter in place orders and quarantines, have negatively impacted the global economy and may adversely impact us, our customers and vendors. Given the uncertainty around the duration and extent of the ongoing COVID-19 pandemic, we cannot accurately predict at this time how the pandemic will affect our business over time.
The COVID-19 pandemic has contributed to certain global supply chain disruptions including the supply of certain construction materials and has contributed to overall inflation. While we do not expect the construction delays and supply chain disruptions that we are currently experiencing to have a material effect on us at this time, additional disruptions because of the ongoing COVID-19 pandemic could occur. Additional or unexpected disruptions could cause construction delays or significantly affect the cost of our planned expansion projects in the future. Significant construction delays and increases in costs because of the supply chain disruptions could interfere with our ability to meet commitments to customers who have contracted for space in new IBX data centers under construction and could have a material impact on our business. While we have received "essential business" permits for construction in some jurisdictions, these classifications may not extend to the construction of new IBX data centers in all of our jurisdictions. We are also reliant on third party construction labor to build and expand our IBX data centers, to which we may not have access due to the ongoing COVID-19 pandemic. We rely on materials, products and manufacturing from regions of the world which are impacted by the pandemic and supply chain disruptions. While we have invested in creating a material inventory to mitigate global increases in raw materials, energy and labor prices, it may not be sufficient and ongoing delays, difficulty finding replacement products and continued high inflation could affect our business and growth.
Although currently stayed while being litigated in U.S. courts, U.S. Presidential Executive Order (EO 14042) requires companies that do business with the U.S. Federal government (“Government Contractors”) to implement a
mandate for all their U.S. employees to be fully vaccinated against COVID-19 (the “US Vaccine Mandate”). As a Government Contractor, we will be required to comply with the US Vaccine Mandate if it or a similar vaccine mandate for Government Contractors goes into effect. We do not anticipate the US Vaccine Mandate to have a material negative effect on our business even if it goes into effect, but if we experience more employee turnover than we expect or if similar mandates are required in other regions, we could experience disruptions to certain functions and employee satisfaction could be affected.
While the full extent and impact of the ongoing COVID-19 pandemic cannot be reasonably estimated at this time, it could have a material adverse impact on our business and financial condition. The extent to which the ongoing COVID-19 pandemic will impact our financial condition or results of operations will depend on many factors and future developments, including new information about the ongoing COVID-19 pandemic and its variants, additional surges in infection rates, vaccine efforts and any new government regulations which may emerge to contain the virus, among others.
We experienced an information technology security breach in the past and may be vulnerable to future security breaches, which could disrupt our operations and have a material adverse effect on our business results of operation and financial performance.
Despite our efforts to protect against cyber-attacks, we are not fully insulated from these types of security breaches, and such an attack could adversely impact our competitiveness and results of operations. In September 2020, we discovered ransomware on certain of our internal systems, encrypting files and holding them for ransom. Our teams responded quickly to address the incident and notified law enforcement, and after a thorough review of the incident by our management and experts retained to assist in this incident, the investigation was closed as of October 14, 2020. Our IBX data centers and our service offerings, including managed services, remained fully operational during the attack and the incident did not affect our ability to support our customers. We further believe that we were able to contain the incident and that the resolution will prevent the release of any data associated with this attack. While the event has been resolved and has not caused a material disruption to our systems nor resulted in any material costs to us, we are also working to protect against any future attacks. We will continue to face risks associated with unauthorized access to our computer systems, loss or destruction of data, computer viruses, ransomware, malware, distributed denial-of-service attacks or other malicious activities. These threats may result from human error, equipment failure, fraud or malice on the part of employees, vendors or third parties. As techniques used to breach security change frequently and are generally not recognized until launched against a target,
Showing the first 8K of 127K characters. Open the full section
Item 1B. Unresolved Staff Comments
There is no disclosure to report pursuant to Item 1B.
Item 2. Properties
Our executive offices are located in Redwood City, California, with sales offices in several cities throughout the U.S. Our Asia-Pacific headquarters office is located in Hong Kong and we also have sales offices in several cities throughout Asia-Pacific. Our EMEA headquarters office is located in Amsterdam, the Netherlands and we also have sales offices in several cities throughout EMEA.
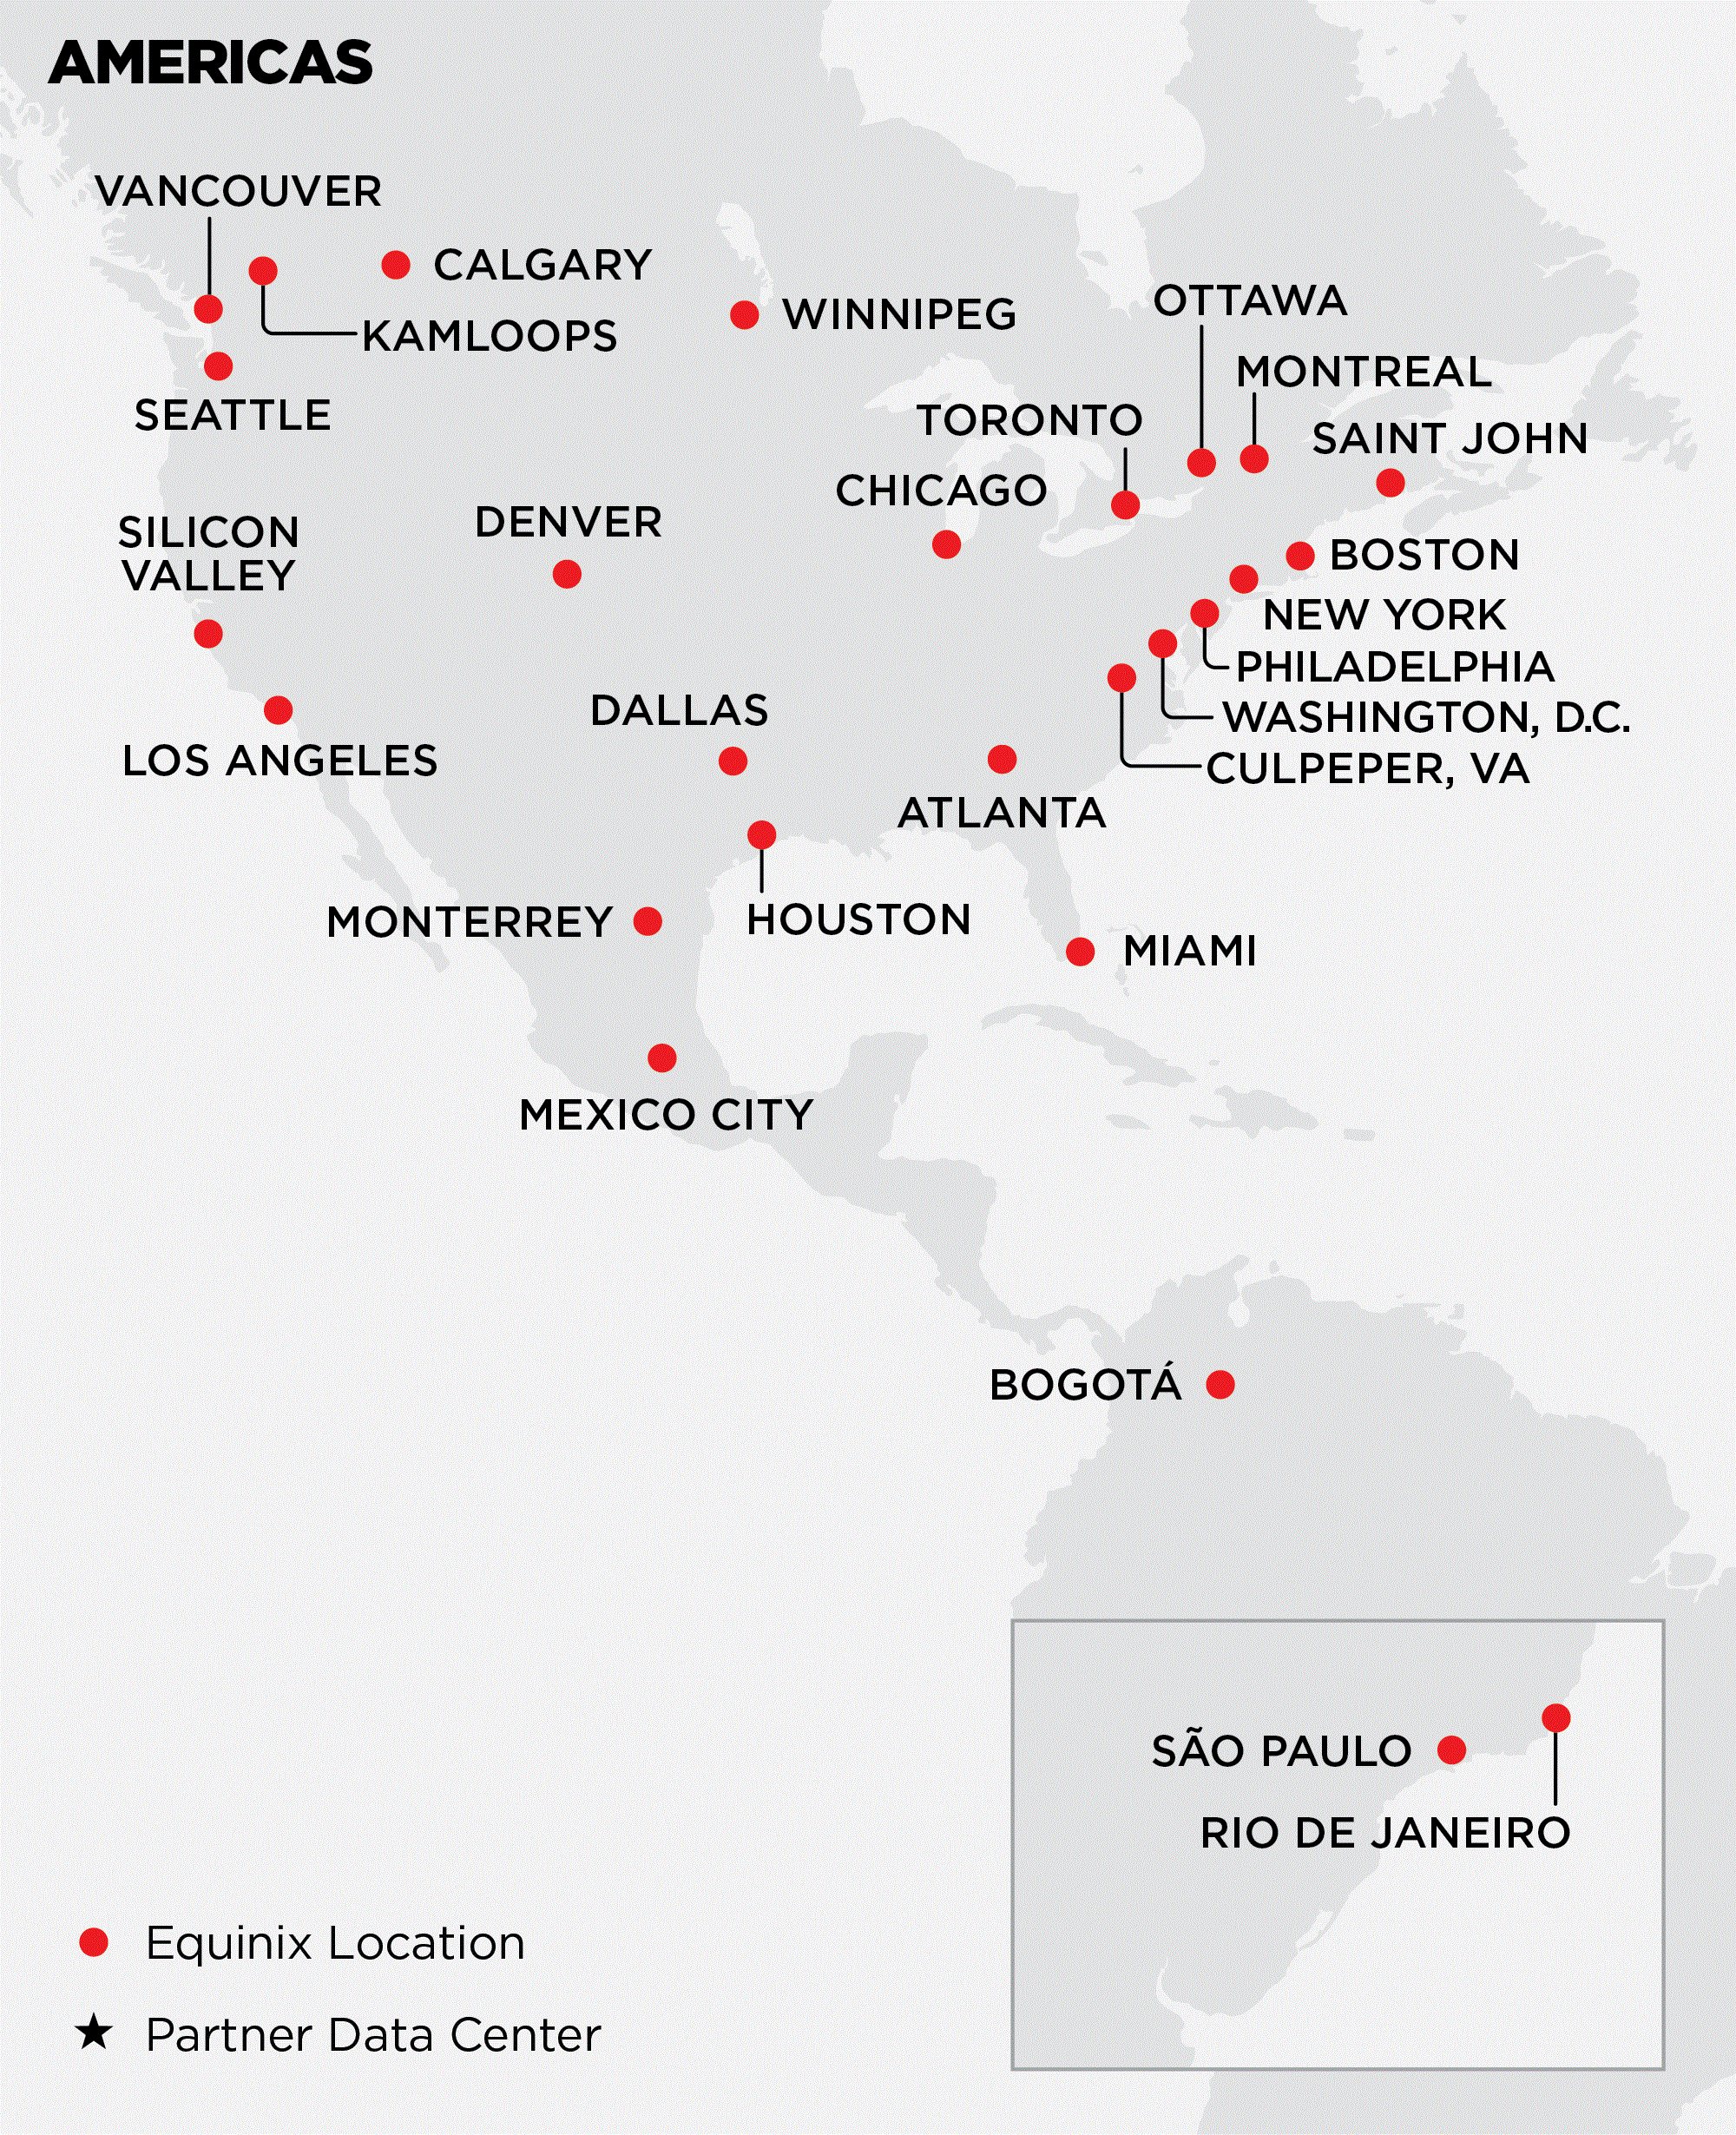
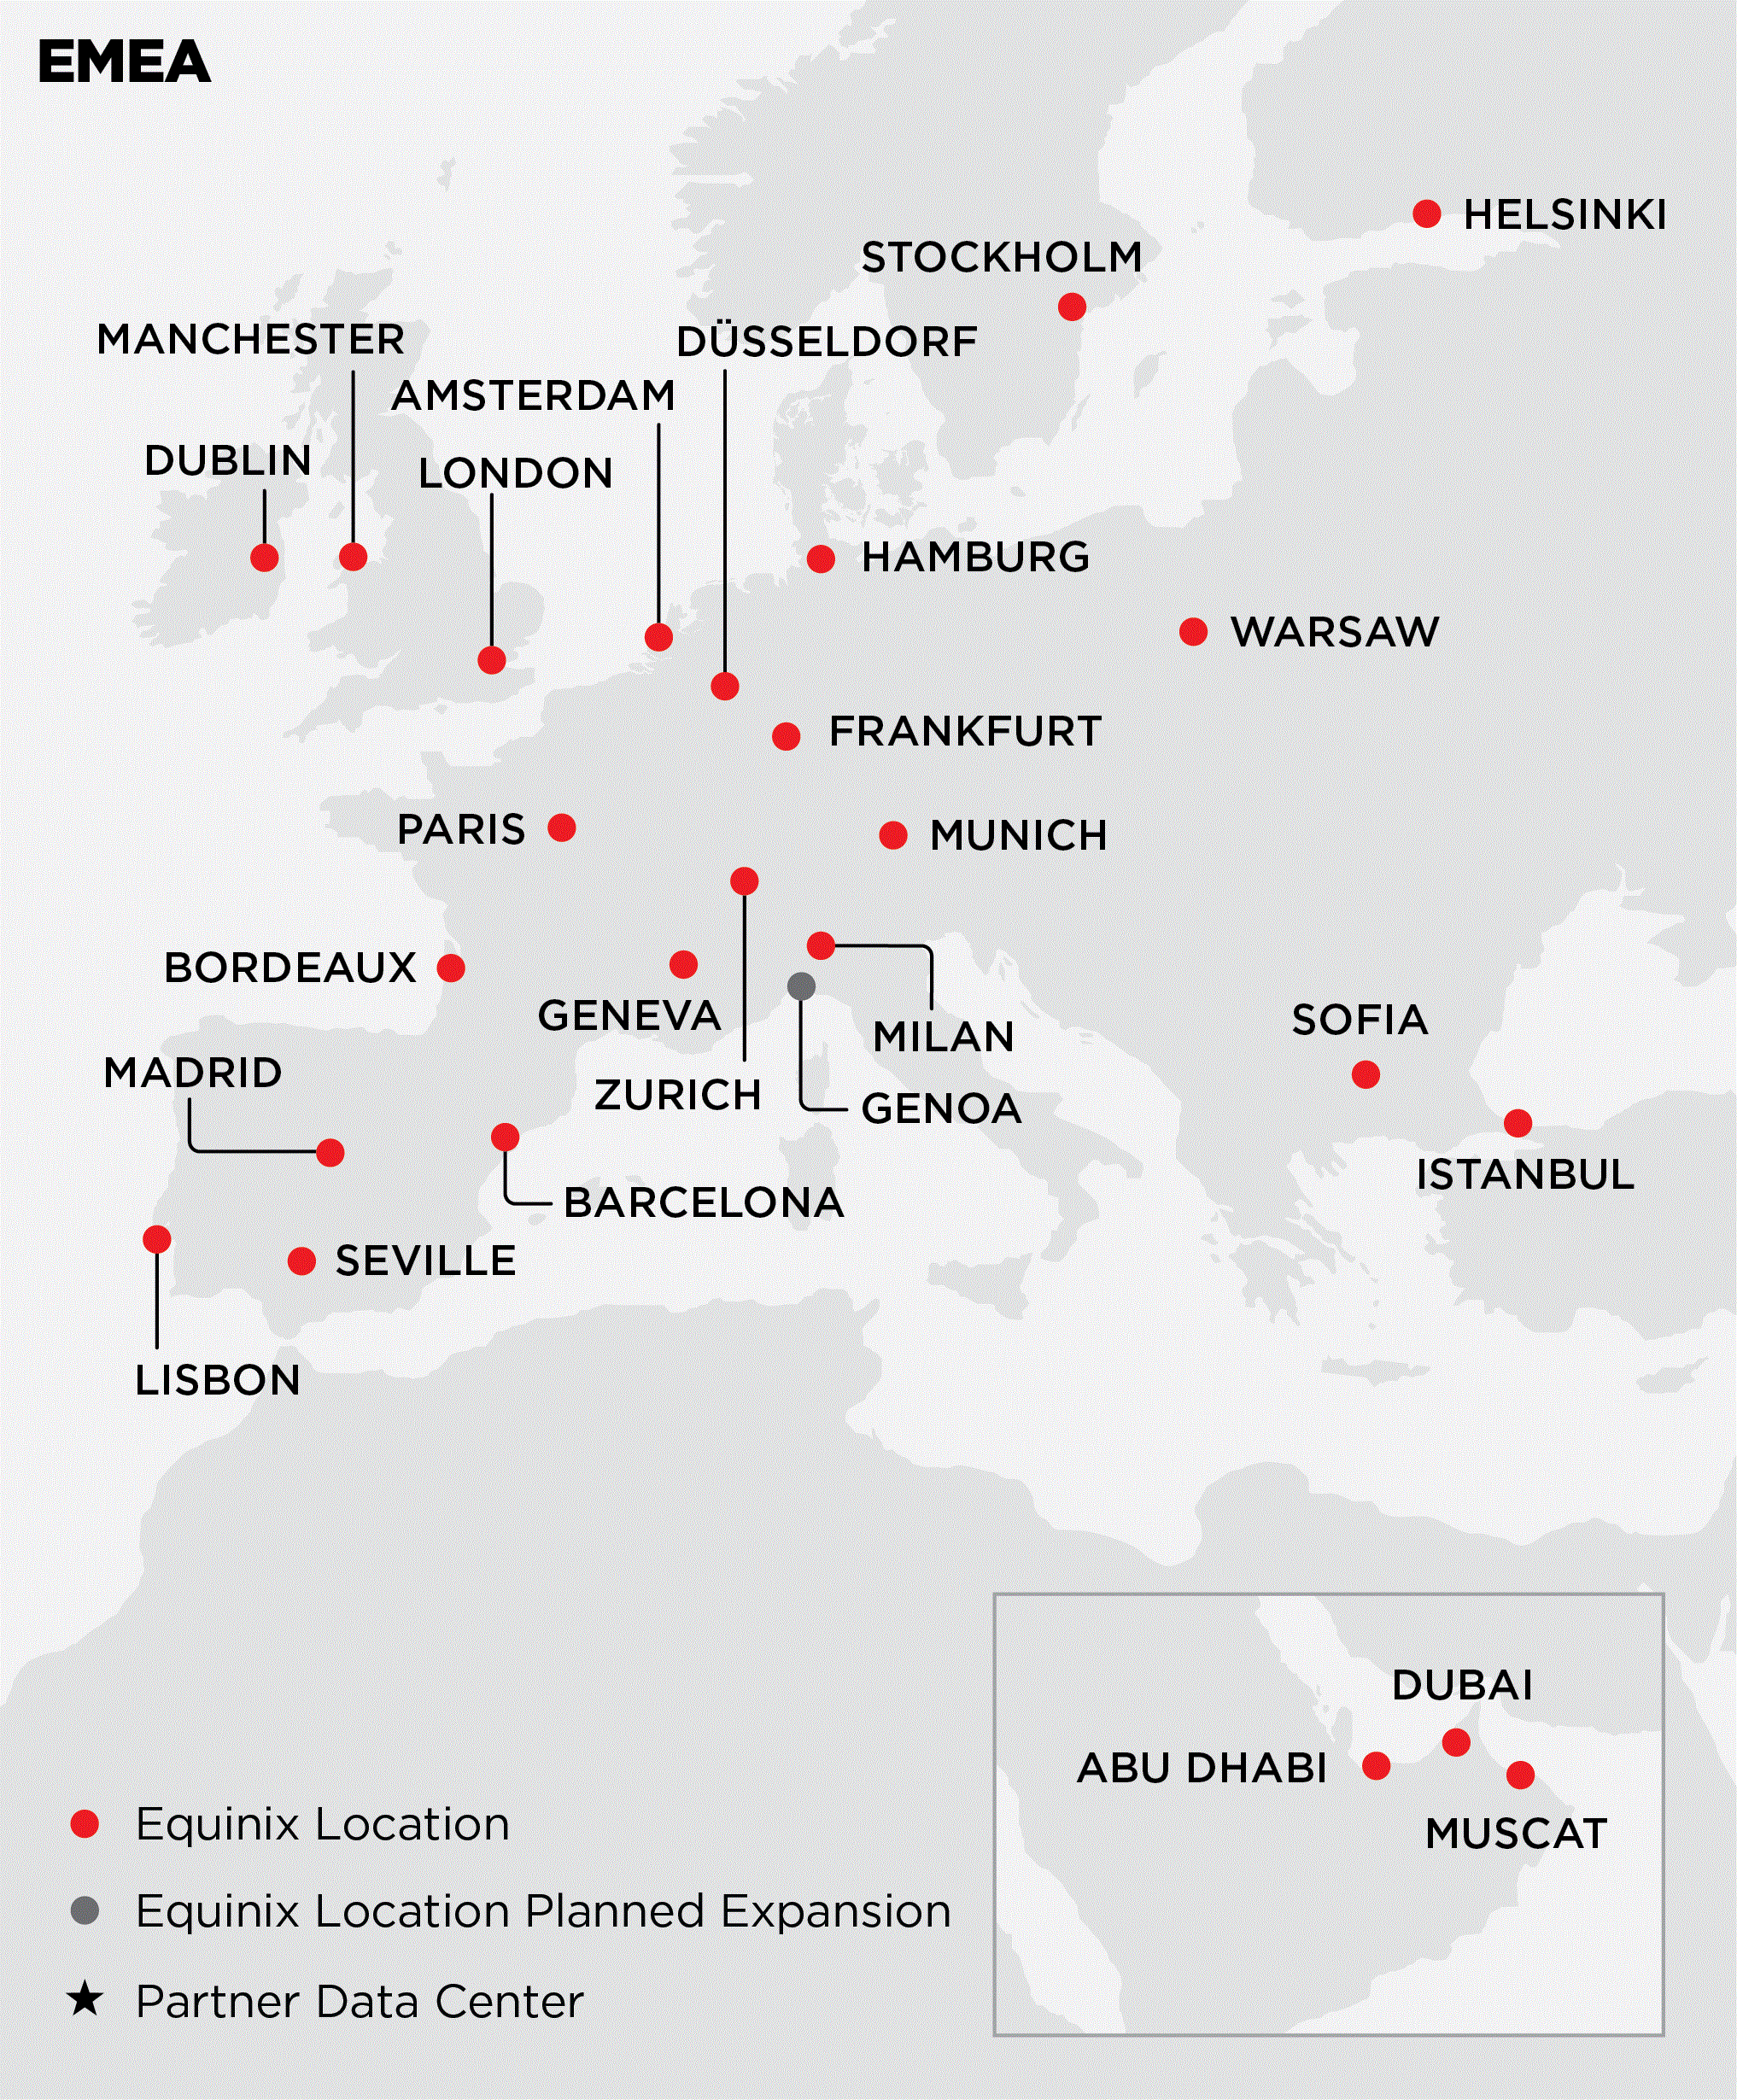
The following tables present the locations of our leased and owned IBX data centers and xScaleTM data centers investments as of December 31, 2021.
| AMERICAS | ||||||||||||||||||||
| Metro | Leased (1) | Owned (1) (2) | ||||||||||||||||||
| Atlanta | ● | ● | ||||||||||||||||||
| Bogota | ● | |||||||||||||||||||
 | Boston | ● | ||||||||||||||||||
| Calgary | ● | ● | ||||||||||||||||||
| Chicago | ● | ● | ||||||||||||||||||
| Culpeper | ● | |||||||||||||||||||
| Dallas | ● | ● | ||||||||||||||||||
| Washington D.C./Ashburn | ● | ● | ||||||||||||||||||
| Denver | ● | ● | ||||||||||||||||||
| Houston | ● | |||||||||||||||||||
| Kamloops | ● | |||||||||||||||||||
| Los Angeles | ● | ● | ||||||||||||||||||
| Mexico City | ● | |||||||||||||||||||
| Miami | ● | ● | ||||||||||||||||||
| Monterrey | ● | |||||||||||||||||||
| Montreal | ● | |||||||||||||||||||
| New York | ● | ● | ||||||||||||||||||
| Ottawa | ● | |||||||||||||||||||
| Philadelphia | ● | |||||||||||||||||||
| Rio de Janeiro | ● | ● | ||||||||||||||||||
| Saint John | ● | |||||||||||||||||||
| Sao Paulo | ● | ● | ||||||||||||||||||
| Seattle | ● | ● | ||||||||||||||||||
| Silicon Valley | ● | ● | ||||||||||||||||||
| Toronto | ● | ● | ||||||||||||||||||
| Vancouver | ● | |||||||||||||||||||
| Winnipeg | ● |
| EMEA | ||||||||||||||||||||
| Metro | Leased (1) | Owned (1) (2) | ||||||||||||||||||
| Abu Dhabi | ● | |||||||||||||||||||
| Amsterdam | ● | ● | ||||||||||||||||||
 | Barcelona | ● | ||||||||||||||||||
| Bordeaux | ● | |||||||||||||||||||
| Dubai | ● | |||||||||||||||||||
| Dublin | ● | ● | ||||||||||||||||||
| Dusseldorf | ● | |||||||||||||||||||
| East Netherlands | ● | |||||||||||||||||||
| Frankfurt | ● | ● | ||||||||||||||||||
| Geneva | ● | |||||||||||||||||||
| Genoa (3) | ● | |||||||||||||||||||
| Hamburg | ● | |||||||||||||||||||
| Helsinki | ● | ● | ||||||||||||||||||
| Istanbul | ● | |||||||||||||||||||
| Lisbon | ● | |||||||||||||||||||
| London | ● | ● | ||||||||||||||||||
| Madrid | ● | |||||||||||||||||||
| Manchester | ● | |||||||||||||||||||
| Milan | ● | ● | ||||||||||||||||||
| Munich (3) | ● | ● | ||||||||||||||||||
| Muscat | ● | |||||||||||||||||||
| Paris | ● | ● | ||||||||||||||||||
| Seville | ● | |||||||||||||||||||
| Sofia | ● | |||||||||||||||||||
| Stockholm | ● | ● | ||||||||||||||||||
| Warsaw | ● | ● | ||||||||||||||||||
| Zurich | ● | ● |
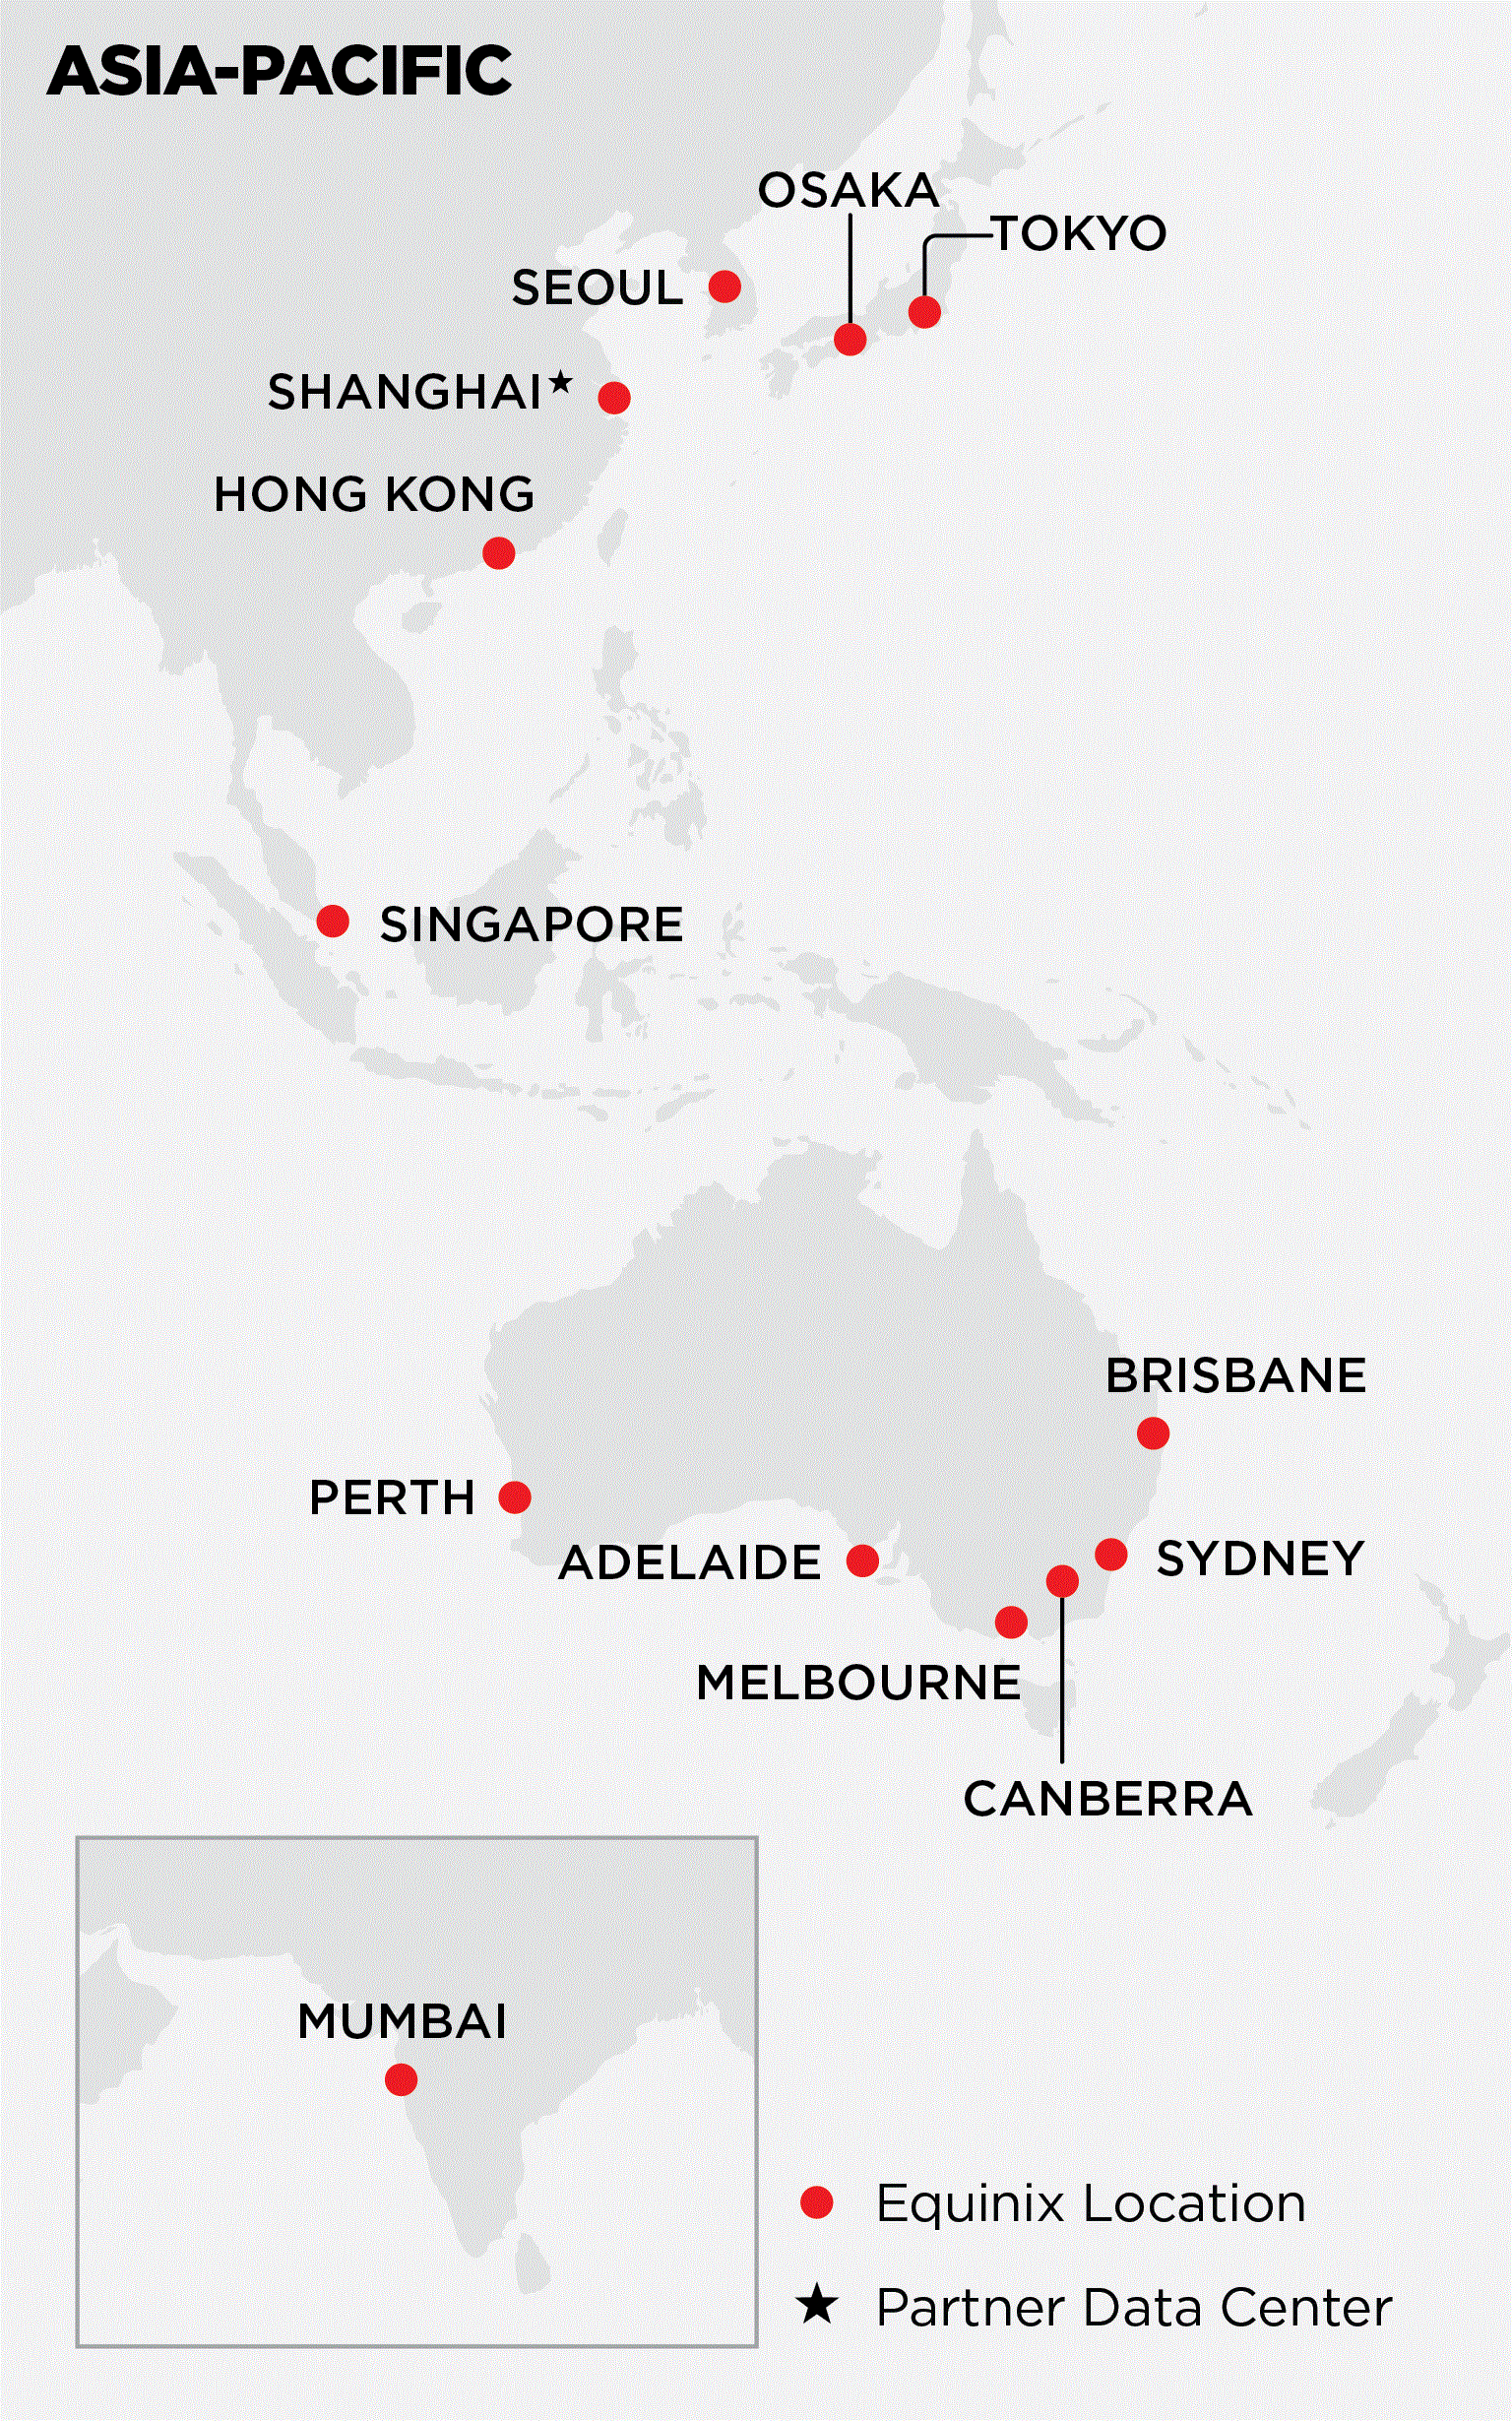 | |||||||||||||||||
| Asia-Pacific | |||||||||||||||||
| Metro | Leased (1) | Owned (1) (2) | |||||||||||||||
| Adelaide | ● | ||||||||||||||||
| Brisbane | ● | ||||||||||||||||
| Canberra | ● | ||||||||||||||||
| Hong Kong | ● | ||||||||||||||||
| Melbourne | ● | ||||||||||||||||
| Mumbai | ● | ||||||||||||||||
| Osaka | ● | ● | |||||||||||||||
| Perth | ● | ||||||||||||||||
| Seoul | ● | ||||||||||||||||
| Singapore | ● | ● | |||||||||||||||
| Shanghai | ● | ● | |||||||||||||||
| Sydney | ● | ● | |||||||||||||||
| Tokyo | ● | ● | |||||||||||||||
(1)"●" denotes locations with one or more data centers.
(2)Owned sites include IBX data centers subject to long-term ground leases.
(3)The Genoa (GN1) and Munich (MU4) owned sites represent data centers opened in January 2022
The following table presents an overview of our portfolio of IBX data centers as of December 31, 2021:
| # of IBXs (1) | Total Cabinet Capacity (1)(2) | Cabinets Billed**(1)** | Cabinet Utilization % (1)(3) | MRR per Cabinet (1)(4) | |||||||||||||||||||||||||
| Americas | 103 | 136,000 | 103,200 | 76 | % | $ | 2,342 | ||||||||||||||||||||||
| EMEA | 78 | 128,800 | 107,400 | 83 | % | 1,586 | |||||||||||||||||||||||
| Asia-Pacific | 50 | 74,700 | 59,300 | 79 | % | 1,970 | |||||||||||||||||||||||
| Total | 231 | 339,500 | 269,900 |
(1)Excludes nine unconsolidated entities (eight xScaleTM data centers and the MC1 IBX data center) and includes the MU4 and GN1 data centers opened in January 2022
(2)Cabinets represent a specific amount of space within an IBX data center. Customers can combine and use multiple adjacent cabinets within an IBX data center, depending on their space requirements.
(3)The cabinet utilization rate represents the percentage of cabinet space billed versus total cabinet capacity, taking into consideration power limitations.
(4)MRR per cabinet represents average monthly recurring revenue recognized divided by the average number of cabinets billing during the fourth quarter of the year. Americas MRR per cabinet excludes Brazil, Colombia and Infomart non-IBX tenant income and Asia-Pacific MRR per Cabinet excludes Bit-isle MIS.
The following table presents a summary of our significant IBX data center expansion projects under construction as of December 31, 2021:
| Property | Property Location | Target Open Date | Sellable Cabinets | Total Capex (in Millions) (1) | ||||||||||||||||||||||
| Americas: | ||||||||||||||||||||||||||
| MX2 phase II | Mexico City | Q1 2022 | 1,075 | $ | 54 | |||||||||||||||||||||
| TR2 phase IV | Toronto | Q3 2022 | 300 | 24 | ||||||||||||||||||||||
| BG2 phase I | Bogota | Q4 2022 | 550 | 45 | ||||||||||||||||||||||
| CL3 phase II | Calgary | Q4 2022 | 550 | 38 | ||||||||||||||||||||||
| DC21 phase II | Washington D.C. | Q4 2022 | 950 | 32 | ||||||||||||||||||||||
| KA1 phase II | Kamloops | Q4 2022 | 250 | 22 | ||||||||||||||||||||||
| LA4 phase IV | Los Angeles | Q4 2022 | 350 | 22 | ||||||||||||||||||||||
| 4,025 | 237 | |||||||||||||||||||||||||
| EMEA: | ||||||||||||||||||||||||||
| MC1 phase II | Muscat | Q1 2022 | 475 | 19 | ||||||||||||||||||||||
| IL2 phase III | Istanbul | Q2 2022 | 525 | 15 | ||||||||||||||||||||||
| LD7 phase II | London | Q2 2022 | 2,275 | 111 | ||||||||||||||||||||||
| MD2 phase IV | Madrid | Q2 2022 | 375 | 16 | ||||||||||||||||||||||
| MA5 phase I | Manchester | Q2 2022 | 1,025 | 78 | ||||||||||||||||||||||
| PA10 phase I | Paris | Q2 2022 | 1,525 | 163 | ||||||||||||||||||||||
| ZH5 phase IV | Zurich | Q2 2022 | 250 | 42 | ||||||||||||||||||||||
| GV2 phase III | Geneva | Q3 2022 | 300 | 22 | ||||||||||||||||||||||
| LD8 phase IV | London | Q3 2022 | 550 | 36 | ||||||||||||||||||||||
| ML5 phase II | Milan | Q3 2022 | 500 | 20 | ||||||||||||||||||||||
| MD6 phase I | Madrid | Q3 2022 | 600 | 5 | ||||||||||||||||||||||
| FR5 phase V | Frankfurt | Q4 2022 | 650 | 43 | ||||||||||||||||||||||
| BX1 phase II & III | Bordeaux | Q1 2023 | 525 | 44 | ||||||||||||||||||||||
| PA6 phase II | Paris | Q1 2023 | 275 | 16 | ||||||||||||||||||||||
| DX3 phase I | Dubai | Q2 2023 | 900 | 61 | ||||||||||||||||||||||
| SM1 phase I | Salalah | Q2 2023 | 125 | 7 | ||||||||||||||||||||||
| SO2 phase II | Sofia | Q2 2023 | 350 | 12 | ||||||||||||||||||||||
| BX1 phase IV | Bordeaux | Q3 2023 | 275 | 21 | ||||||||||||||||||||||
| FR13 phase I | Frankfurt | Q4 2023 | 1,125 | 104 | ||||||||||||||||||||||
| 12,625 | 835 | |||||||||||||||||||||||||
| Asia-Pacific: | ||||||||||||||||||||||||||
| SG5 phase II | Singapore | Q1 2022 | 775 | 75 | ||||||||||||||||||||||
| SG5 phase III | Singapore | Q1 2022 | 700 | 19 | ||||||||||||||||||||||
| TY11 phase III | Tokyo | Q2 2022 | 900 | 31 | ||||||||||||||||||||||
| ME2 phase II | Melbourne | Q3 2022 | 500 | 16 | ||||||||||||||||||||||
| SG5 phase IV | Singapore | Q3 2022 | 600 | 26 | ||||||||||||||||||||||
| OS3 phase II | Osaka | Q4 2022 | 400 | 19 | ||||||||||||||||||||||
| 3,875 | 186 | |||||||||||||||||||||||||
| Total | 20,525 | $ | 1,258 |
(1)Capital expenditures are approximate and may change based on final construction details.
Item 3. Legal Proceedings
None.
Item 4. Mine Safety Disclosure
Not applicable.
PART II
Item 5. Market for Registrant's Common Equity, Related Stockholder Matters and Issuer Purchases of Equity Securities
Our common stock is quoted on the NASDAQ Global Select Market under the symbol of "EQIX." Our common stock began trading in August 2000. As of January 31, 2022, we had 90,643,998 shares of our common stock outstanding held by approximately 347 registered holders. During the years ended December 31, 2021 and 2020, we did not issue or sell any securities on an unregistered basis.
Stock Performance Graph
The graph set forth below compares the cumulative total stockholder return on Equinix's common stock between December 31, 2016 and December 31, 2021 with the cumulative total return of:
-
the S&P 500 Index;
-
the NASDAQ Composite Index; and
-
the FTSE NAREIT All REITs Index.
The graph assumes the investment of $100.00 on December 31, 2016 in Equinix's common stock and in each index, and assumes the reinvestment of dividends, if any.
Equinix cautions that the stock price performance shown in the graph below is not indicative of, nor intended to forecast, the potential future performance of Equinix's common stock.
Notwithstanding anything to the contrary set forth in any of Equinix's previous or future filings under the Securities Act of 1933, as amended, or the Securities Exchange Act of 1934, as amended, that might incorporate this Annual Report on Form 10-K or future filings made by Equinix under those statutes, the stock performance graph shall not be deemed filed with the Securities and Exchange Commission and shall not be deemed incorporated by reference into any of those prior filings or into any future filings made by Equinix under those statutes.
COMPARISON OF 5 YEAR CUMULATIVE TOTAL RETURN*

*$100 invested on 12/31/16 in stock or index, including reinvestment of dividends. Fiscal year ending December 31.
Item 6. [Reserved]
Item 7. Management's Discussion and Analysis of Financial Condition and Results of Operations
The following commentary should be read in conjunction with the financial statements and related notes contained elsewhere in this Annual Report on Form 10-K. The information in this discussion contains forward-looking statements within the meaning of Section 27A of the Securities Act of 1933, as amended, and Section 21E of the Securities Exchange Act of 1934, as amended. Such statements are based upon current expectations that involve risks and uncertainties. Any statements contained herein that are not statements of historical fact may be deemed to be forward-looking statements. For example, the words "believes," "anticipates," "plans," "expects," "intends" and similar expressions are intended to identify forward-looking statements. Our actual results and the timing of certain events may differ significantly from the results discussed in the forward-looking statements. Factors that might cause such a discrepancy include, but are not limited to, those discussed in "Liquidity and Capital Resources" and "Risk Factors" elsewhere in this Annual Report on Form 10-K. All forward-looking statements in this document are based on information available to us as of the date hereof and we assume no obligation to update any such forward-looking statements.
Item 7 of this Form 10-K focuses on discussion of 2021 and 2020 items as well as 2021 results as compared to 2020 results. For the discussion of 2019 items and 2020 results as compared to 2019 results, please refer to Item 7 of our 2020 Form 10-K as filed with the SEC on February 19, 2021.
Our management's discussion and analysis of financial condition and results of operations is intended to assist readers in understanding our financial information from our management's perspective and is presented as follows:
-
Overview
-
Results of Operations
-
Non-GAAP Financial Measures
-
Liquidity and Capital Resources
-
Critical Accounting Policies and Estimates
-
Recent Accounting Pronouncements
Overview
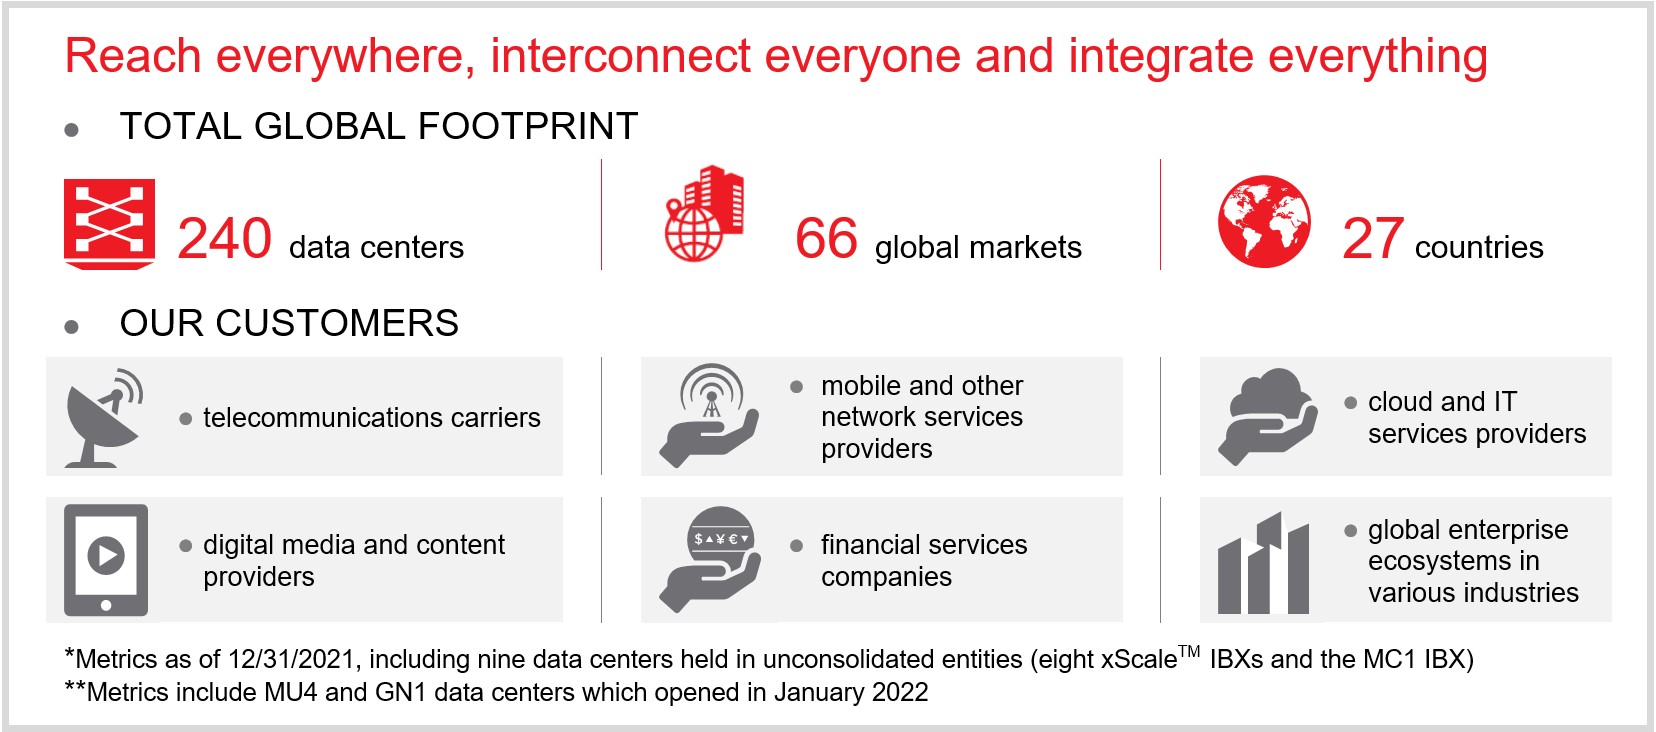
We provide a global, vendor-neutral data center, interconnection and edge services platform with offerings that aim to enable our customers to reach everywhere, interconnect everyone and integrate everything. Global enterprises, service providers and business ecosystems of industry partners rely on our IBX data centers and expertise around the world for the safe housing of their critical IT equipment and to protect and connect the world's most valued information assets. They also look to Platform Equinix® for the ability to directly and securely
interconnect to the networks, clouds and content that enable today's information-driven global digital economy. Our recent IBX data center openings and acquisitions, as well as xScaleTM data center investments, have expanded our total global footprint to 240 data centers, including eight xScale data centers and the MC1 data center that were held in unconsolidated joint ventures, across 66 markets around the world. Metrics also include the MU4 and GN1 data centers which opened in January 2022. Equinix offers the following solutions:
-
premium data center colocation;
-
interconnection and data exchange solutions;
-
edge services for deploying networking, security and hardware; and
-
remote expert support and professional services.
Our interconnected data centers around the world allow our customers to increase information and application delivery performance to users, and quickly access distributed IT infrastructures and business and digital ecosystems, while significantly reducing costs. Our global platform and the quality of our IBX data centers, interconnection offerings and edge services have enabled us to establish a critical mass of customers. As more customers choose Platform Equinix for bandwidth cost and performance reasons, it benefits their suppliers and business partners to colocate in the same data centers. This adjacency creates a “network effect” that enables our customers to capture the full economic and performance benefits of our offerings. These partners, in turn, pull in their business partners, creating a "marketplace" for their services. Our global platform enables scalable, reliable and cost-effective interconnection that increases data traffic exchange while lowering overall cost and increasing flexibility. Our focused business model is built on our critical mass of enterprise and service provider customers and the resulting "marketplace" effect. This global platform, combined with our strong financial position, has driven new customer growth and bookings.
Historically, our market was served by large telecommunications carriers who bundled their products and services with their colocation offerings. The data center market landscape has evolved to include private and vendor-neutral multi-tenant data center ("MTDC") providers, hyperscale cloud providers, managed infrastructure and application hosting providers, and systems integrators. It is estimated that Equinix is one of more than 2,200 companies that provide MTDC offerings around the world. Each of these data center solutions providers can bundle various colocation, interconnection and network offerings and outsourced IT infrastructure solutions. We are able to offer our customers a global platform that reaches 27 countries with the industry’s largest and most active ecosystem of partners in our sites, proven operational reliability, improved application performance and a highly scalable set of offerings.
The cabinet utilization rate represents the percentage of cabinet space billed versus total cabinet capacity, which is used to measure how efficiently we are managing our cabinet capacity. Our cabinet utilization rate varies from market to market among our IBX data centers across our Americas, EMEA and Asia-Pacific regions. Our cabinet utilization rates were approximately 79%, as of December 31, 2021 and 2020. Excluding the impact of our IBX data center expansion projects that have opened during the last 12 months, our cabinet utilization rate would have increased to approximately 81% as of December 31, 2021. We continue to monitor the available capacity in each of our selected markets. To the extent we have limited capacity available in a given market, it may limit our ability for growth in that market. We perform demand studies on an ongoing basis to determine if future expansion is warranted in a market. In addition, power and cooling requirements for most customers are growing on a per unit basis. As a result, customers are consuming an increasing amount of power per cabinet. Although we generally do not control the amount of power our customers draw from installed circuits, we have negotiated power consumption limitations with certain high power-demand customers. This increased power consumption has driven us to build out our new IBX data centers to support power and cooling needs twice that of previous IBX data centers. We could face power limitations in our IBX data centers, even though we may have additional physical cabinet capacity available within a specific IBX data center. This could have a negative impact on the available utilization capacity of a given IBX data center, which could have a negative impact on our ability to grow revenues, affecting our financial performance, results of operations and cash flows.
To serve the needs of the growing hyperscale data center market, including the world's largest cloud service providers, we have entered into joint ventures to develop and operate xScale data centers. In the past two years, we entered into our EMEA 1 Joint Venture, Asia-Pacific 1 Joint Venture and EMEA 2 Joint Venture, and entered into negotiations in connection with a new joint venture (the "AMER 1 Joint Venture"), in the form of limited liability partnerships with GIC, Singapore's sovereign wealth fund ("GIC"). In October 2021, we entered int
Showing the first 8K of 99K characters. Open the full section
Item 7A. Quantitative and Qualitative Disclosures About Market Risk
Market Risk
The following discussion about market risk involves forward-looking statements. Actual results could differ materially from those projected in the forward-looking statements. We may be exposed to market risks related to changes in interest rates and foreign currency exchange rates and fluctuations in the prices of certain commodities, primarily electricity.
The uncertainty that exists with respect to the economic impact of the ongoing COVID-19 pandemic introduced significant volatility in the financial markets. See Part I, Item 1A. Risk Factors for additional information regarding potential risks to our business, financial condition and results of operations related to the ongoing COVID-19 pandemic.
We employ foreign currency forward and option contracts, cross-currency interest rate swaps and interest rate locks for the purpose of hedging certain specifically identified exposures. The use of these financial instruments is intended to mitigate some of the risks associated with fluctuations in currency exchange and interest rates, but does not eliminate such risks. We do not use financial instruments for trading or speculative purposes.
Investment Portfolio Risk
We maintain an investment portfolio of various holdings, types, and maturities that is prioritized on meeting REIT asset requirements. All of our marketable securities are recorded on our consolidated balance sheets at fair value with changes in fair values recognized in net income. We consider various factors in determining whether we should recognize an impairment charge for our securities, including the length of time and extent to which the fair value has been less than our cost basis and our intent and ability to hold the investment for a period of time sufficient to allow for any anticipated recovery. We anticipate that we will recover the entire cost basis of these securities and have determined that no other-than-temporary impairments associated with credit losses were required to be recognized during the year ended December 31, 2021.
As of December 31, 2021, our investment portfolio of cash equivalents and marketable securities consisted of money market funds, certificates of deposits and publicly traded equity securities. The amount in our investment portfolio that could be susceptible to market risk totaled $585.7 million.
Interest Rate Risk
We are exposed to interest rate risk related to our outstanding debt. An immediate increase or decrease in current interest rates from their position as of December 31, 2021 would not have a material impact on our interest expense due to the fixed coupon rate on the majority of our debt obligations. However, the interest expense associated with our senior credit facility and term loans that bear interest at variable rates could be affected. For every 100-basis point increase or decrease in interest rates, our annual interest expense could increase by approximately $5.5 million or decrease by approximately $1.4 million based on the total balance of our term loan borrowings as of December 31, 2021. As of December 31, 2021, we had not employed any interest rate derivative products to hedge our variable rate debt obligations. However, we may enter into interest rate hedging agreements in the future to mitigate our exposure to interest rate risk.
We periodically enter into interest rate locks to hedge the interest rate exposure created by anticipated fixed rate debt issuances, which are designated as cash flow hedges. When interest rate locks are settled, any accumulated gain or loss included as a component of other comprehensive income (loss) will be amortized to interest expense over the term of the forecasted hedged transaction which is equivalent to the term of the interest rate locks.
The fair value of our long-term fixed interest rate debt is subject to interest rate risk. Generally, the fair value of fixed interest rate debt will increase as interest rates fall and decrease as interest rates rise. These interest rate changes may affect the fair value of the fixed interest rate debt but do not impact our earnings or cash flows. The fair value of our mortgage and loans payable, which are not traded in the market, is estimated by considering our credit rating, current rates available to us for debt of the same remaining maturities and the terms of the debt. The fair value of our other senior notes, which are traded in the market, was based on quoted market prices. The following table represents the carrying value and estimated fair value of our mortgage and loans payable and senior notes as of (in thousands):
| December 31, 2021 | December 31, 2020 | ||||||||||||||||||||||
| Carrying Value (1) | Fair Value | Carrying Value (1) | Fair Value | ||||||||||||||||||||
| Mortgage and loans payable | $ | 618,388 | $ | 621,051 | $ | 1,370,970 | $ | 1,379,129 | |||||||||||||||
| Senior notes | 11,102,130 | 11,049,834 | 9,261,050 | 9,705,486 |
(1)The carrying value is gross of debt issuance cost, debt discount and debt premium.
Foreign Currency Risk
To help manage the exposure to foreign currency exchange rate fluctuations, we have implemented a number of hedging programs, in particular (i) a cash flow hedging program to hedge the forecasted revenues and expenses in our EMEA region, (ii) a balance sheet hedging program to hedge the re-measurement of monetary assets and liabilities denominated in foreign currencies, and (iii) a net investment hedging program to hedge the long term investments in our foreign subsidiaries. Our hedging programs reduce, but do not entirely eliminate, the impact of currency exchange rate movements and their impact on the consolidated statements of operations.
We have entered into various foreign currency debt obligations. As of December 31, 2021, the total principal amount of foreign currency debt obligations was $1.8 billion, including $1.3 billion denominated in Euro and $549.7 million denominated in British Pound. As of December 31, 2021, we have designated $1.5 billion of the total principal amount of foreign currency debt obligations as net investment hedges against our net investments in foreign subsidiaries. For a net investment hedge, changes in the fair value of the hedging instrument designated as a net investment hedge are recorded as a component of other comprehensive income (loss) in the consolidated balance sheets. Fluctuations in the exchange rates between these foreign currencies and the U.S. Dollar will impact the amount of U.S. Dollars that we will require to settle the foreign currency debt obligations at maturity. If the U.S. Dollar would have been weaker or stronger by 10% in comparison to these foreign currencies as of December 31, 2021, we estimate our obligation to cash settle the principal of these foreign currency debt obligations in U.S. Dollars would have increased or decreased by approximately $200.2 million and $163.8 million, respectively.
We are also party to cross-currency interest rate swaps. As of December 31, 2021 and 2020, the total notional amounts of cross-currency interest rate swap contracts outstanding were $4.0 billion and $3.3 billion, respectively. The cross-currency interest rate swaps are designated as hedges of our net investment in foreign subsidiaries and changes in the fair value of these swaps are recorded as a component of accumulated other comprehensive income (loss) in the consolidated balance sheets. If the U.S. Dollar weakened or strengthened by 10% in comparison to foreign currencies, we estimate our obligation to cash settle these hedges would have increased or decreased by approximately $456.3 million and $374.0 million, respectively.
The U.S. Dollar strengthened relative to certain of the currencies of the foreign countries in which we operate during the year ended December 31, 2021. This has impacted our consolidated financial position and results of operations during this period, including the amount of revenues that we reported. Continued strengthening or weakening of the U.S. Dollar will continue to impact us in future periods.
With the existing cash flow hedges in place, a hypothetical additional 10% strengthening of the U.S. Dollar during the year ended December 31, 2021 would have resulted in a reduction of our revenues and a reduction of our operating expenses including depreciation and amortization expense by approximately $205.1 million and $202.2 million, respectively.
With the existing cash flow hedges in place, a hypothetical additional 10% weakening of the U.S. Dollar during the year ended December 31, 2021 would have resulted in an increase of our revenues and an increase of our operating expenses including depreciation and amortization expenses, by approximately $255.4 million and $253.7 million, respectively.
Commodity Price Risk
Certain operating costs incurred by us are subject to price fluctuations caused by the volatility of underlying commodity prices. The commodities most likely to have an impact on our results of operations in the event of price changes are electricity, supplies and equipment used in our IBX data centers. We closely monitor the cost of electricity at all of our locations. We have entered into several power contracts to purchase power at fixed prices in certain locations in the Australia, Brazil, Bulgaria, Canada, China, Finland, France, Germany, Ireland, Italy, Japan, the Netherlands, Poland, Portugal, Singapore, Spain, Sweden, Switzerland, the United Kingdom and the U.S..
In addition, as we are building new, or expanding existing, IBX data centers, we are subject to commodity price risk for building materials related to the construction of these IBX data centers, such as steel and copper. In addition, the lead-time to procure certain pieces of equipment, such as generators, is substantial. Any delays in procuring the necessary pieces of equipment for the construction of our IBX data centers could delay the anticipated openings of these new IBX data centers and, as a result, increase the cost of these projects.
We do not currently employ forward contracts or other financial instruments to address commodity price risk other than the power contracts discussed above.
Item 8. Financial Statements and Supplementary Data
The financial statements and supplementary data required by this Item 8 are listed in Item 15(a)(1) and begin at page F-1 of this Annual Report on Form 10-K.
Item 9. Changes in and Disagreements With Accountants on Accounting and Financial Disclosure
There is no disclosure to report pursuant to Item 9.
Item 9A. Controls and Procedures
Conclusion Regarding the Effectiveness of Disclosure Controls and Procedures
Under the supervision and with the participation of our management, including our Chief Executive Officer and our Chief Financial Officer, we conducted an evaluation of our disclosure controls and procedures, as such term is defined under Rule 13a-15(e) promulgated under the Securities Exchange Act of 1934, as amended (the "Exchange Act"). Based on this evaluation, our Chief Executive Officer and our Chief Financial Officer concluded that our disclosure controls and procedures were effective at the reasonable assurance level as of December 31, 2021.
Management's Report on Internal Control Over Financial Reporting
Our management is responsible for establishing and maintaining adequate internal control over financial reporting, as such term is defined in Exchange Act Rule 13a-15(f). Because of its inherent limitations, internal control over financial reporting may not prevent or detect misstatements. Also, projections of any evaluation of effectiveness to future periods are subject to the risk that controls may become inadequate because of changes in conditions, or that the degree of compliance with the policies or procedures may deteriorate.
Under the supervision and with the participation of our management, including our Chief Executive Officer and Chief Financial Officer, we conducted an evaluation of the effectiveness of our internal control over financial reporting based on the framework in Internal Control – Integrated Framework (2013) issued by the Committee of Sponsoring Organizations of the Treadway Commission.
Based on our evaluation under the framework in Internal Control – Integrated Framework (2013), our management concluded that our internal control over financial reporting was effective as of December 31, 2021.
The effectiveness of our internal control over financial reporting as of December 31, 2021 has been audited by PricewaterhouseCoopers LLP, an independent registered public accounting firm, as stated in their report which is included herein on page F-1 of this Annual Report on Form 10-K.
Limitations on the Effectiveness of Controls
Our management, including our Chief Executive Officer and Chief Financial Officer, believes that our disclosure controls and procedures and internal control over financial reporting are designed and operated to be effective at the reasonable assurance level. However, our management does not expect that our disclosure controls and procedures or our internal control over financial reporting will prevent all errors and all fraud. A control system, no matter how well conceived and operated, can provide only reasonable, not absolute, assurance that the objectives of the control system are met. Further, the design of a control system must reflect the fact that there are resource constraints, and the benefits of controls must be considered relative to their costs. Because of the inherent limitations in all control systems, no evaluation of controls can provide absolute assurance that all control issues and instances of fraud, if any, have been detected. These inherent limitations include the realities that judgments in decision making can be faulty, and that breakdowns can occur because of a simple error or mistake. Additionally, controls can be circumvented by the individual acts of some persons, by collusion of two or more people or by management override of the controls. The design of any system of controls is also based in part upon certain assumptions about the likelihood of future events, and there can be no assurance that any design will succeed in achieving its stated goals under all potential future conditions; over time, controls may become inadequate because of changes in conditions, or the degree of compliance with policies or procedures may deteriorate. Because of the inherent limitations in a cost effective control system, misstatements due to error or fraud may occur and not be detected.
Changes in Internal Control Over Financial Reporting
There was no change in our internal controls over financial reporting during the fourth quarter of fiscal 2021 that has materially affected, or is reasonable likely to affect, our internal controls over financial reporting.
Item 9B. Other Information
There is no disclosure to report pursuant to Item 9B.
Item 9C. Disclosure Regarding Foreign Jurisdictions that Prevent Inspections
There is no disclosure to report pursuant to Item 9C.
PART III
Item 10. Directors, Executive Officers and Corporate Governance
The information required by this Item is incorporated by reference to the definitive Proxy Statement for our 2022 Annual Meeting of Stockholders, which will be filed with the SEC no later than 120 days after December 31, 2021 pursuant to Regulation 14A.
We have adopted a Code of Ethics applicable for the Chief Executive Officer and Senior Financial Officers and a Code of Business Conduct, which are both "Code(s) of Ethics for Senior Financial Officers" as defined by applicable rules of the SEC. This information is incorporated by reference to the Equinix Proxy Statement for the 2022 Annual Meeting of Stockholders and is also available on our website, www.equinix.com.
Item 11. Executive Compensation
The information required by this Item is incorporated by reference to the definitive Proxy Statement for our 2022 Annual Meeting of Stockholders, which will be filed with the SEC no later than 120 days after December 31, 2021 pursuant to Regulation 14A.
Item 12. Security Ownership of Certain Beneficial Owners and Management and Related Stockholder Matters
Information required by this item is incorporated by reference to the Equinix Proxy Statement for the 2022 Annual Meeting of Stockholders, which will be filed with the SEC no later than 120 days after December 31, 2021 pursuant to Regulation 14A.
Item 13. Certain Relationships and Related Transactions, and Director Independence
The information required by this Item is incorporated by reference to the definitive Proxy Statement for our 2022 Annual Meeting of Stockholders, which will be filed with the SEC no later than 120 days after December 31, 2021 pursuant to Regulation 14A.
Item 14. Principal Accountant Fees and Services
The information required by this Item is incorporated by reference to the definitive Proxy Statement for our 2022 Annual Meeting of Stockholders, which will be filed with the SEC no later than 120 days after December 31, 2021 pursuant to Regulation 14A.
PART IV
Item 15. Exhibits, Financial Statement Schedules
(a)(1) Financial Statements:
(a)(2) Financial statements and schedule:
| Schedule III- Schedule of Real Estate and Accumulated Depreciation at December 31, 2021 with reconciliations for the years ended December 31, 2021, 2020 and 2019 | F-64 |
(a)(3) Exhibits:
| Incorporated by Reference | ||||||||||||||||||||||||||||||||
| Exhibit Number | Exhibit Description | Form | Filing Date/ Period End Date | Exhibit | Filed Herewith | |||||||||||||||||||||||||||
| 101.SCH | Inline XBRL Taxonomy Extension Schema Document. | X | ||||||||||||||||||||||||||||||
| 101.CAL | Inline XBRL Taxonomy Extension Calculation Linkbase Document. | X | ||||||||||||||||||||||||||||||
| 101.DEF | Inline XBRL Taxonomy Extension Definition Linkbase Document. | X | ||||||||||||||||||||||||||||||
| 101.LAB | Inline XBRL Taxonomy Extension Label Linkbase Document. | X | ||||||||||||||||||||||||||||||
| 101.PRE | Inline XBRL Taxonomy Extension Presentation Linkbase Document. | X | ||||||||||||||||||||||||||||||
| 104 | Cover Page Interactive Data File - the cover page interactive data file does not appear in the Interactive Data File because its XBRL tags are embedded within the Inline XBRL document. | X |
** Management contracts or compensation plans or arrangements in which directors or executive officers are eligible to participate.
(b)Exhibits.
See (a) (3) above.
(c)Financial Statement Schedule.
See (a) (2) above.
Item 16. Form 10-K Summary
Not applicable.
Signatures
Pursuant to the requirements of Section 13 or 15(d) of the Securities Exchange Act of 1934, the registrant has duly caused this Annual Report on Form 10-K to be signed on its behalf by the undersigned, thereunto duly authorized.
| EQUINIX, INC. (Registrant) | ||||||||
| February 18, 2022 | By | /s/ CHARLES MEYERS | ||||||
| Charles Meyers | ||||||||
| Chief Executive Officer and President |
Power of Attorney
KNOW ALL PERSONS BY THESE PRESENTS, that each person whose signature appears below constitutes and appoints Charles Meyers or Keith D. Taylor, or either of them, each with the power of substitution, their attorney-in-fact, to sign any amendments to this Annual Report on Form 10-K (including post-effective amendments), and to file the same, with exhibits thereto and other documents in connection therewith, with the Securities and Exchange Commission, hereby ratifying and confirming all that each of said attorneys-in-fact, or their substitute or substitutes, may do or cause to be done by virtue hereof.
Pursuant to the requirements of the Securities Exchange Act of 1934, this report has been signed below by the following persons on behalf of the registrant and in the capacities and on the dates indicated.
| Signature | Title | Date | ||||||
| /s/ CHARLES MEYERS | Chief Executive Officer and President (Principal Executive Officer) | February 18, 2022 | ||||||
| Charles Meyers | ||||||||
| /s/ KEITH D. TAYLOR | Chief Financial Officer (Principal Financial Officer) | February 18, 2022 | ||||||
| Keith D. Taylor | ||||||||
| /s/ SIMON MILLER | Chief Accounting Officer (Principal Accounting Officer) | February 18, 2022 | ||||||
| Simon Miller | ||||||||
| /s/ PETER F. VAN CAMP | Executive Chairman | February 18, 2022 | ||||||
| Peter F. Van Camp | ||||||||
| /s/ NANCI CALDWELL | Director | February 18, 2022 | ||||||
| Nanci Caldwell | ||||||||
| /s/ ADAIRE FOX-MARTIN | Director | February 18, 2022 | ||||||
| Adaire Fox-Martin | ||||||||
| Director | ||||||||
| Ron Guerrier | ||||||||
| /s/ GARY F. HROMADKO | Director | February 18, 2022 | ||||||
| Gary F. Hromadko | ||||||||
| /s/ IRVING F. LYONS, III | Director | February 18, 2022 | ||||||
| Irving F. Lyons, III | ||||||||
| /s/ CHRISTOPHER B. PAISLEY | Director | February 18, 2022 | ||||||
| Christopher B. Paisley | ||||||||
| /s/ SANDRA RIVERA | Director | February 18, 2022 | ||||||
| Sandra Rivera |
Index to Exhibits
Showing the first 8K of 347K characters. Open the full section