 filings.tools
Essex Property Trust 10-K 2019-12-31
Filed 2020-02-20. 22 sections, 619K characters. Original on sec.gov · Markdown · JSON
Cover and table of contents
UNITED STATES
SECURITIES AND EXCHANGE COMMISSION
Washington, D.C. 20549
FORM 10-K
(MARK ONE)
☒ ANNUAL REPORT PURSUANT TO SECTION 13 OR 15(d) OF THE SECURITIES EXCHANGE ACT OF 1934
For the fiscal year ended December 31, 2019
OR
☐ TRANSITION REPORT PURSUANT TO SECTION 13 OR 15(d) OF THE SECURITIES EXCHANGE ACT OF 1934
For the transition period from ___________ to _____________
Commission file number: 001-13106 (Essex Property Trust, Inc.)
Commission file number: 333-44467-01 (Essex Portfolio, L.P.)
ESSEX PROPERTY TRUST, INC.
ESSEX PORTFOLIO, L.P.
(Exact name of Registrant as Specified in its Charter)
| Maryland | 77-0369576 | |
| (Essex Property Trust, Inc.) | (Essex Property Trust, Inc.) | |
| California | 77-0369575 | |
| (Essex Portfolio, L.P.) | (Essex Portfolio, L.P.) | |
| (State or Other Jurisdiction of Incorporation or Organization) | (I.R.S. Employer Identification Number) |
1100 Park Place, Suite 200
San Mateo**,** California 94403
(Address of Principal Executive Offices including Zip Code)
(650) 655-7800
(Registrant's Telephone Number, Including Area Code)
Securities registered pursuant to Section 12(b) of the Act:
| Title of each class | Trading Symbol(s) | Name of each exchange on which registered | ||
| Common Stock, $.0001 par value (Essex Property Trust, Inc.) | ESS | New York Stock Exchange |
Securities registered pursuant to Section 12(g) of the Act: None
Indicate by check mark if the registrant is a well-known seasoned issuer, as defined in Rule 405 of the Securities Act.
| Essex Property Trust, Inc. | Yes | ☒ | No | ☐ | Essex Portfolio, L.P. | Yes | ☐ | No | ☒ |
Indicate by check mark if the registrant is not required to file reports pursuant to Section 13 or Section 15(d) of the Act.
| Essex Property Trust, Inc. | Yes | ☐ | No | ☒ | Essex Portfolio, L.P. | Yes | ☐ | No | ☒ |
Indicate by check mark whether the registrant (1) has filed all reports required to be filed by Section 13 or 15(d) of the Securities Exchange Act of 1934 during the preceding 12 months (or for such shorter period that the registrant was required to file such reports), and (2) has been subject to such filing requirements for the past 90 days.
| Essex Property Trust, Inc. | Yes | ☒ | No | ☐ | Essex Portfolio, L.P. | Yes | ☒ | No | ☐ |
Indicate by check mark whether the registrant has submitted electronically every Interactive Data File required to be submitted pursuant to Rule 405 of Regulation S-T (§232.405 of this chapter) during the preceding 12 months (or for such shorter period that the registrant was required to submit such files).
| Essex Property Trust, Inc. | Yes | ☒ | No | ☐ | Essex Portfolio, L.P. | Yes | ☒ | No | ☐ |
Indicate by check mark whether the registrant is a large accelerated filer, an accelerated filer, a non-accelerated filer, a smaller reporting company, or an emerging growth company. See the definitions of "large accelerated filer," "accelerated filer," "smaller reporting company," and "emerging growth company" in Rule 12b-2 of the Exchange Act.
Essex Property Trust, Inc.:
| Large accelerated filer | ☒ | Accelerated filer | ☐ | Non-accelerated filer | ☐ | Smaller reporting company | ☐ |
| Emerging growth company | ☐ |
Essex Portfolio, L.P.:
| Large accelerated filer | ☐ | Accelerated filer | ☐ | Non-accelerated filer | ☒ | Smaller reporting company | ☐ |
| Emerging growth company | ☐ |
If an emerging growth company, indicate by check mark if the registrant has elected not to use the extended transition period for complying with any new or revised financial accounting standards provided pursuant to Section 13(a) of the Exchange Act.
| Essex Property Trust, Inc. | ☐ | Essex Portfolio, L.P. | ☐ |
Indicate by check mark whether the registrant is a shell company (as defined in Rule 12b-2 of the Act).
| Essex Property Trust, Inc. | Yes | ☐ | No | ☒ | Essex Portfolio, L.P. | Yes | ☐ | No | ☒ |
As of June 30, 2019, the aggregate market value of the voting stock held by non-affiliates of Essex Property Trust, Inc. was $19,060,937,030. The aggregate market value was computed with reference to the closing price on the New York Stock Exchange on the last trading day preceding such date. Shares of common stock held by executive officers, directors and holders of more than ten percent of the outstanding common stock have been excluded from this calculation because such persons may be deemed to be affiliates. This exclusion does not reflect a determination that such persons are affiliates for any other purposes. There is no public trading market for the common units of Essex Portfolio, L.P. As a result, the aggregate market value of the common units held by non-affiliates of Essex Portfolio, L.P. cannot be determined.
As of February 18, 2020, 66,172,080 shares of common stock ($.0001 par value) of Essex Property Trust, Inc. were outstanding.
DOCUMENTS INCORPORATED BY REFERENCE:
Portions of the definitive Proxy Statement to be filed with the Securities and Exchange Commission (the "SEC") pursuant to Regulation 14A in connection with the 2020 annual meeting of stockholders of Essex Property Trust, Inc. are incorporated by reference in Part III of this Annual Report on Form 10-K. Such Proxy Statement will be filed with the SEC within 120 days of
December 31, 2019.
EXPLANATORY NOTE
This report combines the annual reports on Form 10-K for the year ended December 31, 2019 of Essex Property Trust, Inc., a Maryland corporation, and Essex Portfolio, L.P., a Delaware limited partnership of which Essex Property Trust, Inc. is the sole general partner.
Unless stated otherwise or the context otherwise requires, references to the "Company," "we," "us," or "our" mean collectively Essex Property Trust, Inc. and those entities/subsidiaries owned or controlled by Essex Property Trust, Inc., including Essex Portfolio, L.P., and references to the "Operating Partnership," or "EPLP" mean Essex Portfolio, L.P. and those entities/subsidiaries owned or controlled by Essex Portfolio, L.P. Unless stated otherwise or the context otherwise requires, references to "Essex" mean Essex Property Trust, Inc., not including any of its subsidiaries.
Essex operates as a self-administered and self-managed real estate investment trust ("REIT"), and is the sole general partner of the Operating Partnership. As of December 31, 2019, Essex owned approximately 96.6% of the ownership interest in the Operating Partnership with the remaining 3.4% interest owned by limited partners. As the sole general partner of the Operating Partnership, Essex has exclusive control of the Operating Partnership's day-to-day management.
The Company is structured as an umbrella partnership REIT ("UPREIT") and Essex contributes all net proceeds from its various equity offerings to the Operating Partnership. In return for those contributions, Essex receives a number of Operating Partnership limited partnership units ("OP Units," and the holders of such OP Units, "Unitholders") equal to the number of shares of common stock it has issued in the equity offerings. Contributions of properties to the Company can be structured as tax-deferred transactions through the issuance of OP Units, which is one of the reasons why the Company is structured in the manner outlined above. Based on the terms of the Operating Partnership's partnership agreement, OP Units can be exchanged into Essex common stock on a one-for-one basis. The Company maintains a one-for-one relationship between the OP Units issued to Essex and shares of common stock.
The Company believes that combining the reports on Form 10-K of Essex and the Operating Partnership into this single report provides the following benefits:
| • | enhances investors' understanding of Essex and the Operating Partnership by enabling investors to view the business as a whole in the same manner as management views and operates the business; |
| • | eliminates duplicative disclosure and provides a more streamlined and readable presentation since a substantial portion of the disclosure applies to both Essex and the Operating Partnership; and |
| • | creates time and cost efficiencies through the preparation of one combined report instead of two separate reports. |
Management operates Essex and the Operating Partnership as one business. The management of Essex consists of the same members as the management of the Operating Partnership.
All of the Company's property ownership, development, and related business operations are conducted through the Operating Partnership and Essex has no material assets, other than its investment in the Operating Partnership. Essex's primary function is acting as the general partner of the Operating Partnership. As general partner with control of the Operating Partnership, Essex consolidates the Operating Partnership for financial reporting purposes. Therefore, the assets and liabilities of Essex and the Operating Partnership are the same on their respective financial statements. Essex also issues equity from time to time and guarantees certain debt of the Operating Partnership, as disclosed in this report. The Operating Partnership holds substantially all of the assets of the Company, including the Company's ownership interests in its co-investments. The Operating Partnership conducts the operations of the business and is structured as a partnership with no publicly traded equity. Except for the net proceeds from equity offerings by the Company, which are contributed to the capital of the Operating Partnership in exchange for OP Units (on a one-for-one share of common stock per OP Unit basis), the Operating Partnership generates all remaining capital required by the Company's business. These sources of capital include the Operating Partnership's working capital, net cash provided by operating activities, borrowings under its revolving credit facilities, the issuance of secured and unsecured debt and equity securities and proceeds received from disposition of certain properties and co-investments.
The Company believes it is important to understand the few differences between Essex and the Operating Partnership in the context of how Essex and the Operating Partnership operate as a consolidated company. Stockholders' equity, partners' capital and noncontrolling interest are the main areas of difference between the consolidated financial statements of Essex and those of the Operating Partnership. The limited partners of the Operating Partnership are accounted for as partners' capital in the Operating Partnership's consolidated financial statements and as noncontrolling interest in Essex's consolidated financial statements. The noncontrolling interest in the Operating Partnership's consolidated financial statements include the interest of unaffiliated partners in various consolidated partnerships and co-investment partners. The noncontrolling interest in Essex's
iii
consolidated financial statements include (i) the same noncontrolling interest as presented in the Operating Partnership’s consolidated financial statements and (ii) OP Unitholders. The differences between stockholders' equity and partners' capital result from differences in the equity issued at Essex and Operating Partnership levels.
To help investors understand the significant differences between Essex and the Operating Partnership, this report provides separate consolidated financial statements for Essex and the Operating Partnership; a single set of consolidated notes to such financial statements that includes separate discussions of stockholders' equity or partners' capital, and earnings per share/unit, as applicable; and a combined Management's Discussion and Analysis of Financial Condition and Results of Operations.
This report also includes separate Part II, Item 9A. Controls and Procedures sections and separate Exhibits 31 and 32 certifications for each of Essex and the Operating Partnership in order to establish that the requisite certifications have been made and that Essex and the Operating Partnership are compliant with Rule 13a-15 or Rule 15d-15 of the Securities Exchange Act of 1934 (the "Exchange Act") and 18 U.S.C. §1350.
In order to highlight the differences between Essex and the Operating Partnership, the separate sections in this report for Essex and the Operating Partnership specifically refer to Essex and the Operating Partnership. In the sections that combine disclosure of Essex and the Operating Partnership, this report refers to actions or holdings as being actions or holdings of the Company. Although the Operating Partnership is generally the entity that directly or indirectly enters into contracts and co-investments and holds assets and debt, reference to the Company is appropriate because the Company is one business and the Company operates that business through the Operating Partnership. The separate discussions of Essex and the Operating Partnership in this report should be read in conjunction with each other to understand the results of the Company on a consolidated basis and how management operates the Company.
The information furnished in the accompanying consolidated balance sheets, statements of income, comprehensive income, equity, capital, and cash flows of the Company and the Operating Partnership reflect all adjustments which are, in the opinion of management, necessary for a fair presentation of the aforementioned consolidated financial statements for the periods and are normal and recurring in nature, except as otherwise noted.
The accompanying consolidated financial statements should be read in conjunction with the notes to such consolidated financial statements and Management's Discussion and Analysis of Financial Condition and Results of Operations herein.
iv
ESSEX PROPERTY TRUST, INC.
ESSEX PORTFOLIO, L.P.
2019 ANNUAL REPORT ON FORM 10-K
TABLE OF CONTENTS
v
PART I
Forward-Looking Statements
This Form 10-K contains forward-looking statements within the meaning of Section 27A of the Securities Act of 1933, as amended (the "Securities Act") and Section 21E of the Exchange Act. Such forward-looking statements are described in Item 7, Management’s Discussion and Analysis of Financial Condition and Results of Operations, "Forward-Looking Statements." Actual results could differ materially from those set forth in each forward-looking statement. Certain factors that might cause such a difference are discussed in this report, including in Item 1A, Risk Factors of this Form 10-K.
Item 1. Business
OVERVIEW
Essex Property Trust, Inc. ("Essex"), a Maryland corporation, is an S&P 500 company that operates as a self-administered and self-managed real estate investment trust ("REIT"). Essex owns all of its interest in its real estate and other investments directly or indirectly through Essex Portfolio, L.P. (the "Operating Partnership" or "EPLP"). Essex is the sole general partner of the Operating Partnership and as of December 31, 2019, had an approximately 96.6% general partnership interest in the Operating Partnership. In this report, the terms the "Company," "we," "us," and "our" also refer to Essex Property Trust, Inc., the Operating Partnership and those entities/subsidiaries owned or controlled by Essex and/or the Operating Partnership.
Essex has elected to be treated as a REIT for federal income tax purposes, commencing with the year ended December 31, 1994. Essex completed its initial public offering on June 13, 1994. In order to maintain compliance with REIT tax rules, the Company utilizes taxable REIT subsidiaries for various revenue generating or investment activities. All taxable REIT subsidiaries are consolidated by the Company for financial reporting purposes.
The Company is engaged primarily in the ownership, operation, management, acquisition, development and redevelopment of predominantly apartment communities, located along the West Coast of the United States. As of December 31, 2019, the Company owned or had ownership interests in 250 operating apartment communities, aggregating 60,570 apartment homes, excluding the Company's ownership in preferred equity co-investments, loan investments, one operating commercial building, and a development pipeline comprised of five consolidated projects and two unconsolidated joint venture projects aggregating 1,960 apartment homes (collectively, the "Portfolio").
The Company’s website address is http://www.essex.com. The Company’s annual reports on Form 10-K, quarterly reports on Form 10-Q, current reports on Form 8-K and all amendments to those reports, and the Proxy Statement for its Annual Meeting of Stockholders are available, free of charge, on its website as soon as practicable after the Company files the reports with the U.S. Securities and Exchange Commission ("SEC").
BUSINESS STRATEGIES
The following is a discussion of the Company’s business strategies in regards to real estate investment and management.
Business Strategies
Research Driven Approach to Investments – The Company believes that successful real estate investment decisions and portfolio growth begin with extensive regional economic research and local market knowledge. The Company continually assesses markets where the Company operates, as well as markets where the Company considers future investment opportunities by evaluating markets and focusing on the following strategic criteria:
| • | Major metropolitan areas that have regional population in excess of one million; |
| • | Constraints on new supply driven by: (i) low availability of developable land sites where competing housing could be economically built; (ii) political growth barriers, such as protected land, urban growth boundaries, and potential lengthy and expensive development permit processes; and (iii) natural limitations to development, such as mountains or waterways; |
| • | Rental demand enhanced by affordability of rents relative to costs of for-sale housing; and |
| • | Housing demand based on job growth, proximity to jobs, high median incomes and the quality of life including related commuting factors. |
Recognizing that all real estate markets are cyclical, the Company regularly evaluates the results of its regional economic, and local market research, and adjusts the geographic focus of its portfolio accordingly. The Company seeks to increase its portfolio
allocation in markets projected to have the strongest local economies and to decrease allocations in markets projected to have declining economic conditions. Likewise, the Company also seeks to increase its portfolio allocation in markets that have attractive property valuations and to decrease allocations in markets that have inflated valuations and low relative yields.
Property Operations – The Company manages its communities by focusing on activities that may generate above-average rental growth, tenant retention/satisfaction and long-term asset appreciation. The Company intends to achieve this by utilizing the strategies set forth below:
| • | Property Management – Oversee delivery and quality of the housing provided to our tenants and manage the properties financial performance. |
| • | Capital Preservation – The Company's asset management services are responsible for the planning, budgeting and completion of major capital improvement projects at the Company’s communities. |
| • | Business Planning and Control – Comprehensive business plans are implemented in conjunction with significant investment decisions. These plans include benchmarks for future financial performance based on collaborative discussions between on-site managers, the operations leadership team, and senior management. |
| • | Development and Redevelopment – The Company focuses on acquiring and developing apartment communities in supply constrained markets, and redeveloping its existing communities to improve the financial and physical aspects of the Company’s communities. |
CURRENT BUSINESS ACTIVITIES
Acquisitions of Real Estate Interests
Acquisitions are an important component of the Company’s business plan, and during 2019, the Company acquired ownership interests in eight communities comprised of 2,007 apartment homes for a total contract price of $856.5 million.
The following is a summary of 2019 acquisitions ($ in millions):
| Property Name | Location | Apartment Homes | Essex Ownership Percentage | Ownership | Quarter in 2019 | Purchase Price | |||||||||||
| One South Market(1) | San Jose, CA | 312 | 100 | % | EPLP | Q1 | $ | 80.6 | |||||||||
| Brio(2) | Walnut Creek, CA | 300 | N/A | EPLP | Q2 | 164.9 | (3) | ||||||||||
| The Courtyards at 65th Street | Emeryville, CA | 331 | 50 | % | WESCO V | Q3 | 178.0 | (3) | |||||||||
| 777 Hamilton | Menlo Park, CA | 195 | 50 | % | BEX IV | Q3 | 148.0 | (3) | |||||||||
| Township | Redwood City, CA | 132 | 100 | % | EPLP | Q3 | 88.7 | ||||||||||
| Velo and Ray | Seattle, WA | 308 | 50 | % | WESCO V | Q4 | 133.0 | (3) | |||||||||
| Pure Redmond | Redmond, WA | 105 | 100 | % | EPLP | Q4 | 39.1 | ||||||||||
| Hidden Valley(4) | Simi Valley, CA | 324 | 100 | % | EPLP | Q4 | 24.2 | ||||||||||
| Total 2019 | 2,007 | $ | 856.5 |
| (1) | In March 2019, the Company purchased the joint venture partner's 45% membership interest in the One South Market co-investment based on an estimated property valuation of $179.0 million. In conjunction with the acquisition, $86.0 million of mortgage debt that encumbered the property was repaid. |
| (2) | In June 2019, the Company acquired Brio for a total contract price of $164.9 million in a DownREIT transaction. As part of the acquisition, the Company assumed $98.7 million of mortgage debt in the community. |
| (3) | Contract prices represent the total contract price at 100%. |
| (4) | In December 2019, the Company purchased the joint venture partner's 25% ownership interest in Hidden Valley, a consolidated community, based on an estimated property valuation of $97.0 million and an encumbrance of $29.7 million of mortgage debt. |
Dispositions of Real Estate
As part of its strategic plan to own quality real estate in supply-constrained markets, the Company continually evaluates all of its communities and sells those which no longer meet its strategic criteria. The Company may use the capital generated from the dispositions to invest in higher-return communities or other real estate investments, or to repay debts. The Company believes that the sale of these communities will not have a material impact on its future results of operations or cash flows nor will their sale materially affect its ongoing operations. Generally, the Company seeks to have any impact of longer-term earnings dilution resulting from these dispositions offset by the positive impact from reinvesting proceeds.
In October 2019, a Canada Pension Plan Investment Board ("CPPIB" or "CPP") joint venture, in which the Company had a 55.0% ownership interest at the time, sold Mosso, a 463 unit apartment home community located in San Francisco, CA, for $311.0 million, resulting in a gain of $50.2 million for the Company.
In October 2019, the Company sold a land parcel adjacent to the Mylo development community located in Santa Clara, CA, for $10.8 million and recorded an immaterial gain.
In December 2019, the Company sold land located in San Mateo, CA, that had been held for future development for $12.5 million and recorded a loss of $3.2 million.
Development Pipeline
The Company defines development projects as new communities that are being constructed, or are newly constructed and are in a phase of lease-up and have not yet reached stabilized operations. As of December 31, 2019, the Company's development pipeline was comprised of five consolidated projects under development and two unconsolidated joint venture projects under development aggregating 1,960 apartment homes, with total incurred costs of $1.0 billion, and estimated remaining project costs of approximately $222.0 million, $193.0 million of which represents the Company's estimated remaining costs, for total estimated project costs of $1.3 billion.
The Company defines predevelopment projects as proposed communities in negotiation or in the entitlement process with an expected high likelihood of becoming entitled development projects. As of December 31, 2019, the Company had various consolidated predevelopment projects. The Company may also acquire land for future development purposes or sale.
The following table sets forth information regarding the Company’s development pipeline ($ in millions):
| As of | |||||||||||||||
| 12/31/2019 | |||||||||||||||
| Essex | Estimated | Incurred | Estimated | ||||||||||||
| Development Pipeline | Location | Ownership% | Apartment Homes | Project Cost (1) | Project Cost**(1)** | ||||||||||
| Development Projects - Consolidated | |||||||||||||||
| Station Park Green - Phase II | San Mateo, CA | 100% | 199 | $ | 135 | $ | 141 | ||||||||
| Station Park Green - Phase III | San Mateo, CA | 100% | 172 | 119 | 134 | ||||||||||
| Station Park Green - Phase IV | San Mateo, CA | 100% | 107 | 16 | 94 | ||||||||||
| Mylo (2) | Santa Clara, CA | 100% | 476 | 197 | 226 | ||||||||||
| Wallace on Sunset (3) | Hollywood, CA | 100% | 200 | 70 | 105 | ||||||||||
| Total Development Projects - Consolidated | 1,154 | 537 | 700 | ||||||||||||
| Development Projects - Joint Venture | |||||||||||||||
| Patina at Midtown (4) | San Jose, CA | 50% | 269 | 115 | 136 | ||||||||||
| 500 Folsom (5) | San Francisco, CA | 50% | 537 | 377 | 415 | ||||||||||
| Total Development Projects - Joint Venture | 806 | 492 | 551 | ||||||||||||
| Predevelopment Projects - Consolidated | |||||||||||||||
| Other Projects | Various | 100% | — | 20 | 20 | ||||||||||
| Total - Consolidated Predevelopment Projects | — | 20 | 20 | ||||||||||||
| Grand Total - Development and Predevelopment Pipeline | 1,960 | $ | 1,049 | $ | 1,271 |
| (1) | Includes costs related to the entire project, including both the Company's and joint venture partners' costs. Includes incurred costs and estimated costs to complete these development projects. For predevelopment projects, only incurred costs are included in estimated costs. |
| (2) | Mylo was previously named Gateway Village. |
| (3) | Wallace on Sunset was previously named Essex Hollywood. |
| (4) | Patina at Midtown was previously named Ohlone. |
| (5) | Estimated project cost for this development is net of a projected value for low-income housing tax credit proceeds and the value of the tax exempt bond structure. |
Redevelopment Pipeline
The Company defines the redevelopment pipeline as existing properties owned or recently acquired, which have been targeted for additional investment by the Company with the expectation of increased financial returns through property improvement. During redevelopment, apartment homes may not be available for rent and, as a result, may have less than stabilized operations. As of December 31, 2019, the Company had ownership interests in four major redevelopment communities aggregating 1,327 apartment homes with estimated redevelopment costs of $132.7 million, of which approximately $14.9 million remains to be expended.
Long Term Debt
During 2019, the Company made regularly scheduled principal payments and loan payoffs of $951.6 million of its secured mortgage notes payable at an average interest rate of 4.2%.
In February 2019, the Company issued $350.0 million of senior unsecured notes due on March 1, 2029, with a coupon rate of 4.000% per annum (the "2029 Notes"), which are payable on March 1 and September 1 of each year, beginning on September 1, 2019. The 2029 Notes were offered to investors at a price of 99.188% of the principal amount thereof. The 2029 Notes are general unsecured senior obligations of the Operating Partnership, rank equally in right of payment with all other senior
unsecured indebtedness of the Operating Partnership and are unconditionally guaranteed by Essex Property Trust, Inc. In March 2019, the Company issued an additional $150.0 million of the 2029 Notes at a price of 100.717% of the principal amount thereof. These additional notes have substantially identical terms as the 2029 Notes issued in February 2019. The Company used the net proceeds of these offerings to repay indebtedness under its unsecured lines of credit and for other general corporate and working capital purposes.
In August 2019, the Company issued $400.0 million of senior unsecured notes due on January 15, 2030, with a coupon rate of 3.000% per annum (the "2030 Notes"), which are payable on January 15 and July 15 of each year, beginning on January 15, 2020. The 2030 Notes were offered to investors at a price of 98.632% of the principal amount thereof. The 2030 Notes are general unsecured senior obligations of the Operating Partnership, rank equally in right of payment with all other senior unsecured indebtedness of the Operating Partnership and are unconditionally guaranteed by Essex Property Trust, Inc. In October 2019, the Company issued an additional $150.0 million of the 2030 notes at a price of 101.685% of the principal amount thereof. These additional notes have substantially identical terms as the 2030 Notes issued in August 2019. The Company used the net proceeds of these offerings to prepay certain secured indebtedness under outstanding mortgage notes, to repay indebtedness under its unsecured lines of credit and for other general corporate and working capital purposes.
Bank Debt
As of December 31, 2019, Fitch Ratings, Moody’s Investor Service, and Standard and Poor's ("S&P") credit agencies rated Essex Property Trust, Inc. and Essex Portfolio, L.P. BBB+/Stable, Baa1/Stable, and BBB+/Stable, respectively.
At December 31, 2019, the Company had two unsecured lines of credit aggregating $1.24 billion. The Company's $1.2 billion credit facility had an interest rate of the London Interbank Offered Rate ("LIBOR") plus 0.825%, with a scheduled maturity date in December 2022 with one 18-month extension, exercisable at the Company's option. In January 2020, the line of credit facility was amended such that the scheduled maturity date was extended to December 2023 with one 18-month extension, exercisable at the Company's option. The underlying interest rate on the amended line is based on a tiered rate structure tied to the Company's corporate ratings and is currently at LIBOR plus 0.825%. The Company's $35.0 million working capital unsecured line of credit had an interest rate of LIBOR plus 0.825%, with a scheduled maturity date in February 2021.
Equity Transactions
During the year ended December 31, 2019, the Company issued 228,271 shares of common stock through its equity distribution program at an average price of $321.56 per share for proceeds of $73.4 million. As of December 31, 2019, there were no outstanding forward sale agreements, and $826.6 million of shares remain available to be sold under this program.
In January 2019, the Company repurchased and retired 234,061 shares of its common stock totaling $57.0 million, including commissions, at an average price of $243.48 per share. In February 2019, the board of directors approved the replenishment of the stock repurchase plan such that, as of such date, the Company had $250.0 million of purchase authority remaining under the replenished plan. The Company did not repurchase any additional shares during the year ended December 31, 2019, such that as of December 31, 2019, the Company had $250.0 million of purchase authority remaining under the stock repurchase plan.
Co-investments
The Company has entered into, and may continue in the future to enter into, joint ventures or partnerships (including limited liability companies) through which we own an indirect economic interest in less than 100% of the community or land or other investments owned directly by the joint venture or partnership. For each joint venture the Company holds a non-controlling interest in the venture and earns customary management fees and may earn development fees, asset property management fees, and a promote interest.
The Company has also made, and may continue in the future to make, preferred equity investments in various multifamily development projects. The Company earns a preferred rate of return on these investments.
OFFICES AND EMPLOYEES
The Company is headquartered in San Mateo, CA, and has regional offices in Woodland Hills, CA; Irvine, CA; San Diego, CA and Bellevue, WA. As of December 31, 2019, the Company had 1,822 employees.
INSURANCE
The Company purchases general liability and property insurance coverage, including loss of rent, for each of its communities. The Company also purchases limited earthquake, terrorism, environmental and flood insurance. There are certain types of losses which may not be covered or could exceed coverage limits. The insurance programs are subject to deductibles and self-insured retentions in varying amounts. The Company utilizes a wholly owned insurance subsidiary, Pacific Western Insurance LLC ("PWI") to self-insure certain earthquake and property losses. As of December 31, 2019, PWI had cash and marketable securities of approximately $78.4 million, and is consolidated in the Company's financial statements.
All of the Company's communities are located in areas that are subject to earthquake activity. The Company evaluates its financial loss exposure to seismic events by using actuarial loss models developed by the insurance industry and in most cases property vulnerability analysis based on structural evaluations by seismic consultants. The Company manages this exposure, where considered appropriate, desirable, and cost-effective, by upgrading properties to increase their resistance to forces caused by seismic events, by considering available funds and coverages provided by PWI and/or by purchasing seismic insurance. In most cases the Company also purchases limited earthquake insurance for certain properties owned by the Company's co-investments.
In addition, the Company carries other types of insurance coverage related to a variety of risks and exposures.
Based on market conditions, the Company may change or potentially eliminate insurance coverages, or increase levels of self-insurance. Further, the Company may incur losses, which could be material, due to uninsured risks, deductibles and self-insured retentions, and/or losses in excess of coverage limits.
COMPETITION
There are numerous housing alternatives that compete with the Company’s communities in attracting tenants. These include other apartment communities, condominiums and single-family homes. If the demand for the Company’s communities is reduced or if competitors develop and/or acquire competing housing, rental rates and occupancy may drop which may have a material adverse effect on the Company’s financial condition and results of operations.
The Company faces competition from other REITs, businesses and other entities in the acquisition, development and operation of apartment communities. Some competitors are larger and have greater financial resources than the Company. This competition may result in increased costs of apartment communities the Company acquires and/or develops.
WORKING CAPITAL
The Company believes that cash flows generated by its operations, existing cash and cash equivalents, marketable securities balances, availability under existing lines of credit, access to capital markets and the ability to generate cash from the disposition of real estate are sufficient to meet all of its reasonably anticipated cash needs during 2020.
The timing, source and amounts of cash flows provided by financing activities and used in investing activities are sensitive to changes in interest rates, stock price, and other fluctuations in the capital markets environment, which can affect the Company’s plans for acquisitions, dispositions, development and redevelopment activities.
ENVIRONMENTAL CONSIDERATIONS
See the discussion under the caption, "Risks Related to Real Estate Investments and Our Operations - The Company’s Portfolio may have environmental liabilities" in Item 1A, Risk Factors, for information concerning the potential effect of environmental regulations on its operations, which discussion under the caption "The Company’s Portfolio may have environmental liabilities" is incorporated by reference into this Item 1.
OTHER MATTERS
Certain Policies of the Company
The Company intends to continue to operate in a manner that will not subject it to regulation under the Investment Company Act of 1940. The Company may in the future (i) issue securities senior to its common stock, (ii) fund acquisition activities with borrowings under its line of credit and (iii) offer shares of common stock and/or units of limited partnership interest in the Operating Partnership or affiliated partnerships as partial consideration for property acquisitions. The Company from time to
time acquires partnership interests in partnerships and joint ventures, either directly or indirectly through subsidiaries of the Company, when such entities’ underlying assets are real estate.
The Company invests primarily in apartment communities that are located in predominantly coastal markets within Southern California, Northern California, and the Seattle metropolitan area. The Company currently intends to continue to invest in apartment communities in such regions. However, these practices may be reviewed and modified periodically by management.
Item 1A. RISK FACTORS
For purposes of this section, the term "stockholders" means the holders of shares of Essex Property Trust, Inc.’s common stock. Set forth below are the risks that we believe are material to Essex Property Trust, Inc.’s stockholders and Essex Portfolio, L.P.’s unitholders. You should carefully consider the following factors in evaluating our Company, our properties and our business.
Our business, operating results, cash flows and financial condition are subject to various risks and uncertainties, including, without limitation, those set forth below, any one of which could cause our actual operating results to vary materially from recent results or from our anticipated future results.
Risks Related to Our Real Estate Investments and Operations
General real estate investment risks may adversely affect property income and values. Real estate investments are subject to a variety of risks. If the communities and other real estate investments do not generate sufficient income to meet operating expenses, including debt service and capital expenditures, cash flow and the ability to make distributions to Essex's stockholders or the Operating Partnership's unitholders will be adversely affected. Income from the communities may be further adversely affected by, among other things, the following factors:
| • | changes in the general or local economic climate, including layoffs, plant closings, industry slowdowns, relocations of significant local employers and other events negatively impacting local employment rates and wages and the local economy; |
| • | local economic conditions in which the communities are located, such as oversupply of housing or a reduction in demand for rental housing; |
| • | the attractiveness and desirability of our communities to tenants, including, without limitation, our technology offerings and our ability to identify and cost effectively implement new, relevant technologies, and to keep up with constantly changing consumer demand for the latest innovations; |
| • | inflationary environments in which the costs to operate and maintain communities increase at a rate greater than our ability to increase rents, or deflationary environments where we may be exposed to declining rents more quickly under our short-term leases; |
| • | competition from other available housing alternatives; |
| • | changes in rent control or stabilization laws or other laws regulating housing; |
| • | the Company’s ability to provide for adequate maintenance and insurance; |
| • | declines in the financial condition of our tenants, which may make it more difficult for us to collect rents from some tenants; |
| • | tenants' perceptions of the safety, convenience and attractiveness of our communities and the neighborhoods where they are located; and |
| • | changes in interest rates and availability of financing. |
As leases at the communities expire, tenants may enter into new leases on terms that are less favorable to the Company. Income and real estate values also may be adversely affected by such factors as applicable laws, including, without limitation, the Americans with Disabilities Act of 1990 (the "Disabilities Act"), Fair Housing Amendment Act of 1988 (the "FHAA"), permanent and temporary rent control laws, rent stabilization laws, other laws regulating housing that may prevent the Company from raising rents to offset increased operating expenses, and tax laws.
Short-term leases expose us to the effects of declining market rents, and the Company may be unable to renew leases or relet units as leases expire. Substantially all of our apartment leases are for a term of one year or less. If the Company is unable to promptly renew the leases or relet the units, or if the rental rates upon renewal or reletting are significantly lower than expected rates, then the Company’s results of operations and financial condition will be adversely affected. With these short term leases, our rental revenues are impacted by declines in market rents more quickly than if our leases were for longer terms.
National and regional economic environments can negatively impact the Company’s liquidity and operating results. The Company's forecast for the national economy assumes growth of the gross domestic product of the national economy and the economies of the west coast states. In the event of a recession, the Company could incur reductions in rental rates, occupancy levels, property valuations and increases in operating costs such as advertising and turnover expenses. A recession may affect consumer confidence and spending and negatively impact the volume and pricing of real estate transactions, which could negatively affect the Company’s liquidity and its ability to vary its portfolio promptly in response to changes to the economy. Furthermore, if residents do not experience increases in their income, they may be unable or unwilling to pay rent increases, and delinquencies in rent payments and rent defaults may increase.
Rent control, or other changes in applicable laws, or noncompliance with applicable laws, could adversely affect the Company's operations or expose us to liability. The Company must own, operate, manage, acquire, develop and redevelop its properties in compliance with numerous federal, state and local laws and regulations, some of which may conflict with one another or be subject to limited judicial or regulatory interpretations. These laws and regulations may include zoning laws, building codes, rent control or stabilization laws, federal, state and local tax laws, landlord tenant laws, environmental laws, employment laws, immigration laws and other laws regulating housing or that are generally applicable to the Company's business and operations. Noncompliance with laws could expose the Company to liability. If the Company does not comply with any or all of these requirements, it may have to pay fines to government authorities or damage awards to private litigants, and/or may have to decrease rents in order to comply with such requirements. The Company does not know whether these requirements will change or whether new requirements will be imposed. Changes in, or noncompliance with, these regulatory requirements could require the Company to make significant unanticipated expenditures, which could have a material adverse effect on the Company's financial condition, results of operations or cash flows.
In addition, rent control or rent stabilization laws and other regulatory restrictions may limit our ability to increase rents and pass through new or increased operating costs to our tenants. There has been a recent increase in municipalities, including those in which we own properties, considering or being urged by advocacy groups to consider rent control or rent stabilization laws and regulations or take other actions which could limit our ability to raise rents based solely on market conditions. These initiatives and any other future enactments of rent control or rent stabilization laws or other laws regulating multifamily housing, as well as any lawsuits against the Company arising from such rent control or other laws, may reduce rental revenues or increase operating costs. Such laws and regulations limit our ability to charge market rents, increase rents, evict tenants or recover increases in our operating expenses and could reduce the value of our communities or make it more difficult for us to dispose of properties in certain circumstances. Expenses associated with our investment in these communities, such as debt service, real estate taxes, insurance and maintenance costs, are generally not reduced when circumstances cause a reduction in ren
Showing the first 8K of 129K characters. Open the full section
Item 1B. Unresolved Staff Comments
None**.**
Item 2. Properties
The Company’s portfolio as of December 31, 2019 (including communities owned by unconsolidated joint ventures, but excluding communities underlying preferred equity investments) was comprised of 250 stabilized operating apartment communities (comprising 60,570 apartment homes), of which 26,695 apartment homes are located in Southern California, 21,642 apartment homes are located in Northern California, and 12,233 apartment homes are located in the Seattle metropolitan area. The Company’s apartment communities accounted for 99.3% of the Company’s revenues for the year ended December 31, 2019.
Occupancy Rates
Financial occupancy is defined as the percentage resulting from dividing actual rental income by total potential rental income. Total potential rental income represents the value of all apartment homes, with occupied apartment homes valued at contractual rental rates pursuant to leases and vacant apartment homes valued at estimated market rents. When calculating actual rents for occupied apartment homes and market rents for vacant apartment homes, delinquencies and concessions are not taken into account. The Company believes that financial occupancy is a meaningful measure of occupancy because it considers the value of each vacant unit at its estimated market rate. Financial occupancy may not completely reflect short-term trends in physical occupancy and financial occupancy rates, and the Company's calculation of financial occupancy may not be comparable to financial occupancy as disclosed by other REITs. Market rates are determined using the recently signed effective rates on new leases at the property and are used as the starting point in the determination of the market rates of vacant apartment homes. The Company may increase or decrease these rates based on a variety of factors, including overall supply and demand for housing, concentration of new apartment deliveries within the same submarket which can cause periodic disruption due to greater rental concessions to increase leasing velocity, and rental affordability.
For communities that are development properties in lease-up without stabilized occupancy figures, the Company believes the physical occupancy rate is the appropriate performance metric. While a community is in the lease-up phase, the Company’s primary motivation is to stabilize the property, which may entail the use of rent concessions and other incentives, and thus financial occupancy which is based on contractual income is not considered the best metric to quantify occupancy.
Communities
The Company’s communities are primarily urban and suburban high density wood frame communities comprising of three to seven stories above grade construction with structured parking situated on 1-10 acres of land with densities averaging between 30-80+ units per acre. As of December 31, 2019, the Company’s communities include 103 garden-style, 137 mid-rise, and 10 high-rise communities. Garden-style communities are generally defined as on-grade properties with two and/or three-story buildings with no structured parking while mid-rise communities are generally defined as properties with three to seven story buildings and some structured parking. High-rise communities are typically defined as properties with buildings that are greater than seven stories, are steel or concrete framed, and frequently have structured parking. The communities have an average of approximately 242 apartment homes, with a mix of studio, one-, two- and some three-bedroom apartment homes. A wide variety of amenities are available at the Company’s communities, including covered parking, fireplaces, swimming pools, clubhouses with fitness facilities, playground areas and dog parks.
The Company hires, trains and supervises on-site service and maintenance personnel. The Company believes that the following primary factors enhance the Company’s ability to retain tenants:
| • | located near employment centers; |
| • | attractive communities that are well maintained; and |
| • | proactive customer service. |
Commercial Buildings
The Company owns an office building with approximately 106,716 square feet located in Irvine, CA, of which the Company occupied approximately 14,000 square feet as of December 31, 2019. Furthermore, as of December 31, 2019, the office building's physical occupancy rate was 83% consisting of 6 tenants, including the Company.
Operating Portfolio
The table below describes the Company’s operating portfolio as of December 31, 2019. (See Note 8, "Mortgage Notes Payable" to the Company’s consolidated financial statements included in Part IV, Item 15 of this Annual Report on Form 10-K for more
information about the Company’s secured mortgage debt and Schedule III thereto for a list of secured mortgage loans related to the Company’s portfolio.)
| Apartment | Year | Year | |||||||||||
| Communities (1) | Location | Type | Homes | Built | Acquired | Occupancy**(2)** | |||||||
| Southern California | |||||||||||||
| Alpine Village | Alpine, CA | Garden | 301 | 1971 | 2002 | 97% | |||||||
| Anavia | Anaheim, CA | Mid-rise | 250 | 2009 | 2010 | 97% | |||||||
| Barkley, The (3)(4) | Anaheim, CA | Garden | 161 | 1984 | 2000 | 97% | |||||||
| Park Viridian | Anaheim, CA | Mid-rise | 320 | 2008 | 2014 | 97% | |||||||
| Bonita Cedars | Bonita, CA | Garden | 120 | 1983 | 2002 | 97% | |||||||
| Village at Toluca Lake (5) | Burbank, CA | Mid-rise | 145 | 1974 | 2017 | 96% | |||||||
| Camarillo Oaks | Camarillo, CA | Garden | 564 | 1985 | 1996 | 97% | |||||||
| Camino Ruiz Square | Camarillo, CA | Garden | 159 | 1990 | 2006 | 97% | |||||||
| Pinnacle at Otay Ranch I & II | Chula Vista, CA | Mid-rise | 364 | 2001 | 2014 | 96% | |||||||
| Mesa Village | Clairemont, CA | Garden | 133 | 1963 | 2002 | 98% | |||||||
| Villa Siena | Costa Mesa, CA | Garden | 272 | 1974 | 2014 | 96% | |||||||
| Emerald Pointe | Diamond Bar, CA | Garden | 160 | 1989 | 2014 | 98% | |||||||
| Regency at Encino | Encino, CA | Mid-rise | 75 | 1989 | 2009 | 97% | |||||||
| The Havens (6) | Fountain Valley, CA | Garden | 440 | 1969 | 2014 | 96% | |||||||
| Valley Park | Fountain Valley, CA | Garden | 160 | 1969 | 2001 | 97% | |||||||
| Capri at Sunny Hills (4) | Fullerton, CA | Garden | 102 | 1961 | 2001 | 96% | |||||||
| Haver Hill (7) | Fullerton, CA | Garden | 264 | 1973 | 2012 | 97% | |||||||
| Pinnacle at Fullerton | Fullerton, CA | Mid-rise | 192 | 2004 | 2014 | 96% | |||||||
| Wilshire Promenade | Fullerton, CA | Mid-rise | 149 | 1992 | 1997 | 97% | |||||||
| Montejo Apartments | Garden Grove, CA | Garden | 124 | 1974 | 2001 | 98% | |||||||
| 416 on Broadway | Glendale, CA | Mid-rise | 115 | 2009 | 2010 | 97% | |||||||
| The Henley I | Glendale, CA | Mid-rise | 83 | 1974 | 1999 | 97% | |||||||
| The Henley II | Glendale, CA | Mid-rise | 132 | 1970 | 1999 | 97% | |||||||
| CBC and The Sweeps | Goleta, CA | Garden | 239 | 1962 | 2006 | 98% | |||||||
| Devonshire | Hemet, CA | Garden | 276 | 1988 | 2002 | 97% | |||||||
| Huntington Breakers | Huntington Beach, CA | Mid-rise | 342 | 1984 | 1997 | 97% | |||||||
| The Huntington | Huntington Beach, CA | Garden | 276 | 1975 | 2012 | 96% | |||||||
| Axis 2300 | Irvine, CA | Mid-rise | 115 | 2010 | 2010 | 97% | |||||||
| Hillsborough Park (8) | La Habra, CA | Garden | 235 | 1999 | 1999 | 97% | |||||||
| Village Green | La Habra, CA | Garden | 272 | 1971 | 2014 | 96% | |||||||
| The Palms at Laguna Niguel | Laguna Niguel, CA | Garden | 460 | 1988 | 2014 | 97% | |||||||
| Trabuco Villas | Lake Forest, CA | Mid-rise | 132 | 1985 | 1997 | 97% | |||||||
| Marbrisa | Long Beach, CA | Mid-rise | 202 | 1987 | 2002 | 97% | |||||||
| Pathways at Bixby Village | Long Beach, CA | Garden | 296 | 1975 | 1991 | 96% | |||||||
| 5600 Wilshire | Los Angeles, CA | Mid-rise | 284 | 2008 | 2014 | 97% | |||||||
| Alessio | Los Angeles, CA | Mid-rise | 624 | 2001 | 2014 | 96% | |||||||
| Ashton Sherman Village | Los Angeles, CA | Mid-rise | 264 | 2014 | 2016 | 97% | |||||||
| Avant | Los Angeles, CA | Mid-rise | 440 | 2014 | 2015 | 95% | |||||||
| The Avery | Los Angeles, CA | Mid-rise | 121 | 2014 | 2014 | 97% | |||||||
| Bellerive | Los Angeles, CA | Mid-rise | 63 | 2011 | 2011 | 98% | |||||||
| Belmont Station | Los Angeles, CA | Mid-rise | 275 | 2009 | 2009 | 97% | |||||||
| Bunker Hill | Los Angeles, CA | High-rise | 456 | 1968 | 1998 | 92% | |||||||
| Catalina Gardens | Los Angeles, CA | Mid-rise | 128 | 1987 | 2014 | 96% | |||||||
| Cochran Apartments | Los Angeles, CA | Mid-rise | 58 | 1989 | 1998 | 97% |
| Apartment | Year | Year | |||||||||||
| Communities (1) | Location | Type | Homes | Built | Acquired | Occupancy**(2)** | |||||||
| Emerson Valley Village | Los Angeles, CA | Mid-rise | 144 | 2012 | 2016 | 97% | |||||||
| Gas Company Lofts (7) | Los Angeles, CA | High-rise | 251 | 2004 | 2013 | 97% | |||||||
| The Blake LA | Los Angeles, CA | Mid-rise | 196 | 1979 | 1997 | 97% | |||||||
| Marbella | Los Angeles, CA | Mid-rise | 60 | 1991 | 2005 | 97% | |||||||
| Pacific Electric Lofts (9) | Los Angeles, CA | High-rise | 314 | 2006 | 2012 | 95% | |||||||
| Park Catalina | Los Angeles, CA | Mid-rise | 90 | 2002 | 2012 | 97% | |||||||
| Park Place | Los Angeles, CA | Mid-rise | 60 | 1988 | 1997 | 97% | |||||||
| Regency Palm Court (7) | Los Angeles, CA | Mid-rise | 116 | 1987 | 2014 | 96% | |||||||
| Santee Court | Los Angeles, CA | High-rise | 165 | 2004 | 2010 | 96% | |||||||
| Santee Village | Los Angeles, CA | High-rise | 73 | 2011 | 2011 | 96% | |||||||
| Tiffany Court | Los Angeles, CA | Mid-rise | 101 | 1987 | 2014 | 97% | |||||||
| Wilshire La Brea | Los Angeles, CA | Mid-rise | 478 | 2014 | 2014 | 97% | |||||||
| Windsor Court (7) | Los Angeles, CA | Mid-rise | 95 | 1987 | 2014 | 96% | |||||||
| Windsor Court | Los Angeles, CA | Mid-rise | 58 | 1988 | 1997 | 97% | |||||||
| Aqua Marina Del Rey | Marina Del Rey, CA | Mid-rise | 500 | 2001 | 2014 | 97% | |||||||
| Marina City Club (10) | Marina Del Rey, CA | Mid-rise | 101 | 1971 | 2004 | 97% | |||||||
| Mirabella | Marina Del Rey, CA | Mid-rise | 188 | 2000 | 2000 | 97% | |||||||
| Mira Monte | Mira Mesa, CA | Garden | 354 | 1982 | 2002 | 97% | |||||||
| Hillcrest Park | Newbury Park, CA | Garden | 608 | 1973 | 1998 | 97% | |||||||
| Fairway Apartments at Big Canyon (11) | Newport Beach, CA | Mid-rise | 74 | 1972 | 1999 | 96% | |||||||
| Muse | North Hollywood, CA | Mid-rise | 152 | 2011 | 2011 | 96% | |||||||
| Country Villas | Oceanside, CA | Garden | 180 | 1976 | 2002 | 97% | |||||||
| Mission Hills | Oceanside, CA | Garden | 282 | 1984 | 2005 | 97% | |||||||
| Renaissance at Uptown Orange | Orange, CA | Mid-rise | 460 | 2007 | 2014 | 97% | |||||||
| Mariner's Place | Oxnard, CA | Garden | 105 | 1987 | 2000 | 97% | |||||||
| Monterey Villas | Oxnard, CA | Garden | 122 | 1974 | 1997 | 97% | |||||||
| Tierra Vista | Oxnard, CA | Mid-rise | 404 | 2001 | 2001 | 97% | |||||||
| Arbors at Parc Rose (9) | Oxnard, CA | Mid-rise | 373 | 2001 | 2011 | 97% | |||||||
| The Hallie | Pasadena, CA | Mid-rise | 292 | 1972 | 1997 | 96% | |||||||
| The Stuart | Pasadena, CA | Mid-rise | 188 | 2007 | 2014 | 97% | |||||||
| Villa Angelina | Placentia, CA | Garden | 256 | 1970 | 2001 | 97% | |||||||
| Fountain Park | Playa Vista, CA | Mid-rise | 705 | 2002 | 2004 | 96% | |||||||
| Highridge (4) | Rancho Palos Verdes, CA | Mid-rise | 255 | 1972 | 1997 | 96% | |||||||
| Cortesia | Rancho Santa Margarita, CA | Garden | 308 | 1999 | 2014 | 97% | |||||||
| Pinnacle at Talega | San Clemente, CA | Mid-rise | 362 | 2002 | 2014 | 96% | |||||||
| Allure at Scripps Ranch | San Diego, CA | Mid-rise | 194 | 2002 | 2014 | 97% | |||||||
| Bernardo Crest | San Diego, CA | Garden | 216 | 1988 | 2014 | 96% | |||||||
| Cambridge Park | San Diego, CA | Mid-rise | 320 | 1998 | 2014 | 97% | |||||||
| Carmel Creek | San Diego, CA | Garden | 348 | 2000 | 2014 | 96% | |||||||
| Carmel Landing | San Diego, CA | Garden | 356 | 1989 | 2014 | 96% | |||||||
| Carmel Summit | San Diego, CA | Mid-rise | 246 | 1989 | 2014 | 97% | |||||||
| CentrePointe | San Diego, CA | Garden | 224 | 1974 | 1997 | 97% | |||||||
| Esplanade (6) | San Diego, CA | Garden | 616 | 1986 | 2014 | 96% | |||||||
| Form 15 | San Diego, CA | Mid-rise | 242 | 2014 | 2016 | 96% | |||||||
| Montanosa | San Diego, CA | Garden | 472 | 1990 | 2014 | 97% | |||||||
| Summit Park | San Diego, CA | Garden | 300 | 1972 | 2002 | 97% | |||||||
| Essex Skyline (12) | Santa Ana, CA | High-rise | 349 | 2008 | 2010 | 93% | |||||||
| Fairhaven Apartments (4) | Santa Ana, CA | Garden | 164 | 1970 | 2001 | 97% |
| Apartment | Year | Year | |||||||||||
| Communities (1) | Location | Type | Homes | Built | Acquired | Occupancy**(2)** | |||||||
| Parkside Court (6) | Santa Ana, CA | Mid-rise | 210 | 1986 | 2014 | 97% | |||||||
| Pinnacle at MacArthur Place | Santa Ana, CA | Mid-rise | 253 | 2002 | 2014 | 97% | |||||||
| Hope Ranch | Santa Barbara, CA | Garden | 108 | 1965 | 2007 | 99% | |||||||
| Bridgeport Coast (13) | Santa Clarita, CA | Mid-rise | 188 | 2006 | 2014 | 96% | |||||||
| Hidden Valley | Simi Valley, CA | Garden | 324 | 2004 | 2004 | 97% | |||||||
| Meadowood (8) | Simi Valley, CA | Garden | 320 | 1986 | 1996 | 96% | |||||||
| Shadow Point | Spring Valley, CA | Garden | 172 | 1983 | 2002 | 97% | |||||||
| The Fairways at Westridge (13) | Valencia, CA | Mid-rise | 234 | 2004 | 2014 | 96% | |||||||
| The Vistas of West Hills (13) | Valencia, CA | Mid-rise | 220 | 2009 | 2014 | 96% | |||||||
| Allegro | Valley Village, CA | Mid-rise | 97 | 2010 | 2010 | 97% | |||||||
| Lofts at Pinehurst, The | Ventura, CA | Garden | 118 | 1971 | 1997 | 97% | |||||||
| Pinehurst (14) | Ventura, CA | Garden | 28 | 1973 | 2004 | 99% | |||||||
| Woodside Village | Ventura, CA | Garden | 145 | 1987 | 2004 | 97% | |||||||
| Walnut Heights | Walnut, CA | Garden | 163 | 1964 | 2003 | 96% | |||||||
| The Dylan | West Hollywood, CA | Mid-rise | 184 | 2014 | 2014 | 96% | |||||||
| The Huxley | West Hollywood, CA | Mid-rise | 187 | 2014 | 2014 | 96% | |||||||
| Reveal | Woodland Hills, CA | Mid-rise | 438 | 2010 | 2011 | 97% | |||||||
| Avondale at Warner Center | Woodland Hills, CA | Mid-rise | 446 | 1970 | 1999 | 97% | |||||||
| 26,695 | 97% | ||||||||||||
| Northern California | |||||||||||||
| Belmont Terrace | Belmont, CA | Mid-rise | 71 | 1974 | 2006 | 96% | |||||||
| Fourth & U | Berkeley, CA | Mid-rise | 171 | 2010 | 2010 | 97% | |||||||
| The Commons | Campbell, CA | Garden | 264 | 1973 | 2010 | 96% | |||||||
| Pointe at Cupertino | Cupertino, CA | Garden | 116 | 1963 | 1998 | 97% | |||||||
| Connolly Station (15) | Dublin, CA | Mid-rise | 309 | 2014 | 2014 | 97% | |||||||
| Avenue 64 | Emeryville, CA | Mid-rise | 224 | 2007 | 2014 | 96% | |||||||
| The Courtyards at 65th Street (16) | Emeryville, CA | Mid-rise | 331 | 2004 | 2019 | 96% | |||||||
| Emme (15) | Emeryville, CA | Mid-rise | 190 | 2015 | 2015 | 96% | |||||||
| Foster's Landing | Foster City, CA | Garden | 490 | 1987 | 2014 | 95% | |||||||
| Stevenson Place | Fremont, CA | Garden | 200 | 1975 | 2000 | 97% | |||||||
| Mission Peaks | Fremont, CA | Mid-rise | 453 | 1995 | 2014 | 97% | |||||||
| Mission Peaks II | Fremont, CA | Garden | 336 | 1989 | 2014 | 97% | |||||||
| Paragon Apartments | Fremont, CA | Mid-rise | 301 | 2013 | 2014 | 97% | |||||||
| Boulevard | Fremont, CA | Garden | 172 | 1978 | 1996 | 96% | |||||||
| Briarwood (9) | Fremont, CA | Garden | 160 | 1978 | 2011 | 97% | |||||||
| The Woods (9) | Fremont, CA | Garden | 160 | 1978 | 2011 | 97% | |||||||
| City Centre (13) | Hayward, CA | Mid-rise | 192 | 2000 | 2014 | 96% | |||||||
| City View | Hayward, CA | Garden | 572 | 1975 | 1998 | 96% | |||||||
| Lafayette Highlands | Lafayette, CA | Garden | 150 | 1973 | 2014 | 97% | |||||||
| 777 Hamilton (17) | Menlo Park, CA | Mid-rise | 195 | 2017 | 2019 | 94% | |||||||
| Apex | Milpitas, CA | Mid-rise | 366 | 2014 | 2014 | 97% | |||||||
| Regency at Mountain View (7) | Mountain View, CA | Mid-rise | 142 | 1970 | 2013 | 97% | |||||||
| Bridgeport (8) | Newark, CA | Garden | 184 | 1987 | 1987 | 97% | |||||||
| The Landing at Jack London Square | Oakland, CA | Mid-rise | 282 | 2001 | 2014 | 96% | |||||||
| The Grand | Oakland, CA | High-rise | 243 | 2009 | 2009 | 96% | |||||||
| The Galloway (15) | Pleasanton, CA | Mid-rise | 506 | 2016 | 2016 | 97% | |||||||
| Radius | Redwood City, CA | Mid-rise | 264 | 2015 | 2015 | 97% | |||||||
| Township | Redwood City, CA | Mid-rise | 132 | 2014 | 2019 | 97% |
| Apartment | Year | Year | |||||||||||
| Communities (1) | Location | Type | Homes | Built | Acquired | Occupancy**(2)** | |||||||
| San Marcos | Richmond, CA | Mid-rise | 432 | 2003 | 2003 | 97% | |||||||
| Bennett Lofts | San Francisco, CA | Mid-rise | 165 | 2004 | 2012 | 95% | |||||||
| Fox Plaza | San Francisco, CA | High-rise | 445 | 1968 | 2013 | 95% | |||||||
| MB 360 | San Francisco, CA | Mid-rise | 360 | 2014 | 2014 | 97% | |||||||
| Park West | San Francisco, CA | Mid-rise | 126 | 1958 | 2012 | 95% | |||||||
| 101 San Fernando | San Jose, CA | Mid-rise | 323 | 2001 | 2010 | 96% | |||||||
| 360 Residences (16) | San Jose, CA | Mid-rise | 213 | 2010 | 2017 | 95% | |||||||
| Bella Villagio | San Jose, CA | Mid-rise | 231 | 2004 | 2010 | 96% | |||||||
| Century Towers (18) | San Jose, CA | High-rise | 376 | 2017 | 2017 | 95% | |||||||
| Enso | San Jose, CA | Mid-rise | 183 | 2014 | 2015 | 97% | |||||||
| Epic (15) | San Jose, CA | Mid-rise | 769 | 2013 | 2013 | 96% | |||||||
| Esplanade | San Jose, CA | Mid-rise | 278 | 2002 | 2004 | 96% | |||||||
| Fountains at River Oaks | San Jose, CA | Mid-rise | 226 | 1990 | 2014 | 96% | |||||||
| Marquis | San Jose, CA | Mid-rise | 166 | 2015 | 2016 | 96% | |||||||
| Meridian at Midtown (16) | San Jose, CA | Mid-rise | 218 | 2015 | 2018 | 95% | |||||||
| Mio | San Jose, CA | Mid-rise | 103 | 2015 | 2016 | 97% | |||||||
| Museum Park | San Jose, CA | Mid-rise | 117 | 2002 | 2014 | 97% | |||||||
| One South Market (19) | San Jose, CA | High-rise | 312 | 2015 | 2015 | 96% | |||||||
| Palm Valley | San Jose, CA | Mid-rise | 1,099 | 2008 | 2014 | 97% | |||||||
| Sage at Cupertino (4) | San Jose, CA | Garden | 230 | 1971 | 2017 | 96% | |||||||
| The Carlyle (8) | San Jose, CA | Garden | 132 | 2000 | 2000 | 97% | |||||||
| The Waterford | San Jose, CA | Mid-rise | 238 | 2000 | 2000 | 96% | |||||||
| Willow Lake | San Jose, CA | Mid-rise | 508 | 1989 | 2012 | 96% | |||||||
| Lakeshore Landing | San Mateo, CA | Mid-rise | 308 | 1988 | 2014 | 96% | |||||||
| Hillsdale Garden | San Mateo, CA | Garden | 697 | 1948 | 2006 | 97% | |||||||
| Park 20 (15) | San Mateo, CA | Mid-rise | 197 | 2015 | 2015 | 97% | |||||||
| Station Park Green - Phase I | San Mateo, CA | Mid-rise | 121 | 2018 | 2018 | 95% | |||||||
| Deer Valley | San Rafael, CA | Garden | 171 | 1996 | 2014 | 97% | |||||||
| Bel Air | San Ramon, CA | Garden | 462 | 1988 | 1995 | 97% | |||||||
| Canyon Oaks | San Ramon, CA | Mid-rise | 250 | 2005 | 2007 | 97% | |||||||
| Crow Canyon | San Ramon, CA | Mid-rise | 400 | 1992 | 2014 | 96% | |||||||
| Foothill Gardens | San Ramon, CA | Garden | 132 | 1985 | 1997 | 97% | |||||||
| Mill Creek at Windermere | San Ramon, CA | Mid-rise | 400 | 2005 | 2007 | 97% | |||||||
| Twin Creeks | San Ramon, CA | Garden | 44 | 1985 | 1997 | 97% | |||||||
| 1000 Kiely | Santa Clara, CA | Garden | 121 | 1971 | 2011 | 97% | |||||||
| Le Parc | Santa Clara, CA | Garden | 140 | 1975 | 1994 | 97% | |||||||
| Marina Cove (20) | Santa Clara, CA | Garden | 292 | 1974 | 1994 | 97% | |||||||
| Riley Square (9) | Santa Clara, CA | Garden | 156 | 1972 | 2012 | 97% | |||||||
| Villa Granada | Santa Clara, CA | Mid-rise | 270 | 2010 | 2014 | 97% | |||||||
| Chestnut Street Apartments | Santa Cruz, CA | Garden | 96 | 2002 | 2008 | 95% | |||||||
| Bristol Commons | Sunnyvale, CA | Garden | 188 | 1989 | 1995 | 97% | |||||||
| Brookside Oaks (4) | Sunnyvale, CA | Garden | 170 | 1973 | 2000 | 97% | |||||||
| Lawrence Station | Sunnyvale, CA | Mid-rise | 336 | 2012 | 2014 | 97% | |||||||
| Magnolia Lane (21) | Sunnyvale, CA | Garden | 32 | 2001 | 2007 | 97% | |||||||
| Magnolia Square (4) | Sunnyvale, CA | Garden | 156 | 1963 | 2007 | 97% | |||||||
| Montclaire | Sunnyvale, CA | Mid-rise | 390 | 1973 | 1988 | 97% | |||||||
| Reed Square | Sunnyvale, CA | Garden | 100 | 1970 | 2011 | 98% | |||||||
| Solstice | Sunnyvale, CA | Mid-rise | 280 | 2014 | 2014 | 98% |
| Apartment | Year | Year | |||||||||||
| Communities (1) | Location | Type | Homes | Built | Acquired | Occupancy**(2)** | |||||||
| Summerhill Park | Sunnyvale, CA | Garden | 100 | 1988 | 1988 | 98% | |||||||
| Via | Sunnyvale, CA | Mid-rise | 284 | 2011 | 2011 | 97% | |||||||
| Windsor Ridge | Sunnyvale, CA | Mid-rise | 216 | 1989 | 1989 | 98% | |||||||
| Vista Belvedere | Tiburon, CA | Mid-rise | 76 | 1963 | 2004 | 96% | |||||||
| Verandas (13) | Union City, CA | Mid-rise | 282 | 1989 | 2014 | 97% | |||||||
| Agora (22) | Walnut Creek, CA | Mid-rise | 49 | 2016 | 2016 | 99% | |||||||
| Brio (4) | Walnut Creek, CA | Mid-rise | 300 | 2015 | 2019 | 97% | |||||||
| 21,642 | 96% | ||||||||||||
| Seattle, Washington Metropolitan Area | |||||||||||||
| Belcarra | Bellevue, WA | Mid-rise | 296 | 2009 | 2014 | 97% | |||||||
| BellCentre | Bellevue, WA | Mid-rise | 248 | 2001 | 2014 | 97% | |||||||
| Cedar Terrace | Bellevue, WA | Garden | 180 | 1984 | 2005 | 96% | |||||||
| Courtyard off Main | Bellevue, WA | Mid-rise | 110 | 2000 | 2010 | 96% | |||||||
| Ellington | Bellevue, WA | Mid-rise | 220 | 1994 | 2014 | 97% | |||||||
| Emerald Ridge | Bellevue, WA | Garden | 180 | 1987 | 1994 | 97% | |||||||
| Foothill Commons | Bellevue, WA | Mid-rise | 394 | 1978 | 1990 | 96% | |||||||
| Palisades, The | Bellevue, WA | Garden | 192 | 1977 | 1990 | 97% | |||||||
| Park Highland | Bellevue, WA | Mid-rise | 250 | 1993 | 2014 | 96% | |||||||
| Piedmont | Bellevue, WA | Garden | 396 | 1969 | 2014 | 97% | |||||||
| Sammamish View | Bellevue, WA | Garden | 153 | 1986 | 1994 | 98% | |||||||
| Woodland Commons | Bellevue, WA | Garden | 302 | 1978 | 1990 | 97% | |||||||
| Bothell Ridge (6) | Bothell, WA | Garden | 214 | 1988 | 2014 | 96% | |||||||
| Canyon Pointe | Bothell, WA | Garden | 250 | 1990 | 2003 | 96% | |||||||
| Inglenook Court | Bothell, WA | Garden | 224 | 1985 | 1994 | 96% | |||||||
| Pinnacle Sonata | Bothell, WA | Mid-rise | 268 | 2000 | 2014 | 96% | |||||||
| Salmon Run at Perry Creek | Bothell, WA | Garden | 132 | 2000 | 2000 | 97% | |||||||
| Stonehedge Village | Bothell, WA | Garden | 196 | 1986 | 1997 | 96% | |||||||
| Highlands at Wynhaven | Issaquah, WA | Mid-rise | 333 | 2000 | 2008 | 97% | |||||||
| Park Hill at Issaquah | Issaquah, WA | Garden | 245 | 1999 | 1999 | 97% | |||||||
| Wandering Creek | Kent, WA | Garden | 156 | 1986 | 1995 | 98% | |||||||
| Ascent | Kirkland, WA | Garden | 90 | 1988 | 2012 | 96% | |||||||
| Bridle Trails | Kirkland, WA | Garden | 108 | 1986 | 1997 | 97% | |||||||
| Corbella at Juanita Bay | Kirkland, WA | Garden | 169 | 1978 | 2010 | 96% | |||||||
| Evergreen Heights | Kirkland, WA | Garden | 200 | 1990 | 1997 | 96% | |||||||
| Slater 116 | Kirkland, WA | Mid-rise | 108 | 2013 | 2013 | 97% | |||||||
| Montebello | Kirkland, WA | Garden | 248 | 1996 | 2012 | 96% | |||||||
| Aviara (23) | Mercer Island, WA | Mid-rise | 166 | 2013 | 2014 | 96% | |||||||
| Laurels at Mill Creek | Mill Creek, WA | Garden | 164 | 1981 | 1996 | 96% | |||||||
| Parkwood at Mill Creek | Mill Creek, WA | Garden | 240 | 1989 | 2014 | 96% | |||||||
| The Elliot at Mukilteo (4) | Mukilteo, WA | Garden | 301 | 1981 | 1997 | 96% | |||||||
| Castle Creek | Newcastle, WA | Garden | 216 | 1998 | 1998 | 97% | |||||||
| Delano | Redmond, WA | Mid-rise | 126 | 2005 | 2011 | 97% | |||||||
| Elevation | Redmond, WA | Garden | 158 | 1986 | 2010 | 97% | |||||||
| Pure Redmond | Redmond, WA | Mid-rise | 105 | 2016 | 2019 | 99% | |||||||
| Redmond Hill (9) | Redmond, WA | Garden | 442 | 1985 | 2011 | 96% | |||||||
| Shadowbrook | Redmond, WA | Garden | 418 | 1986 | 2014 | 96% | |||||||
| The Trails of Redmond | Redmond, WA | Garden | 423 | 1985 | 2014 | 97% | |||||||
| Vesta (9) | Redmond, WA | Garden | 440 | 1998 | 2011 | 97% |
| Apartment | Year | Year | |||||||||||
| Communities (1) | Location | Type | Homes | Built | Acquired | Occupancy**(2)** | |||||||
| Brighton Ridge | Renton, WA | Garden | 264 | 1986 | 1996 | 96% | |||||||
| Fairwood Pond | Renton, WA | Garden | 194 | 1997 | 2004 | 97% | |||||||
| Forest View | Renton, WA | Garden | 192 | 1998 | 2003 | 97% | |||||||
| Pinnacle on Lake Washington | Renton, WA | Mid-rise | 180 | 2001 | 2014 | 96% | |||||||
| 8th & Republican (16) | Seattle, WA | Mid-rise | 211 | 2016 | 2017 | 97% | |||||||
| Annaliese | Seattle, WA | Mid-rise | 56 | 2009 | 2013 | 98% | |||||||
| The Audrey at Belltown | Seattle, WA | Mid-rise | 137 | 1992 | 2014 | 96% | |||||||
| The Bernard | Seattle, WA | Mid-rise | 63 | 2008 | 2011 | 98% | |||||||
| Cairns, The | Seattle, WA | Mid-rise | 99 | 2006 | 2007 | 97% | |||||||
| Collins on Pine | Seattle, WA | Mid-rise | 76 | 2013 | 2014 | 98% | |||||||
| Domaine | Seattle, WA | Mid-rise | 92 | 2009 | 2012 | 98% | |||||||
| Expo (18) | Seattle, WA | Mid-rise | 275 | 2012 | 2012 | 96% | |||||||
| Fountain Court | Seattle, WA | Mid-rise | 320 | 2000 | 2000 | 97% | |||||||
| Patent 523 | Seattle, WA | Mid-rise | 295 | 2010 | 2010 | 97% | |||||||
| Taylor 28 | Seattle, WA | Mid-rise | 197 | 2008 | 2014 | 97% | |||||||
| Velo and Ray (16) | Seattle, WA | Mid-rise | 308 | 2014 | 2019 | 96% | |||||||
| Vox Apartments | Seattle, WA | Mid-rise | 58 | 2013 | 2013 | 97% | |||||||
| Wharfside Pointe | Seattle, WA | Mid-rise | 155 | 1990 | 1994 | 97% | |||||||
| 12,233 | 97% | ||||||||||||
| Total/Weighted Average | 60,570 | 97% |
Footnotes to the Company’s Portfolio Listing as of December 31, 2019
| (1) | Unless otherwise specified, the Company consolidates each community in accordance with U.S. GAAP. |
| (2) | For communities, occupancy rates are based on financial occupancy for the year ended December 31, 2019. For an explanation of how financial occupancy is calculated, see "Occupancy Rates" in this Item 2. |
| (3) | The community is subject to a ground lease, which, unless extended, will expire in 2082. |
| (4) | Each of these communities is part of a DownREIT structure in which the Company is the general partner or manager and the other limited partners or members are granted rights of redemption for their interests. |
| (5) | This community is owned by BEX III, LLC ("BEX III"). The Company has a 50% interest in BEX III, which is accounted for using the equity method of accounting. |
| (6) | This community is owned by BEXAEW. The Company has a 50% interest in BEXAEW, which is accounted for using the equity method of accounting. |
| (7) | This community is owned by Wesco III. The Company has a 50% interest in Wesco III, which is accounted for using the equity method of accounting. |
| (8) | This community is owned by BEX II, LLC ("BEX II"). The Company has a 50% interest in BEX II, which is accounted for using the equity method of accounting. |
| (9) | This community is owned by Wesco I, LLC ("Wesco I"). The Company has a 58% interest in Wesco I, which is accounted for using the equity method of accounting. |
| (10) | This community is subject to a ground lease, which, unless extended, will expire in 2067. |
| (11) | This community is subject to a ground lease, which, unless extended, will expire in 2027. |
| (12) | The Company has a 97% interest and an Executive Vice President of the Company has a 3% interest in this community. |
| (13) | This community is owned by Wesco IV, LLC ("Wesco IV") The Company has a 50% interest in Wesco IV, which is accounted for using the equity method of accounting. |
| (14) | This community is subject to a ground lease, which, unless extended, will expire in 2028. |
| (15) | This community is owned by an entity that, as of December 31, 2019, was co-owned by the Company and the Canada Pension Plan Investment Board ("CPPIB" or "CPP"). The Company had a 55% ownership in this community, which is accounted for using the equity method of accounting. In January 2020, the Company purchased CPPIB's 45% interest. |
| (16) | This community is owned by Wesco V, LLC ("Wesco V"). The Company has a 50% interest in Wesco V, which is accounted for using the equity method of accounting. |
| (17) | This community is owned by BEX IV, LLC ("BEX IV"). The Company has a 50.1% interest in BEX IV, which is accounted for using the equity method of accounting. |
| (18) | The Company has 50% ownership in this community, which is accounted for using the equity method of accounting. |
| (19) | In March 2019, the Company purchased its joint venture partner's 45.0% interest in the One South Market co-investment. As a result of this purchase, the Company consolidates One South Market. |
| (20) | A portion of this community on which 84 apartment homes are presently located is subject to a ground lease, which, unless extended, will expire in 2028. |
| (21) | The community is subject to a ground lease, which, unless extended, will expire in 2070. |
| (22) | This community is owned by an entity that, as of December 31, 2019, was co-owned primarily by the Company and CPPIB. The Company had a 51% membership interest in this community, which is accounted for using the equity method of accounting. In January 2020, the Company purchased CPPIB's 45% interest. |
| (23) | This community is subject to a ground lease, which, unless extended, will expire in 2070. |
Item 3. Legal Proceedings
The information regarding lawsuits, other proceedings and claims, set forth in Note 17, "Commitments and Contingencies", to our consolidated financial statements included in Part IV, Item 15 of this Annual Report on Form 10-K is incorporated by reference into this Item 3. In addition to such matters referred to in Note 17, the Company is subject to various other legal and/or regulatory proceedings arising in the course of its business operations. We believe that, with respect to such matters that we are currently a party to, the ultimate disposition of any such matter will not result in a material adverse effect on the Company’s financial condition, results of operations or cash flows.
Item 4. Mine Safety Disclosures
Item 5. Market for Registrant’s Common Equity, Related Stockholder Matters and Issuer Purchases of Equity Securities
Market Information
The shares of the Company’s common stock are traded on the New York Stock Exchange under the symbol ESS.
There is no established public trading market for the Operating Partnership's limited partnership units ("OP Units").
Holders
The approximate number of holders of record of the shares of Essex's common stock was 1,248 as of February 18, 2020. This number does not include stockholders whose shares are held in investment accounts by other entities. Essex believes the actual number of stockholders is greater than the number of holders of record.
As of February 18, 2020, there were 65 holders of record of OP Units, including Essex.
Return of Capital
Under provisions of the Code, the portion of the cash dividend, if any, that exceeds earnings and profits is considered a return of capital. The return of capital is generated due to a variety of factors, including the deduction of non-cash expenses, primarily depreciation, in the determination of earnings and profits.
The status of the cash dividends distributed for the years ended December 31, 2019, 2018, and 2017 related to common stock are as follows:
| 2019 | 2018 | 2017 | |||||||
| Common Stock | |||||||||
| Ordinary income | 83.81 | % | 79.72 | % | 84.04 | % | |||
| Capital gain | 13.78 | % | 15.35 | % | 13.20 | % | |||
| Unrecaptured section 1250 capital gain | 2.41 | % | 4.93 | % | 2.76 | % | |||
| 100.00 | % | 100.00 | % | 100.00 | % |
Dividends and Distributions
Future dividends/distributions by Essex and the Operating Partnership will be at the discretion of the Board of Directors of Essex and will depend on the actual cash flows from operations of the Company, its financial condition, capital requirements, the annual distribution requirements under the REIT provisions of the Code, applicable legal restrictions and such other factors as the Board of Directors deems relevant. There are currently no contractual restrictions on Essex's and the Operating Partnership's present or future ability to pay dividends and distributions, and we do not anticipate that our ability to pay dividends/distributions will be impaired; however, there can be no assurances in that regard.
The Board of Directors declared a dividend/distribution for the fourth quarter of 2019 of $1.95 per share. The dividend/distribution was paid on January 15, 2020 to stockholders/unitholders of record as of January 2, 2020.
Dividend Reinvestment and Share Purchase Plan
Essex has adopted a dividend reinvestment and share purchase plan designed to provide holders of common stock with a convenient and economical means to reinvest all or a portion of their cash dividends in shares of common stock and to acquire additional shares of common stock through voluntary purchases. Computershare, LLC, which serves as Essex's transfer agent, administers the dividend reinvestment and share purchase plan. For a copy of the plan, contact Computershare, LLC at (312) 360-5354.
Securities Authorized for Issuance under Equity Compensation Plans
The information required by this section is incorporated herein by reference from our Proxy Statement, relating to our 2020 Annual Meeting of Shareholders, under the headings "Equity Compensation Plan Information," to be filed with the SEC within 120 days of December 31, 2019.
Issuance of Registered Equity Securities
During the year ended December 31, 2019, the Company issued 228,271 shares of common stock through its equity distribution program at an average price of $321.56 per share for proceeds of $73.4 million. As of December 31, 2019, there were no outstanding forward sale agreements, and $826.6 million of shares remains available to be sold under this program.
Issuer Purchases of Equity Securities
In December 2015, Essex's Board of Directors authorized a stock repurchase plan to allow Essex to acquire shares in an aggregate of up to $250.0 million. In January 2019, pursuant to such authorization, the Company repurchased and retired 234,061 shares of its common stock totaling $57.0 million, including commissions, at an average price of $243.48 per share. In February 2019, the Board of Directors approved the replenishment of the stock repurchase plan such that, as of such date, the Company had $250.0 million of purchase authority remaining under the stock repurchase plan. The Company did not repurchase any additional shares during the year ended December 31, 2019, such that as of December 31, 2019, the Company had $250.0 million of purchase authority remaining under the stock repurchase plan.
Performance Graph
The line graph below compares the cumulative total stockholder return on Essex's common stock for the last five years with the cumulative total return on the S&P 500 and the NAREIT All Equity REIT index over the same period. This comparison assumes that the value of the investment in the common stock and each index was $100 on December 31, 2014 and that all dividends were reinvested.
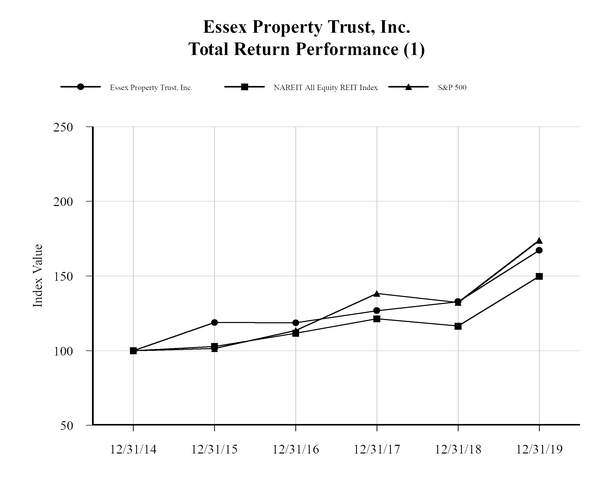
| Period Ending | ||||||||||||||||||
| Index | 12/31/2014 | 12/31/2015 | 12/31/2016 | 12/31/2017 | 12/31/2018 | 12/31/2019 | ||||||||||||
| Essex Property Trust, Inc. | 100.00 | 118.87 | 118.71 | 126.79 | 132.83 | 167.25 | ||||||||||||
| NAREIT All Equity REIT Index | 100.00 | 102.83 | 111.70 | 121.39 | 116.48 | 149.86 | ||||||||||||
| S&P 500 Index | 100.00 | 101.38 | 113.51 | 138.29 | 132.23 | 173.86 |
| (1) | Common stock performance data is provided by S&P Global Market Intelligence (formerly SNL Financial). |
The graph and other information furnished under the above caption "Performance Graph" in this Part II Item 5 of this Form 10-K shall not deemed to be "soliciting material" or to be "filed" with the SEC or subject to Regulation 14A or 14C, or to the liabilities of the Exchange Act.
Unregistered Sales of Equity Securities
During the years ended December 31, 2019 and 2018, the Operating Partnership issued OP Units in private placements in reliance on the exemption from registration provided by Section 4(a)(2) of the Securities Act, in the amounts and for the consideration set forth below:
During the years ended December 31, 2019 and 2018, Essex issued an aggregate of 178,675 and 39,175 shares of its common stock upon the exercise of stock options, respectively. Essex contributed the proceeds from the option exercises of $37.5 million and $6.2 million to the Operating Partnership in exchange for an aggregate of 178,675 and 39,175 OP Units, as required by the Operating Partnership’s partnership agreement, during the years ended December 31, 2019 and 2018, respectively.
During the years ended December 31, 2019 and 2018, Essex issued an aggregate of 16,114 and 1,981 shares of its common stock in connection with restricted stock awards for no cash consideration, respectively. For each share of common stock issued by Essex in connection with such awards, the Operating Partnership issued OP Units to Essex as required by the Operating Partnership's partnership agreement, for an aggregate of 16,114 and 1,981 OP Units during the years ended December 31, 2019 and 2018, respectively.
During the years ended December 31, 2019 and 2018, Essex issued an aggregate of 12,633 and 5,250 shares of its common stock in connection with the exchange of OP Units and DownREIT units by limited partners or members into shares of common stock. For each share of common stock issued by Essex in connection with such exchange, the Operating Partnership issued OP Units to Essex as required by the Operating Partnership's partnership agreement, for an aggregate of 12,633 and 5,250 OP Units during the year ended December 31, 2019 and 2018, respectively.
During the year ended December 31, 2019, the Company issued 228,271 shares of common stock through its equity distribution program. Essex contributed the net proceeds from these share issuances of $73.4 million to the Operating Partnership in exchange for an aggregate of 228,271 OP units, as required by the Operating Partnership's partnership agreement. As of December 31, 2019, there are no outstanding forward purchase agreements. During the year ended December 31, 2018, no shares of the Company's common stock were issued or sold by Essex pursuant to its equity distribution programs.
Item 6. Selected Financial Data
The following tables set forth summary financial and operating information for Essex and the Operating Partnership from January 1, 2015 through December 31, 2019.
Essex Property Trust, Inc. and Subsidiaries
| Years Ended December 31, | ||||||||||||||||||||
| 2019 | 2018 | 2017 | 2016 | 2015 | ||||||||||||||||
| ($ in thousands, except per share amounts) | ||||||||||||||||||||
| OPERATING DATA: | ||||||||||||||||||||
| Rental and other property | $ | 1,450,628 | $ | 1,390,870 | $ | 1,354,325 | $ | 1,285,723 | $ | 1,185,498 | ||||||||||
| Management and other fees from affiliates | 9,527 | 9,183 | 9,574 | 8,278 | 8,909 | |||||||||||||||
| Net income | 464,448 | 413,599 | 458,043 | 438,410 | 248,239 | |||||||||||||||
| Net income available to common stockholders | $ | 439,286 | $ | 390,153 | $ | 433,059 | $ | 411,124 | $ | 226,865 | ||||||||||
| Per share data: | ||||||||||||||||||||
| Basic: | ||||||||||||||||||||
| Net income available to common stockholders | $ | 6.67 | $ | 5.91 | $ | 6.58 | $ | 6.28 | $ | 3.50 | ||||||||||
| Weighted average common stock outstanding | 65,840 | 66,041 | 65,829 | 65,472 | 64,872 | |||||||||||||||
| Diluted: | ||||||||||||||||||||
| Net income available to common stockholders | $ | 6.66 | $ | 5.90 | $ | 6.57 | $ | 6.27 | $ | 3.49 | ||||||||||
| Weighted average common stock outstanding | 65,939 | 66,085 | 65,898 | 65,588 | 65,062 | |||||||||||||||
| Cash dividend per common share | $ | 7.80 | $ | 7.44 | $ | 7.00 | $ | 6.40 | $ | 5.76 |
| As of December 31, | ||||||||||||||||||||
| 2019 | 2018 | 2017 | 2016 | 2015 | ||||||||||||||||
| ($ in thousands) | ||||||||||||||||||||
| BALANCE SHEET DATA: | ||||||||||||||||||||
| Investment in rental properties (before accumulated depreciation) | $ | 14,038,142 | $ | 13,366,101 | $ | 13,362,073 | $ | 12,687,722 | $ | 12,338,129 | ||||||||||
| Net investment in rental properties | 10,348,660 | 10,156,553 | 10,592,776 | 10,376,176 | 10,388,237 | |||||||||||||||
| Real estate under development | 546,075 | 454,629 | 355,735 | 190,505 | 242,326 | |||||||||||||||
| Co-investments | 1,335,339 | 1,300,140 | 1,155,984 | 1,161,275 | 1,036,047 | |||||||||||||||
| Total assets | 12,705,405 | 12,383,596 | 12,495,706 | 12,217,408 | 12,008,384 | |||||||||||||||
| Total indebtedness, net | 5,808,873 | 5,605,942 | 5,689,126 | 5,563,260 | 5,318,757 | |||||||||||||||
| Redeemable noncontrolling interest | 37,410 | 35,475 | 39,206 | 44,684 | 45,452 | |||||||||||||||
| Cumulative redeemable preferred stock | — | — | — | — | 73,750 | |||||||||||||||
| Stockholders' equity | 6,220,427 | 6,267,073 | 6,277,406 | 6,192,178 | 6,237,733 |
| As of and for the years ended December 31, | ||||||||||||||||||||
| 2019 | 2018 | 2017 | 2016 | 2015 | ||||||||||||||||
| ($ in thousands, except per share amounts) | ||||||||||||||||||||
| OTHER DATA: | ||||||||||||||||||||
| Funds from operations ("FFO")(1) attributable to common stockholders and unitholders: | ||||||||||||||||||||
| Net income available to common stockholders | $ | 439,286 | $ | 390,153 | $ | 433,059 | $ | 411,124 | $ | 226,865 | ||||||||||
| Adjustments: | ||||||||||||||||||||
| Depreciation and amortization | 483,750 | 479,884 | 468,881 | 441,682 | 453,423 | |||||||||||||||
| Gains not included in FFO attributable to common stockholders and unitholders | (79,468 | ) | (73,683 | ) | (159,901 | ) | (167,607 | ) | (81,347 | ) | ||||||||||
| Impairment loss | 7,105 | — | — | — | — |
| Impairment loss from unconsolidated co-investments | 11,484 | — | — | — | — | |||||||||||||||
| Deferred tax expense on sale of real estate and land - taxable REIT subsidiary activity | — | — | — | 4,410 | — | |||||||||||||||
| Depreciation and amortization from unconsolidated co-investments | 60,655 | 62,954 | 55,531 | 50,956 | 49,826 | |||||||||||||||
| Noncontrolling interest related to Operating Partnership units | 15,343 | 13,452 | 14,825 | 14,089 | 7,824 | |||||||||||||||
| Insurance reimbursements | — | — | — | — | (1,751 | ) | ||||||||||||||
| Depreciation attributable to third party ownership and other | (1,805 | ) | (940 | ) | (286 | ) | (9 | ) | (781 | ) | ||||||||||
| Funds from operations attributable to common stockholders and unitholders | $ | 936,350 | $ | 871,820 | $ | 812,109 | $ | 754,645 | $ | 654,059 | ||||||||||
| Non-core items: | ||||||||||||||||||||
| Merger and integration expenses | — | — | — | — | 3,798 | |||||||||||||||
| Expensed acquisition and investment related costs | 168 | 194 | 1,569 | 1,841 | 2,414 | |||||||||||||||
| Deferred tax expense on unrealized gain on unconsolidated co-investment (2) | 1,457 | — | — | — | — | |||||||||||||||
| Gain on sale of marketable securities | (1,271 | ) | (737 | ) | (1,909 | ) | (5,719 | ) | (598 | ) | ||||||||||
| Unrealized (gains) losses on marketable securities | (5,710 | ) | 5,159 | — | — | — | ||||||||||||||
| Equity income from non-core co-investment (3) | (4,143 | ) | — | — | — | — | ||||||||||||||
| Interest rate hedge ineffectiveness (4) | 181 | 148 | (78 | ) | (250 | ) | — | |||||||||||||
| (Gain) loss on early retirement of debt, net | (3,717 | ) | — | 1,796 | 606 | 6,114 | ||||||||||||||
| Gain on early retirement of debt from unconsolidated co-investment | — | (3,662 | ) | — | — | — | ||||||||||||||
| Co-investment promote income | (809 | ) | (20,541 | ) | — | — | (192 | ) | ||||||||||||
| Income from early redemption of preferred equity investments | (3,562 | ) | (1,652 | ) | (356 | ) | — | (1,954 | ) | |||||||||||
| Accelerated interest income from maturity of investment in mortgage backed security | (7,032 | ) | — | — | — | — | ||||||||||||||
| Excess of redemption value of preferred stock over carrying value | — | — | — | 2,541 | — | |||||||||||||||
| General and administrative and other, net | 1,181 | 8,745 | (1,083 | ) | — | (651 | ) | |||||||||||||
| Insurance reimbursements and legal settlements, net | (858 | ) | (561 | ) | (25 | ) | (4,470 | ) | (2,319 | ) | ||||||||||
| Core funds from operations ("Core FFO")(1) attributable to common stockholders and unitholders | $ | 912,235 | $ | 858,913 | $ | 812,023 | $ | 749,194 | $ | 660,671 | ||||||||||
| Weighted average number of shares outstanding, diluted (FFO)(5) | 68,199 | 68,322 | 68,194 | 67,890 | 67,310 | |||||||||||||||
| Funds from operations attributable to common stockholders and unitholders per share - diluted | $ | 13.73 | $ | 12.76 | $ | 11.91 | $ | 11.12 | $ | 9.72 | ||||||||||
| Core funds from operations attributable to common stockholders and unitholders per share - diluted | $ | 13.38 | $ | 12.57 | $ | 11.91 | $ | 11.04 | $ | 9.82 |
| (1) | FFO is a financial measure that is commonly used in the REIT industry. The Company presents FFO and FFO excluding non-core items (referred to as "Core FFO") as supplemental operating performance measures. FFO and Core FFO are not used by the Company as, nor should they be considered to be, alternatives to net income computed under U.S. GAAP as an indicator of the Company’s operating performance or as alternatives to cash from operating activities computed under U.S. GAAP as an indicator of the Company's ability to fund its cash needs. |
FFO and Core FFO are not meant to represent a comprehensive system of financial reporting and do not present, nor do they intend to present, a complete picture of the Company's financial condition and operating performance. The Company believes that net income computed under U.S. GAAP is the primary measure of performance and that FFO and Core FFO are only meaningful when they are used in conjunction with net income. The Company considers FFO and Core FFO to be useful financial performance measurements of an equity REIT because, together with net income and cash flows, FFO and Core FFO provide investors with additional bases to evaluate operating performance and ability of a REIT to incur and service debt and to fund acquisitions and other capital expenditures and to pay dividends. By excluding gains or losses related to sales of depreciated operating properties and excluding real estate depreciation (which can vary among owners of identical assets in similar condition based on historical cost accounting and useful life estimates), FFO can help investors compare the operating performance of a real estate company between periods or as compared to different companies. By further adjusting for items that are not considered part of the Company’s core business operations, Core FFO allows investors to compare the core operating performance of the Company to its performance in prior reporting periods and to the operating performance of other real estate companies without the effect of items that by their nature are not comparable from period to period and tend to obscure the Company’s actual operating results. The Company believes that its consolidated financial statements, prepared in accordance with U.S. GAAP, provide the most meaningful picture of its financial condition and its operating performance.
In calculating FFO, the Company follows the definition for this measure published by the National Association of Real Estate Investment Trusts (“NAREIT"), which is the leading REIT industry association. The Company believes that, under the NAREIT FFO definition, the two most significant adjustments made to net income are (i) the exclusion of historical cost depreciation and (ii) the exclusion of gains and losses from the sale of previously depreciated properties. The Company agrees that these two NAREIT adjustments are useful to investors for the following reasons:
| (a) | historical cost accounting for real estate assets in accordance with U.S. GAAP assumes, through depreciation charges, that the value of real estate assets diminishes predictably over time. NAREIT stated in its White Paper on Funds from Operations “since real estate asset values have historically risen or fallen with market conditions, many industry investors have considered presentations of operating results for real estate companies that use historical cost accounting to be insufficient by themselves." Consequently, NAREIT’s definition of FFO reflects the fact that real estate, as an asset class, generally appreciates over time and depreciation charges required by U.S. GAAP do not reflect the underlying economic realities. |
| (b) | REITs were created as a legal form of organization in order to encourage public ownership of real estate as an asset class through investment in firms that were in the business of long-term ownership and management of real estate. The exclusion, in NAREIT’s definition of FFO, of gains and losses from the sales of previously depreciated operating real estate assets allows investors and analysts to readily identify the operating results of the long-term assets that form the core of a REIT’s activity and assists in comparing those operating results between periods. |
Management believes that it has consistently applied the NAREIT definition of FFO to all periods presented. However, there is judgment involved and other REITs' calculation of FFO may vary from the NAREIT definition for this measure, and thus their disclosure of FFO may not be comparable to the Company’s calculation.
The table to which this footnote relates is a reconciliation of net income available to common stockholders to FFO and Core FFO for the years ended December 31, 2019, 2018, 2017, 2016, and 2015.
| (2) | A deferred tax expense was recorded during the year ended December 31, 2019 related to the $4.4 million net unrealized gain on Real Estate Technology Ventures, L.P. co-investment discussed below. |
| (3) | Represents the Company's share of co-investment income from Real Estate Technology Ventures, L.P. Income for the year ended December 31, 2019 includes a net unrealized gain of $4.4 million. |
| (4) | Interest rate swaps are generally adjusted to fair value through other comprehensive income (loss). However, because certain of the Company's interest rate swaps do not have a 0% LIBOR floor, while related hedged debt in these cases is subject to a 0% LIBOR floor, the portion of the change in fair value of these interest rate swaps attributable to this mismatch, if any, is recorded as a non-cash interest rate hedge ineffectiveness through interest expense. On January 1, 2019, the Company adopted ASU No. 2017-12 "Derivatives and Hedging - Targeted Improvements to Accounting for Hedging Activities," which resulted in a cumulative effect adjustment of approximately $181,000 from interest expense to accumulated other comprehensive income. |
| (5) | Assumes conversion of all outstanding OP Units into shares of the Company's common stock and excludes all DownREIT units for which the Operating Partnership has the ability and intention to redeem the units for cash and does not consider them to be common stock equivalents. |
Essex Portfolio, L.P. and Subsidiaries
| Years Ended December 31, | ||||||||||||||||||||
| 2019 | 2018 | 2017 | 2016 | 2015 | ||||||||||||||||
| ($ in thousands, except per unit amounts) | ||||||||||||||||||||
| OPERATING DATA: | ||||||||||||||||||||
| Rental and other property | $ | 1,450,628 | $ | 1,390,870 | $ | 1,354,325 | $ | 1,285,723 | $ | 1,185,498 | ||||||||||
| Management and other fees from affiliates | 9,527 | 9,183 | 9,574 | 8,278 | 8,909 | |||||||||||||||
| Net income | 464,448 | 413,599 | 458,043 | 438,410 | 248,239 | |||||||||||||||
| Net income available to common unitholders | $ | 454,629 | $ | 403,605 | $ | 447,884 | $ | 425,213 | $ | 234,689 | ||||||||||
| Per unit data: | ||||||||||||||||||||
| Basic: | ||||||||||||||||||||
| Net income available to common unitholders | $ | 6.67 | $ | 5.91 | $ | 6.58 | $ | 6.28 | $ | 3.50 | ||||||||||
| Weighted average common units outstanding | 68,141 | 68,316 | 68,082 | 67,696 | 67,054 | |||||||||||||||
| Diluted: | ||||||||||||||||||||
| Net income available to common unitholders | $ | 6.66 | $ | 5.90 | $ | 6.57 | $ | 6.27 | $ | 3.49 | ||||||||||
| Weighted average common units outstanding | 68,240 | 68,360 | 68,151 | 67,812 | 67,244 | |||||||||||||||
| Cash distributions per common unit | $ | 7.80 | $ | 7.44 | $ | 7.00 | $ | 6.40 | $ | 5.76 |
| As of December 31, | ||||||||||||||||||||
| 2019 | 2018 | 2017 | 2016 | 2015 | ||||||||||||||||
| ($ in thousands) | ||||||||||||||||||||
| BALANCE SHEET DATA: | ||||||||||||||||||||
| Investment in rental properties (before accumulated depreciation) | $ | 14,038,142 | $ | 13,366,101 | $ | 13,362,073 | $ | 12,687,722 | $ | 12,338,129 | ||||||||||
| Net investment in rental properties | 10,348,660 | 10,156,553 | 10,592,776 | 10,376,176 | 10,388,237 | |||||||||||||||
| Real estate under development | 546,075 | 454,629 | 355,735 | 190,505 | 242,326 | |||||||||||||||
| Co-investments | 1,335,339 | 1,300,140 | 1,155,984 | 1,161,275 | 1,036,047 | |||||||||||||||
| Total assets | 12,705,405 | 12,383,596 | 12,495,706 | 12,217,408 | 12,008,384 | |||||||||||||||
| Total indebtedness, net | 5,808,873 | 5,605,942 | 5,689,126 | 5,563,260 | 5,318,757 | |||||||||||||||
| Redeemable noncontrolling interest | 37,410 | 35,475 | 39,206 | 44,684 | 45,452 | |||||||||||||||
| Cumulative redeemable preferred interest | — | — | — | — | 71,209 | |||||||||||||||
| Partners' capital | 6,281,242 | 6,329,613 | 6,330,415 | 6,244,364 | 6,287,381 |
Item 7. Management’s Discussion and Analysis of Financial Condition and Results of Operations
The following discussion and analysis should be read in conjunction with the accompanying consolidated financial statements and notes thereto. These consolidated financial statements include all adjustments which are, in the opinion of management, necessary to reflect a fair statement of the results and all such adjustments are of a normal recurring nature.
OVERVIEW
Essex is a self-administered and self-managed REIT that acquires, develops, redevelops, and manages apartment communities in selected residential areas located on the West Coast of the United States. Essex owns all of its interests in its real estate investments, directly or indirectly, through the Operating Partnership. Essex is the sole general partner of the Operating Partnership and, as of December 31, 2019, had an approximately 96.6% general partner interest in the Operating Partnership.
The Company’s investment strategy has two components: constant monitoring of existing markets, and evaluation of new markets to identify areas with the characteristics that underlie rental growth. The Company’s strong financial condition supports its investment strategy by enhancing its ability to quickly shift acquisition, development, redevelopment, and disposition activities to markets that will optimize the performance of the Company's portfolio.
As of December 31, 2019, the Company owned or had ownership interests in 250 operating apartment communities, comprising 60,570 apartment homes, excluding the Company's ownership in preferred equity co-investments, loan investments, one operating commercial building and a development pipeline comprised of five consolidated projects and two unconsolidated joint venture projects.
The Company’s apartment communities are predominately located in the following major regions:
Southern California (primarily Los Angeles, Orange, San Diego, and Ventura counties)
Northern California (the San Francisco Bay Area)
Seattle Metro (Seattle metropolitan area)
As of December 31, 2019, the Company’s development pipeline was comprised of five consolidated projects under development, two unconsolidated joint venture projects under development, and various predevelopment projects aggregating 1,960 apartment homes, with total incurred costs of $1.0 billion, and estimated remaining project costs of approximately $222.0 million, $193.0 million of which represents the Company's estimated remaining costs, for total estimated project costs of $1.3 billion.
As of December 31, 2019, the Company also had an ownership interest in one operating commercial building (totaling approximately 106,716 square feet).
By region, the Company's operating results for 2019 and 2018 and projection for 2020 new housing supply (defined as new multifamily apartment homes and single family homes, excluding developments with fewer than 50 apartment homes as well as student, senior and 100% affordable housing), projection for 2020 job growth, and 2020 estimated Same-Property revenue growth are as follows:
Southern California Region: As of December 31, 2019, this region represented 45% of the Company’s consolidated operating apartment homes. Revenues for "2019 Same-Properties" (as defined below), or "Same-Property revenues," increased 3.0% in 2019 as compared to 2018. In 2020, the Company projects new residential supply of 31,400 apartment homes and single family homes, which represents 0.5% of the total housing stock. The Company projects an increase of 91,850 jobs or 1.2%, and an increase in 2020 Same-Property revenues of between 2.2% to 3.2% in 2020.
Northern California Region: As of December 31, 2019, this region represented 35% of the Company’s consolidated operating apartment homes. Same-Property revenues increased 3.8% in 2019 as compared to 2018. In 2020, the Company projects new residential supply of 17,950 apartment homes and single family homes, which represents 0.8% of the total housing stock. The Company projects an increase of 72,350 jobs or 2.0%, and an increase in 2020 Same-Property revenues of between 2.6% to 3.6% in 2020.
Seattle Metro Region**:** As of December 31, 2019, this region represented 20% of the Company’s consolidated operating apartment homes. Same-Property revenues increased 3.8% in 2019 as compared to 2018. In 2020, the Company projects new residential supply of 13,400 apartment homes and single family homes, which represents 1.0% of the total housing stock. The
Company projects an increase of 43,200 jobs or 2.4%, and an increase in 2020 Same-Property revenues of between 3.5% to 4.5% in 2020.
In total, the Company projects an increase in 2020 Same-Property revenues of between 2.6% to 3.6%, as renewal and new leases are signed at higher rents in 2020 than 2019. Same-Property operating expenses are projected to increase in 2020 by 2.5% to 3.5%.
The Company’s consolidated operating communities are as follows:
| As of | As of | ||||||||||
| December 31, 2019 | December 31, 2018 | ||||||||||
| Apartment Homes | % | Apartment Homes | % | ||||||||
| Southern California | 22,674 | 45 | % | 22,674 | 46 | % | |||||
| Northern California | 17,556 | 35 | % | 16,136 | 33 | % | |||||
| Seattle Metro | 10,343 | 20 | % | 10,238 | 21 | % | |||||
| Total | 50,573 | 100 | % | 49,048 | 100 | % |
Co-investments, including Wesco I, Wesco III, Wesco IV, Wesco V, LLC, CPPIB, BEXAEW, BEX II, BEX III, and BEX IV communities, developments under construction, and preferred equity interest co-investment communities are not included in the table presented above for both periods.
RESULTS OF OPERATIONS
Comparison of Year Ended December 31, 2019 to the Year Ended December 31, 2018
The Company’s average financial occupancy for the Company’s stabilized apartment communities or "2019 Same-Property" (stabilized properties consolidated by the Company for the years ended December 31, 2019 and 2018) decreased 10 basis points to 96.6% in 2019 from 96.7% in 2018. Financial occupancy is defined as the percentage resulting from dividing actual rental income by total potential rental income. Actual rental income represents contractual rental income pursuant to leases without considering delinquency and concessions. Total potential rental income represents the value of all apartment homes, with occupied apartment homes valued at contractual rental rates pursuant to leases and vacant apartment homes valued at estimated market rents. The Company believes that financial occupancy is a meaningful measure of occupancy because it considers the value of each vacant apartment home at its estimated market rate.
Market rates are determined using the recently signed effective rates on new leases at the property and are used as the starting point in the determination of the market rates of vacant apartment homes. The Company may increase or decrease these rates based on a variety of factors, including overall supply and demand for housing, concentration of new apartment deliveries within the same submarket which can cause periodic disruption due to greater rental concessions to increase leasing velocity, and rental affordability. Financial occupancy may not completely reflect short-term trends in physical occupancy and financial occupancy rates, and the Company's calculation of financial occupancy may not be comparable to financial occupancy disclosed by other REITs.
The Company does not take into account delinquency and concessions to calculate actual rent for occupied apartment homes and market rents for vacant apartment homes. The calculation of financial occupancy compares contractual rates for occupied apartment homes to estimated market rents for unoccupied apartment homes, and thus the calculation compares the gross value of all apartment homes excluding delinquency and concessions. For apartment communities that are development properties in lease-up without stabilized occupancy figures, the Company believes the physical occupancy rate is the appropriate performance metric. While an apartment community is in the lease-up phase, the Company’s primary motivation is to stabilize the property, which may entail the use of rent concessions and other incentives, and thus financial occupancy, which is based on contractual income is not considered the best metric to quantify occupancy.
The regional breakdown of the Company’s 2019 Same-Property portfolio for financial occupancy for the years ended December 31, 2019 and 2018 is as follows:
| Years ended December 31, | |||||
| 2019 | 2018 | ||||
| Southern California | 96.6 | % | 96.7 | % | |
| Northern California | 96.7 | % | 96.8 | % | |
| Seattle Metro | 96.6 | % | 96.5 | % |
The following table provides a breakdown of revenue amounts, including the revenues attributable to 2019 Same-Properties.
| Number of Apartment | Years Ended December 31, | Dollar | Percentage | |||||||||||||||
| Property Revenues ($ in thousands) | Homes | 2019 | 2018 | Change | Change | |||||||||||||
| 2019 Same-Properties: | ||||||||||||||||||
| Southern California | 21,979 | $ | 590,943 | $ | 573,658 | $ | 17,285 | 3.0 | % | |||||||||
| Northern California | 15,685 | 530,970 | 511,679 | 19,291 | 3.8 | % | ||||||||||||
| Seattle Metro | 10,238 | 245,398 | 236,525 | 8,873 | 3.8 | % | ||||||||||||
| Total 2019 Same-Property revenues | 47,902 | 1,367,311 | 1,321,862 | 45,449 | 3.4 | % | ||||||||||||
| 2019 Non-Same Property Revenues | 83,317 | 69,008 | 14,309 | 20.7 | % | |||||||||||||
| Total property revenues | $ | 1,450,628 | $ | 1,390,870 | $ | 59,758 | 4.3 | % |
2019 Same-Property Revenues increased by $45.4 million or 3.4% to $1.4 billion for 2019 compared to $1.3 billion in 2018. The increase was primarily attributable to an increase of 3.4% in average rental rates from $2,242 per apartment home for 2018 to $2,318 per apartment home for 2019.
2019 Non-Same Property Revenues increased by $14.3 million or 20.7% to $83.3 million in 2019 compared to $69.0 million in 2018. The increase was primarily due to revenues generated from One South Market, which was consolidated in March 2019, Brio, which was acquired in June 2019, Marquis, which was consolidated in December 2018, and Station Park Green - Phase I, a development community that began producing rental income during the first quarter of 2018. These increases were partially offset by the sales of Domain in the second quarter of 2018 and 8th & Hope in the fourth quarter of 2018.
Management and other fees from affiliates increased by $0.3 million or 3.3% to $9.5 million in 2019 from $9.2 million in 2018. The increase is primarily due to the addition of The Courtyards at 65th Street, 777 Hamilton, and Velo and Ray communities to the Company's joint venture portfolio in 2019, offset slightly by the disposition of Mosso joint venture community in the fourth quarter of 2019.
Property operating expenses, excluding real estate taxes increased by $8.7 million or 3.7% to $242.5 million in 2019 compared to $233.8 million in 2018, primarily due to an increase of $3.8 million in utilities expenses as well as an increase of $3.2 million in administrative expenses. 2019 Same-Property operating expenses, excluding real estate taxes, increased by $6.5 million or 2.9% to $232.5 million in 2019 compared to $226.0 million in 2018, primarily due to increases of $2.7 million in both administrative expenses and utilities expenses.
Real estate taxes increased by $3.6 million or 2.4% to $155.2 million in 2019 compared to $151.6 million in 2018, primarily due to increases in property valuations in Southern and Northern California and property tax expenses for Brio, which was acquired in the second quarter of 2019, offset by favorable tax assessments in the Seattle Metro region. 2019 Same-Property real estate taxes increased by $1.9 million or 1.3% to $145.3 million in 2019 compared to $143.4 million in 2018 primarily due to increases in property valuations in Southern and Northern California, offset by favorable tax assessments in the Seattle Metro region.
Corporate-level property management expenses increased by $1.8 million or 5.8% to $32.9 million in 2019 compared to $31.1 million in 2018, primarily due to an increase in corporate-level property management and staffing costs supporting the communities.
Depreciation and amortization expense increased by $3.9 million or 0.8% to $483.8 million in 2019 compared to $479.9 million in 2018, primarily due to the completion of the Station Park Green - Phase I development during the first and second quarters of 2018, consolidation of Marquis in the fourth quarter of 2018, consolidation of One South Market in the first quarter of 2019, and the acquisition of Brio in the second quarter of 2019. The increase was partially offset by the sales of Domain in the second quarter of 2018 and 8th & Hope in the fourth quarter of 2018.
Impairment loss of $7.1 million in 2019 related to a consolidated CPPIB co-investment that owned land held for future development in Moorpark, CA. The impairment charge resulted from the Company’s offer to acquire the joint venture partner’s 45% interest in the co-investment of the land parcel at an amount lower than the carrying value.
Loss on sale of real estate and land of $3.2 million in 2019 was primarily attributable to the sale of land in San Mateo, CA that had been held for future development. The Company's $61.9 million gain in 2018 was attributable to the sales of Domain in the second quarter of 2018 and 8th & Hope in the fourth quarter of 2018, which resulted in gains of $22.3 million and $39.6 million, respectively, for the Company.
Interest expense decreased by $3.2 million or 1.5% to $217.3 million in 2019 compared to $220.5 million in 2018*,* primarily due to various debt that was paid off or matured and regular principal amortization during and after 2018, which resulted in a decrease in interest expense of $30.0 million for 2019. Additionally, there was a $5.5 million increase in capitalized interest during 2019, which was due to an increase in development costs as compared to 2018. These decreases in interest expense were partially offset by an increase in average outstanding debt primarily as a result of the issuance of $300.0 million of senior unsecured notes due March 15, 2048 in March 2018, $500.0 million of senior unsecured notes due March 1, 2029 in February and March 2019, and $550.0 million of senior unsecured notes due January 15, 2030 in August 2019 and October 2019, which resulted in an increase of $32.3 million interest expense for 2019 as compared to 2018.
Total return swap income of $8.4 million in 2019 consists of monthly settlements related to the Company's total return swap contracts that were entered into during 2015, in connection with issuing $257.3 million of fixed rate tax-exempt mortgage notes. The decrease of $0.3 million or 3.4% from $8.7 million in 2018 was due to less favorable interest rates in 2019.
Interest and other income increased $23.3 million or 101.3% to $46.3 million in 2019 compared to $23.0 million in 2018, primarily due to an increase from unrealized gains (losses) on marketable securities of $10.9 million, $7.0 million of accelerated interest income from the maturity of a mortgage backed security investment recognized in 2019, and an increase of $5.1 million in marketable securities and other income.
Equity income from co-investments increased by $23.0 million or 25.8% to $112.1 million in 2019 compared to $89.1 million in 2018, primarily due to an increase in gains from the sale of co-investment communities of $40.5 million from sale of the Mosso co-investment community in 2019, an increase of $7.3 million in income from preferred equity investments, and a net unrealized gain of $4.4 million from an unconsolidated co-investment during the third quarter of 2019. The increase was partially offset by a decrease of $19.7 million in promote income and an $11.5 million other-than-temporary impairment charge on an unconsolidated CPPIB co-investment recognized in the fourth quarter of 2019.
Deferred tax expense on unrealized gain on unconsolidated co-investment of $1.5 million in 2019 resulted from a net unrealized gain of $4.4 million from an unconsolidated co-investment during the third quarter of 2019.
Gain on early retirement of debt, net of $3.7 million in 2019 was primarily due to early repayment of a $289.1 million secured mortgage note payable in September 2019, offset slightly by early repayment of approximately $122.5 million of secured mortgage notes in the fourth quarter of 2019.
Gain on remeasurement of co-investment of $31.5 million in 2019 resulted from the purchase of the Company's joint venture partner's 45.0% membership interest in the One South Market co-investment in March 2019. Gain on remeasurement of $1.3 million in 2018 resulted from the purchase of the Company's joint venture partner's 49.9% membership interest in the Marquis co-investment in December 2018.
Comparison of Year Ended December 31, 2018 to the Year Ended December 31, 2017
The Company’s average financial occupancy for the Company’s stabilized apartment communities or "2018 Same-Property" (stabilized properties consolidated by the Company for the years ended December 31, 2018 and 2017) increased 10 basis points to 96.7% in 2018 from 96.6% in 2017. The regional breakdown of the Company's 2018 Same-Property portfolio for financial occupancy for the years ended December 31, 2018 and 2017 is as follows:
| Years ended December 31, | |||||
| 2018 | 2017 | ||||
| Southern California | 96.7 | % | 96.6 | % | |
| Northern California | 96.8 | % | 96.8 | % | |
| Seattle Metro | 96.5 | % | 96.4 | % |
The following table provides a breakdown of revenue amounts, including the revenues attributable to 2018 Same-Properties:
| Number of Apartment | Years Ended December 31, | Dollar | Percentage | |||||||||||||||
| Property Revenues ($ in thousands) | Homes | 2018 | 2017 | Change | Change | |||||||||||||
| 2018 Same-Properties: | ||||||||||||||||||
| Southern California | 21,979 | $ | 573,658 | $ | 556,630 | $ | 17,028 | 3.1 | % | |||||||||
| Northern California | 14,356 | 469,457 | 458,241 | 11,216 | 2.4 | % | ||||||||||||
| Seattle Metro | 10,238 | 236,525 | 229,872 | 6,653 | 2.9 | % | ||||||||||||
| Total 2018 Same-Property revenues | 46,573 | 1,279,640 | 1,244,743 | 34,897 | 2.8 | % | ||||||||||||
| 2018 Non-Same Property Revenues | 111,230 | 109,582 | 1,648 | 1.5 | % | |||||||||||||
| Total property revenues | $ | 1,390,870 | $ | 1,354,325 | $ | 36,545 | 2.7 | % |
2018 Same-Property Revenues increased by $34.9 million or 2.8% to $1.3 billion for 2018 compared to $1.2 billion in 2017. The increase was primarily attributable to an increase of 2.5% in average rental rates from $2,177 per apartment home for 2017 to $2,231 per apartment home for 2018.
2018 Non-Same Property Revenues increased by $1.6 million or 1.5% to $111.2 million in 2018 compared to $109.6 million in 2017. The increase was primarily due to revenue generated by Station Park Green - Phase I, a development community, which began producing rental income during the first quarter of 2018, and Sage at Cupertino, which was consolidated in March 2017, offset by the sales of Domain in the second quarter of 2018 and 8th & Hope in the fourth quarter of 2018.
Management and other fees from affiliates decreased by $0.4 million or 4.2% to $9.2 million in 2018 from $9.6 million in 2017. The decrease is primarily due to lower asset management fees caused by the amendment of the Wesco I joint venture operating agreement in October 2017.
Property operating expenses, excluding real estate taxes increased by $4.7 million or 2.1% to $233.8 million in 2018 compared to $229.1 million in 2017, primarily due to an increase of $2.4 million in maintenance and repairs expenses as well as an increase of $2.3 million in utilities expenses. 2018 Same-Property operating expenses excluding real estate taxes, increased by $4.2 million or 2.0% to $218.7 million in 2018 compared to $214.5 million in 2017, primarily due to a $2.2 million increase in maintenance and repairs expenses as well as an increase of $2.2 million in utilities expenses.
Real estate taxes increased by $5.3 million or 3.6% to $151.6 million in 2018 compared to $146.3 million in 2017, primarily due to the acquisition of Marquis and increases in tax rates and property valuations, offset by the sales of Domain in the second quarter of 2018 and 8th & Hope in the fourth quarter of 2018. 2018 Same-Property real estate taxes increased by $4.9 million or 3.7% to $138.4 million in 2018 compared to $133.5 million in 2017 due to increases in tax rates and property valuations.
Corporate-level property management expenses increased by $0.9 million or 3.0% to $31.1 million in 2018 compared to $30.2 million in 2017, primarily due to an increase in corporate-level property management and staffing costs supporting the communities.
Depreciation and amortization expense increased by $11.0 million or 2.3% to $479.9 million in 2018 compared to $468.9 million in 2017, primarily due to the completion of the Station Park Green - Phase I development during the first and second quarters of 2018, the consolidation of Sage at Cupertino in March 2017, as well as an increase in redevelopment activity in 2018 versus 2017, partially offset by a decrease due to the sales of Domain in the second quarter of 2018 and 8th & Hope in the fourth quarter of 2018.
Gain on sale of real estate and land increased by $35.5 million or 134.5% to $61.9 million in 2018 compared to $26.4 million in 2017. The Company's 2018 gain was attributable to the sales of Domain in the second quarter of 2018 and 8th & Hope in the fourth quarter of 2018, which resulted in a gain of $22.3 million and $39.6 million, respectively, for the Company. The Company's 2017 gain was primarily attributable to the sale of Jefferson at Hollywood, which resulted in a gain of $26.2 million.
Interest expense decreased by $2.4 million or 1.1% to $220.5 million in 2018 compared to $222.9 million in 2017*,* primarily due to debt that was paid off or matured and regular principal amortization during and after 2017, which resulted in a decrease in interest expense of $16.2 million for 2018. Additionally, there was a $4.8 million increase in capitalized interest during 2018, which was due to an increase in development costs as compared to 2017. These decreases in interest expense were partially offset by an increase in average outstanding debt primarily as a result of the issuance of $350.0 million senior unsecured notes due May 1, 2027 in April 2017 and $300.0 million senior unsecured notes due March 15, 2048 in March 2018, which resulted in an increase of $18.6 million interest expense for 2018 as compared to 2017.
Total return swap income of $8.7 million in 2018 consists of monthly settlements related to the Company's total return swap contracts that were entered into during 2015, in connection with issuing $257.3 million of fixed rate tax-exempt mortgage notes payable. The decrease of $1.4 million or 13.9% from $10.1 million in 2017 was due to less favorable interest rates in 2018.
Interest and other income decreased by $1.6 million or 6.5% to $23.0 million in 2018 compared to $24.6 million in 2017, primarily due to unrealized losses on marketable securities of $5.2 million that were recognized through income during 2018, partially offset by an increase in marketable securities and other interest income of $4.2 million.
Equity income from co-investments increased by $2.7 million or 3.1% to $89.1 million in 2018 compared to $86.4 million in 2017, primarily due to $20.5 million of co-investment promote income from the BEXAEW joint venture recognized during the first quarter of 2018, an increase in income from preferred equity investments of $11.8 million, and a gain on early retirement of debt from an unconsolidated co-investment of $3.7 million in the third quarter of 2018, partially offset by a decrease in gains on sales of co-investment communities of $34.3 million.
Gain on remeasurement of co-investment of $1.3 million in 2018 resulted from the purchase of the Company's joint venture partner's 49.9% membership interest in the Marquis co-investment in December 2018. Gain on remeasurement of $88.6 million in 2017 resulted from the purchase of the Company's joint venture partner's 50% membership interest in the Palm Valley co-investment in January 2017.
Liquidity and Capital Resources
The following table sets forth the Company’s cash flows for 2019, 2018 and 2017 ($ in thousands):
| For the year ended December 31, | ||||||||||||
| 2019 | 2018 | 2017 | ||||||||||
| Cash flow provided by (used in): | ||||||||||||
| Operating activities | $ | 919,079 | $ | 826,554 | $ | 769,607 | ||||||
| Investing activities | $ | (527,691 | ) | $ | (59,893 | ) | $ | (567,940 | ) | |||
| Financing activities | $ | (461,689 | ) | $ | (676,392 | ) | $ | (310,843 | ) |
Essex’s business is operated primarily through the Operating Partnership. Essex issues public equity from time to time, but does not otherwise generate any capital itself or conduct any business itself, other than incurring certain expenses from operating as a public company which are fully reimbursed by the Operating Partnership. Essex itself does not hold any indebtedness, and its only material asset is its ownership of partnership interests of the Operating Partnership. Essex’s principal funding requirement is the payment of dividends on its common stock and preferred stock. Essex’s sole source of funding for its dividend payments is distributions it receives from the Operating Partnership.
As of December 31, 2019, Essex owned a 96.6% general partner interest and the limited partners owned the remaining 3.4% interest in the Operating Partnership.
The liquidity of Essex is dependent on the Operating Partnership’s ability to make sufficient distributions to Essex. The primary cash requirement of Essex is its payment of dividends to its stockholders. Essex also guarantees some of the Operating Partnership’s debt, as discussed further in Notes 7 and 8 to our consolidated financial statements included in Part IV, Item 15 of this Annual Report on Form 10-K. If the Operating Partnership fails to fulfill certain of its debt requirements, which trigger Essex’s guarantee obligations, then Essex will be required to fulfill its cash payment commitments under such guarantees. However, Essex’s only significant asset is its investment in the Operating Partnership.
For Essex to maintain its qualification as a REIT, it must pay dividends to its stockholders aggregating annually at least 90% of its REIT taxable income, excluding net capital gains. While historically Essex has satisfied this distribution requirement by making cash distributions to its stockholders, it may choose to satisfy this requirement by making distributions of other property, including, in limited circumstances, Essex’s own stock. As a result of this distribution requirement, the Operating Partnership cannot rely on retained earnings to fund its ongoing operations to the same extent that other companies whose parent companies are not REITs can. Essex may need to continue to raise capital in the equity markets to fund the Operating Partnership’s working capital needs, acquisitions and developments.
At December 31, 2019, the Company had $70.1 million of unrestricted cash and cash equivalents and $144.2 million in marketable securities, of which $71.5 million were equity securities or available for sale debt securities. The Company believes that cash flows generated by its operations, existing cash and cash equivalents, marketable securities balances, availability under existing lines of credit, access to capital markets and the ability to generate cash from the disposition of real estate are sufficient to meet all of the Company’s reasonably anticipated cash needs during 2020. The timing, source and amounts of cash flows provided by financing activities and used in investing activities are sensitive to changes in interest rates and other fluctuations in the capital markets environment, which can affect the Company’s plans for acquisitions, dispositions, development and redevelopment activities.
As of December 31, 2019, the Company had $200.0 million of private placement unsecured bonds outstanding at an average interest rate of 4.4% with maturity dates ranging from April 2021 through August 2021.
As of December 31, 2019, the Company had $4.3 billion of fixed rate public bonds outstanding at an average interest rate of 3.8% with maturity dates ranging from 2021 to 2048.
As of December 31, 2019, the Company had $350.0 million outstanding on its unsecured term loan. The unsecured term loan bears a variable interest rate of LIBOR plus 0.95%. The Company has five interest rate swap contracts, with an aggregate notional balance of $175.0 million, which effectively converts the interest rate on $175.0 million of the unsecured term loan to a fixed rate of 2.3%.
As of December 31, 2019, the Company’s mortgage notes payable totaled $1.0 billion, net of unamortized premiums and debt issuance costs, which consisted of $0.7 billion in fixed rate debt at an average interest rate of 4.7% and maturity dates ranging from 2020 to 2028 and $254.2 million of tax-exempt variable rate demand notes with a weighted average interest rate of 2.3%. The tax-exempt variable rate demand notes have maturity dates ranging from 2027 to 2046. $255.4 million is subject to total return swaps.
As of December 31, 2019, the Company had two unsecured lines of credit aggregating $1.24 billion, including a $1.2 billion unsecured line of credit and a $35.0 million working capital unsecured line of credit. As of December 31, 2019, there was $55.0 million outstanding on the $1.2 billion unsecured line of credit. The interest rate is based on a tiered rate structure tied to the Company's credit ratings and was LIBOR plus 0.825% as of December 31, 2019. In January 2020 this line of credit was amended such that the scheduled maturity date was extended to December 2023 with one 18-month extension, exercisable at the Company's option. The interest rate on the amended line is based on a tiered rate structure tied to the Company's credit ratings and is currently at LIBOR plus 0.825%. As of December 31, 2019, there was no amount outstanding on the Company's $35.0 million working capital unsecured line of credit. The interest rate on the line is based on a tiered rate structure tied to the Company's credit ratings and was LIBOR plus 0.825% as of December 31, 2019 with a scheduled maturity date in February 2021.
The Company’s unsecured lines of credit and unsecured debt agreements contain debt covenants related to limitations on indebtedness and liabilities and maintenance of minimum levels of consolidated earnings before depreciation, interest and amortization. The Company was in compliance with the debt covenants as of December 31, 2019 and 2018.
The Company pays quarterly dividends from cash available for distribution. Until it is distributed, cash available for distribution is invested by the Company primarily in investment grade securities held available for sale or is used by the Company to reduce balances outstanding under its lines of credit.
Derivative Activity
The Company uses interest rate swaps, interest rate caps, and total return swap contracts to manage certain interest rate risks. The valuation of these instruments is determined using widely accepted valuation techniques including discounted cash flow analysis on the expected cash flows of each derivative. This analysis reflects the contractual terms of the derivatives, including the period to maturity, and uses observable market-based inputs, including interest rate curves. The fair values of interest rate swaps and total return swaps are determined using the market standard methodology of netting the discounted future fixed cash receipts (or payments) and the discounted expected variable cash payments (or receipts). The variable cash payments (or receipts) are based on an expectation of future interest rates (forward curves) derived from observable market interest rate curves. The Company incorporates credit valuation adjustments to appropriately reflect both its own nonperformance risk and the respective counterparty's nonperformance risk in the fair value measurements.
The Company has entered into interest rate swap contracts with an aggregate notional amount of $175.0 million that effectively fixed the interest rate on the $175.0 million of the $350.0 million unsecured term loan at 2.3%. These derivatives qualify for hedge accounting.
The Company has four total return swap contracts, with an aggregate notional amount of $255.4 million, that effectively converts $255.4 million of mortgage notes payable to a floating interest rate based on the Securities Industry and Financial Markets Association Municipal Swap Index ("SIFMA") plus a spread. The total return swaps provide fair market value protection on the mortgage notes payable to our counterparties during the initial period of the total return swap until the Company's option to call the mortgage notes at par can be exercised. The Company can currently call all four of the total return swaps, with $255.4 million of the outstanding debt at par. These derivatives do not qualify for hedge accounting.
As of December 31, 2019, the Company had no interest rate caps. As of December 31, 2018, the Company had interest rate caps, which were not accounted for as hedges, totaling a notional amount of $9.9 million that effectively limited the Company’s exposure to interest rate risk by providing a ceiling on the variable interest rate for $9.9 million of the Company’s tax exempt variable rate debt. These interest rate caps matured in December 2019.
As of December 31, 2019 and 2018, the aggregate carrying value of the interest rate swap contracts was an asset of $1.0 million and $5.8 million, respectively, and is included in prepaid expenses and other assets on the consolidated balance sheets, and a liability of $0.2 million and zero, respectively, and is included in other liabilities on the consolidated balance sheets. The aggregate carrying value of the interest rate caps was zero on the balance sheets as of both December 31, 2019 and 2018. The aggregate carrying and fair value of the total return swaps was zero at both December 31, 2019 and 2018.
Hedge ineffectiveness related to cash flow hedges, which is reported in current year income as interest expense, net was a loss of $0.2 million, a loss of $0.1 million, and a gain of $0.1 million, for the years ended December 31, 2019, 2018, and 2017, respectively.
Issuance of Common Stock
In September 2018, the Company filed a new shelf registration statement with the SEC, allowing the Company to sell an undetermined number or amount of certain equity and debt securities of the Company, as defined in the prospectus contained in the shelf registration statement.
Also in September 2018, the Company entered into a new equity distribution agreement pursuant to which the Company may offer and sell shares of its common stock having an aggregate gross sales price of up to $900.0 million (the "2018 ATM Program"). In connection with the 2018 ATM Program, the Company may also enter into related forward sale agreements whereby, at the Company’s discretion, it may sell shares of its common stock under the 2018 ATM Program under forward sale agreements. The use of a forward sale agreement would allow the Company to lock in a share price on the sale of shares of its common stock at the time the agreement is executed, but defer receiving the proceeds from the sale of shares until a later date. The Company anticipates using the net proceeds, which are contributed to the Operating Partnership, to acquire, develop, or redevelop properties, which primarily will be apartment communities, to make other investments and for working capital or general corporate purposes, which may include the repayment of indebtedness.
For the year ended December 31, 2019, the Company issued 228,271 shares of common stock through the 2018 ATM Program at an average price of $321.56 per share for proceeds of $73.4 million. For the year ended December 31, 2018, the Company did not sell any shares of its common stock through the 2018 ATM Program or through the previous equity distribution agreement. For the year ended December 31, 2017, the Company issued 345,444 shares of common stock through the previous equity distribution agreement at an average price of $260.38 per share for total proceeds of $89.9 million. As of December 31, 2019, $826.6 million of shares remains available to be sold under the 2018 ATM Program.
Capital Expenditures
Non-revenue generating capital expenditures are improvements and upgrades that extend the useful life of the property. For the year ended December 31, 2019, non-revenue generating capital expenditures totaled approximately $1,764 per apartment home. These expenditures do not include the improvements required in connection with the origination of mortgage loans, expenditures for deferred maintenance on acquisition properties, expenditures for property renovations and improvements which are expected to generate additional revenue or cost savings, and do not include expenditures incurred due to changes in government regulations that the Company would not have incurred otherwise, or expenditures for which the Company expects to be reimbursed. The Company expects that cash from operations and/or its lines of credit will fund such expenditures.
Development and Predevelopment Pipeline
The Company defines development projects as new communities that are being constructed, or are newly constructed and are in a phase of lease-up and have not yet reached stabilized operations. As of December 31, 2019, the Company's development pipeline was comprised of five consolidated projects under development, two unconsolidated joint venture projects under development and various consolidated predevelopment projects, aggregating 1,960 apartment homes, with total incurred costs of $1.0 billion, and estimated remaining project costs of approximately $222.0 million, $193.0 million of which represents the Company's estimated remaining costs, for total estimated project costs of $1.3 billion.
The Company defines predevelopment projects as proposed communities in negotiation or in the entitlement process with an expected high likelihood of becoming entitled development projects. The Company may also acquire land for future development purposes or sale.
The Company expects to fund the development and predevelopment pipeline by using a combination of some or all of the following sources: its working capital, amounts available on its lines of credit, construction loans, net proceeds from public and private equity and debt issuances, and proceeds from the disposition of assets, if any.
Redevelopment Pipeline
The Company defines redevelopment communities as existing properties owned or recently acquired, which have been targeted for additional investment by the Company with the expectation of increased financial returns through property improvement. During redevelopment, apartment homes may not be available for rent and, as a result, may have less than stabilized operations. As of December 31, 2019, the Company had ownership interests in four major redevelopment communities aggregating 1,327 apartment homes with estimated redevelopment costs of $132.7 million, of which approximately $14.9 million remains to be expended.
Alternative Capital Sources
The Company utilizes co-investments as an alternative source of capital for acquisitions of both operating and development communities. As of December 31, 2019, the Company had an interest in 806 apartment homes in communities actively under development with joint ventures for total estimated costs of $0.6 billion. Total estimated remaining costs total approximately $0.1 billion, of which the Company estimates that its remaining investment in these development joint ventures will be approximately $29.5 million. In addition, the Company had an interest in 10,672 apartment homes in operating communities with joint ventures for a total book value of $0.7 billion.
Contractual Obligations and Commercial Commitments
The following table summarizes our obligations at December 31, 2019 ($ in thousands):
| For the Fiscal Years Ending | ||||||||||||||||||||
| 2020 | 2021 and 2022 | 2023 and 2024 | Thereafter | Total | ||||||||||||||||
| Mortgage notes payable | $ | 288,057 | $ | 74,841 | $ | 6,054 | $ | 618,383 | $ | 987,335 | ||||||||||
| Unsecured debt | — | 1,150,000 | 1,000,000 | 2,650,000 | 4,800,000 | |||||||||||||||
| Lines of credit | — | — | 55,000 | — | 55,000 | |||||||||||||||
| Interest on indebtedness (1) | 209,711 | 343,462 | 254,353 | 622,817 | 1,430,343 | |||||||||||||||
| Ground leases | 3,506 | 7,012 | 7,012 | 124,991 | 142,521 | |||||||||||||||
| Operating leases | 3,349 | 6,753 | 6,433 | 21,682 | 38,217 | |||||||||||||||
| $ | 504,623 | $ | 1,582,068 | $ | 1,328,852 | $ | 4,037,873 | $ | 7,453,416 |
| (1) | Interest on indebtedness for variable debt was calculated using interest rates as of December 31, 2019. |
We have a commitment, which is not reflected in the table above, to make additional capital contributions to a limited partnership in which we hold an equity interest. The capital contributions may be called by the general partner at any time until September 2022 after giving appropriate notice. As of December 31, 2019, we had committed to make additional capital contributions totaling up to $8.1 million if and when called by the general partner of the limited partnership until September 2022.
Real Estate Commitments
The following table summarizes the Company's real estate commitment at December 31, 2019 ($ in thousands):
| Number of Properties | Investment | Remaining Commitment | |||||||||
| Joint ventures: | |||||||||||
| Preferred equity investments | 7 | $ | 166,500 | $ | 20,300 | ||||||
| Real estate under development (1) | 2 | 245,825 | 29,500 | ||||||||
| Consolidated: | |||||||||||
| Real estate under development | 5 | 557,415 | 162,900 | ||||||||
| $ | 969,740 | $ | 212,700 |
| (1) | Estimated project cost for development of the Company's 500 Folsom project is net of a projected value for low-income housing tax credit proceeds and the value of the tax exempt bond structure. |
Variable Interest Entities
In accordance with accounting standards for consolidation of variable interest entities ("VIEs"), the Company consolidates the Operating Partnership, 17 DownREIT entities (comprising nine communities) and six co-investments as of December 31, 2019. As of December 31, 2018, the Company consolidated the Operating Partnership, 16 DownREIT entities (comprising eight communities), and eight co-investments. The Company consolidates these entities because it is deemed the primary beneficiary. Essex has no assets or liabilities other than its investment in the Operating Partnership. The consolidated total assets and liabilities related to the above consolidated co-investments and DownREIT entities, net of intercompany eliminations, were approximately $1.0 billion and $364.3 million, respectively, as of December 31, 2019, and $849.8 million and $261.7 million, respectively, as of December 31, 2018. Noncontrolling interests in these entities were $122.5 million and $64.5 million as of December 31, 2019 and 2018, respectively. The Company's financial risk in each VIE is limited to its equity investment in the VIE. As of December 31, 2019, the Company did not have any other VIEs of which it was deemed to be the primary beneficiary and did not have any VIEs of which it was not deemed to be the primary beneficiary.
Critical Accounting Policies and Estimates
The preparation of consolidated financial statements, in accordance with U.S. GAAP, requires the Company to make estimates and judgments that affect the reported amounts of assets, liabilities, revenues and expenses and related disclosures of
contingent assets and liabilities. The Company defines critical accounting policies as those accounting policies that require the Company's management to exercise their most difficult, subjective and complex judgments. The Company’s critical accounting policies and estimates relate principally to the following key areas: (i) accounting for the acquisition of investments in real estate (specifically, the allocation between land and buildings); and (ii) evaluation of events and changes in circumstances indicating whether the Company’s rental properties may be impaired. The Company bases its estimates on historical experience, current market conditions, and on various other assumptions that are believed to be reasonable under the circumstances. Actual results may differ from those estimates made by management.
The Company accounts for its acquisitions of investments in real estate by assessing each acquisition to determine if it meets the definition of a business or if it qualifies as an asset acquisition. We expect that acquisitions of individual operating communities will generally be viewed as asset acquisitions, and result in the capitalization of acquisition costs, and the allocation of purchase price to the assets acquired and liabilities assumed based on the relative fair value of the respective assets and liabilities.
In making estimates of relative fair values for purposes of allocating purchase price, the Company utilizes a number of sources, including independent land appraisals which consider comparable market transactions, its own analysis of recently acquired or developed comparable properties in our portfolio for land comparables and building replacement costs, and other publicly available market data. In calculating the fair value of identified intangible assets of an acquired property, the in-place leases are valued based on in-place rent rates and amortized over the average remaining term of all acquired leases.
The Company periodically assesses the carrying value of its real estate investments for indicators of impairment. The judgments regarding the existence of impairment indicators are based on monitoring investment market conditions and performance compared to budget for operating properties including the net operating income for the most recent 12 month period, monitoring estimated costs for properties under development, the Company's ability to hold and its intent with regard to each asset, and each property's remaining useful life. Whenever events or changes in circumstances indicate that the carrying amount of a property held for investment may not be fully recoverable, the carrying amount is evaluated. If the sum of the property’s expected future cash flows (undiscounted and without interest charges) is less than the carrying amount of the property, then the Company will recognize an impairment loss equal to the excess of the carrying amount over the fair value of the property.
When the Company determines that a property is held for sale, it discontinues the periodic depreciation of that property. The criteria for determining when a property is held for sale requires judgment and has potential financial statement impact as depreciation would cease and an impairment loss could occur upon determination of held for sale status. Assets held for sale are reported at the lower of the carrying amount or estimated fair value less costs to sell.
The Company bases its accounting estimates on historical experience and on various other assumptions that are believed to be reasonable under the circumstances. Actual results may vary from those estimates and those estimates could be different under different assumptions or conditions.
Net Operating Income
Net operating income ("NOI") and Same-Property NOI are considered by management to be important supplemental performance measures to earnings from operations included in the Company’s consolidated statements of income. The presentation of Same-Property NOI assists with the presentation of the Company’s operations prior to the allocation of depreciation and any corporate-level or financing-related costs. NOI reflects the operating performance of a community and allows for an easy comparison of the operating performance of individual communities or groups of communities. In addition, because prospective buyers of real estate have different financing and overhead structures, with varying marginal impacts to overhead by acquiring real estate, NOI is considered by many in the real estate industry to be a useful measure for determining the value of a real estate asset or group of assets. The Company defines Same-Property NOI as Same-Property revenues less Same-Property operating expenses, including property taxes. Please see the reconciliation of earnings from operations to NOI and Same-Property NOI, which in the table below is the NOI for stabilized properties consolidated by the Company for the periods presented ($ in thousands):
| 2019 | 2018 | 2017 | |||||||||
| Earnings from operations | $ | 481,112 | $ | 511,989 | $ | 472,945 | |||||
| Adjustments: | |||||||||||
| Corporate-level property management expenses | 32,899 | 31,062 | 30,156 | ||||||||
| Depreciation and amortization | 483,750 | 479,884 | 468,881 | ||||||||
| Management and other fees from affiliates | (9,527 | ) | (9,183 | ) | (9,574 | ) | |||||
| General and administrative | 54,262 | 53,451 | 41,385 | ||||||||
| Expensed acquisition and investment related costs | 168 | 194 | 1,569 | ||||||||
| Impairment loss | 7,105 | — | — | ||||||||
| (Gain) Loss on sale of real estate and land | 3,164 | (61,861 | ) | (26,423 | ) | ||||||
| NOI | 1,052,933 | 1,005,536 | 978,939 | ||||||||
| Less: Non Same-Property NOI | (63,492 | ) | (53,044 | ) | (55,389 | ) | |||||
| Same-Property NOI | $ | 989,441 | $ | 952,492 | $ | 923,550 |
Forward-Looking Statements
Certain statements in this "Management's Discussion and Analysis of Financial Condition and Results of Operations," and elsewhere in this Annual Report on Form 10-K which are not historical facts may be considered forward-looking statements within the meaning of Section 27A of the Securities Act and Section 21E of the Exchange Act, including statements regarding the Company's expectations, estimates, assumptions, hopes, intentions, beliefs and strategies regarding the future. Words such as "expects," "assumes," "anticipates," "may," "will," "intends," "plans," "projects," "believes," "seeks," "future," "estimates," and variations of such words and similar expressions are intended to identify such forward-looking statements. Such forward-looking statements include, among other things, statements regarding the Company's intent, beliefs or expectations with respect to the timing of completion of current development and redevelopment projects and the stabilization of such projects, the timing of lease-up and occupancy of its apartment communities, the anticipated operating performance of its apartment communities, the total projected costs of development and redevelopment projects, co-investment activities, qualification as a REIT under the Code, 2020 Same-Property revenue generally and in specific regions, 2020 Same-Property operating expenses, the real estate markets in the geographies in which the Company's properties are located and in the United States in general, the adequacy of future cash flows to meet anticipated cash needs, its financing activities and the use of proceeds from such activities, the availability of debt and equity financing, general economic conditions including the potential impacts from economic conditions, trends affecting the Company's financial condition or results of operations, changes to U.S. tax laws and regulations in general or specifically related to REITs or real estate, changes to laws and regulations in jurisdictions in which communities the Company owns are located, and other information that is not historical information.
While the Company's management believes the assumptions underlying its forward-looking statements are reasonable, such forward-looking statements involve known and unknown risks, uncertainties and other factors, many of which are beyond the Company’s control, which could cause the actual results, performance or achievements of the Company to be materially different from any future results, performance or achievements expressed or implied by such forward-looking statements. The Company cannot assure the future results or outcome of the matters described in these statements; rather, these statements merely reflect the Company’s current expectations of the approximate outcomes of the matters discussed. Factors that might cause the Company’s actual results, performance or achievements to differ materially from those expressed or implied by these forward-looking statements include, but are not limited to, the following: the Company may fail to achieve its business objectives; the actual completion of development and redevelopment projects may be subject to delays; the stabilization dates of such projects may be delayed; the Company may abandon or defer development or redevelopment projects for a number of reasons, including changes in local market conditions which make development less desirable, increases in costs of development, increases in the cost of capital or lack of capital availability, resulting in losses; the total projected costs of current development and redevelopment projects may exceed expectations; such development and redevelopment projects may not be completed; development and redevelopment projects and acquisitions may fail to meet expectations; estimates of future income from an acquired property may prove to be inaccurate; occupancy rates and rental demand may be adversely affected by competition and local economic and market conditions; there may be increased interest rates and operating costs; the Company may be unsuccessful in the management of its relationships with its co-investment partners; future cash flows may be inadequate to meet operating requirements and/or may be insufficient to provide for dividend payments in accordance with REIT requirements; there may be a downturn in general economic conditions, the real estate industry and the markets in which the Company's communities are located; changes in laws or regulations; the terms of any refinancing may not be as favorable as the terms of existing indebtedness; unexpected difficulties in leasing of development projects; volatility in financial and securities markets; the Company’s failure to successfully operate acquired properties; unforeseen consequences from cyber-
intrusion; the Company’s inability to maintain our investment grade credit rating with the rating agencies; government approvals, actions and initiatives, including the need for compliance with environmental requirements; and those further risks, special considerations, and other factors discussed in Item 1A, Risk Factors, of this Form 10-K, and those risk factors and special considerations set forth in the Company’s other filings with the SEC which may cause the actual results, performance or achievements of the Company to be materially different from any future results, performance or achievements expressed or implied by such forward-looking statements. All forward-looking statements are made as of the date hereof and the Company assumes no obligation to update or supplement this information for any reason, and therefore, they may not represent the Company's estimates and assumptions after the date of this report.
Item 7A. Quantitative and Qualitative Disclosures About Market Risks
Interest Rate Hedging Activities
The Company’s objective in using derivatives is to add stability to interest expense and to manage its exposure to interest rate movements or other identified risks. To accomplish this objective, the Company uses interest rate swaps as part of its cash flow hedging strategy. As of December 31, 2019, the Company had entered into five interest rate swap contracts to mitigate the risk of changes in the interest-related cash outflows on $175.0 million of the unsecured term debt. As of December 31, 2019, the Company also had $255.4 million of secured variable rate indebtedness. All of the Company’s interest rate swaps are designated as cash flow hedges as of December 31, 2019. The following table summarizes the notional amount, carrying value, and estimated fair value of the Company’s cash flow hedge derivative instruments used to hedge interest rates as of December 31, 2019. The notional amount represents the aggregate amount of a particular security that is currently hedged at one time, but does not represent exposure to credit, interest rates or market risks. The table also includes a sensitivity analysis to demonstrate the impact on the Company’s derivative instruments from an increase or decrease in 10-year Treasury bill interest rates by 50 basis points, as of December 31, 2019.
| Carrying and | Estimated Carrying Value | |||||||||||||||||
| Maturity | Estimated | + 50 | - 50 | |||||||||||||||
| ($ in thousands**)** | Notional Amount | Date Range | Fair Value | Basis Points | Basis Points | |||||||||||||
| Cash flow hedges: | ||||||||||||||||||
| Interest rate swaps | $ | 175,000 | 2022 | $ | 794 | $ | 2,556 | $ | 989 | |||||||||
| Total cash flow hedges | $ | 175,000 | 2022 | $ | 794 | $ | 2,556 | $ | 989 |
Additionally, the Company has entered into total return swap contracts, with an aggregate notional amount of $255.4 million that effectively convert $255.4 million of fixed mortgage notes payable to a floating interest rate based on the SIFMA plus a spread and have a carrying value of zero at December 31, 2019. The Company is exposed to insignificant interest rate risk on these swaps as the related mortgages are callable, at par, by the Company, co-terminus with the termination of any related swap. These derivatives do not qualify for hedge accounting.
Interest Rate Sensitive Liabilities
The Company is exposed to interest rate changes primarily as a result of its lines of credit and long-term debt used to maintain liquidity and fund capital expenditures and expansion of the Company’s real estate investment portfolio and operations. The Company’s interest rate risk management objective is to limit the impact of interest rate changes on earnings and cash flows and to lower its overall borrowing costs. To achieve its objectives, the Company borrows primarily at fixed rates and may enter into derivative financial instruments such as interest rate swaps, caps and treasury locks in order to mitigate its interest rate risk on a related financial instrument. The Company does not enter into derivative or interest rate transactions for speculative purposes.
The Company’s interest rate risk is monitored using a variety of techniques. The table below presents the principal amounts and weighted average interest rates by year of expected maturity to evaluate the expected cash flows. Management has estimated the fair value of the Company’s $5.2 billion of fixed rate debt at December 31, 2019, to be $5.4 billion. Management has estimated the fair value of the Company’s $660.4 million of variable rate debt at December 31, 2019, to be $655.8 million based on the terms of existing mortgage notes payable and variable rate demand notes compared to those available in the marketplace. The following table represents scheduled principal payments ($ in thousands):
| For the Years Ended December 31, | ||||||||||||||
| ($ in thousands, except for interest rates) | 2020 | 2021 | 2022 | 2023 | 2024 | Thereafter | Total | Fair value | ||||||
| Fixed rate debt | $287,405 | $530,940 | $342,408 | $602,093 | $402,177 | $3,016,884 | $5,181,907 | $5,410,106 | ||||||
| Average interest rate | 5.8% | 4.3% | 3.7% | 3.7% | 4.0% | 3.7% | ||||||||
| Variable rate debt (1) | $652 | $713 | $405,780 | $852 | $932 | $251,499 | $660,428 | $655,849 | ||||||
| Average interest rate | 2.4% | 2.4% | 2.7% | 2.4% | 2.4% | 2.3% |
| (1) | $175.0 million is subject to interest rate protection agreements ($175.0 million is subject to interest rate swaps). $255.4 million is subject to total return swaps. |
The table incorporates only those exposures that exist as of December 31, 2019; it does not consider those exposures or positions that could arise after that date. As a result, the Company’s ultimate realized gain or loss, with respect to interest rate fluctuations and hedging strategies would depend on the exposures that arise prior to settlement.
Item 8. Financial Statements and Supplementary Data
The response to this item is submitted as a separate section of this Form 10-K. See Item 15.
Item 9. Changes in and Disagreements with Accountants on Accounting and Financial Disclosure
Not applicable.
Item 9A. Controls and Procedures
Essex Property Trust, Inc.
As of December 31, 2019, Essex carried out an evaluation, under the supervision and with the participation of management, including Essex's Chief Executive Officer and Chief Financial Officer, of the effectiveness of the design and operation of Essex's disclosure controls and procedures (as defined in Rules 13a-15(e) and 15d-15(e) under the Exchange Act). Based upon that evaluation, Essex’s Chief Executive Officer and Chief Financial Officer concluded that as of December 31, 2019, Essex’s disclosure controls and procedures were effective to ensure that the information required to be disclosed by Essex in the reports that Essex files or submits under the Exchange Act was recorded, processed, summarized and reported within the time periods specified in the SEC's rules and forms and that such disclosure controls and procedures were also effective to ensure that information required to be disclosed in the reports that Essex files or submits under the Exchange Act is accumulated and communicated to Essex’s management, including Essex’s Chief Executive Officer and Chief Financial Officer, to allow timely decisions regarding required disclosure.
There were no changes in Essex’s internal control over financial reporting, that occurred during the quarter ended December 31, 2019, that have materially affected, or are reasonably likely to materially affect, Essex’s internal control over financial reporting.
Management’s Report on Internal Control Over Financial Reporting
Essex’s management is responsible for establishing and maintaining adequate internal control over financial reporting (as defined in Rule 13a-15(f) under the Exchange Act). Essex’s management assessed the effectiveness of Essex’s internal control over financial reporting as of December 31, 2019. In making this assessment, Essex’s management used the criteria set forth in the report entitled "Internal Control-Integrated Framework (2013)" published by the Committee of Sponsoring Organizations of the Treadway Commission ("COSO"). Essex’s management has concluded that, as of December 31, 2019, its internal control over financial reporting was effective based on these criteria. Essex’s independent registered public accounting firm, KPMG LLP, has issued an attestation report over Essex’s internal control over financial reporting, which is included herein.
Essex Portfolio, L.P.
As of December 31, 2019, the Operating Partnership carried out an evaluation, under the supervision and with the participation of management, including Essex's Chief Executive Officer and Chief Financial Officer, of the effectiveness of the design and operation of the Operating Partnership's disclosure controls and procedures (as defined in Rules 13a-15(e) and 15d-15(e) under the Exchange Act). Based upon that evaluation, the Chief Executive Officer and Chief Financial Officer concluded that as of December 31, 2019, the Operating Partnership’s disclosure controls and procedures were effective to ensure that the information required to be disclosed by the Operating Partnership in the reports that the Operating Partnership files or submits under the Exchange Act was recorded, processed, summarized and reported within the time periods specified in the SEC's rules and forms and that such disclosure controls and procedures were also effective to ensure that information required to be disclosed in the reports that the Operating Partnership files or submits under the Exchange Act is accumulated and communicated to the Operating Partnership’s management, including Essex's Chief Executive Officer and Chief Financial Officer, to allow timely decisions regarding required disclosure.
There were no changes in the Operating Partnership’s internal control over financial reporting, that occurred during the quarter ended December 31, 2019, that have materially affected, or are reasonably likely to materially affect, the Operating Partnership’s internal control over financial reporting.
Management’s Report on Internal Control Over Financial Reporting
The Operating Partnership’s management is responsible for establishing and maintaining adequate internal control over financial reporting (as defined in Rule 13a-15(f) under the Exchange Act). The Operating Partnership’s management assessed the effectiveness of the Operating Partnership’s internal control over financial reporting as of December 31, 2019. In making this assessment, the Operating Partnership’s management used the criteria set forth in the report entitled "Internal Control-Integrated Framework (2013)" published by COSO. The Operating Partnership’s management has concluded that, as of December 31, 2019, its internal control over financial reporting was effective based on these criteria.
Item 9B. Other Information
Item 10. Directors, Executive Officers and Corporate Governance
The information required by this Item is incorporated herein by reference from our Proxy Statement, relating to our 2020 Annual Meeting of Stockholders, under the heading "Board and Corporate Governance Matters," to be filed with the SEC within 120 days of December 31, 2019.
Item 11. Executive Compensation
The information required by this Item is incorporated herein by reference from our Proxy Statement, relating to our 2020 Annual Meeting of Stockholders, under the headings "Executive Compensation" and "Director Compensation," to be filed with the SEC within 120 days of December 31, 2019.
Item 12. Security Ownership of Certain Beneficial Owners and Management and Related Stockholder Matters
The information required by this Item is incorporated herein by reference from our Proxy Statement, relating to our 2020 Annual Meeting of Stockholders, under the heading "Security Ownership of Certain Beneficial Owners and Management," to be filed with the SEC within 120 days of December 31, 2019.
Item 13. Certain Relationships and Related Transactions and Director Independence
The information required by this Item is incorporated herein by reference from our Proxy Statement, relating to our 2020 Annual Meeting of Stockholders, under the heading "Certain Relationships and Related Persons Transactions," to be filed with the SEC within 120 days of December 31, 2019.
Item 14. Principal Accounting Fees and Services
The information required by this Item is incorporated herein by reference from our Proxy Statement, relating to our 2020 Annual Meeting of Stockholders, under the headings "Report of the Audit Committee" and "Fees Paid to KPMG LLP," to be filed with the SEC within 120 days of December 31, 2019.
PART IV
Item 15. Exhibits and Financial Statement Schedules
(A) Financial Statements
| (1) Consolidated Financial Statements of Essex Property Trust, Inc. | Page |
| Reports of Independent Registered Public Accounting Firm | F- 1 |
| Consolidated Balance Sheets: As of December 31, 2019 and 2018 | F- 6 |
| Consolidated Statements of Income: Years ended December 31, 2019, 2018, and 2017 | F- 7 |
| Consolidated Statements of Comprehensive Income: Years ended December 31, 2019, 2018, and 2017 | F- 8 |
| Consolidated Statements of Equity: Years ended December 31, 2019, 2018, and 2017 | F- 9 |
| Consolidated Statements of Cash Flows: Years ended December 31, 2019, 2018, and 2017 | F- 11 |
| Notes to Consolidated Financial Statements | F- 20 |
| (2) Consolidated Financial Statements of Essex Portfolio, L.P. | |
| Report of Independent Registered Public Accounting Firm | F- 4 |
| Consolidated Balance Sheets: As of December 31, 2019 and 2018 | F- 13 |
| Consolidated Statements of Income: Years ended December 31, 2019, 2018, and 2017 | F- 14 |
| Consolidated Statements of Comprehensive Income: Years ended December 31, 2019, 2018, and 2017 | F- 15 |
| Consolidated Statements of Capital: Years ended December 31, 2019, 2018, and 2017 | F- 16 |
| Consolidated Statements of Cash Flows: Years ended December 31, 2019, 2018, and 2017 | F- 18 |
| Notes to Consolidated Financial Statements | F- 20 |
| (3) Financial Statement Schedule – Schedule III – Real Estate and Accumulated Depreciation as of December 31, 2019 | F- 56 |
| (4) See the Exhibit Index immediately preceding the signature page and certifications for a list of exhibits filed or incorporated by reference as part of this report. |
(B) Exhibits
The Company hereby files, as exhibits to this Form 10-K, those exhibits listed on the Exhibit Index referenced in Item 15(A)(4) above.
Item 16. Form 10-K Summary
None.
Report of Independent Registered Public Accounting Firm
To the Stockholders and Board of Directors
Essex Property Trust, Inc.:
Opinion on the Consolidated Financial Statements
We have audited the accompanying consolidated balance sheets of Essex Property Trust, Inc. and subsidiaries (the Company) as of December 31, 2019 and 2018, the related consolidated statements of income, comprehensive income, equity, and cash flows for each of the years in the three‑year period ended December 31, 2019, and the related notes and financial statement schedule III (collectively, the consolidated financial statements). In our opinion, the consolidated financial statements present fairly, in all material respects, the financial position of the Company as of December 31, 2019 and 2018, and the results of its operations and its cash flows for each of the years in the three‑year period ended December 31, 2019, in conformity with U.S. generally accepted accounting principles.
We also have audited, in accordance with the standards of the Public Company Accounting Oversight Board (United States) (PCAOB), the Company’s internal control over financial reporting as of December 31, 2019, based on criteria established in Internal Control - Integrated Framework (2013) issued by the Committee of Sponsoring Organizations of the Treadway Commission, and our report dated February 20, 2020 expressed an unqualified opinion on the effectiveness of the Company’s internal control over financial reporting.
Change in Accounting Principle
As discussed in Note 2 to the consolidated financial statements, the Company has changed its method of accounting for leases as of January 1, 2019 due to the adoption of Accounting Standards Update No. 2016-02, Leases (Topic 842) and Accounting Standards Update No. 2018-11, Leases (Topic 842): Targeted Improvements.
As discussed in Note 2 to the consolidated financial statements, the Company has changed its method of accounting for the derecognition of nonfinancial assets as of January 1, 2018 due to the adoption of the Accounting Standard Codification Topic 610-20, Gains and Losses from the Derecognition of Nonfinancial Assets.
Basis for Opinion
These consolidated financial statements are the responsibility of the Company’s management. Our responsibility is to express an opinion on these consolidated financial statements based on our audits. We are a public accounting firm registered with the PCAOB and are required to be independent with respect to the Company in accordance with the U.S. federal securities laws and the applicable rules and regulations of the Securities and Exchange Commission and the PCAOB.
We conducted our audits in accordance with the standards of the PCAOB. Those standards require that we plan and perform the audit to obtain reasonable assurance about whether the consolidated financial statements are free of material misstatement, whether due to error or fraud. Our audits included performing procedures to assess the risks of material misstatement of the consolidated financial statements, whether due to error or fraud, and performing procedures that respond to those risks. Such procedures included examining, on a test basis, evidence regarding the amounts and disclosures in the consolidated financial statements. Our audits also included evaluating the accounting principles used and significant estimates made by management, as well as evaluating the overall presentation of the consolidated financial statements. We believe that our audits provide a reasonable basis for our opinion.
Critical Audit Matters
The critical audit matters communicated below are matters arising from the current period audit of the consolidated financial statements that were communicated or required to be communicated to the audit committee and that: (1) relate to accounts or disclosures that are material to the consolidated financial statements and (2) involved our especially challenging, subjective, or complex judgments. The communication of critical audit matters does not alter in any way our opinion on the consolidated financial statements, taken as a whole, and we are not, by communicating the critical audit matters below, providing separate opinions on the critical audit matters or on the accounts or disclosures to which they relate.
Evaluation of events or changes in circumstances that indicate rental properties may be impaired
As discussed in Note 2 to the consolidated financial statements, the Company had $10.3 billion in rental properties as of December 31, 2019. The Company evaluates the carrying amount of rental properties for impairment whenever events or changes in circumstances indicate that the carrying amount of a rental property may not be fully recoverable.
F- 1
We identified the evaluation of events or changes in circumstances that indicate rental properties may be impaired as a critical audit matter. Specifically, a high degree of subjective and complex auditor judgment was required to evaluate the intent regarding the expected period the Company will receive cash flows from the rental property. Changes to shorten the expected period the Company will receive cash flows from the rental property could indicate a potential impairment.
The primary procedures we performed to address this critical audit matter included the following. We tested certain internal controls over the Company’s process to evaluate events or changes in circumstances that would indicate rental properties may be impaired including controls over the process for determining the expected period the Company will receive cash flows from the rental property. We evaluated the Company’s assessment by 1) inquiring with the Company about events or changes in circumstances considered by the Company, 2) considering the current economic environment, and 3) reading board of director’s minutes and external communications with investors and analysts. In addition, we visited and inspected certain rental property sites to observe the property conditions and inquired of property management personnel regarding events or changes in circumstances that indicate the rental properties may be impaired.
Evaluation of the value allocated to land and buildings in certain asset acquisitions
As discussed in Notes 2 and 3 to the consolidated financial statements, the Company acquired $373.3 million of real estate properties recorded as asset acquisitions for the year ended December 31, 2019. In asset acquisitions, the Company determines the value allocated to land and buildings using their relative estimated fair values.
We identified the evaluation of the value allocated to land and buildings in certain asset acquisitions as a critical audit matter. There was a high degree of subjective and complex auditor judgment in evaluating the fair value amounts used in the allocation of the purchase price to land and building. Specifically, the relevance and reliability of market information including comparable land sales identified and replacement costs used to determine the building value.
The primary procedures we performed to address this critical audit matter included the following. We tested certain internal controls over the Company’s land and building value estimation process in asset acquisitions including controls over the identification of publicly available and comparable land sales and key inputs used to estimate the replacement cost of the building. For certain asset acquisitions, with the assistance of valuation professionals with specialized skills and knowledge, we 1) compared the Company’s determination of the fair value of land to independently developed ranges of estimates based on publicly available land sales, and 2) compared the key inputs in the Company’s replacement building cost value to ranges of estimates of market da
Showing the first 8K of 306K characters. Open the full section