 filings.tools
Item 7. MANAGEMENT’S DISCUSSION AND ANALYSIS OF FINANCIAL CONDITION AND RESULTS OF OPERATIONS
56K characters. Original on sec.gov · Markdown
Item 7. MANAGEMENT’S DISCUSSION AND ANALYSIS OF FINANCIAL CONDITION AND RESULTS OF OPERATIONS
Overview
Expeditors International of Washington, Inc. is a global logistics company. Our services include air and ocean freight consolidation and forwarding, customs brokerage, warehousing and distribution, purchase order management, vendor consolidation, time-definite transportation services, temperature-controlled transit, cargo insurance, specialized cargo monitoring and tracking, and other logistics solutions. We do not compete for overnight courier or small parcel business. As a non-asset based carrier, we do not own or operate transportation assets.
We derive our revenues by entering into agreements that are generally comprised of a single performance obligation, which is that freight is shipped for and received by our customer. Each performance obligation is comprised of one or more of the Company's services. We typically satisfy our performance obligations as services are rendered over time. A typical shipment would include services rendered at origin, such as pick-up and delivery to port, freight services from origin to destination port and destination services, such as customs clearance and final delivery. Our three principal services are the revenue categories presented in our financial statements: 1) airfreight services, 2) ocean freight and ocean services, and 3) customs brokerage and other services. The most significant drivers of changes in gross revenues and related transportation expenses are volume, sell rates and buy rates. Volume has a similar effect on the change in both gross revenues and related transportation expenses in each of our three primary sources of revenue.
We generate the major portion of our air and ocean freight revenues by purchasing transportation services on a wholesale basis from direct (asset-based) carriers and then reselling those services to our customers on a retail basis. The difference between the rate billed to our customers (the sell rate) and the rate we pay to the carrier (the buy rate) is termed “net revenue” (a non-GAAP measure), “yield" or "margin." By consolidating shipments from multiple customers and concentrating our buying power, we are able to negotiate favorable buy rates from the direct carriers, while at the same time offering lower sell rates than customers would otherwise be able to negotiate themselves.
In most cases we act as an indirect carrier. When acting as an indirect carrier, we issue a House Airway Bill (HAWB), a House Ocean Bill of Lading (HOBL) or a House Seaway Bill to customers as the contract of carriage. In turn, when the freight is physically tendered to a direct carrier, we receive a contract of carriage known as a Master Airway Bill for airfreight shipments and a Master Ocean Bill of Lading for ocean shipments.
Customs brokerage and other services involve providing services at destination, such as helping customers clear shipments through customs by preparing and filing required documentation, calculating and providing for payment of duties and other taxes on behalf of customers as well as arranging for any required inspections by governmental agencies, and arranging for delivery. These are complicated functions requiring technical knowledge of customs rules and regulations in the multitude of countries in which we have offices.
In these transactions, we evaluate whether it is appropriate to record the gross or net amount as revenue. Generally, revenue is recorded on a gross basis when we are primarily responsible for fulfilling the promise to provide the services, when we assume risk of loss, when we have discretion in setting the prices for the services to the customers, and we have the ability to direct the use of the services provided by the third party. When revenue is recorded on a net basis, the amounts earned are determined using a fixed fee, a per unit of activity fee or a combination thereof. For revenues earned in other capacities, for instance, when we do not issue a HAWB, a HOBL, or a House Seaway Bill or otherwise act solely as an agent for the shipper, only the commissions and fees earned for such services are included in revenues. In these transactions, we are not a principal and report only commissions and fees earned in revenue.
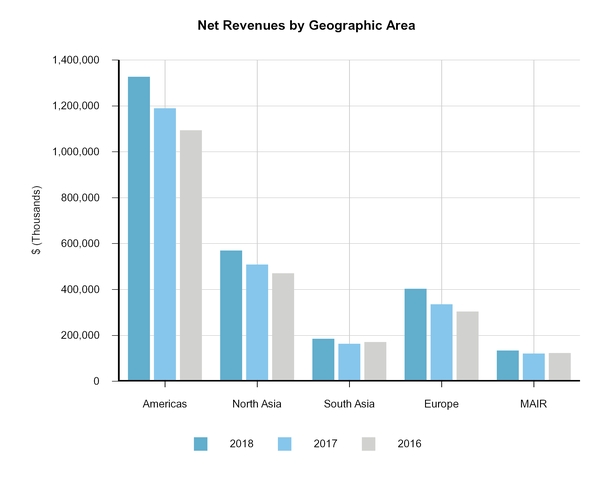
We manage our company along five geographic areas of responsibility: Americas; North Asia; South Asia; Europe; and Middle East, Africa and India (MAIR). Each area is divided into sub-regions that are composed of operating units with individual profit and loss responsibility. Our business involves shipments between operating units and typically touches more than one geographic area. The nature of the international logistics business necessitates a high degree of communication and cooperation among operating units. Because of this inter-relationship between operating units, it is very difficult to examine any one geographic area and draw meaningful conclusions as to its contribution to our overall success on a stand-alone basis. The following chart shows net revenues by geographic areas of responsibility for the years ended December 31, 2018, 2017 and 2016:
Our operating units share revenue using the same arms-length pricing methodologies that we use when our offices transact business with independent agents. Certain costs are allocated among the segments based on the relative value of the underlying services, which can include allocation based on actual costs incurred or estimated cost plus a profit margin. Our strategy closely links compensation with operating unit profitability, which includes shared revenues and allocated costs. Therefore, individual success is closely linked to cooperation with other operating units within our network.
The mix of services varies by segment based primarily on the import or export orientation of local operations in each of our regions. In accordance with our revenue recognition policy (see Note 1.E to the consolidated financial statements in this report), almost all freight revenues and related expenses are recorded at origin and shipment profits are split between origin and destination offices by recording a commission fee or profit share revenue at the destination.
North Asia is our largest export oriented region and accounted for 35% of revenues, 22% of net revenues and 35% of operating income for the year ended December 31, 2018. North Asia's net revenues as a percentage of revenues is lower than other segments due to the largely export nature of operations in that region.
Expeditors' Culture
From the inception of our company, management has believed that the elements required for a successful global services organization can only be assured through recruiting, training, and ultimately retaining superior personnel. We believe that our greatest challenge is now and always has been perpetuating a consistent global corporate culture, which demands:
| • | Total dedication to providing superior customer service; |
| • | Compliance with our policies and procedures and government regulations; |
| • | Aggressive marketing of all of our service offerings; |
| • | A positive, safe work environment that is inclusive and free from discrimination and harassment; |
| • | Ongoing development of key employees and management personnel; |
| • | Creation of unlimited advancement opportunities for employees dedicated to hard work, personal growth and continuous improvement; |
| • | Individual commitment to the identification and mentoring of successors for every key position so that when change occurs, a qualified and well-trained internal candidate is ready to step forward; and |
| • | Continuous identification, design and implementation of system solutions and differentiated service offerings, both technological and otherwise, to meet and exceed the needs of our customers while simultaneously delivering tools to make our employees more efficient and more effective. |
We reinforce these values with a compensation system that rewards employees for profitably managing the things they can control. This compensation system has been in place since we became a publicly traded company. There is no limit to how much a key manager can be compensated for success. We believe in a “real world” environment where the employees of our operating units are held accountable for the profit implications of their decisions. If these decisions result in operating losses, management generally must make up these losses with future operating profits, in the aggregate, before any cash incentive compensation can be earned. Executive management, in limited circumstances, makes exceptions at the branch operating unit level. At the same time, our policies, processes and relevant training focus on such things as cargo management, risk mitigation, compliance, accounts receivable collection, cash flow and credit soundness in an attempt to help managers avoid the kinds of errors that might end a career.
We believe that our unique culture is a critical component to our continued success. We strongly believe that it is nearly impossible to predict events that, individually or in the aggregate, could have a positive or a negative impact on our future operations. As a result, management's focus is on building and maintaining a global corporate culture and an environment where well-trained employees and managers are prepared to identify and react to changes as they develop and thereby help us adapt and thrive as major trends emerge.
Our business growth strategy emphasizes a focus on the right markets and, within each market, on the right customers that lead to profitable business growth. Expeditors' teams are aligned on the specific markets; on the targeted accounts within those markets; and on ways that we can continue to differentiate ourselves from our competitors.
Our ability to provide services to customers is highly dependent on good working relationships with a variety of entities including airlines, ocean carriers, ground transportation providers and governmental agencies. The significance of maintaining acceptable working relationships with these entities has gained increased importance as a result of ongoing concern over terrorism, security, changes in governmental regulation and oversight of international trade. A good reputation helps to develop practical working understandings that will assist in meeting security requirements while minimizing potential international trade obstacles, especially as governments promulgate new regulations and increase oversight and enforcement of new and existing laws. We consider our current working relationships with these entities to be satisfactory.
Our business is also highly dependent on the financial stability and operational capabilities of the carriers we utilize. Although airline profitability has improved, many air carriers remain highly leveraged with debt. Moreover, the ocean carrier industry has incurred substantial losses in recent years. Many carriers are highly leveraged with debt and certain carriers are facing significant liquidity challenges. This environment requires that we be selective in determining which carriers to utilize. Further changes in the financial stability, operating capabilities and capacity of asset-based carriers, capacity allotments available from carriers, governmental regulations, and/or trade accords could adversely affect our business in unpredictable ways.
International Trade and Competition
We operate in over 60 countries in the competitive global logistics industry and our activities are closely tied to the global economy. International trade is influenced by many factors, including economic and political conditions in the United States and abroad, currency exchange rates, and laws and policies relating to tariffs, trade restrictions, foreign investments and taxation. Periodically, governments consider a variety of changes to tariffs and trade restrictions and accords. Currently, the United States and China have significantly increased tariffs on certain imports and are engaged in trade negotiations. The United Kingdom and the European Union are negotiating the terms of the United Kingdom's exit from the European Union. We cannot predict the outcome of these proposals or negotiations, or the effects they will have on our business. As governments implement higher tariffs on imports, manufacturers may accelerate, to the extent possible, shipments to avoid higher tariffs and, over time, may shift manufacturing to other countries. Doing business in foreign locations also subjects us to a variety of risks and considerations not normally encountered by domestic enterprises. In addition to being influenced by governmental policies and inter-governmental disputes concerning international trade, our business may also be negatively affected by political developments and changes in government personnel or policies in the United States and other countries, as well as economic turbulence, political unrest and security concerns in the nations in which we conduct business and the future impact that these events may have on international trade and oil prices.
The global logistics services industry is intensely competitive and is expected to remain so for the foreseeable future. Our pricing and terms continue to be pressured by uncertainty in global trade and economic conditions, concerns over volatile fuel costs, disruptions in port services, political unrest and fluctuating currency exchange rates. We expect these operating and competitive conditions to continue.
Ocean carriers have incurred substantial operating losses in recent years, and many are highly leveraged with debt. These financial challenges have resulted in multiple carrier acquisitions and carrier alliance formations. Additionally, while overall global demand has recently increased, carriers continue to take delivery of new and larger ships, which creates additional capacity. Carriers also face new regulatory requirements that become effective in 2020 requiring reductions in the use of marine fuel sulfur, which is expected to increase their operating and capital costs. When the market experiences seasonal peaks or any sort of disruption, the carriers often increase their pricing suddenly. This carrier behavior creates pricing volatility that could impact Expeditors' ability to maintain historical unitary profitability.
Currently, there is uncertainty as to how changes in oil prices will continue to impact future buy rates. Because fuel is an integral part of carriers' costs and impacts both our cargo space buy rates and our sell rates to customers, we would expect our gross revenues and costs to be impacted as carriers adjust rates for the effect of changing fuel prices. To the extent that we are unable to pass through any increases to our customers, this could adversely affect our net revenues.
The global economic environment and trade growth remain uncertain. We cannot predict the impact of future changes in global trade on our operating results, freight volumes, pricing, changes in consumer demand, carrier stability and capacity, customers’ abilities to pay or on changes in competitors' behavior. Additionally, we cannot predict the direct or indirect impact that further changes in consumer purchasing behavior, such as online shopping, could have on our business.
Critical Accounting Estimates
A summary of our significant accounting policies can be found in Note 1 to the consolidated financial statements in this report.
Management believes that the nature of our business is such that there are few complex challenges in accounting for operations. While judgments and estimates are a necessary component of any system of accounting, the use of estimates is limited primarily to the following areas:
| • | accrual of loss contingencies; |
| • | accrual of various tax liabilities and contingencies; |
| • | accounts receivable valuation; and |
| • | accrual of insurance liabilities for the portion of the related exposure that we have self-insured. |
These estimates, other than the accrual of loss contingencies and tax liabilities and contingencies, are not highly uncertain and have not historically been subject to significant change. Management believes that the methods utilized in all of these areas are non-aggressive in approach and consistent in application. Management believes that there are limited, if any, alternative accounting principles or methods which could be applied to these transactions. While the use of estimates means that actual future results may be different from those contemplated by the estimates, management believes that alternative principles and methods used for making such estimates would not produce materially different results than those reported.
The outcome of loss contingencies, including legal proceedings and claims and government investigations, brought against us are subject to significant uncertainty. An estimated loss from a contingency, such as a legal proceeding, claim or government investigation, is accrued by a charge to income if it is probable that an asset has been impaired or a liability has been incurred and the amount of the loss can be reasonably estimated. Disclosure of a loss contingency is required if there is at least a reasonable possibility that a significant loss has been incurred. In determining whether a loss should be accrued, management evaluates several factors, including advice from outside legal counsel, in order to estimate the likelihood of an unfavorable outcome and to make a reasonable estimate of the amount of loss or range of reasonably possible loss. Changes in these factors could have a material impact on our financial position, results of operations and operating cash flows for any particular quarter or year.
We are subject to taxation in multiple U.S. and foreign tax jurisdictions. As discussed in Note 1.F to the consolidated financial statements, earnings of the Company's foreign subsidiaries are not considered to be indefinitely reinvested outside of the United States. Accordingly, prior to the implementation of the requirements of U.S. tax reform under the Tax Cuts and Jobs Act (2017 Tax Act) in December of 2017, U.S. Federal and State income taxes were provided for all undistributed earnings net of related foreign tax credits. See Note 5 to the consolidated financial statements for impacts associated with U.S. tax reform under the 2017 Tax Act. The 2017 Tax Act, which is also commonly referred to as “U.S. tax reform,” significantly changed U.S. corporate income tax laws by, among other things, reducing the U.S. corporate income tax rate to 21% starting in 2018 and creating a territorial tax system with a one-time mandatory tax on previously undistributed foreign earnings of non-U.S. subsidiaries.
Accounting for income taxes involves estimates and judgments. Management believes our tax positions, including intercompany transfer pricing policies, are reasonable and consistent. As a matter of course, Expeditors is audited by various taxing authorities, and sometimes these audits result in proposed assessments where the ultimate resolution could result in significant additional tax, penalties and interest payments being required. We establish liabilities when, despite our belief that the tax return positions are appropriate and consistent with tax law, we conclude that we may not be successful in realizing the tax position. In evaluating a tax position, we determine whether it is more likely than not that the position will be sustained upon examination, including resolution of any related appeals or litigation processes, based on the technical merits of the position and in consultation with qualified tax advisors. Our estimate of any ultimate tax liability contains assumptions based on past experiences, judgments about potential actions by taxing jurisdictions as well as judgments about the likely outcome of issues that have been raised by the
taxing jurisdiction. We believe the estimates and assumptions used to support the evaluation of our tax positions are reasonable. However, final determinations of tax liabilities, penalties and interest could be materially different from estimates.
Our effective tax rate will largely depend on the mix of pretax earnings that we generate in the U.S. as compared to the rest of the world and the impact of any discrete items for events occurring in the period or future changes in tax regulations and related interpretations.
Results of Operations
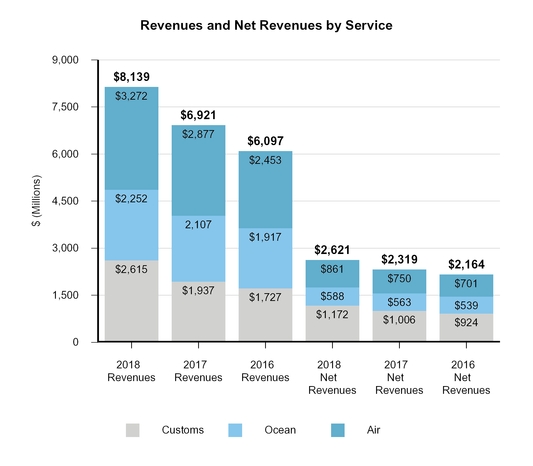
The following table shows the revenues and directly related expenses for our principal services and total net revenues (a non-GAAP measure calculated as revenues less directly related operating expenses attributable to our principal services) and our expenses for 2018, 2017, and 2016 expressed as percentages of net revenues. Management believes that net revenues are a better measure than total revenues when analyzing and discussing management's effectiveness in managing our principal services since total revenues earned by Expeditors as a freight consolidator include the carriers’ charges to us for carrying the shipment, whereas revenues earned by Expeditors in our other capacities include primarily the commissions and fees actually earned by us. Net revenue is one of our primary operational and financial measures and demonstrates our ability to manage sell rates to customers with our ability to concentrate and leverage our purchasing power through effective consolidation of shipments from multiple customers utilizing a variety of transportation carriers and optimal routings. Using net revenue also provides a commonality for comparison among various services.
The table, chart and the accompanying discussion and analysis should be read in conjunction with the consolidated financial statements and related notes thereto in this report.
| 2018 | 2017 | 2016 | ||||||||||||||||||||
| In thousands | Amount | Percent of net revenues | Amount | Percent of net revenues | Amount | Percent of net revenues | ||||||||||||||||
| Airfreight services: | ||||||||||||||||||||||
| Revenues | $ | 3,271,932 | $ | 2,877,032 | $ | 2,453,347 | ||||||||||||||||
| Expenses | 2,410,793 | 2,126,761 | 1,752,167 | |||||||||||||||||||
| Net revenues | 861,139 | 33 | % | 750,271 | 32 | % | 701,180 | 32 | % | |||||||||||||
| Ocean freight and ocean services: | ||||||||||||||||||||||
| Revenues | 2,251,754 | 2,107,045 | 1,917,494 | |||||||||||||||||||
| Expenses | 1,664,168 | 1,543,740 | 1,378,699 | |||||||||||||||||||
| Net revenues | 587,586 | 22 | 563,305 | 24 | 538,795 | 25 | ||||||||||||||||
| Customs brokerage and other services: | ||||||||||||||||||||||
| Revenues | 2,614,679 | 1,936,871 | 1,727,196 | |||||||||||||||||||
| Expenses | 1,443,031 | 931,258 | 803,135 | |||||||||||||||||||
| Net revenues | 1,171,648 | 45 | 1,005,613 | 44 | 924,061 | 43 | ||||||||||||||||
| Total net revenues | 2,620,373 | 100 | 2,319,189 | 100 | 2,164,036 | 100 | ||||||||||||||||
| Overhead expenses: | ||||||||||||||||||||||
| Salaries and related costs | 1,393,259 | 53 | 1,267,120 | 55 | 1,157,635 | 53 | ||||||||||||||||
| Other | 430,551 | 17 | 351,809 | 15 | 336,238 | 16 | ||||||||||||||||
| Total overhead expenses | 1,823,810 | 70 | 1,618,929 | 70 | 1,493,873 | 69 | ||||||||||||||||
| Operating income | 796,563 | 30 | 700,260 | 30 | 670,163 | 31 | ||||||||||||||||
| Other income, net | 21,766 | 1 | 18,335 | 1 | 16,693 | 1 | ||||||||||||||||
| Earnings before income taxes | 818,329 | 31 | 718,595 | 31 | 686,856 | 32 | ||||||||||||||||
| Income tax expense | 198,539 | 7 | 228,212 | 10 | 254,323 | 12 | ||||||||||||||||
| Net earnings | 619,790 | 24 | 490,383 | 21 | 432,533 | 20 | ||||||||||||||||
| Less net earnings attributable to the noncontrolling interest | 1,591 | — | 1,038 | — | 1,726 | — | ||||||||||||||||
| Net earnings attributable to shareholders | $ | 618,199 | 24 | % | $ | 489,345 | 21 | % | $ | 430,807 | 20 | % |
2018 compared with 2017
Airfreight services:
Airfreight services revenues increased 14% in 2018, as compared with 2017, primarily due to higher sell rates in response to increased buy rates resulting from higher overall market demand and tonnage growth of 3%. Airfreight services expenses increased 13% in 2018, as compared with 2017, principally as a result of the increase in tonnage and higher buy rates due to tighter carrier capacity and increased fuel prices.
Airfreight services net revenues in 2018 increased 15%, as compared with 2017. This was principally due to a 15% increase in net revenue per kilo and a 3% growth in tonnage. Average net revenue per kilo increased in most regions primarily due to higher average sell rates that increased commensurate with higher average buy rates. North America, Europe and South Asia net revenues increased by 13%, 17% and 13%, respectively, while tonnage increased 6%, 8% and 1%, respectively. North Asia net revenues increased by 17% despite a tonnage decrease of 2%, as we adjusted our sell rates, primarily in response to higher carrier buy rates, and achieved a better mix of business. In 2017, carriers significantly increased pricing in North Asia and South Asia as a result of higher demand relative to available capacity.
Overall the global airfreight market has been experiencing strong growth, which has caused imbalances between carrier capacity and demand in certain lanes and higher average buy rates. Customers are continuously focused on improving supply-chain efficiency, reducing overall logistics costs by negotiating lower rates, utilizing ocean freight whenever possible and evaluating alternative sourcing locations. At the same time, customers are increasingly utilizing airfreight to improve speed to market. We expect these trends to continue in conjunction with carriers' efforts to manage available capacity and the evolution of consumer purchasing behavior, such as online shopping. These conditions could be affected by new product launches and customer responses to governmental trade policies during periods that have historically experienced higher demand. These conditions, should they continue to occur, could create a higher degree of volatility in volumes and, ultimately, buy and sell rates.
Ocean freight and ocean services:
Ocean freight consolidation, direct ocean forwarding and order management are the three basic services that constitute and are collectively referred to as ocean freight and ocean services. Ocean freight and ocean services revenues and expenses increased 7% and 8%, respectively, in 2018, as compared with 2017, primarily due to a 5% increase in container volume and growth in direct ocean forwarding and order management.
Ocean freight and ocean services net revenues increased 4% in 2018, as compared with 2017. The largest component of our ocean freight net revenue is derived from ocean freight consolidation, which represented 43% and 45% of ocean freight net revenue in 2018 and 2017, respectively.
Ocean freight consolidation net revenues decreased 2% in 2018, as compared with 2017. This decrease was due primarily to lowering our sell rates in response to competitive market conditions, partially offset by a 5% increase in volume. Direct ocean freight forwarding net revenues increased 6% due to higher volumes in North Asia and Europe. Order management net revenues increased 11%, mostly resulting from higher volumes with new and existing customers primarily in North America and North Asia.
North America ocean freight and ocean services net revenues increased 4% in 2018, as compared with 2017, primarily due to higher order management volumes. Europe net revenues increased 8% in 2018 as compared with 2017, primarily due to growth in direct ocean freight forwarding. North Asia net revenues increased 3% in 2018, as compared with 2017, as growth in direct ocean forwarding and order management was largely offset by lower net revenue per container. MAIR net revenues increased 8% in 2018, as compared with 2017, primarily due to higher direct ocean forwarding revenues.
We expect that pricing volatility will continue as customers solicit bids, react to governmental trade policies, and carriers adapt to changes in capacity and market demand, merge or create alliances with other carriers. These conditions could result in lower margins.
Customs brokerage and other services:
Customs brokerage and other services revenues increased 35% in 2018, as compared with 2017, primarily as a result of higher volumes in customs brokerage, road freight and warehouse and distribution services. Customs brokerage and other services expenses increased 55% in 2018, as compared with 2017, principally as a result of higher volumes. In conjunction with the adoption of the new revenue recognition standard, we analyzed contracts with customers in our warehouse and distribution business. In 2018, we changed our presentation of certain warehouse and distribution revenues from a net to a gross basis, which increased both revenues and operating expenses by approximately $225 million in 2018.
Customs brokerage and other services net revenues increased 17% in 2018, as compared with 2017, primarily as a result of an increase in customs brokerage, road freight and distribution volumes, particularly in North America, Europe and North Asia. Customers continue to seek out customs brokers, such as Expeditors, with a commitment to compliance, high level of expertise and sophisticated systems capabilities critical to an overall logistics management program, including rapid responses to changes in the regulatory and security environment.
North America net revenues increased 14% in 2018, as compared with 2017, primarily as a result of higher volumes in customs brokerage, road freight and distribution services. Europe net revenues increased 28%, primarily due to higher customs brokerage, road freight and distributions services net revenues. North Asia net revenues increased 23%, primarily due to higher customs brokerage volumes.
Overhead expenses:
Salaries and related costs increased 10% in 2018, as compared with 2017, due principally to an increase in the number of employees, primarily in North America and Europe, higher base salaries and benefits and increased bonuses from higher operating income. The number of employees increased primarily to support increased activity in our business operations.
Historically, the relatively consistent relationship between salaries and net revenues has been the result of a compensation philosophy that has been maintained since the inception of our company: offer a modest base salary and the opportunity to share in a fixed and determinable percentage of the operating profit of the business unit controlled by each key employee. Using this compensation model, changes in individual incentive compensation occur in proportion to changes in our operating income, creating alignment between branch and corporate performance and shareholder interests. Bonuses to field and executive management in 2018 were up 12% while operating income increased 14%. Our management compensation programs have always been incentive-based and performance driven. Salaries and related costs as a percentage of net revenues decreased from 55% to 53% in 2018, as compared with 2017.
Because our management incentive compensation programs are also cumulative, generally no management bonuses can be paid unless the relevant business unit is, from inception, cumulatively profitable. Any operating losses must be offset in their entirety by operating profits before management is eligible for a bonus. Executive management, in limited circumstances, makes exceptions at the branch operating unit level. Since the most significant portion of management compensation comes from the incentive bonus programs, we believe that this cumulative feature is a disincentive to excessive risk taking by our managers. Due to the nature of our services, it has a short operating cycle. The outcome of any higher risk transactions, such as overriding established credit limits, would be known in a relatively short time frame. Management believes that when the potential and certain impact on the bonus is fully considered in light of this short operating cycle, the potential for short-term gains that could be generated by engaging in risky business practices is sufficiently mitigated to discourage excessive and inappropriate risk taking.
Management believes that both the stability and the long-term growth in revenues, net revenues and net earnings are a result of the incentives inherent in our compensation programs.
Other overhead expenses increased 22% in 2018, as compared with 2017. The increase in expenses was due to additional rent and technology-related fees, partially offset by lower claims. In 2017, we recovered certain legal and related costs totaling $8 million, had a favorable resolution of an indirect tax contingency of $6 million and recognized a $4 million gain on the sale of a property. We will continue to make important investments in people, processes and technology, as well as to invest in our strategic efforts to explore new areas for profitable growth. Other overhead expenses as a percentage of net revenues for 2018 increased from 15% to 17% as compared with 2017 principally as a result of the events in 2017 discussed above.
Income tax expense:
We pay income taxes in the United States and other jurisdictions. Our consolidated effective income tax rate was 24.3% in 2018, as compared with 31.8% in 2017. In addition to the lower US federal tax rate that resulted from the 2017 Tax Act, our effective tax rate in 2018 benefited from significant share-based compensation deductions, US Federal tax credits totaling $20.3 million, principally as a result of withholding taxes related to our foreign operations, and US income tax deductions for Foreign-derived intangible income (FDII) of $4.8 million. These amounts were partially offset by the effect of higher foreign tax rates of our international subsidiaries, when compared to the US Federal income tax rate of 21%, as well as certain expenses that are no longer deductible under the 2017 Tax Act, including certain executive compensation in excess of amounts allowed.
The tax benefit associated with non-qualified stock option and restricted stock unit grants is recorded when the related compensation expense is recorded (excess tax benefits are recorded upon the exercise of non-qualified stock options and vesting of RSUs and PSUs) while the tax benefit received for incentive stock options and employee stock purchase plans shares cannot be anticipated and are therefore recognized if and when a disqualifying disposition occurs. Our effective tax rate is subject to variation and the effective tax rate may be more or less volatile based on the amounts of pre-tax income or loss. For example, the impact of discrete items and non-deductible expenses on the effective rate is greater when pre-tax income is lower. Total consolidated foreign income tax expense is composed of the income tax expense of our non-US subsidiaries as well as income based withholding taxes paid by our non-US subsidiaries on behalf of its parent for intercompany payments, including the remittance of dividends.
2017 compared with 2016
Airfreight services:
Airfreight services revenues increased 17% in 2017, as compared with 2016. This increase is attributed to tonnage growth across all segments and higher average sell rates, principally on exports out of North Asia and Europe. We increased sell rates in response to higher buy rates caused by an overall increase in market demand. Airfreight services expenses increased 21% in 2017 as compared with 2016, as a result of the 10% increase in tonnage and higher average buy rates due to tighter carrier capacity.
Airfreight services net revenues in 2017 increased 7%, as compared with 2016. The increase was principally due to a 10% increase in tonnage, partially offset by a 6% decrease in net revenue per kilo. Average net revenue per kilo declined in most regions primarily due to competitive market conditions and tight carrier capacity. Carriers in North Asia and South Asia increased pricing significantly as a result of higher demand relative to available capacity. North America, North Asia and Europe net revenues increased 10%, 8% and 15%, respectively, due primarily to tonnage increases of 12%, 6% and 12%, respectively. South Asia net revenues decreased 12%, despite a 12% increase in tonnage, primarily due to lower average sell rates and higher average buy rates.
Ocean freight and ocean services:
Ocean freight and ocean services revenues increased 10% in 2017, as compared with 2016, primarily due to a 5% increase in container volume and higher average sell rates to customers. Ocean freight and ocean services expenses increased 12% in 2017 as compared with 2016, due to volume growth and higher average buy rates, resulting from overall market demand and carriers managing available capacity.
Ocean freight and ocean services net revenues increased 5% in 2017, as compared with 2016. The largest component of our ocean freight net revenue is derived from ocean freight consolidation, which represented 45% and 48% of ocean freight net revenue in 2017 and 2016, respectively.
Ocean freight consolidation net revenues decreased 1% in 2017, as compared with 2016. This decrease was due primarily to a 6% decrease in net revenue per container, largely offset by a 5% increase in volume. Direct ocean freight forwarding net revenues increased 6% due to higher volumes. Order management net revenues increased 13%, mostly resulting from higher volumes with new and existing customers, primarily in North Asia and South Asia.
North Asia ocean freight and ocean services net revenues increased 11% in 2017, as compared with 2016, due principally to 4% growth in volume and order management. North America and South Asia net revenues both increased 1%, as higher volumes were largely offset by lower margins. Europe net revenues decreased 1%, due to a decline in net revenue per container, mostly offset by volume growth.
Customs brokerage and other services:
Customs brokerage and other services revenues and expenses increased 12% and 16%, respectively, in 2017, as compared with 2016, primarily as a result of higher volumes.
Customs brokerage and other services net revenues increased 9% in 2017, as compared with 2016, primarily as a result of an increase in customs brokerage and road freight volumes, particularly in North America and Europe.
North America net revenues increased 11% in 2017, as compared with 2016, primarily as a result of higher volumes from existing and new customers in road freight and customs brokerage services. Europe net revenues increased 12% due primarily to growth in import, road freight, and warehouse and distribution services.
Overhead expenses:
Salaries and related costs increased 9% in 2017, as compared with 2016, principally due to an increase in the number of employees, primarily in North America, South Asia and Europe, higher salaries, and an increase in bonuses resulting from higher operating income.
Bonuses to field and executive management in 2017 were up 4.7%, as compared with 2016, primarily as a result of a 4.5% increase in operating income. Our management compensation programs have always been incentive-based and performance driven. Salaries and related costs increased to 55% of net revenues in 2017, as compared with 53% in 2016.
Other overhead expenses increased 5% in 2017, as compared with 2016. We continue to invest in additional technology and facilities, which resulted in higher rent and facilities expenses, technology-related fees and consulting costs. These increases were offset by a $4 million gain on the sale of a property, lower claims, the favorable resolution of an indirect tax contingency of $6 million and the recovery of certain legal and related costs totaling $8 million in 2017 compared to $5 million in 2016. We will continue to make important investments in people, processes and technology, as well as to invest in our strategic efforts to explore new areas for profitable growth. Other overhead expenses decreased to 15% of net revenues in 2017 from 16% in 2016.
Income tax expense:
Our consolidated effective income tax rate was 31.8% in 2017, as compared to 37.0% in 2016. The change in the effective tax rate was principally due to recording the estimated impact of U.S. tax reform and to a lesser degree a result of a higher proportion of our total outstanding stock-based compensation expense being for non-qualified stock option grants and restricted stock units.
Currency and Other Risk Factors
The nature of our worldwide operations necessitates dealing with a multitude of currencies other than the U.S. dollar. This results in our being exposed to the inherent risks of volatile international currency markets and governmental interference. Some of the countries where we maintain offices and/or agency relationships have strict currency control regulations, which influence our ability to hedge foreign currency exposure. We try to compensate for these exposures by accelerating international currency settlements among our offices and agents. We may enter into foreign currency hedging transactions where there are regulatory or commercial limitations on our ability to move money freely around the world or the short-term financial outlook in any country is such that hedging is the most time-sensitive way to mitigate short-term exchange losses. Any such hedging activity during 2018, 2017 and 2016 was insignificant. We had no foreign currency derivatives outstanding at December 31, 2018 and 2017. Net foreign currency losses were approximately $2 million and $13 million in 2018 and 2017, respectively, and net foreign currency gains were approximately $8 million in 2016.
International air and ocean freight forwarding and customs brokerage are intensely competitive and are expected to remain so for the foreseeable future. There are a large number of entities competing in the international logistics industry, including new technology-based competitors entering the industry, many of which have significantly more resources than us; however, our primary competition is confined to a relatively small number of companies within this group. Expeditors must compete against both the niche players and larger entities. The industry continues to experience consolidations into larger firms striving for stronger and more complete multinational and multi-service networks. However, regional and local brokers and forwarders remain a competitive force.
The primary competitive factors in the international logistics industry continue to be price and quality of service, including reliability, responsiveness, expertise, convenience, and scope of operations. We emphasize quality customer service and believe that our prices are competitive with those of others in the industry. Customers regularly solicit bids from competitors in order to improve service, pricing and contractual terms such as seeking longer payment terms, higher or unlimited liability limits and performance penalties. Increased competition and competitors' acceptance of expanded contractual terms could result in reduced revenues, reduced margins, higher operating costs, higher claims or loss of market share, any of which would damage our results of operations and financial condition.
Larger customers utilize more sophisticated and efficient procedures for the management of their logistics supply chains by embracing strategies such as just-in-time inventory management. We believe that this trend has resulted in customers using fewer service providers with greater technological capacity and more consistent global coverage. Accordingly, sophisticated computerized customer service capabilities and a stable worldwide network have become significant factors in attracting and retaining customers. Developing and maintaining these systems and a
worldwide network has added a considerable indirect cost to the services provided to customers. Smaller and middle-tier competitors, in general, do not have the resources available to develop customized systems and a worldwide network.
Liquidity and Capital Resources
Our principal source of liquidity is cash and cash equivalents and cash generated from operating activities. Net cash provided by operating activities for the year ended December 31, 2018 was $573 million, as compared with $489 million for 2017. This $84 million increase is primarily due to higher earnings, partially offset by changes in working capital. At December 31, 2018, working capital was $1,408 million, including cash and cash equivalents of $924 million. We had no long-term debt at December 31, 2018. Management believes that our current cash position and operating cash flows will be sufficient to meet our capital and liquidity requirements for at least the next 12 months and thereafter for the foreseeable future, including meeting any contingent liabilities related to standby letters of credit and other obligations.
As a customs broker, we make significant cash advances for a select group of our credit-worthy customers. These cash advances are for customer obligations such as the payment of duties and taxes to customs authorities in various countries throughout the world. Increases in duty rates could result in increases in the amounts we advance on behalf of our customers. Cash advances are a “pass through” and are not recorded as a component of revenue and expense. The billings of such advances to customers are accounted for as a direct increase in accounts receivable from the customer and a corresponding increase in accounts payable to governmental customs authorities. As a result of these “pass through” billings, the conventional Days Sales Outstanding or DSO calculation does not directly measure collection efficiency. For customers that meet certain criteria, we have agreed to extend payment terms beyond our customary terms. Management believes that it has established effective credit control procedures, and historically has experienced relatively insignificant collection problems.
Our business historically has been subject to seasonal fluctuations and this is expected to continue in the future. Cash flows fluctuate as a result of this seasonality. Historically, the first quarter shows an excess of customer collections over customer billings. This results in positive cash flow. The increased activity associated with periods of higher demand (typically commencing late second or early third quarter and continuing well into the fourth quarter) causes an excess of customer billings over customer collections. This cyclical growth in customer receivables consumes available cash.
Cash used in investing activities for the year ended December 31, 2018 was $48 million, as compared with $12 million for 2017. We had capital expenditures of $47 million in 2018 as compared with $95 million in 2017. Capital expenditures in 2018 related primarily to continuing investments in technology, building construction, building and leasehold improvements. Occasionally, we elect to purchase buildings to house staff and to facilitate the staging of customers’ freight. In 2017, we completed the sale of land and buildings in Miami, Florida, which resulted in net cash proceeds of approximately $84 million. Total anticipated capital expenditures in 2019 are currently estimated to be $50 million. This includes routine capital expenditures and investments in technology.
Cash used in financing activities for the year ended December 31, 2018 was $628 million as compared with $425 million in 2017. We used the proceeds from stock option exercises, employee stock purchases and available cash to repurchase our common stock on the open market to reduce issued and outstanding shares. During 2018 and 2017, we used cash to repurchase 9 million and 8 million shares of common stock, respectively, to reduce the number of total outstanding shares. During 2018 and 2017, we paid dividends of $0.90 and $0.84 per share, respectively.
We have a Non-Discretionary Stock Repurchase Plan to repurchase shares from the proceeds of stock option exercises. During 2018, we repurchased 2.6 million shares at an average price of $72.71 per share. We also have a Discretionary Stock Repurchase Plan under which management is allowed to repurchase shares to reduce the issued and outstanding stock to 160 million shares of common stock. During 2018, we repurchased 6.5 million shares at an average price of $71.18 per share. See Note 3 to the consolidated financial statements for cumulative repurchases under both repurchase plans.
We follow established guidelines relating to credit quality, diversification and maturities of our investments to preserve principal and maintain liquidity. Historically, our investment portfolio has not been adversely impacted by disruptions occurring in the credit markets. However, there can be no assurance that our investment portfolio will not be adversely affected in the future.
We cannot predict what impact ongoing uncertainties in the global economy and political uncertainty may have on our operating results, freight volumes, pricing, amounts advanced on behalf of our customers, changes in consumer demand, carrier stability and capacity, customers’ abilities to pay or on changes in competitors' behavior.
We maintain international unsecured bank lines of credit. At December 31, 2018, we were contingently liable for $68 million from standby letters of credit and guarantees. The standby letters of credit and guarantees relate to obligations of our foreign subsidiaries for credit extended in the ordinary course of business by direct carriers, primarily airlines, and for duty and tax deferrals available from governmental entities responsible for customs and value-added-tax (VAT) taxation. The total underlying amounts due and payable for transportation and governmental excises are properly recorded as obligations in the books of the respective foreign subsidiaries, and there would be no need to record additional expense in the unlikely event the parent company is required to perform.
| Amount of commitment expiration per period | ||||||||||||||||
| In thousands | Total amounts committed | Less than 1 year | 1 - 3 years | 3 - 5 years | After 5 years | |||||||||||
| Standby letters of credit and guarantees | $ | 67,579 | 61,811 | 2,621 | 18 | 3,129 |
At December 31, 2018, our contractual obligations are as follows:
| Payments due by period | ||||||||||||||||
| In thousands | Total | Less than 1 year | 1 - 3 years | 3 - 5 years | After 5 years | |||||||||||
| Contractual Obligations: | ||||||||||||||||
| Operating leases | $ | 317,825 | 75,227 | 110,526 | 64,932 | 67,140 | ||||||||||
| Unconditional purchase obligations | 49,912 | 49,912 | — | — | — | |||||||||||
| Construction, equipment and technology purchase obligations | 57,186 | 22,573 | 23,983 | 10,630 | — | |||||||||||
| Total contractual cash obligations | $ | 424,923 | 147,712 | 134,509 | 75,562 | 67,140 |
We typically enter into short-term unconditional purchase obligations with asset-based providers reserving space on a guaranteed basis. The pricing of these obligations varies to some degree with market conditions. We only enter into agreements that management believes we can fulfill. In the regular course of business, we also enter into agreements with service providers to maintain or operate equipment, facilities or software that can be longer than one year. We also regularly have contractual obligations for specific projects related to improvements of our owned or leased facilities and information technology infrastructure.
Our foreign subsidiaries regularly remit dividends to the U.S. parent company after evaluating their working capital requirements and funds necessary to finance local capital expenditures. In some cases, our ability to repatriate funds from foreign operations may be subject to foreign exchange controls. At December 31, 2018, cash and cash equivalent balances of $444 million were held by our non-United States subsidiaries, of which $2 million was held in banks in the United States. Earnings of our foreign subsidiaries are not considered to be indefinitely reinvested outside of the United States.
Impact of Inflation
To date, our business has not been adversely affected by inflation. Direct carrier rate increases could occur over the short to medium-term period. Due to the high degree of competition in the market place, these rate increases can lead to an erosion in our margins. As we are not required to purchase or maintain extensive property and equipment and have not otherwise incurred substantial interest rate-sensitive indebtedness, we currently have limited direct exposure to increased costs resulting from increases in interest rates.
Off-Balance Sheet Arrangements
As of December 31, 2018, we did not have any material off-balance-sheet arrangements, as defined in Item 303(a)(4)(ii) of SEC Regulation S-K.
Previous: Item 6. SELECTED FINANCIAL DATA · Next: Item 7A. QUANTITATIVE AND QUALITATIVE DISCLOSURES ABOUT MARKET RISK