 filings.tools
Item 5. MARKET FOR REGISTRANT’S COMMON EQUITY, RELATED STOCKHOLDER MATTERS AND ISSUER PURCHASES OF EQUITY SECURITIES
4K characters. Original on sec.gov · Markdown
Item 5. MARKET FOR REGISTRANT’S COMMON EQUITY, RELATED STOCKHOLDER MATTERS AND ISSUER PURCHASES OF EQUITY SECURITIES
Expeditors' common stock trades on The NASDAQ Global Select Market under the symbol EXPD.
There were 678 shareholders of record as of February 18, 2020. This figure does not include a substantially greater number of beneficial holders of our common stock, whose shares are held of record by banks, brokers and other financial institutions.
The Board of Directors declared semi-annual dividends per share during the two most recent fiscal years paid as follows:
| June 17, 2019 | $ | 0.50 | ||
|---|---|---|---|---|
| December 16, 2019 | $ | 0.50 | ||
| June 15, 2018 | $ | 0.45 | ||
| December 17, 2018 | $ | 0.45 |
ISSUER PURCHASES OF EQUITY SECURITIES
| Period | Total number of shares purchased | Average price paid per share | Total number of shares purchased as part of publicly announced plans | Maximum number of shares that may yet be purchased under the plans | ||||||||||||
|---|---|---|---|---|---|---|---|---|---|---|---|---|---|---|---|---|
| October 1-31, 2019 | — | $ | — | — | 10,294,290 | |||||||||||
| November 1-30, 2019 | — | $ | — | — | 10,736,102 | |||||||||||
| December 1-31, 2019 | 1,246,888 | $ | 73.89 | 1,246,888 | 9,622,194 | |||||||||||
| Total | 1,246,888 | $ | 73.89 | 1,246,888 | 9,622,194 |
In November 2001, under a Discretionary Stock Repurchase Plan, Expeditors' Board of Directors authorized the repurchase of our common stock in the open market to reduce the issued and outstanding stock down to 200 million shares. In February 2014, the Board of Directors authorized repurchases down to 190 million shares of common stock outstanding. In February and August 2015, May 2016 and November 2018 the Board of Directors further authorized repurchases down to 188 million, 180 million, 170 million and 160 million, respectively. The maximum number of shares available for repurchase under this plan will increase as the total number of outstanding shares increases. This authorization has no expiration date.
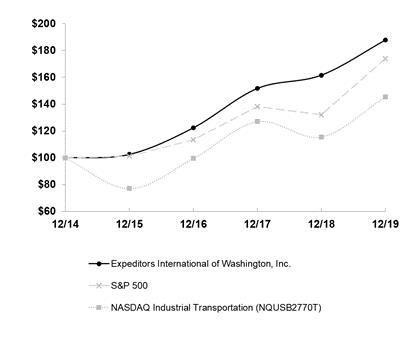
The graph below compares Expeditors International of Washington, Inc.'s cumulative 5-Year total shareholder return on common stock with the cumulative total returns of the S&P 500 index and the NASDAQ Industrial Transportation index (NQUSB2770T). The graph assumes that the value of the investment in our common stock and in each of the indexes (including reinvestment of dividends) was $100 on 12/31/2014 and tracks it through 12/31/2019. Total return assumes reinvestment of dividends in each of the indices indicated.
COMPARISON OF 5-YEAR CUMULATIVE TOTAL RETURN
Among Expeditors International of Washington, Inc., the S&P 500 Index
and the NASDAQ Industrial Transportation Index.
| 12/14 | 12/15 | 12/16 | 12/17 | 12/18 | 12/19 | |||||||||||||||||||
|---|---|---|---|---|---|---|---|---|---|---|---|---|---|---|---|---|---|---|---|---|---|---|---|---|
| Expeditors International of Washington, Inc. | $ | 100.00 | $ | 102.62 | $ | 122.44 | $ | 151.71 | $ | 161.60 | $ | 187.74 | ||||||||||||
| Standard and Poor's 500 Index | 100.00 | 101.38 | 113.51 | 138.29 | 132.23 | 173.86 | ||||||||||||||||||
| NASDAQ Industrial Transportation (NQUSB2770T) | 100.00 | 77.05 | 99.57 | 127.01 | 115.52 | 145.48 |
The stock price performance included in this graph is not necessarily indicative of future stock price performance.
Previous: Item 4. MINE SAFETY DISCLOSURES · Next: Item 6. SELECTED FINANCIAL DATA