 filings.tools
Item 5. Market for Registrant’s Common Equity, Related Stockholder Matters and Issuer Purchases of Equity Securities
5K characters. Original on sec.gov · Markdown
Item 5. Market for Registrant’s Common Equity, Related Stockholder Matters and Issuer Purchases of Equity Securities
Market Information
Our common stock is quoted on the Nasdaq Global Select Market under the ticker symbol “EXPE.” Our Class B common stock is not listed and there is no established public trading market. As of January 31, 2020, there were approximately 2,729 holders of record of our common stock and the closing price of our common stock was $108.45 on Nasdaq. As of January 31, 2020, all of our Class B common stock was held by Mr. Diller, Chairman and Senior Executive of Expedia Group.
Dividend Policy
In 2019 and 2018, the Executive Committee, acting on behalf of the Board of Directors, declared the following dividends:
| Declaration Date | Dividend Per Share | Record Date | Total Amount (in millions) | Payment Date | |||||||||
| Year ended December 31, 2019: | |||||||||||||
| February 6, 2019 | $ | 0.32 | March 7, 2019 | $ | 47 | March 27, 2019 | |||||||
| May 1, 2019 | 0.32 | May 23, 2019 | 48 | June 13, 2019 | |||||||||
| July 24, 2019 | 0.34 | August 22, 2019 | 50 | September 12, 2019 | |||||||||
| November 6, 2019 | 0.34 | November 19, 2019 | 50 | December 12, 2019 | |||||||||
| Year ended December 31, 2018: | |||||||||||||
| February 7, 2018 | $ | 0.30 | March 8, 2018 | $ | 46 | March 28, 2018 | |||||||
| April 24, 2018 | 0.30 | May 24, 2018 | 45 | June 14, 2018 | |||||||||
| July 23, 2018 | 0.32 | August 23, 2018 | 47 | September 13, 2018 | |||||||||
| October 19, 2018 | 0.32 | November 15, 2018 | 48 | December 6, 2018 |
In February 2020, the Executive Committee, acting on behalf of the Board of Directors, declared a quarterly cash dividend of $0.34 per share of outstanding common stock payable on March 26, 2020 to the stockholders of record as of the close of business on March 10, 2020.
Declaration and payment of future dividends, if any, is at the discretion of the Board of Directors and will depend on, among other things, our results of operations, cash requirements and surplus, financial condition, share dilution management, legal risks, tax policies, capital requirements relating to research and development, investments and acquisitions, challenges to our business model and other factors that the Board of Directors may deem relevant. In addition, our credit agreement limits our ability to pay cash dividends under certain circumstances.
Unregistered Sales of Equity Securities
During the quarter ended December 31, 2019, we did not issue or sell any shares of our common stock or other equity securities pursuant to unregistered transactions in reliance upon an exemption from the registration requirements of the Securities Act of 1933, as amended.
Issuer Purchases of Equity Securities
A summary of the repurchase activity for the fourth quarter of 2019 is as follows:
| Period | Total Number of Shares Purchased | Average Price Paid Per Share | Total Number of Shares Purchased as Part of Publicly Announced Plans or Programs | Maximum Number of Shares that May Yet Be Purchased Under Plans or Programs | |||||||||
| (In thousands, except per share data) | |||||||||||||
| October 1-31, 2019 | 873 | $ | 135.58 | 873 | 9,048 | ||||||||
| November 1-30, 2019 | — | — | — | 9,048 | |||||||||
| December 1-31, 2019 | 2,388 | 110.72 | 2,388 | 26,660 | |||||||||
| Total | 3,261 | 3,261 |
In 2018, the Executive Committee, acting on behalf of the Board of Directors, authorized a repurchase of up to 15 million outstanding shares of our common stock. In December 2019, the Board of Directors authorized an additional repurchase of up to 20 million outstanding shares of our common stock. As of December 31, 2019, 26.7 million shares remain authorized for repurchase under the authorizations. There is no fixed termination date for the repurchases.
Performance Comparison Graph
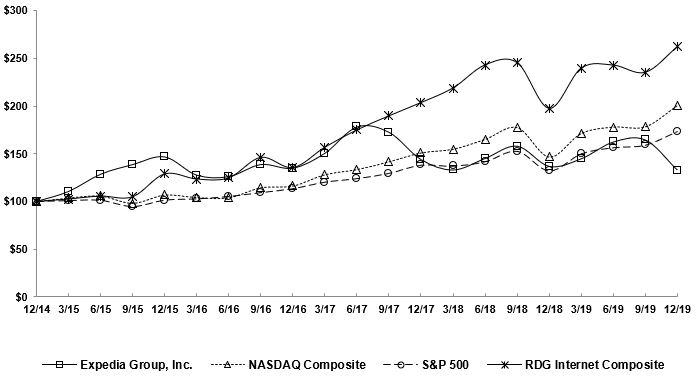
The graph shows a five-year comparison of cumulative total return, calculated on a dividend reinvested basis, for Expedia Group common stock, the NASDAQ Composite Index, the RDG (Research Data Group) Internet Composite Index and the
S&P 500. The graph assumes an investment of $100 in each of the above on December 31, 2014. The stock price performance shown in the graph is not necessarily indicative of future price performance.
Previous: Item 4. Mine Safety Disclosures · Next: Item 6. Selected Financial Data