 filings.tools
Item 7. Management’s Discussion and Analysis of Financial Condition and Results of Operations
54K characters. Original on sec.gov · Markdown
Item 7. Management’s Discussion and Analysis of Financial Condition and Results of Operations
The following discussion should be read in conjunction with the financial statements and notes thereto appearing elsewhere in this report. We make statements in this section that are forward-looking statements within the meaning of the federal securities laws. For a complete discussion of forward-looking statements, see the section in this Form 10-K entitled “Statements Regarding Forward-Looking Information.” Certain risk factors may cause actual results, performance or achievements to differ materially from those expressed or implied by the following discussion. For a discussion of such risk factors, see the section in this Form 10-K entitled “Risk Factors.” Dollar amounts in thousands, except share and per share data.
OVERVIEW
We are a fully integrated, self-administered and self-managed real estate investment trust (“REIT”), formed to own, operate, manage, acquire, develop and redevelop self-storage properties (“stores”). We derive substantially all of our revenues from our two segments: storage operations and tenant reinsurance. Primary sources of revenue for our storage operations segment include rents received from tenants under leases at each of our wholly-owned stores. Our operating results depend materially on our ability to lease available self-storage units, to actively manage unit rental rates, and on the ability of our tenants to make required rental payments. Consequently, management spends a significant portion of their time maximizing
cash flows from our diverse portfolio of stores. Revenue from our tenant reinsurance segment consists of insurance revenues from the reinsurance of risks relating to the loss of goods stored by tenants in our stores.
Our stores are generally situated in highly visible locations clustered around large population centers. These areas enjoy above average population growth and income levels. The clustering of our assets around these population centers enables us to reduce our operating costs through economies of scale. To maximize the performance of our stores, we employ industry-leading revenue management systems. Developed by our management team, these systems enable us to analyze, set and adjust rental rates in real time across our portfolio in order to respond to changing market conditions. We believe our systems and processes allow us to more pro-actively manage revenues.
We operate in competitive markets, often where consumers have multiple stores from which to choose. Competition has impacted, and will continue to impact, our store results. We experience seasonal fluctuations in occupancy levels, with occupancy levels generally higher in the summer months due to increased moving activity. We believe that we are able to respond quickly and effectively to changes in local, regional and national economic conditions by adjusting rental rates through the combination of our revenue management team and our industry-leading technology systems. We consider a store to be in the lease-up stage after it has been issued a certificate of occupancy, but before it has achieved stabilization. We consider a store to be stabilized once it has achieved either an 80% occupancy rate for a full year measured as of January 1 of the current year, or has been open for three years prior to January 1 of the current year.
CRITICAL ACCOUNTING POLICIES AND ESTIMATES
Our financial statements have been prepared in accordance with U.S. generally accepted accounting principles. The preparation of these financial statements requires us to make estimates and assumptions that affect the reported amount of assets and liabilities at the date of the financial statements and the reported amount of revenues and expenses during the reporting period. On an ongoing basis, we evaluate our estimates and assumptions, including those that impact our most critical accounting policies. We base our estimates and assumptions on historical experience and on various other factors that we believe are reasonable under the circumstances. A summary of significant accounting policies is also provided in the notes to our consolidated financial statements (see Note 2 to our consolidated financial statements). Actual results may differ from these estimates. We believe the following are our most critical accounting policies and estimates:
CONSOLIDATION: Arrangements that are not controlled through voting or similar rights are accounted for as variable interest entities (“VIEs”). An enterprise is required to consolidate a VIE if it is the primary beneficiary of the VIE.
We have concluded that under certain circumstances when we enter into arrangements for the formation of joint ventures, a VIE may be created. For each VIE created, we have performed a qualitative analysis, including considering which party, if any, has the power to direct the activities most significant to the economic performance of each VIE and whether that party has the obligation to absorb losses of the VIE or the right to receive benefits from the VIE that could be significant to the VIE. If we are determined to be the primary beneficiary of the VIE, the assets, liabilities and operations of the VIE are consolidated with our financial statements. Otherwise, our investment is generally accounted for under the equity method. Our ability to correctly assess the influence or control over an entity affects the presentation of the investment in our consolidated financial statements.
As of December 31, 2018, we had no consolidated VIEs. Additionally, our Operating Partnership has notes payable to one trust that is considered a VIE. Since the Operating Partnership is not the primary beneficiary of the trust, this VIE is not consolidated.
REAL ESTATE ASSETS: We account for the acquisition of stores, including by merger and other acquisitions of real estate, in accordance with ASC 805-10, "Business Combinations." We use our judgment to determine if assets acquired meet the definition of a business or if the acquisition should be considered an asset acquisition subsequent to our January 1, 2017 adoption of ASU 2017-01, "Business Combinations (Topic 805) - Clarifying the Definition of a Business." We must make significant assumptions and estimates in determining the fair value of the tangible and intangible assets and liabilities acquired and consideration transferred. These assumptions and estimates require judgment, and therefore others could come to materially different conclusions as to the estimated fair values, which could result in differences in depreciation and amortization expense, gains and losses on the sale of real estate assets, and real estate and intangible asset values.
EVALUATION OF ASSET IMPAIRMENT: Long lived assets held for use are evaluated for impairment when events or circumstances indicate that there may be impairment. We review each store at least annually to determine if any such events or circumstances have occurred or exist. We focus on stores where occupancy and/or rental income have decreased by a significant amount. For these stores, we determine whether the decrease is temporary or permanent and whether the store will
likely recover the lost occupancy and/or revenue in the short term. In addition, we review stores in the lease-up stage and compare actual operating results to original projections. We may not have identified all material facts and circumstances that affect impairment of our stores. No material impairments were recorded in the year ended December 31, 2018.
DERIVATIVE INSTRUMENTS AND HEDGING ACTIVITIES: We hold a number of derivative instruments which we use to hedge our exposure to variability in expected future cash flows, mainly related to our interest rates on variable interest debt. We do not use derivatives for trading or speculative purposes. We assess our derivatives both at inception, and on an ongoing quarterly basis, for whether the derivatives used in hedging transactions are effective. The rules and interpretations relating to the accounting for derivatives are complex. Failure to apply this guidance correctly may require us to recognize all changes in fair value of the hedged derivative in earnings, which may materially impact our results.
INCOME TAXES: We have elected to be treated as a REIT under Sections 856 through 860 of the Internal Revenue Code. In order to maintain our qualification as a REIT, among other things, we are required to distribute at least 90% of our REIT taxable income to our stockholders and meet certain tests regarding the nature of our income and assets. As a REIT, we are not subject to federal income tax with respect to that portion of our income which meets certain criteria and is distributed annually to our stockholders. We plan to continue to operate so that we meet the requirements for taxation as a REIT. Many of these requirements, however, are highly technical and complex. For any taxable year that we fail to qualify as a REIT and for which applicable statutory relief provisions did not apply, we would be subject to federal corporate income tax on all of our taxable income for at least that year and the ensuing four years. We could also be subject to penalties and interest, and our net income may be materially different from the amounts reported in our financial statements.
We have elected to treat one of our corporate subsidiaries, Extra Space Management, Inc., as a taxable REIT subsidiary (“TRS”). In general, our TRS may perform additional services for tenants and generally may engage in any real estate or non-real estate related business. A TRS is subject to federal corporate income tax. Interest and penalties relating to uncertain tax positions will be recognized in income tax expense when incurred. If tax authorities determine that amounts paid by our TRS to us are not reasonable compared to similar arrangements among unrelated parties, we could be subject to a penalty tax on the excess payments.
RECENT ACCOUNTING PRONOUNCEMENTS: For a discussion of recent accounting pronouncements affecting our business, see Item 8, “Financial Statements and Supplementary Data–Recently Issued Accounting Standards.”
RESULTS OF OPERATIONS
Comparison of the Year Ended December 31, 2018 to the Year Ended December 31, 2017
Overview


Results for the year ended December 31, 2018 included the operations of 1,111 stores (878 wholly-owned, four in consolidated joint ventures, and 229 in joint ventures accounted for using the equity method) compared to the results for the year ended December 31, 2017, which included the operations of 1,061 stores (846 wholly-owned, one in a consolidated joint venture, and 214 in joint ventures accounted for using the equity method). Material or unusual changes in the results of our operations are discussed below.
Revenues
The following table presents information on revenues earned for the years indicated:
| For the Year Ended December 31, | ||||||||||||||
| 2018 | 2017 | $ Change | % Change | |||||||||||
| Revenues: | ||||||||||||||
| Property rental | $ | 1,039,340 | $ | 967,229 | $ | 72,111 | 7.5 | % | ||||||
| Tenant reinsurance | 115,507 | 98,401 | 17,106 | 17.4 | % | |||||||||
| Management fees and other income | 41,757 | 39,379 | 2,378 | 6.0 | % | |||||||||
| Total revenues | $ | 1,196,604 | $ | 1,105,009 | $ | 91,595 | 8.3 | % |
Property Rental—The increase in property rental revenues for the year ended December 31, 2018 was primarily the result of an increase of $57,827 associated with acquisitions completed in 2018 and 2017. We acquired 34 stores and opened three new development stores during the year ended December 31, 2018, and acquired 46 stores during the year ended December 31, 2017. Property rental revenue also increased by $36,797 during the year ended December 31, 2018 as a result of increases in rental rates to new and existing customers at our stabilized stores. These increases were partially offset by a decrease of $26,313 from the sale of 36 stores during the year ended December 31, 2017 to a new joint venture with an existing partner. We have a 10% ownership interest in the new joint venture. We sold one additional store during the year ended December 31, 2018.
Tenant Reinsurance—The increase in tenant reinsurance revenues was due primarily to an increase in stores operated, as well as an increase in the average tenant insured value per policy. We operated 1,647 stores at December 31, 2018, compared to 1,483 stores at December 31, 2017.
Management Fees and Other Income—Management fees represent the fee collected for our management of stores owned by third parties and unconsolidated joint ventures.
Expenses
The following table presents information on expenses for the years indicated:
| For the Year Ended December 31, | ||||||||||||||
| 2018 | 2017 | $ Change | % Change | |||||||||||
| Expenses: | ||||||||||||||
| Property operations | $ | 291,695 | $ | 271,974 | $ | 19,721 | 7.3 | % | ||||||
| Tenant reinsurance | 25,707 | 19,173 | 6,534 | 34.1 | % | |||||||||
| General and administrative | 81,256 | 78,961 | 2,295 | 2.9 | % | |||||||||
| Depreciation and amortization | 209,050 | 193,296 | 15,754 | 8.2 | % | |||||||||
| Total expenses | $ | 607,708 | $ | 563,404 | $ | 44,304 | 7.9 | % |
Property Operations—The increase in property operations expense consists primarily of an increase of $19,541 related to acquisitions completed in 2018 and 2017. We acquired 34 stores and opened three new development stores during the year ended December 31, 2018 and acquired 46 stores during the year ended December 31, 2017. There was also an increase of $7,495 related to increases in expenses at stabilized stores. These increases were partially offset by a decrease of $8,282 due to property sales.
Tenant Reinsurance—Tenant reinsurance expense represents the costs that are incurred to provide tenant reinsurance. The change was due primarily to the increase in the number of stores we owned and/or managed and an increase in the overall average payout on claims.
General and Administrative—General and administrative expenses primarily include all expenses not directly related to our stores, including corporate payroll, travel and professional fees. These expenses are recognized as incurred. We did not observe any material trends in specific payroll, travel or other expenses that contributed significantly to the increase in general and administrative expenses apart from the increase due to the management of additional stores.
Depreciation and Amortization—Depreciation and amortization expense increased as a result of the acquisition of new stores. We acquired 34 stores and opened three new development stores during the year ended December 31, 2018, and acquired 46 operating stores during the year ended December 31, 2017.
Other Income and Expenses
The following table presents information on other revenues and expenses for the years indicated:
| For the Year Ended December 31, | ||||||||||||||
| 2018 | 2017 | $ Change | % Change | |||||||||||
| Other income and expenses: | ||||||||||||||
| Gain on real estate transactions, earnout on prior acquisitions and impairment of real estate | $ | 30,807 | $ | 112,789 | $ | (81,982 | ) | (72.7 | )% | |||||
| Interest expense | (178,436 | ) | (153,511 | ) | (24,925 | ) | 16.2 | % | ||||||
| Non-cash interest expense related to amortization of discount on equity component of exchangeable senior notes | (4,687 | ) | (5,103 | ) | 416 | (8.2 | )% | |||||||
| Interest income | 5,292 | 6,736 | (1,444 | ) | (21.4 | )% | ||||||||
| Equity in earnings of unconsolidated real estate ventures | 14,452 | 15,331 | (879 | ) | (5.7 | )% | ||||||||
| Income tax expense | (9,244 | ) | (3,625 | ) | (5,619 | ) | 155.0 | % | ||||||
| Total other expense, net | $ | (141,816 | ) | $ | (27,383 | ) | $ | (114,433 | ) | 417.9 | % | |||
Gain on Real Estate Transactions, Earnout on Prior Acquisitions and Impairment of Real Estate— During the year ended December 31, 2018, we sold one store in California and recognized a gain of $30,671 on this transaction. During the year ended December 31, 2017, we sold 36 stores to a new joint venture with an existing partner. We own a 10% ownership interest in the new joint venture. We recognized a total gain of $118,776 related to this transaction. During the year ended December 31, 2017, we also recognized an impairment loss of $6,100 related to three parcels of undeveloped land where the carrying values were greater than the fair values.
Interest Expense—The increase in interest expense during the year ended December 31, 2018 was primarily the result of higher debt balances when compared to the prior year, as well as an increase in the average 30-day LIBOR rate. The total face value of our debt, including our lines of credit, was $4,854,077 at December 31, 2018 compared to $4,601,322 at December 31, 2017. Our average interest rate for fixed and variable rate debt as of December 31, 2018 was 3.5% compared to 3.3% at December 31, 2017.
Non-cash Interest Expense Related to Amortization of Discount on Equity Component of Exchangeable Senior Notes—Represents the amortization of the discounts related to the equity components of the exchangeable senior notes issued by our Operating Partnership. The decrease is related to the repayment in July 2018 of our outstanding exchangeable senior notes due 2013.
Interest Income—Interest income represents amounts earned on cash and cash equivalents deposited with financial institutions and interest earned on notes receivable and income earned on notes receivable from preferred and common Operating Partnership unit holders.
Equity in Earnings of Unconsolidated Real Estate Ventures—Equity in earnings of unconsolidated real estate ventures represents the income earned through our ownership interests in unconsolidated joint ventures. In these joint ventures, we and our joint venture partners generally receive a preferred return on our invested capital. To the extent that cash or profits in excess of these preferred returns are generated, we receive a higher percentage of the excess cash or profits, as applicable.
Income Tax Expense— The increase in income tax expense relates primarily to the remeasurement of our deferred tax liability balance and valuation allowance during the year ended December 31, 2017 as a result of the 2017 Tax Legislation. The tax benefit recorded from this remeasurement was $8,606 for the year ended December 31, 2017. No similar remeasurement was recorded during the year ended December 31, 2018. Tax expense was recognized at 21% for the year ended December 31, 2018 as opposed to 35% in the prior year. We also generated tax credits from our solar program in the amount of $5,629 in 2018.
Comparison of the Year Ended December 31, 2017 to the Year Ended December 31, 2016
Overview
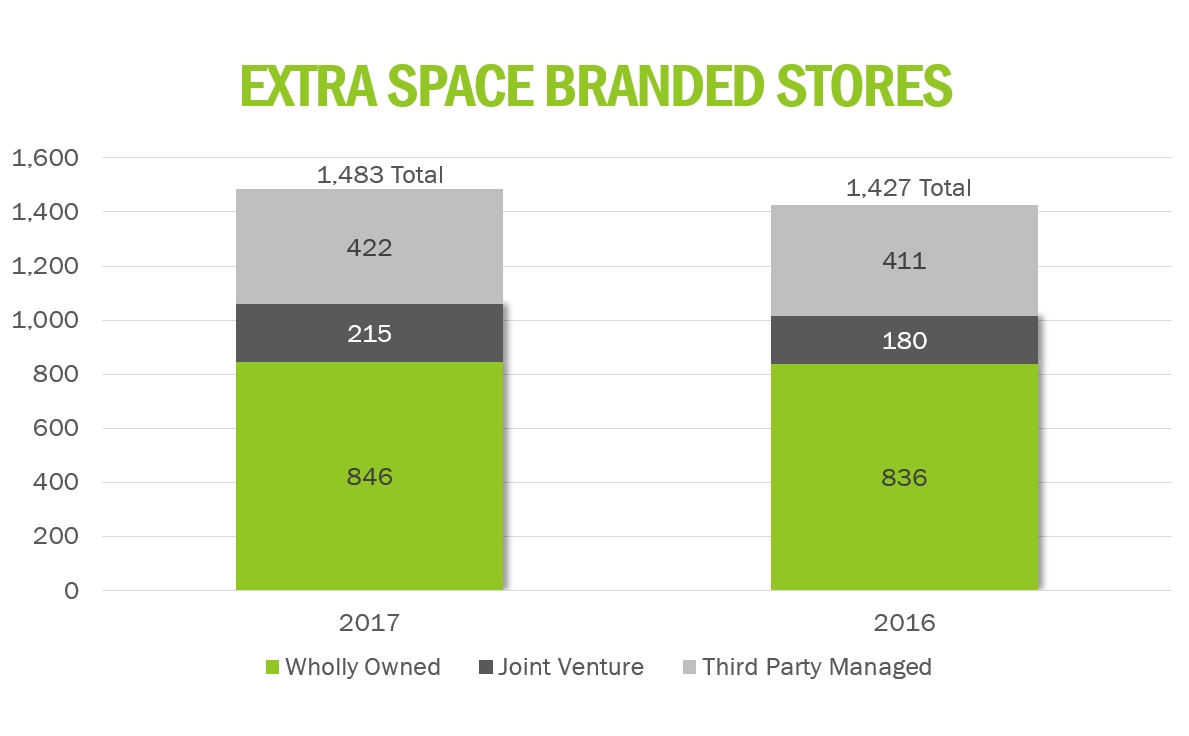

Results for the year ended December 31, 2017 included the operations of 1,061 stores (846 wholly-owned, one in a consolidated joint venture, and 214 in joint ventures accounted for using the equity method) compared to the results for the year ended December 31, 2016, which included the operations of 1,016 stores (836 wholly-owned, one in a consolidated joint venture, and 179 in joint ventures accounted for using the equity method). Material or unusual changes in the results of our operations are discussed below.
Revenues
The following table presents information on revenues earned for the years indicated:
| For the Year Ended December 31, | ||||||||||||||
| 2017 | 2016 | $ Change | % Change | |||||||||||
| Revenues: | ||||||||||||||
| Property rental | $ | 967,229 | $ | 864,742 | $ | 102,487 | 11.9 | % | ||||||
| Tenant reinsurance | 98,401 | 87,291 | 11,110 | 12.7 | % | |||||||||
| Management fees and other income | 39,379 | 39,842 | (463 | ) | (1.2 | )% | ||||||||
| Total revenues | $ | 1,105,009 | $ | 991,875 | $ | 113,134 | 11.4 | % |
Property Rental—The increase in property rental revenues for the year ended December 31, 2017 was primarily the result of an increase of $59,694 associated with acquisitions completed in 2017 and 2016. We acquired 46 stores during the year ended December 31, 2017 and 99 stores during the year ended December 31, 2016. Property rental revenue also increased by $40,439 during the year ended December 31, 2017 as a result of increases in rental rates to new and existing customers at our stabilized stores.
Tenant Reinsurance—The increase in tenant reinsurance revenues was due primarily to the increase in stores operated. We operated 1,483 stores at December 31, 2017, compared to 1,427 stores at December 31, 2016.
Management Fees and Other Income—Management fees represent the fee collected for our management of stores owned by third parties and unconsolidated joint ventures.
Expenses
The following table presents information on expenses for the years indicated:
| For the Year Ended December 31, | ||||||||||||||
| 2017 | 2016 | $ Change | % Change | |||||||||||
| Expenses: | ||||||||||||||
| Property operations | $ | 271,974 | $ | 250,005 | $ | 21,969 | 8.8 | % | ||||||
| Tenant reinsurance | 19,173 | 15,555 | 3,618 | 23.3 | % | |||||||||
| Acquisition related costs and other | — | 12,111 | (12,111 | ) | (100.0 | )% | ||||||||
| General and administrative | 78,961 | 81,806 | (2,845 | ) | (3.5 | )% | ||||||||
| Depreciation and amortization | 193,296 | 182,560 | 10,736 | 5.9 | % | |||||||||
| Total expenses | $ | 563,404 | $ | 542,037 | $ | 21,367 | 3.9 | % |
Property Operations—The increase in property operations expense consists primarily of an increase of $19,607 related to acquisitions completed in 2017 and 2016. We acquired 46 operating stores during the year ended December 31, 2017 and 99 stores during the year ended December 31, 2016.
Tenant Reinsurance—Tenant reinsurance expense represents the costs that are incurred to provide tenant reinsurance. The change is due primarily to the increase in the number of stores we owned and/or managed.
Acquisition Related Costs and Other—For the year ended December 31, 2016, acquisition related costs represented closing and other transaction costs incurred in connection with our acquisition of operating stores, which were accounted for as business combinations. On January 1, 2017, we adopted the guidance in ASU 2017-01, "Business Combinations (Topic 805) - Clarifying the Definition of a Business," which resulted in our acquisition of operating stores being accounted for as asset acquisitions rather than business combinations. Accordingly, closing and other transaction costs have been capitalized in 2017 as part of the acquisition price for asset acquisitions, rather than being expensed as incurred.
General and Administrative—General and administrative expenses primarily include all expenses not directly related to our stores, including corporate payroll, travel and professional fees. These expenses are recognized as incurred. General and administrative expenses for the year ended December 31, 2017 decreased when compared to the same period in the prior year primarily as a result of an expense of $4,000 that was recorded during the year ended December 31, 2016 as the result of a legal settlement. There were no such expenses during the year ended December 31, 2017. We did not observe any material trends in specific payroll, travel or other expenses that contributed significantly to the increase in general and administrative expenses apart from the increase due to the management of additional stores.
Depreciation and Amortization—Depreciation and amortization expense increased as a result of the acquisition of new stores. We acquired 46 operating stores during the year ended December 31, 2017, and 99 operating stores during the year ended December 31, 2016.
Other Income and Expenses
The following table presents information on other revenues and expenses for the years indicated:
| For the Year Ended December 31, | ||||||||||||||
| 2017 | 2016 | $ Change | % Change | |||||||||||
| Other income and expenses: | ||||||||||||||
| Gain on real estate transactions, earnout on prior acquisitions and impairment of real estate | $ | 112,789 | $ | 8,465 | $ | 104,324 | 1,232.4 | % | ||||||
| Interest expense | (153,511 | ) | (133,479 | ) | (20,032 | ) | 15.0 | % | ||||||
| Non-cash interest expense related to amortization of discount on equity component of exchangeable senior notes | (5,103 | ) | (4,980 | ) | (123 | ) | 2.5 | % | ||||||
| Interest income | 6,736 | 10,998 | (4,262 | ) | (38.8 | )% | ||||||||
| Equity in earnings of unconsolidated real estate ventures | 15,331 | 12,895 | 2,436 | 18.9 | % | |||||||||
| Equity in earnings of unconsolidated real estate ventures - gain on sale of real estate assets and purchase of joint venture partners' interests | — | 69,199 | (69,199 | ) | (100.0 | )% | ||||||||
| Income tax expense | (3,625 | ) | (15,847 | ) | 12,222 | (77.1 | )% | |||||||
| Total other income (expense), net | $ | (27,383 | ) | $ | (52,749 | ) | $ | 25,366 | (48.1 | )% | ||||
Gain on Real Estate Transactions, Earnout on Prior Acquisitions, and Impairment of Real Estate— During the year ended December 31, 2017, we sold 36 stores to a new joint venture with an existing partner. We have a 10% ownership interest in the new joint venture. We recognized a total gain of $118,776 related to this transaction. During the year ended December 31, 2017, we also recognized an impairment loss of $6,100 related to three parcels of undeveloped land.
During the year ended December 31, 2016, through various transactions, we sold a total of nine stores located in Indiana, Ohio and Texas. We recognized a total gain of $11,358 related to these dispositions.
During 2014, we acquired five stores where we agreed to make an additional cash payment to the sellers if the acquired stores exceeded a specified amount of net operating income for the years ending December 31, 2015 and 2016. As the operating income of these stores during the earnout period was higher than originally estimated, an additional payment was due to the sellers of $4,284, which was recorded as a loss during 2016.
Interest Expense—The increase in interest expense during the year ended December 31, 2017 was primarily the result of higher debt balances when compared to the prior year as well as an increase in our average interest rate. The total face value of our debt, including our lines of credit, was $4,601,322 at December 31, 2017 compared to $4,363,697 at December 31, 2016. Our average interest rate as of December 31, 2017 was 3.3% compared to 3.0% at December 31, 2016.
Non-cash Interest Expense Related to Amortization of Discount on Equity Component of Exchangeable Senior Notes—Represents the amortization of the discounts related to the equity components of the exchangeable senior notes issued by our Operating Partnership.
Interest Income—Interest income represents amounts earned on cash and cash equivalents deposited with financial institutions and interest earned on notes receivable and income earned on notes receivable from preferred and common Operating Partnership unit holders.
Equity in Earnings of Unconsolidated Real Estate Ventures—Equity in earnings of unconsolidated real estate ventures represents the income earned through our ownership interests in unconsolidated joint ventures.
Equity in Earnings of Unconsolidated Real Estate Ventures—Gain on Sale of Real Estate Assets and Purchase of Joint Venture Partners’ Interests— Beginning January 1, 2017, the acquisition of our joint venture partners' interests in stores are no longer considered business combinations achieved in stages (step acquisitions) due to the adoption of ASU 2017-01, "Business Combinations (Topic 805): Clarifying the Definition of a Business." Instead, these transactions are considered asset acquisitions; therefore we had no gain or loss to record related to these transactions during the year ended December 31, 2017. In 2016 we had several large transactions with our joint venture partners that did result in gains. We acquired 11 stores from
the ESS WCOT LLC joint venture ("WCOT") in a step acquisition. We recorded a gain of $4,651 as a result of the transaction. Similarly, we acquired 23 stores from our PRISA II joint venture ("PRISA II") in a separate step acquisition and recorded a gain of $6,778 on the transaction. Immediately after the step acquisition, we sold our interest in the PRISA II joint venture, which still owned 42 properties, to our joint venture partners, and recognized a gain of $30,846. Lastly, we acquired six stores from our VRS Self Storage LLC joint venture (“VRS”) in a step acquisition, where we again recorded a gain of $26,923.
Income Tax Expense— The decrease in income tax expense relates primarily to the remeasurement of our deferred tax liability balance and valuation allowance as a result of the 2017 Tax Legislation. The tax benefit recorded from this remeasurement was $8,606 for the year ended December 31, 2017. We also generated tax credits from our solar program in the amount of $5,308.
FUNDS FROM OPERATIONS
Funds from operations ("FFO") provides relevant and meaningful information about our operating performance that is necessary, along with net income and cash flows, for an understanding of our operating results. We believe FFO is a meaningful disclosure as a supplement to net earnings. Net earnings assume that the values of real estate assets diminish predictably over time as reflected through depreciation and amortization expenses. The values of real estate assets fluctuate due to market conditions and we believe FFO more accurately reflects the value of our real estate assets. FFO is defined by the National Association of Real Estate Investment Trusts, Inc. (“NAREIT”) as net income computed in accordance with U.S. generally accepted accounting principles (“GAAP”), excluding gains or losses on sales of operating stores and impairment write-downs of depreciable real estate assets, plus real estate related depreciation and amortization and after adjustments to record unconsolidated partnerships and joint ventures on the same basis. We believe that to further understand our performance, FFO should be considered along with the reported net income and cash flows in accordance with GAAP, as presented in the consolidated financial statements. FFO should not be considered a replacement of net income computed in accordance with GAAP.
The computation of FFO may not be comparable to FFO reported by other REITs or real estate companies that do not define the term in accordance with the current NAREIT definition or that interpret the current NAREIT definition differently. FFO does not represent cash generated from operating activities determined in accordance with GAAP, and should not be considered as an alternative to net income as an indication of our performance, as an alternative to net cash flow from operating activities as a measure of our liquidity, or as an indicator of our ability to make cash distributions.
The following table presents the calculation of FFO for the periods indicated:
| For the Year Ended December 31, | ||||||||||||
| 2018 | 2017 | 2016 | ||||||||||
| Net income attributable to common stockholders | $ | 415,289 | $ | 479,013 | $ | 366,127 | ||||||
| Adjustments: | ||||||||||||
| Real estate depreciation | 193,587 | 172,660 | 155,358 | |||||||||
| Amortization of intangibles | 8,340 | 13,591 | 20,467 | |||||||||
| Gain on real estate transactions, earnout on prior acquisitions and impairment of real estate assets | (30,807 | ) | (112,789 | ) | (8,465 | ) | ||||||
| Unconsolidated joint venture real estate depreciation and amortization | 7,064 | 5,489 | 4,505 | |||||||||
| Unconsolidated joint venture gain on sale of real estate and purchase of partner's interest1 | — | — | (69,199 | ) | ||||||||
| Distributions paid on Series A Preferred Operating Partnership units | (2,288 | ) | (3,119 | ) | (5,085 | ) | ||||||
| Income allocated to Operating Partnership noncontrolling interests | 31,791 | 35,306 | 30,962 | |||||||||
| Funds from operations attributable to common stockholders and unit holders | $ | 622,976 | $ | 590,151 | $ | 494,670 |
| (1) | Beginning January 1, 2017, the disposition of properties is not considered the disposal of a business due to the adoption of ASU 2017-01 "Business Combinations (Topic 805): Clarifying the Definition of a Business." |
SAME-STORE RESULTS
Comparison of the Year Ended December 31, 2018 to the Year Ended December 31, 2017
Our same-store pool for the periods presented consists of 783 stores that are wholly-owned and operated and that were stabilized by the first day of the earliest calendar year presented. We consider a store to be stabilized once it has been open for three years or has sustained average square foot occupancy of 80% or more for one calendar year. We believe that by providing same-store results from a stabilized pool of stores, with accompanying operating metrics including, but not limited to: occupancy, rental revenue growth, operating expense growth, net operating income growth, etc., stockholders and potential investors are able to evaluate operating performance without the effects of non-stabilized occupancy levels, rent levels, expense levels, acquisitions or completed developments. Same-store results should not be used as a basis for future same-store performance or for the performance of our stores as a whole. The following table presents operating data for our same-store portfolio:
| For the Year Ended December 31, | Percent | ||||||||
| 2018 | 2017 | Change | |||||||
| Same-store rental revenues | $ | 958,797 | $ | 921,270 | 4.1% | ||||
| Same-store operating expenses | 262,604 | 251,853 | 4.3% | ||||||
| Same-store net operating income | $ | 696,193 | $ | 669,417 | 4.0% | ||||
| Same-store square foot occupancy as of quarter end | 91.8 | % | 91.9 | % | |||||
| Properties included in same-store | 783 | 783 |
Same-store revenues for the year ended ended December 31, 2018 increased due to gains in occupancy and higher rental rates for both new and existing customers. Expenses were higher for the year ended December 31, 2018, primarily due to increases in property taxes, payroll and benefits and marketing.
The following table presents a reconciliation of same-store net operating income to net income as presented on our condensed consolidated statements of operations for the periods indicated:
| For the Year Ended December 31, | |||||||
| 2018 | 2017 | ||||||
| Net Income | $ | 447,080 | $ | 514,222 | |||
| Adjusted to exclude: | |||||||
| Gain on real estate transactions, earnout from prior acquisition and impairment of real estate | (30,807 | ) | (112,789 | ) | |||
| Equity in earnings of unconsolidated joint ventures | (14,452 | ) | (15,331 | ) | |||
| Interest expense | 183,123 | 158,614 | |||||
| Depreciation and amortization | 209,050 | 193,296 | |||||
| Income tax expense | 9,244 | 3,625 | |||||
| General and administrative (includes stock compensation) | 81,256 | 78,961 | |||||
| Management fees, other income and interest income | (47,049 | ) | (46,115 | ) | |||
| Net tenant insurance | (89,800 | ) | (79,228 | ) | |||
| Non same store revenue | (80,543 | ) | (45,959 | ) | |||
| Non same store expense | 29,091 | 20,121 | |||||
| Total same store NOI | $ | 696,193 | $ | 669,417 | |||
Comparison of the Year Ended December 31, 2017 to the Year Ended December 31, 2016
Our same-store pool for the periods presented consists of 701 stores that are wholly-owned and operated and that were stabilized by the first day of the earliest calendar year presented. We consider a store to be stabilized once it has been open for three years or has sustained average square foot occupancy of 80% or more for one calendar year. We believe that by providing same-store results from a stabilized pool of stores, with accompanying operating metrics including, but not limited to: occupancy, rental revenue growth, operating expense growth, net operating income growth, etc., stockholders and potential investors are able to evaluate operating performance without the effects of non-stabilized occupancy levels, rent levels, expense levels, acquisitions or completed developments. Same-store results should not be used as a basis for future same-store performance or for the performance of our stores as a whole. The following table presents operating data for our same-store portfolio:
| For the Year Ended December 31, | Percent | ||||||||
| 2017 | 2016 | Change | |||||||
| Same-store rental and tenant reinsurance revenues | $ | 831,453 | $ | 790,864 | 5.1% | ||||
| Same-store operating and tenant reinsurance expenses | 224,353 | 223,173 | 0.5% | ||||||
| Same-store net operating income | $ | 607,100 | $ | 567,691 | 6.9% | ||||
| Same-store square foot occupancy as of quarter end | 91.9 | % | 91.5 | % | |||||
| Properties included in same-store | 701 | 701 |
Same-store revenues for the year ended ended December 31, 2017 increased due to gains in occupancy and higher rental rates for both new and existing customers. Expenses for the year ended December 31, 2017 were moderately higher primarily due to increases in property taxes and marketing expense offset by decreases in repairs and maintenance and insurance.
The following table presents a reconciliation of same-store net operating income to net income as presented on our condensed consolidated statements of operations for the periods indicated:
| For the Year Ended December 31, | |||||||
| 2017 | 2016 | ||||||
| Net Income | $ | 514,222 | $ | 397,089 | |||
| Adjusted to exclude: | |||||||
| Gain on real estate transactions, earnout from prior acquisition and impairment of real estate | (112,789 | ) | (8,465 | ) | |||
| Equity in earnings of unconsolidated joint ventures | (15,331 | ) | (12,895 | ) | |||
| Equity in earnings of unconsolidated real estate ventures - gain on sale of real estate assets and purchase of joint venture partners' interests1 | — | (69,199 | ) | ||||
| Acquisition related costs and other2 | — | 12,111 | |||||
| Interest expense | 158,614 | 138,459 | |||||
| Depreciation and amortization | 193,296 | 182,560 | |||||
| Income tax expense | 3,625 | 15,847 | |||||
| General and administrative | 78,961 | 81,806 | |||||
| Management fees, other income and interest income | (46,115 | ) | (50,840 | ) | |||
| Net tenant insurance | (79,228 | ) | (71,736 | ) | |||
| Non same store revenue | (135,776 | ) | (73,878 | ) | |||
| Non same store expense | 47,621 | 26,832 | |||||
| Total same store NOI | $ | 607,100 | $ | 567,691 | |||
| (1) | Beginning January 1, 2017, the disposition of properties is not considered the disposal of a business due to the adoption of ASU 2017-01 "Business Combinations (Topic 805): Clarifying the Definition of a Business." |
| (2) | Beginning January 1, 2017, acquisition related costs have been capitalized due to the adoption of ASU 2017-01 "Business Combinations (Topic 805): Clarifying the Definition of a Business." |
CASH FLOWS
Cash flows from operating activities increased as expected from our continued growth in revenues through rates along with the increase in the number of properties we own and operate. Cash flows used in investing activities relate primarily to our acquisition, development, and sales of stores and investments in unconsolidated real estate ventures, and fluctuate depending on our actions in those areas. Cash flows from financing activities depend primarily on our debt and equity financing activities. A summary of cash flows along with significant components are as follows:
| For the Year Ended December 31, | ||||||||
| 2018 | 2017 | 2016 | ||||||
| Net cash provided by operating activities | 677,795 | 597,375 | 539,263 | |||||
| Net cash used in investing activities | (443,898 | ) | (353,079 | ) | (1,048,889 | ) | ||
| Net cash (used in) provided by financing activities | (247,251 | ) | (215,994 | ) | 460,831 | |||
| Significant components of net cash flow included: | ||||||||
| Net income | 447,080 | 514,222 | 397,089 | |||||
| Depreciation and amortization | 209,050 | 193,296 | 182,560 | |||||
| Acquisition and development of new stores | (487,065 | ) | (684,931 | ) | (1,109,802 | ) | ||
| Gain on real estate transactions, earnout on prior acquisitions and impairment of real estate | (30,807 | ) | (112,789 | ) | (8,465 | ) | ||
| Investment in unconsolidated real estate ventures | (65,500 | ) | (17,944 | ) | (28,241 | ) | ||
| Proceeds from the sale of common stock, net of offering costs | 90,231 | — | 123,424 | |||||
| Net proceeds from our debt financing and repayment activities | 134,244 | 217,028 | 755,720 | |||||
| Dividends paid on common stock | (424,907 | ) | (393,040 | ) | (367,818 | ) | ||
We believe that cash flows generated by operations, along with our existing cash and cash equivalents, the availability of funds under our existing lines of credit, and our access to capital markets will be sufficient to meet all of our reasonably anticipated cash needs during the next twelve months. These cash needs include operating expenses, monthly debt service payments, recurring capital expenditures, acquisitions, building redevelopments and expansions, distributions to unit holders and dividends to stockholders necessary to maintain our REIT qualification.
We expect to generate positive cash flow from operations in 2019, and we consider these projected cash flows in our sources and uses of cash. These cash flows are principally derived from rents paid by our tenants. A significant deterioration in projected cash flows from operations could cause us to increase our reliance on available funds under our existing lines of credit, curtail planned capital expenditures, or seek other additional sources of financing.
LIQUIDITY AND CAPITAL RESOURCES
Financing Strategy
We will continue to employ leverage in our capital structure in amounts reviewed from time to time by our board of directors. Although our board of directors has not adopted a policy which limits the total amount of indebtedness that we may incur, we will consider a number of factors in evaluating our level of indebtedness from time to time, as well as the amount of such indebtedness that will be either fixed or variable rate. In making financing decisions, we will consider factors including but not limited to:
| • | the interest rate of the proposed financing; |
| • | the extent to which the financing impacts flexibility in managing our stores; |
| • | prepayment penalties and restrictions on refinancing; |
| • | the purchase price of stores acquired with debt financing; |
| • | long-term objectives with respect to the financing; |
| • | target investment returns; |
| • | the ability of particular stores, and our Company as a whole, to generate cash flow sufficient to cover expected debt service payments; |
| • | overall level of consolidated indebtedness; |
| • | timing of debt maturities; |
| • | provisions that require recourse and cross-collateralization; and |
| • | corporate credit ratios including fixed charge coverage ratio and max secured/unsecured indebtedness. |
Our indebtedness may be recourse, non-recourse, cross-collateralized, cross-defaulted, secured or unsecured. In addition, we may invest in stores subject to existing loans collateralized by mortgages or similar liens, or may refinance stores acquired on a leveraged basis. We may use the proceeds from any borrowings to refinance existing indebtedness, to refinance investments, including the redevelopment of existing stores, for general working capital or to purchase additional interests in partnerships or joint ventures or for other purposes when we believe it is advisable.
As of December 31, 2018, we had $57,496 available in cash and cash equivalents. Our cash and cash equivalents are held in accounts managed by third party financial institutions and consist of invested cash and cash in our operating accounts. During 2018 and 2017, we experienced no loss or lack of access to our cash or cash equivalents; however, there can be no assurance that access to our cash and cash equivalents will not be impacted by adverse conditions in the financial markets.
As of December 31, 2018, we had $4,854,077 face value of debt, resulting in a debt to total enterprise value ratio of 28.4%. As of December 31, 2017, we had $4,601,322 face value of debt, resulting in a debt total enterprise value ratio of 28.1%. As of December 31, 2018, the ratio of total fixed-rate debt and other instruments to total debt was 74.1% (including $2,192,550 on which we have interest rate swaps that have been included as fixed-rate debt). As of December 31, 2017, the ratio of total fixed-rate debt and other instruments to total debt was 74.7% (including $2,283,049 on which we have interest rate swaps that have been included as fixed-rate debt). The weighted average interest rate of the total of fixed- and variable-rate debt at December 31, 2018 and 2017 was 3.5% and 3.3%, respectively. Certain of our real estate assets are pledged as collateral for our debt. We are subject to certain restrictive covenants relating to our outstanding debt. We were in compliance with all financial covenants at December 31, 2018.
We expect to fund our short-term liquidity requirements, including operating expenses, recurring capital expenditures, dividends to stockholders, distributions to holders of Operating Partnership units and interest on our outstanding indebtedness, out of our operating cash flow, cash on hand and borrowings under our revolving lines of credit. In addition, we are pursuing additional sources of financing based on anticipated funding needs.
Our liquidity needs consist primarily of operating expenses, monthly debt service payments, recurring capital expenditures, dividends to stockholders and distributions to unit holders necessary to maintain our REIT qualification. We may from time to time seek to repurchase our outstanding debt, shares of common stock or other securities in open market purchases, privately negotiated transactions or otherwise. Such repurchases, if any, will depend on prevailing market conditions, our liquidity requirements, contractual restrictions and other factors. In addition, we evaluate, on an ongoing basis, the merits of strategic acquisitions and other relationships, which may require us to raise additional funds. We may also use Operating Partnership units as currency to fund acquisitions from self-storage owners who desire tax-deferral in their exiting transactions.
OFF-BALANCE SHEET ARRANGEMENTS
Except as disclosed in the notes to our financial statements, we do not currently have any relationships with unconsolidated entities or financial partnerships, such as entities often referred to as structured finance or special purposes entities, which typically are established for the purpose of facilitating off-balance sheet arrangements or other contractually narrow or limited purposes. Further, except as disclosed in the notes to our financial statements, we have not guaranteed any obligations of unconsolidated entities nor do we have any commitments or intent to provide funding to any such entities. Accordingly, we are not materially exposed to any financing, liquidity, market or credit risk that could arise if we had engaged in these relationships.
CONTRACTUAL OBLIGATIONS
The following table presents information on future payments due by period as of December 31, 2018:
| Payments due by Period: | |||||||||||||||||||
| Less Than | After | ||||||||||||||||||
| Total | 1 Year | 1-3 Years | 3-5 Years | 5 Years | |||||||||||||||
| Operating leases | $ | 151,158 | $ | 8,203 | $ | 16,444 | $ | 14,858 | $ | 111,653 | |||||||||
| Notes payable, unsecured term loans, notes payable to trusts and revolving lines of credit | |||||||||||||||||||
| Interest | 800,214 | 166,690 | 269,795 | 198,755 | 164,974 | ||||||||||||||
| Principal | 4,854,077 | 208,742 | 1,583,537 | 1,210,594 | 1,851,204 | ||||||||||||||
| Total contractual obligations | $ | 5,805,449 | $ | 383,635 | $ | 1,869,776 | $ | 1,424,207 | $ | 2,127,831 |
The operating leases above include minimum future lease payments on leases for 23 of our operating stores as well as leases of our corporate offices. Three ground leases include additional contingent rental payments based on the level of revenue achieved at the store.
As of December 31, 2018, the weighted average interest rate for all fixed rate loans was 3.4%, and the weighted average interest rate on all variable rate loans was 3.9%.
For more information on our contractual obligations related to real estate acquisitions, refer to our commitments and contingencies footnote in the notes to the consolidated financial statements in Item 8 of this Form 10-K.
SEASONALITY
The self-storage business is subject to seasonal fluctuations. A greater portion of revenues and profits are realized from May through September. Historically, our highest level of occupancy has been at the end of July, while our lowest level of occupancy has been in late February and early March. Results for any quarter may not be indicative of the results that may be achieved for the full fiscal year.
Previous: Item 6. Selected Financial Data · Next: Item 7A. Quantitative and Qualitative Disclosures About Market Risk