 filings.tools
Item 7. MANAGEMENT'S DISCUSSION AND ANALYSIS OF FINANCIAL CONDITION AND RESULTS OF OPERATIONS
62K characters. Original on sec.gov · Markdown
Item 7. MANAGEMENT'S DISCUSSION AND ANALYSIS OF FINANCIAL CONDITION AND RESULTS OF OPERATIONS
The following is management's discussion and analysis of certain significant factors which have affected our financial position and operating results during the periods included in the accompanying consolidated financial statements.
Business and Operational Overview
Fastenal is a North American leader in the wholesale distribution of industrial and construction supplies. We distribute these supplies through a network of approximately 3,100 in-market locations. Most of our customers are in the manufacturing and non-residential construction markets. The manufacturing market includes both OEM and MRO customers. The non-residential construction market includes general, electrical, plumbing, sheet metal, and road contractors. Other users of our products include farmers, truckers, railroads, oil exploration, production and refinement companies, mining companies, federal, state, and local governmental entities, schools, and certain retail trades. Geographically, our branches and customers are primarily located in North America.
It is helpful to appreciate several aspects of our marketplace: (1) It's big. We estimate the North American marketplace for industrial supplies is in excess of $140 billion per year (and we have expanded beyond North America) and no company has a significant portion of this market. (2) Many of the products we sell are individually inexpensive, but the cost and time to manage, procure, and transport these products can be quite meaningful. (3) Purchasing professionals often expend disproportionate effort managing the high SKU count of low-volume, low value MRO supplies which is better allocated to their higher volume, higher value OEM supplies. (4) Many customers prefer to reduce their number of suppliers to simplify their business, while also utilizing various technologies and models (including our local branches when they need something quickly or unexpectedly) to improve availability and reduce waste. (5) We believe the markets are efficient. To us, this means we can grow our market share if we provide the greatest value to our customer.
Our approach to addressing these aspects of our marketplace is captured in our motto Growth through Customer Service. The concept of growth is simple: find more customers every day and increase our activity with them. However, execution is hard work. First, we recruit service-minded individuals to support our customers and their business. Second, we operate in a decentralized fashion to help identify the greatest value for our customers. Third, we have a great team behind our customer-facing resources to operate efficiently and to help identify new business solutions. Fourth, we strive to generate strong profits, which produce the cash flow necessary to fund our growth and to support the needs of our customers. Lastly, we identify drivers that allow us to get closer to our customers and gain market share.
We believe our ability to grow is amplified if we can serve our customers at the closest economic point of contact. At one point, the closest economic point of contact was the local branch. Today, in some cases, we have moved the branch inside the customer's facility. We also are frequently positioned right at the point of consumption within customers' facilities through our industrial vending or FMI capabilities. Therefore, our focus centers on understanding our customers' day, their opportunities, and their obstacles. By doing these things every day, Fastenal remains a growth-centric organization.
Executive Overview
Net sales increased $574.6, or 13.1%, in 2018 relative to 2017. Our gross profit as a percentage of net sales declined to 48.3% in 2018 from 49.3% in 2017. Our operating income as a percentage of net sales in 2018 was comparable to 2017 at 20.1% in both years.
Our net earnings in 2018 were $751.9, an increase of 29.9% when compared to 2017. Our diluted net earnings per share were $2.62 in 2018 compared to $2.01 in 2017, an increase of 30.5%. Both periods included discrete tax items, primarily related to the Tax Act. Excluding these discrete items (a benefit of $7.1 in 2018 and a benefit of $24.4 in 2017), our net earnings in 2018 would have been $744.8, an increase of 34.4% when compared to 2017. Further, our diluted net earnings per share would have been $2.59 in 2018 compared to $1.92 in 2017, an increase of 34.9%. A portion of this increase relates to a lower tax rate in 2018 that is a feature of the Tax Act.
We continued to focus on our growth drivers in 2018. We signed 152 new national account contracts (defined as new customer accounts with a multi-site contract) and our national accounts revenues grew 18.1% in the period. Additionally, we signed 336 new Onsite customer locations (defined as dedicated sales and service provided from within, or in close proximity to, the customer's facility) and 22,073 new industrial vending devices. Sales growth in 2018 exceeded 20% through both our vending devices and our Onsite locations (excluding sales transferred from a branch).
The table below summarizes our total employee headcount, our investments in in-market locations (defined as the sum of the total number of public branch locations and the total number of active Onsite locations), and industrial vending devices at the end of the periods presented and the percentage change compared to the end of the prior period.
| Q4 2018 | Q4 2017 | Twelve-month % Change | ||||||
| In-market locations - absolute employee headcount | 14,015 | 13,424 | 4.4 | % | ||||
| Total absolute employee headcount | 21,644 | 20,565 | 5.2 | % | ||||
| Number of public branch locations | 2,227 | 2,383 | -6.5 | % | ||||
| Number of active Onsite locations | 894 | 605 | 47.8 | % | ||||
| Number of in-market locations | 3,121 | 2,988 | 4.5 | % | ||||
| Industrial vending devices (installed count) (1) | 81,137 | 71,421 | 13.6 | % | ||||
| Ratio of industrial vending devices to in-market locations | 26:1 | 24:1 |
(1) This number primarily represents devices which principally dispense product and produce product revenues, and excludes approximately 15,000 devices that are part of a locker lease program where the devices are principally used for the check-in/check-out of equipment.
During the last twelve months, we increased our absolute employee headcount by 591 people in our in-market locations and 1,079 people in total. This increase is mostly a function of additions we have made to support customer growth in the field as well as investments in our growth drivers.
We opened 11 branches and closed 157 branches in 2018. Additionally, ten branches were converted from public branches to non-public locations. Our in-market network forms the foundation of our business strategy, and we will continue to open or close locations as is deemed necessary to sustain and improve our network and support our growth drivers.
Results of Operations
The following sets forth consolidated statements of earnings information (as a percentage of net sales) for the periods ended December 31:
| 2018 | 2017 | 2016 | |||||||
| Net sales | 100.0 | % | 100.0 | % | 100.0 | % | |||
| Gross profit | 48.3 | % | 49.3 | % | 49.6 | % | |||
| Operating and administrative expenses | 28.2 | % | 29.2 | % | 29.5 | % | |||
| Gain on sale of property and equipment | 0.0 | % | 0.0 | % | 0.0 | % | |||
| Operating income | 20.1 | % | 20.1 | % | 20.1 | % | |||
| Net interest expense | -0.3 | % | -0.2 | % | -0.2 | % | |||
| Earnings before income taxes | 19.9 | % | 19.9 | % | 19.9 | % | |||
| Note – Amounts may not foot due to rounding difference. |
Net Sales
Note – Daily sales are defined as the total net sales for the period divided by the number of business days (in the United States) in the period. The table below sets forth net sales and daily sales for the periods ended December 31, and changes in such sales from the prior period to the more recent period:
| 2018 | 2017 | 2016 | |||||||
| Net sales | $ | 4,965.1 | 4,390.5 | 3,962.0 | |||||
| Percentage change | 13.1 | % | 10.8 | % | 2.4 | % | |||
| Business days | 254 | 254 | 255 | ||||||
| Daily sales | $ | 19.5 | 17.3 | 15.5 | |||||
| Percentage change | 13.1 | % | 11.3 | % | 2.0 | % | |||
| Daily sales impact of currency fluctuations | 0.1 | % | 0.1 | % | -0.4 | % | |||
| Daily sales impact of acquisitions | 0.4 | % | 1.0 | % | 0.6 | % |
The increase in net sales noted above for 2018 was a result of higher unit sales and, to a lesser degree, higher prices. Higher product prices were realized throughout 2018 as a result of actions (beginning initially in late 2017) taken to offset increases in product costs, and we believe these increases contributed 0.7% to 0.8% to growth for the year. The increases in net sales for 2017 and 2016 were driven primarily by higher unit sales. Price increases were not a material factor in 2017 or 2016.
The higher unit sales in 2018 and 2017 resulted primarily from two sources. The first is improvement in underlying market demand. We believe the improvement in general business activity is reflected in a number of metrics. For instance, the U.S. Purchasing Managers Index, published by the Institute for Supply Chain Management, averaged 58.8 in 2018 and 57.6 in 2017. Readings above 50 are indicative of growing demand, and we believe the levels described above were consistent with favorable business conditions and consistent with an increase in our sales growth rates. This was reflected as well in daily sales of fasteners, our most cyclical product line, which grew 11.2% and 8.4% in 2018 and 2017, respectively. We also experienced growth in sales to 84 of our top 100 customers in 2018, which compares to growth in sales to 79 of our top 100 customers in 2017.
The second source is success within our growth initiatives. We signed 22,073 industrial vending devices during 2018, an increase of 14.0% over 2017. In addition to an increase in our installed base, we achieved a low-single digit increase in average sales per device. These variables combined to generate sales growth through our vending devices in excess of 20% in 2018. We signed 336 new Onsite locations in 2018, an increase of 24.4% over 2017, and had 894 active sites on December 31, 2018, an increase of 47.8% over December 31, 2017. We signed 152 new national account contracts in 2018. The contribution of these new contracts and strong penetration of existing national account customers resulted in daily sales from our national account customers growing 18.1% in 2018 compared to 2017.
We signed 19,355 industrial vending devices during 2017, an increase of 7.2% over 2016. In addition to an increase in our installed base, we were also more efficient with the existing base, resulting in a modest increase in average sales per device and a decrease in our device removals of 3.8%. Combined sales through our vending devices accelerated throughout 2017, finishing with growth in the high teens. We signed 270 new Onsite locations in 2017, an increase of 53.4% over 2016, and had 605 active sites on December 31, 2017, an increase of 50.9% over December 31, 2016. We signed 168 new national account contracts in 2017. The contribution of these new contracts and strong penetration of existing national account customers resulted in daily sales from our national account customers growing 14.5% in 2017 compared to 2016.
In 2016, we saw relative weakness from non-residential construction and heavy manufacturing customers and in demand for our fastener products, speaking to the sustained softness in heavy and general industrial markets. Business with our largest customers was also relatively weak, with sales to our top 100 customers rising modestly in the first half of 2016 and falling modestly in the second half of 2016. While these trends were representative of conditions in the United States and Canada, total sales outside of these geographic areas were relatively strong and improved over the course of 2016. Net sales in 2016 were also impacted by slight inflationary price changes in our non-fastener products and some price deflation in our fastener products, with the net impact being a slight drag on growth. We experienced success with our growth initiatives in 2016, similar to 2017 and 2018; however, their impact to our net sales growth in 2016 was largely offset by a weaker economic environment.
Sales by Product Line
The approximate mix of sales from the fastener product line and from the other product lines was as follows:
| 2018 | 2017 | 2016 | |||
| Fastener product line | 34.9% | 35.6% | 36.6% | ||
| Other product lines | 65.1% | 64.4% | 63.4% |
The decrease in our fastener sales as a percentage of total sales arises from two factors. First, we believe non-fastener products represent a larger market opportunity than fasteners, and that we are relatively under-represented in this market. Over time, this has led to faster growth in the non-fastener product lines, a trend amplified by the growth of our industrial vending program through which we sell primarily non-fastener products. We believe this factor impacted each year shown and will continue to promote a lower mix of fasteners in our total sales over time. Second, a weak industrial production environment has a disproportionately negative effect on fastener sales relative to non-fastener sales (which relates more to plant operations than production). This weakness is more of a cyclical factor than a structural one, and as such was relevant in 2016, but not in 2017 or 2018 when a better economic environment at least partially mitigated the first factor discussed.
Annual Sales Changes, Sequential Trends, and End Market Performance
This section focuses on three distinct views of our business – annual sales changes by month, sequential trends, and end market performance. The first discussion regarding sales changes by month provides a good mechanical view of our business. The second discussion provides a framework for understanding the sequential trends (that is, comparing a month to the immediately preceding month, and also looking at the cumulative change from an earlier benchmark month) in our business. Finally, we believe the third discussion regarding end market performance provides insight into activities with our various types of customers.
Annual Sales Changes, by Month
During the months noted below, all of our selling locations, when combined, had daily sales growth rates of (compared to the same month in the preceding year):
| Jan. | Feb. | Mar. | Apr. | May | June | July | Aug. | Sept. | Oct. | Nov. | Dec. | ||||||||||||||||||||||||
| 2018 | 12.0 | % | 14.8 | % | 13.1 | % | 13.4 | % | 12.5 | % | 13.5 | % | 12.0 | % | 13.7 | % | 13.5 | % | 12.4 | % | 12.3 | % | 14.5 | % | |||||||||||
| 2017 | 3.8 | % | 6.1 | % | 8.4 | % | 8.9 | % | 9.7 | % | 13.0 | % | 12.9 | % | 12.8 | % | 15.3 | % | 13.8 | % | 15.4 | % | 14.7 | % | |||||||||||
| 2016 | 3.3 | % | 2.6 | % | 0.0 | % | 3.8 | % | 1.1 | % | 0.0 | % | 2.1 | % | 0.3 | % | 2.8 | % | 3.9 | % | 1.2 | % | 3.2 | % |
Sequential Trends
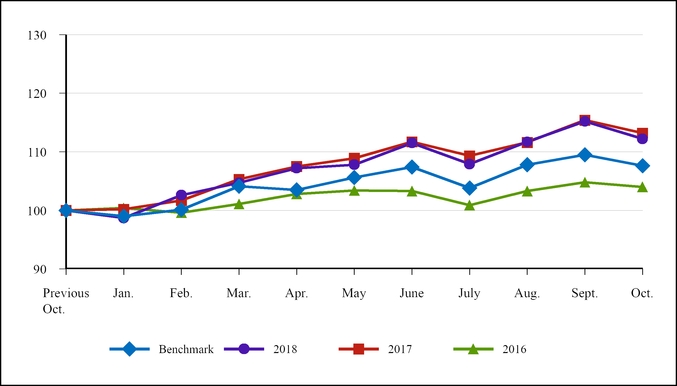
We find it helpful to think about the monthly sequential changes in our business using the analogy of climbing a stairway – This stairway has several predictable landings where there is a pause in the sequential gain (i.e. April, July, and October to December), but generally speaking, climbs from January to October. The October landing then establishes the benchmark for the start of the next year.
History has identified these landings in our business cycle. They generally relate to months where certain holidays impair business days and/or seasons impact certain end markets, particularly non-residential construction. The first landing centers on Easter and the Good Friday holiday that precedes it, which alternates between March and April (Good Friday occurred in March 2018, April 2017, and March 2016, and will fall in April in 2019), the second landing centers on July 4th, and the third landing centers on the approach of winter with its seasonal impact on primarily our non-residential construction business and with the Christmas/New Year holidays. The holidays we noted impact the trends because they either move from month-to-month or because they move around during the week.
The table below shows the pattern to the sequential change in our daily sales. The line labeled 'Benchmark' is an historical average of our sequential daily sales change for the trailing five year average (2013-2017). We believe this time frame serves to show the historical pattern and could serve as a benchmark for current performance. The '2018', '2017', and '2016' lines represent our actual sequential daily sales changes. The '18Delta', '17Delta', and '16Delta' lines indicate the difference between the 'Benchmark' and the actual results in the respective year.
It is important to note that these benchmarks are historical averages. In a year where demand is strong, our daily sales growth rates will tend to have more months that exceed the benchmark than fall below it. In a year where demand is weak, we will tend to have more months that fall short of the benchmark than exceed it. In both cases, there is a random element that makes it difficult to know how any single month will perform.
| Jan.(1) | Feb. | Mar. | Apr. | May | June | July | Aug. | Sept. | Oct. | Cumulative Change from Jan. to Oct. | ||||||||||||||||||||||
| Benchmark | -1.0 | % | 1.1 | % | 3.9 | % | -0.6 | % | 2.1 | % | 1.9 | % | -3.7 | % | 4.0 | % | 1.7 | % | -1.9 | % | 8.6 | % | ||||||||||
| 2018 | -1.3 | % | 4.0 | % | 2.1 | % | 2.4 | % | 0.6 | % | 3.7 | % | -3.6 | % | 3.8 | % | 3.6 | % | -3.0 | % | 13.9 | % | ||||||||||
| 18Delta | -0.4 | % | 2.9 | % | -1.9 | % | 3.1 | % | -1.5 | % | 1.9 | % | 0.0 | % | -0.2 | % | 1.9 | % | -1.2 | % | 5.3 | % | ||||||||||
| 2017 | 0.2 | % | 1.5 | % | 3.6 | % | 2.2 | % | 1.4 | % | 2.8 | % | -2.4 | % | 2.2 | % | 3.8 | % | -2.1 | % | 13.5 | % | ||||||||||
| 17Delta | 1.2 | % | 0.4 | % | -0.4 | % | 2.8 | % | -0.7 | % | 1.0 | % | 1.3 | % | -1.8 | % | 2.1 | % | -0.3 | % | 4.9 | % | ||||||||||
| 2016 | 0.4 | % | -0.8 | % | 1.5 | % | 1.7 | % | 0.6 | % | -0.2 | % | -2.3 | % | 2.4 | % | 1.5 | % | -0.9 | % | 3.6 | % | ||||||||||
| 16Delta | 1.3 | % | -1.9 | % | -2.5 | % | 2.3 | % | -1.5 | % | -2.0 | % | 1.4 | % | -1.7 | % | -0.1 | % | 1.0 | % | -5.1 | % |
(1) The January figures represent the percentage change from the previous October, whereas the remaining figures represent the percentage change from the previous month.
Note – Amounts may not foot due to rounding difference.
A graph of the sequential daily sales change patterns discussed above, starting with a base of '100' in the previous October and ending with the next October, would be as follows:
End Market Performance
The sequential trends noted above were directly linked to fluctuations in our end markets. To place this in perspective – we estimate approximately 65% of our business has historically been with customers engaged in some type of manufacturing, a significant subset of which finds its way into the heavy equipment market. The daily sales growth rates to these manufacturing customers, when compared to the same period in the prior year, were as follows(1):
| Q1 | Q2 | Q3 | Q4 | Annual | ||||||||||
| 2018 | 14.3 | % | 13.3 | % | 13.0 | % | 13.3 | % | 13.5 | % | ||||
| 2017 | 6.2 | % | 11.5 | % | 15.3 | % | 16.6 | % | 12.3 | % | ||||
| 2016 | 1.3 | % | 1.4 | % | 1.1 | % | 2.8 | % | 1.6 | % |
(1) In July 2017, we reclassified certain end market designations. The daily sales growth rates in the above table for all periods through the second quarter of 2017 differ from prior disclosures.
Our manufacturing business consists of two subsets: the industrial production business (this is business where we supply products that become part of the finished goods produced by our customers and is sometimes referred to as OEM - original equipment manufacturing) and the maintenance portion (this is business where we supply products that maintain the facility or the equipment of our customers engaged in manufacturing and is sometimes referred to as MRO - maintenance, repair, and operations). The industrial business is more fastener centered, while the maintenance portion is represented by all product categories.
The best way to understand the change in our industrial production business is to examine the results in our fastener product line (approximately 35% of our business) which is heavily influenced by changes in our business with heavy equipment manufacturers. From a company perspective, daily sales growth rates of fasteners, when compared to the same period in the prior year, were as follows (note: this information includes all end markets):
| Q1 | Q2 | Q3 | Q4 | Annual | ||||||||||
| 2018 | 11.8 | % | 11.1 | % | 10.8 | % | 11.3 | % | 11.2 | % | ||||
| 2017 | 0.8 | % | 7.9 | % | 12.1 | % | 13.4 | % | 8.4 | % | ||||
| 2016 | -1.7 | % | -2.4 | % | -2.9 | % | -2.4 | % | -2.3 | % |
The daily sales growth rates of fasteners noted in the table above for first quarter of 2018, and the second, third, and fourth quarters of 2017, include 3.7, 3.6, 3.8, and 3.9 percentage points, respectively, attributable to Mansco (acquired on March 31, 2017).
By contrast, the best way to understand the change in the maintenance portion of the manufacturing business is to examine the results in our non-fastener product lines. From a company perspective, daily sales growth rates of non-fasteners, when compared to the same period in the prior year, were as follows (note: this information includes all end markets):
| Q1 | Q2 | Q3 | Q4 | Annual | ||||||||||
| 2018 | 14.5 | % | 14.8 | % | 14.9 | % | 14.6 | % | 14.7 | % | ||||
| 2017 | 9.4 | % | 12.2 | % | 14.6 | % | 16.1 | % | 13.1 | % | ||||
| 2016 | 4.7 | % | 4.7 | % | 4.9 | % | 5.9 | % | 5.0 | % |
The non-fastener business has enjoyed superior growth in the strong 2018 and 2017 periods when compared to our fastener business and to the distribution industry in general. Further, while not immune to the impact of a weak industrial environment as was experienced in 2016, our non-fastener business did demonstrate greater relative resilience when compared to our fastener business and to the distribution industry in general. We believe this is due to both the growth of our vending business and our lower penetration of the non-fastener marketplace relative to our penetration of the fastener marketplace.
Our non-residential construction and reseller customers have historically represented 20% to 25% of our business. The daily sales growth rates to these customers, when compared to the same period in the prior year, were as follows(1):
| Q1 | Q2 | Q3 | Q4 | Annual | ||||||||||
| 2018 | 11.7 | % | 17.6 | % | 19.2 | % | 16.4 | % | 16.3 | % | ||||
| 2017 | 6.9 | % | 8.8 | % | 9.4 | % | 11.6 | % | 9.1 | % | ||||
| 2016 | 1.6 | % | 0.5 | % | 2.8 | % | 2.6 | % | 1.8 | % |
(1) In July 2017, we reclassified certain end market designations. The daily sales growth rates in the above table for all periods through the second quarter of 2017 differ from prior disclosures.
Our non-residential construction and reseller business is heavily influenced by the manufacturing economy as well as infrastructure spending. In 2018 and 2017, improving trends for commodities such as metals and energy, industrial capital spending, and the state of the broader economy contributed to an improvement in growth for these end markets. In 2016, volatility and weakness in commodity markets, particularly energy, and lower industrial capital spending contributed to slower growth.
Gross Profit
The gross profit percentage during each period was as follows:
| Q1 | Q2 | Q3 | Q4 | Annual | ||||||||||
| 2018 | 48.7 | % | 48.7 | % | 48.1 | % | 47.7 | % | 48.3 | % | ||||
| 2017 | 49.4 | % | 49.8 | % | 49.1 | % | 48.8 | % | 49.3 | % | ||||
| 2016 | 49.8 | % | 49.5 | % | 49.3 | % | 49.8 | % | 49.6 | % |
Our gross profit, as a percentage of net sales, was 48.3% in 2018 and 49.3% in 2017. The gross profit percentage for 2018 declined by 100 basis points based on three elements. (1) A change in product and customer mix. Fasteners are our largest and highest gross profit margin product line due to the high transaction cost surrounding the sourcing and supply of the product for customers. Our fastener product line declined to 34.9% of sales in 2018 from 35.6% of sales in 2017. Larger customers (for which national accounts are a good proxy), whose more focused buying patterns allow us to offer them better pricing, also influence the gross profit margin. Sales to our national account customers increased to 51.2% in 2018 from 48.7% of sales in 2017. The combination of relatively slower growth in our fastener product line and relatively faster growth in sales to our largest customers contributed to the decline in our overall gross profit margin in 2018. (2) Rising costs related to transporting products, particularly shipping fees, driver wages, and fuel, caused our freight expense to rise faster than sales, hurting our gross profit margin. Since we operate our own fleet of trucks for moving product between suppliers, our distribution centers, and our in-market locations, rising transportation costs adversely impact our gross profit margin and have the effect of reducing our gross profit, particularly if we are unable to pass these costs to our customers. (3) We have experienced inflation that has caused the cost of many of the products we purchase to rise. We have instituted price increases aimed at mitigating the effects of these cost increases, but we believe these actions have lagged in their ability to offset rising costs for our products, particularly fasteners, in 2018.
During 2017 and 2016, our gross profit, as a percentage of net sales, decreased when compared to the prior year. In each year, the decrease was primarily caused by the changes in product and customer mix noted above, as well as the acquisition of Mansco in 2017. Mansco's customer mix is more heavily oriented toward larger customers and its product mix tends to carry a lower gross profit product mix than the company's other products.
Operating and Administrative Expenses
Our operating and administrative expenses (including the gain on sales of property and equipment), as a percentage of net sales, improved to 28.2% in 2018 from 29.2% in 2017. This improvement was a function of the growth in employee-related, occupancy-related, and all other operating and administrative expenses being more modest than the growth in sales. Each of these reduced the ratio of operating and administrative expenses as a percentage of sales by approximately 30 to 40 basis points in 2018 from 2017.
The growth in employee-related, occupancy-related, and all other operating and administrative expenses compared to the same periods in the preceding year, is outlined in the table below.
| Approximate Percentage of Total Operating and Administrative Expenses | Twelve-month Period | ||||||||
| 2018 | 2017 | 2016 | |||||||
| Employee-related expenses | 65% to 70% | 11.1 | % | 10.2 | % | 2.7 | % | ||
| Occupancy-related expenses | 15% to 20% | 5.0 | % | 1.3 | % | 10.1 | % | ||
| All other operating and administrative expenses | 15% to 20% | 5.2 | % | 21.4 | % | 4.0 | % |
Employee-related expenses include: (1) payroll (which includes cash compensation, stock option expense, and profit sharing), (2) health care, (3) personnel development, and (4) social taxes. Our employee-related expenses increased in 2018. This was related to: (1) an increase in full-time equivalent ('FTE') headcount related to efforts to support growth in our business, (2) higher performance bonuses and commissions due to growth in net sales and net earnings, (3) an increase in our profit sharing contribution, (4) increases in hourly base wages, and (5) increased health care costs. The increase in 2017, when compared to 2016, was related to: (1) an increase in FTE headcount related to efforts to support growth in our business, (2) higher performance bonuses and commissions due to growth in net sales and net earnings, as well as regulatory driven incremental compensation, (3) an increase in our profit sharing contribution and options awards, (4) increased health care costs, and (5) the inclusion of Mansco personnel. The increase in 2016, when compared to 2015, was caused by increases in average annual FTE headcount and an increase in health care costs, which were partially offset by a contraction in our performance bonuses and commissions and in our profit sharing contribution, primarily due to lower sales growth, gross profit, and operating income (both on a dollar basis and on a relative basis).
The table below summarizes the percentage change in our FTE headcount at the end of the periods presented compared to the end of the prior period:
| Twelve-month Period | ||||||||
| 2018 | 2017 | 2016 | ||||||
| In-market locations | 5.7 | % | 7.0 | % | -5.6 | % | ||
| Total selling (includes in-market locations) | 5.4 | % | 7.3 | % | -4.9 | % | ||
| Distribution | 12.2 | % | 8.4 | % | -0.7 | % | ||
| Manufacturing | 12.0 | % | 8.4 | % | -9.1 | % | ||
| Administrative | 7.3 | % | 10.7 | % | 0.3 | % | ||
| Total | 6.8 | % | 7.7 | % | -4.1 | % |
Occupancy-related expenses include: (1) building rent and depreciation, (2) building utility costs, (3) equipment related to our branches and distribution locations, and (4) industrial vending equipment (we consider the vending equipment, excluding leased locker equipment, to be a logical extension of our in-market operations and classify the depreciation and repair costs as occupancy expense). The increase in occupancy-related expenses in 2018, when compared to 2017 was mainly driven by increases related to industrial vending equipment and non-branch occupancy and utility costs, only partly offset by a slight decline in branch occupancy costs from a lower public branch count. The slight increase in 2017, when compared to 2016, was mainly driven by increases in costs related to industrial vending equipment, FMI bins, and automation equipment at our distribution centers. The most significant components of our occupancy-related expenses, facility costs and utility expenses, were mostly flat in 2017, when compared to 2016 due to a reduction in our number of public branches. The increase in 2016, when compared to 2015, was mainly driven by an increase in the amount of industrial vending equipment and, to a lesser degree, an increase in occupancy expense related to rent.
All other operating and administrative expenses include: (1) selling-related transportation, (2) information technology (IT) expenses, and (3) general corporate expenses, which consists of legal expenses, general insurance expenses, travel and marketing expenses, etc. All other operating and administrative expenses increased in 2018 when compared to 2017, due to an increase in selling-related transportation expenses, consisting of both higher vehicle movement and fuel costs, as well as higher IT spending. General corporate expenses were slightly down. All other operating and administrative expenses increased in 2017 when compared to 2016. This was driven by increases in selling-related transportation, including higher vehicle movement and fuel costs, IT spending, and general corporate expenses. All other operating and administrative expenses increased in 2016 when compared to 2015. This was driven by primarily by higher IT spending, while selling-related transportation expenses rose modestly and general corporate expenses were relatively flat.
Net Interest Expense
Our net interest expense was $12.3 in 2018 compared to $8.7 in 2017, and $6.1 in 2016. The increase in 2018, when compared to 2017, was mainly caused by higher average interest rates and a higher average debt balance during the period. The increase in 2017, when compared to 2016, was mainly caused by higher average interest rates and a slightly higher average debt balance during the period.
Income Taxes
We recorded income tax expense of $235.1 in 2018, or 23.8% of earnings before income taxes. The effective income tax rate was significantly impacted by the following two items: (1) The lower corporate tax rate provided by the Tax Act resulted in a lower tax rate beginning in the first quarter of 2018. The effective income tax rate includes the immaterial impact of the U.S. tax on certain offshore earnings referred to as Global Intangible Low-Taxed Income (GILTI), a new deduction for Foreign Derived Intangible Income (FDII), and the new alternative U.S. tax on certain Base Erosion Anti-Avoidance (BEAT) payments from a U.S. company to any foreign related party. (2) Discrete income tax items to adjust our transition tax liability, reflect the impacts of accelerating depreciation for certain physical assets, and remeasure the impact of the U.S. tax rate on certain inter-company transactions. These discrete items resulted in approximately $7.1 of income tax benefit during 2018. The accounting for the income tax effects of the Tax Act is complete as of December 31, 2018.
We recorded a provisional income tax expense of $294.5 in 2017, or 33.7% of earnings before income taxes. This amount reflects a provisional estimate for the reduction in our deferred income tax liabilities of $30.8 as a result of the income tax rate decrease included in the Tax Act, partially offset by an estimated increase in income tax payable in the amount of $6.5 as a result of the transition tax on cash and cash equivalent balances related to accumulated earnings associated with our international operations, also included in the Tax Act. The decrease in our income tax rate from 2016 to 2017 was also related to changes in our reserve for uncertain tax positions and the adoption of the Financial Accounting Standards Board ('FASB') Accounting Standard Update ('ASU') 2016-09, Improvements to Employee Share-Based Payment Accounting, in the first quarter of 2017.
Income taxes, as a percentage of earnings before income taxes, were approximately 36.8% for 2016. The decrease in our income tax rate from 2015 to 2016 was caused by a slight change in jurisdictional income and changes in the reserve for uncertain tax positions. As our international business and profits grew the past several years, the lower income tax rates in those jurisdictions, relative to the United States, lowered our effective tax rate.
Net Earnings
Net earnings, net earnings per share (EPS), the percentage change in net earnings, and the percentage change in EPS, were as follows:
| Dollar Amounts | 2018 (1) | 2017 (2) | 2016 | ||||||
| Net earnings | $ | 751.9 | 578.6 | 499.4 | |||||
| Basic EPS | 2.62 | 2.01 | 1.73 | ||||||
| Diluted EPS | 2.62 | 2.01 | 1.73 | ||||||
| Percentage Change | 2018 (1) | 2017 (2) | 2016 | ||||||
| Net earnings | 29.9 | % | 15.8 | % | -3.3 | % | |||
| Basic EPS | 30.5 | % | 16.1 | % | -2.3 | % | |||
| Diluted EPS | 30.5 | % | 16.2 | % | -2.3 | % |
(1) Absent the impact of the Tax Act, our net earnings for 2018 would have been $625.2, an increase of 12.8% when compared to 2017, and our basic and diluted earnings per share would have each been $2.18, an increase of 13.3%.
(2) Absent the impact of the Tax Act, our net earnings for 2017 would have been $554.2, an increase of 11.0% when compared to 2016, and our basic and diluted earnings per share would have each been $1.92, an increase of 11.2% and 11.3%, respectively.
During 2018, net earnings increased, primarily due to stronger sales and operating profits combined with a reduction in income tax expense. The increase in basic and diluted earnings per share also reflected the purchase of our shares of common stock in 2018. During 2017, net earnings increased, primarily due to stronger sales and operating profits combined with a reduction in income tax expense. The slightly higher increase in basic and diluted earnings per share was primarily due to the purchase of our shares of common stock in 2017. During 2016, net earnings decreased, despite our nominal sales growth, primarily due to the reduction in the gross profit percent realized and an increase in operating and administrative expenses. The contraction of basic and diluted earnings per share was smaller due primarily to the purchase of our shares of common stock in 2015 and early 2016.
Liquidity and Capital Resources
Net Cash Provided by Operating Activities
Net cash provided by operating activities in dollars and as a percentage of net earnings were as follows:
| 2018 | 2017 | 2016 | |||||||
| Net cash provided | $ | 674.2 | 585.2 | 519.9 | |||||
| % of net earnings | 89.7 | % | 101.1 | % | 104.1 | % |
In 2018, the increase in net cash provided by operating activities was primarily due to our net earnings growth, which resulted from higher earnings growth and a lower tax rate as a result of the Tax Act. The decline in our operating cash flow as a percentage of net earnings largely reflects working capital trends, as further described below. In 2017, the increase in net cash provided by operating activities was primarily due to our net earnings growth. The decline in our operating cash flow as a percentage of net earnings largely reflects working capital trends, and specifically accounts receivable. In 2016, the slight contraction in the net cash provided by operating activities was driven by our initiative to add additional products into branch inventory under our CSP 16 format, and an increase in net accounts receivable growth. This decrease was partially offset by a reduction in net cash paid for income taxes.
Operational Working Capital
Operational working capital, which we define as accounts receivable, net and inventories, is highlighted below. The annual dollar change and the annual percentage change were as follows:
| Dollar change | 2018 | 2017 | ||||
| Accounts receivable, net | $ | 106.4 | 108.1 | |||
| Inventories | 185.8 | 99.9 | ||||
| Operational working capital | $ | 292.2 | 208.1 | |||
| Annual percentage change | 2018 | 2017 | ||||
| Accounts receivable, net | 17.5 | % | 21.6 | % | ||
| Inventories | 17.0 | % | 10.1 | % | ||
| Operational working capital | 17.2 | % | 13.9 | % |
Note – Amounts may not foot due to rounding difference.
In 2018, the annual growth in net accounts receivable reflects accelerating growth in sales throughout the course of the year combined with relatively stronger growth of our national accounts and international business. In addition, two trends emerged among our customer base that increased our net accounts receivable. The first was a push from our customers to contractually increase the period between when they are invoiced and when payment is due. The second was customers delaying payments beyond the end of the applicable quarter. We saw these behaviors intensify throughout 2018. In 2017, the annual growth in net accounts receivable reflects accelerating growth in sales throughout the course of the year combined with relatively stronger growth of our national accounts and international business. Growth in accounts receivable continued in the fourth quarter of 2017, with the timing of the Christmas and New Year holidays affecting the timing of these customers' payments. Currency fluctuations also impacted accounts receivable in 2017.
Our growth in inventory balances over time does not have as tight a relationship to our monthly sales patterns as does our growth in accounts receivable. One reason for this is cyclical. The lead time for inventory procurement is typically longer than the visibility we have into future monthly sales patterns, so economic downturns can cause a spike in inventory levels, as was seen in the dramatic economic slowdown in late 2008 and early 2009. Inventories may also fluctuate independent of monthly sales patterns based on strategic decisions. For instance, at various times we have increased our relative inventory levels based on new branch openings, expanded stocking breadth at distribution centers and/or individual branches (e.g., CSP), expanded direct sourcing, and expanded Fastenal brands. Our growth drivers, including industrial vending solutions, national accounts, and Onsite and international locations, have also required significant investments in inventory. In 2018, our inventories increased as a result of growth in general demand and successful execution of our growth drivers. Inflation had an increasing impact in the second half of 2018, and our decision to accelerate shipments of product to the U.S. from overseas ahead of potential tariffs resulted in extra inventory of approximately $12.0 in the fourth quarter of 2018. In 2017, the most significant contributor to the increase in inventories was improving business activity and the growth of our Onsite business.
The approximate percentage mix of inventory stocked at our selling locations versus our distribution center and manufacturing locations was as follows at year end:
| 2018 | 2017 | 2016 | ||||||
| Selling locations | 61 | % | 65 | % | 64 | % | ||
| Distribution center and manufacturing locations | 39 | % | 35 | % | 36 | % | ||
| Total | 100 | % | 100 | % | 100 | % |
Net Cash Used in Investing Activities
Net cash used in investing activities in dollars and as a percentage of net earnings were as follows:
| 2018 | 2017 | 2016 | |||||||
| Net cash used | $ | 173.9 | 179.3 | 188.1 | |||||
| % of net earnings | 23.1 | % | 31.0 | % | 37.7 | % |
The changes in net cash used in investing activities were primarily related to changes in our net capital expenditures as discussed below for each period and cash paid for acquisitions in 2017.
Net capital expenditures (purchases of property and equipment, less proceeds from the sale of property and equipment) in dollars and as a percentage of net earnings were as follows:
| 2018 | 2017 | 2016 | |||||||
| Net capital expenditures | $ | 166.8 | 112.5 | 183.0 | |||||
| % of net earnings | 22.2 | % | 19.4 | % | 36.6 | % |
Note – A reconciliation of net capital expenditures is outlined in the table below.
Our net capital expenditures increased in 2018, when compared to 2017, primarily due to increased spending on hub property and equipment, both to expand current capacity and for potential future expansion, as well as vending devices to support the growth of our industrial vending program. Our net capital expenditures decreased in 2017, when compared to 2016, primarily due to lower spending in 2017 related to: (1) the absence of spending on vending equipment that occurred in 2016 related to the leased locker rollout, (2) the absence of spending on shelving and signage that occurred in 2016 for the CSP 16 initiative, and (3) timing associated with the addition of pick-up trucks. Our net capital expenditures increased in 2016 primarily due to the purchase of industrial vending devices related to the leased locker program we signed in February 2016 and spending on automation in certain distribution centers.
Property and equipment expenditures in 2018, 2017, and 2016 consisted of: (1) the purchase of software and hardware for our information processing systems, (2) the addition of fleet vehicles, (3) the purchase of signage, shelving, and other fixed assets related to branch openings and our CSP 16 initiative, (4) the addition of manufacturing and warehouse equipment, (5) the expansion or improvement of certain owned or leased branch properties, (6) purchases related to industrial vending, and (7) costs related to enhancements to distribution centers including automated systems equipment. Disposals of property and equipment consisted of the planned disposition of certain pick-up trucks, distribution vehicles and trailers in the normal course of business, and the disposition of real estate relating to several branch locations.
Set forth below is a recap of our 2018, 2017, and 2016 net capital expenditures.
| 2018 | 2017 | 2016 | ||||||
| Manufacturing, warehouse and packaging equipment, industrial vending equipment, and facilities | 110.7 | 66.2 | 131.8 | |||||
| Shelving and related supplies for branch openings and for product expansion at existing branches | 9.6 | 8.3 | 14.1 | |||||
| Data processing software and equipment | 30.9 | 23.2 | 18.0 | |||||
| Real estate and improvements to branch locations | 12.9 | 6.2 | 5.5 | |||||
| Vehicles | 12.2 | 16.0 | 20.1 | |||||
| Purchases of property and equipment | 176.3 | 119.9 | 189.5 | |||||
| Proceeds from sale of property and equipment | (9.5 | ) | (7.4 | ) | (6.5 | ) | ||
| Net capital expenditures | 166.8 | 112.5 | 183.0 |
We expect our net capital expenditures in 2019 to be within a range of $195.0 to $225.0. This increase is a result of higher spending for property and equipment to expand our hub capacity, vending devices, and hub vehicles, with our investments in hub capacity likely to be the primary determinant of where we fall within our range. We anticipate funding our capital expenditure needs with cash generated from operations, from available cash and cash equivalents, and from our borrowing capacity.
Net Cash Used in Financing Activities
Net cash used in financing activities in dollars and as a percentage of net earnings were as follows:
| 2018 | 2017 | 2016 | |||||||
| Net cash used | $ | 446.5 | 407.2 | 346.8 | |||||
| % of net earnings | 59.4 | % | 70.4 | % | 69.4 | % |
The fluctuations in net cash used in financing activities are due to changes in the level of our dividend payments and in the level of common stock purchases. These amounts were partially offset by the exercise of stock options and net proceeds from debt obligations. These items in dollars and as a percentage of earnings were as follows:
| 2018 | 2017 | 2016 | |||||||
| Dividends paid | $ | 441.9 | 369.1 | 346.6 | |||||
| % of net earnings | 58.8 | % | 63.8 | % | 69.4 | % | |||
| Common stock purchases | 103.0 | 82.6 | 59.5 | ||||||
| % of net earnings | 13.7 | % | 14.3 | % | 11.9 | % | |||
| Total returned to shareholders | $ | 544.9 | 451.7 | 406.1 | |||||
| % of net earnings | 72.5 | % | 78.1 | % | 81.3 | % | |||
| Proceeds from the exercise of stock options | $ | (13.4 | ) | (9.5 | ) | (29.3 | ) | ||
| % of net earnings | -1.8 | % | -1.6 | % | -5.9 | % | |||
| Cash borrowings, net | $ | (85.0 | ) | (35.0 | ) | (30.0 | ) | ||
| % of net earnings | -11.3 | % | -6.0 | % | -6.0 | % | |||
| Net cash used | $ | 446.5 | 407.2 | 346.8 | |||||
| % of net earnings | 59.4 | % | 70.4 | % | 69.4 | % |
Stock Purchases
In 2018, we purchased 2,000,000 shares of our common stock at an average price of approximately $51.50 per share, in 2017, we purchased 1,900,000 shares at an average price of approximately $43.43 per share, and in 2016, we purchased 1,600,000 shares at an average price of approximately $37.15 per share.
Dividends
We declared a quarterly dividend of $0.43 per share on January 16, 2019. We paid aggregate annual dividends per share of $1.54, $1.28, and $1.20 in 2018, 2017, and 2016, respectively.
Debt
In order to fund the considerable cash needed to expand our industrial vending business, to increase the use of automation in our distribution centers, to purchase our common stock and pay dividends, and to fund the acquisition of Mansco on March 31, 2017, we have borrowed under our Credit Facility and our Master Note Agreement in recent periods.
Our borrowings under the Credit Facility peaked during each quarter of 2018 and 2017 as follows:
| Peak borrowings | 2018 | 2017 | ||||
| First quarter | $ | 335.0 | 325.0 | |||
| Second quarter | 360.0 | 365.0 | ||||
| Third quarter | 330.0 | 365.0 | ||||
| Fourth quarter | 435.0 | 325.0 |
As of December 31, 2018, we had loans outstanding under the Credit Facility of $365.0 and contingent obligations from letters of credit outstanding under the Credit Facility in an aggregate face amount of $36.3. As of December 31, 2018, we also had loans outstanding under the Master Note Agreement of $135.0. Descriptions of our Credit Facility and Master Note Agreement are contained in Note 9 of the Notes to Consolidated Financial Statements.
Unremitted Foreign Earnings
Approximately $118.4 of cash and cash equivalents are held by non-U.S. subsidiaries. These funds may create foreign currency translation gains or losses depending on the functional currency of the entity holding the cash. We have considered the financial requirements of each foreign subsidiary and our parent company and will continue to reinvest these funds to support our expansion activities outside the U.S., even after taking into consideration the deemed repatriation and transition tax under the
Tax Act. The income tax impact of repatriating cash associated with investments in foreign subsidiaries is discussed in Note 7 of the Notes to Consolidated Financial Statements.
Effects of Inflation
Throughout 2018, we experienced increasing product cost inflation for non-fastener and, especially, fastener products. We took actions in the latter part of 2017 and throughout 2018, including pricing adjustments, to offset this inflation. While we succeeded in raising prices through the year, we were not able to do so at the same rate that our costs rose which negatively affected our profit margins and earnings in 2018. Apart from generalized inflation, tariffs were instituted on certain products that we source from China, but this occurred later in the year and did not have a meaningful impact on sales or profits in 2018. Throughout 2017, we experienced increasing product cost inflation, particularly in our fastener products. We were able to take actions during the period, including pricing adjustments, to mostly offset this inflation. In the aggregate, the overall impact of inflation and pricing on sales and profits was not material in 2017. During the first half of 2016, we experienced some deflation in our fastener products, which was largely offset by some inflation in the latter half of the year, and minimal price movements in our non-fastener products.
Critical Accounting Policies and Estimates
In preparing our consolidated financial statements in conformity with U.S. GAAP, we must make decisions that impact the reported amounts of assets, liabilities, revenues and expenses, and the related disclosures. Such decisions include the selection of the appropriate accounting principles to be applied and the assumptions on which to base accounting estimates. In reaching such decisions, we apply judgments based on our understanding and analysis of relevant circumstances, historical experience, and actuarial valuations. Actual amounts could differ from those estimated at the time the consolidated financial statements are prepared.
Our most significant accounting policies, including Revenue Recognition and Inventories, are described in Note 1 of the Notes to Consolidated Financial Statements. Some of those significant accounting policies require us to make difficult, subjective, or complex judgments, or estimates. An accounting estimate is considered to be critical if it meets both of the following criteria: (i) the estimate requires assumptions about matters that are highly uncertain at the time the accounting estimate is made, and (ii) different estimates reasonably could have been used, or changes in the estimate that are reasonably likely to occur from period to period may have a material impact on the presentation of our financial condition, changes in financial condition, or results of operations. Our most critical accounting estimates include the following:
Allowance for doubtful accounts – This reserve is for accounts receivable balances that are potentially uncollectible. The reserve is based on an analysis of customer accounts and our historical experience with accounts receivable write-offs. Our methodology for estimating this reserve includes ongoing reviews of the aging of accounts receivable, the financial condition of a customer or industry, and general economic conditions. If business or economic conditions change, our estimates and assumptions may be adjusted as deemed appropriate. Historically, actual required reserves have not varied materially from estimated amounts.
Inventory obsolescence reserves – These reserves are based on an analysis of inventory trends including reviews of inventory levels, sales information, and the on-hand quantities relative to the sales history for the product. Our methodology for estimating these reserves is continually evaluated for factors that could require changes to the reserves including significant changes in product demand, market conditions, condition of the inventory, or liquidation value. If business or economic conditions change, our estimates and assumptions may be adjusted as deemed appropriate. Historically, actual required reserves have not varied materially from estimated amounts.
General insurance reserves – These reserves are for general claims related to workers' compensation, property and casualty losses, and other general liability self-insured losses. The reserves are based on an analysis of reported claims and claims incurred but not yet reported related to our historical claim trends. We perform ongoing reviews of our insured and uninsured risks and use this information to establish appropriate reserve levels. We analyze historical trends, claims experience, and loss development patterns to ensure the appropriate loss development factors are applied to the incurred costs associated with the claims made. Historically, actual required reserves have not varied materially from estimated amounts.
New Accounting Pronouncements
A description of new accounting pronouncements is contained in Note 1 of the Notes to Consolidated Financial Statements.
Geographic Information
Information regarding our revenues and long-lived assets by geographic area is contained in Note 2 and Note 3 of the Notes to Consolidated Financial Statements. Risks related to our foreign operations are described earlier in this Form 10-K under the heading 'Forward-Looking Statements' and 'Item 1A. Risk Factors'.
Certain Contractual Obligations
As of December 31, 2018, we had outstanding long-term debt and facilities, equipment, and vehicles leased under operating leases. Our future obligations to pay principal of and interest on such long-term debt and to make minimum lease payments under such operating leases are as follows:
| Total | 2019 | 2020 and 2021 | 2022 and 2023 | After 2023 | |||||||||||
| Principal of long-term debt | $ | 500.0 | 3.0 | 40.0 | 397.0 | 60.0 | |||||||||
| Interest on long-term debt(1) | 80.6 | 16.9 | 33.5 | 29.9 | 0.3 | ||||||||||
| Operating leases | 309.5 | 124.1 | 148.3 | 33.4 | 3.7 | ||||||||||
| Total | $ | 890.1 | 144.0 | 221.8 | 460.3 | 64.0 |
(1) Interest on the long-term debt outstanding under our Credit Facility was calculated using the interest rates and balances at December 31, 2018.
Purchase orders and contracts for the purchase of inventory and other goods and services are not included in the table above. Our purchase orders are based on current distribution needs and are fulfilled by our suppliers within short time horizons. We do not have significant agreements for the purchase of inventory or other goods or services specifying minimum order quantities.
Liabilities for uncertain tax positions have been excluded from the table above due to the uncertainty surrounding the ultimate settlement and timing of these liabilities, which we believe will be immaterial. A discussion of income taxes is contained in Note 7 of the Notes to Consolidated Financial Statements.
Non-GAAP Financial Measures
On December 22, 2017, the Tax Act was signed into law. The financial information included in this Form 10-K reflects the impact of the enactment of the Tax Act. Our net earnings and basic and diluted net earnings per share for 2017 and 2018 excluding the impact of the Tax Act or certain discrete tax items related to the Tax Act, are non-GAAP financial measures. Management believes reporting these measures will help investors understand the effect of tax reform on comparable reported results, and the comparable GAAP measure without these adjustments precedes any disclosure that excludes the impact of the Tax Act or certain discrete items related to the Tax Act.
Previous: Item 6. SELECTED FINANCIAL DATA · Next: Item 7A. QUANTITATIVE AND QUALITATIVE DISCLOSURES ABOUT MARKET RISKS