 filings.tools
Fastenal 10-K 2021-12-31
Filed 2022-02-07. 23 sections, 350K characters. Original on sec.gov · Markdown · JSON
Cover and table of contents
UNITED STATES
SECURITIES AND EXCHANGE COMMISSION
WASHINGTON, D.C. 20549
FORM 10-K
(Mark One)
| ☒ | Annual report pursuant to Section 13 or 15(d) of the Securities Exchange Act of 1934 |
For the fiscal year ended December 31, 2021
or
| ☐ | Transition report pursuant to Section 13 or 15(d) of the Securities Exchange Act of 1934 | ||||
| For the transition period from to |
Commission file number 0-16125
FASTENAL COMPANY
(Exact name of registrant as specified in its charter)
| Minnesota | 41-0948415 | |||||||
| (State or other jurisdiction of incorporation or organization) | (I.R.S. Employer Identification No.) |
| 2001 Theurer Boulevard, Winona, Minnesota | 55987-1500 | |||||||||||||
| (Address of principal executive offices) | (Zip Code) |
(507) 454-5374
(Registrant's telephone number, including area code)
Securities registered pursuant to Section 12(b) of the Act:
| Title of each class | Trading Symbol(s) | Name of each exchange on which registered | ||||||
| Common stock, par value $.01 per share | FAST | The Nasdaq Stock Market LLC |
Securities registered pursuant to Section 12(g) of the Act:
None
Indicate by check mark if the registrant is a well-known seasoned issuer, as defined in Rule 405 of the Securities Act Yes x No o
Indicate by check mark if the registrant is not required to file reports pursuant to Section 13 or Section 15(d) of the Exchange Act Yes o No x
Indicate by check mark whether the registrant: (1) has filed all reports required to be filed by Section 13 or 15(d) of the Securities Exchange Act of 1934 during the preceding 12 months (or for such shorter period that the registrant was required to file such reports), and (2) has been subject to such filing requirements for the past 90 days. Yes x No o
Indicate by check mark whether the registrant has submitted electronically every Interactive Data File required to be submitted pursuant to Rule 405 of Regulation S-T (§ 232.405 of this chapter) during the preceding 12 months (or for such shorter period that the registrant was required to submit such files). Yes x No o
Indicate by check mark whether the registrant is a large accelerated filer, an accelerated filer, a non-accelerated filer, a smaller reporting company, or an emerging growth company. See the definitions of "large accelerated filer", "accelerated filer", "smaller reporting company", and "emerging growth company" in Rule 12b-2 of the Exchange Act.
| Large Accelerated Filer | x | Accelerated Filer | ☐ | |||||||||||||||||
| Non-accelerated Filer | ☐ | Smaller Reporting Company | ☐ | |||||||||||||||||
| Emerging Growth Company | ☐ |
If an emerging growth company, indicate by check mark if the registrant has elected not to use the extended transition period for complying with any new or revised financial accounting standards provided pursuant to Section 13(a) of the Exchange Act. o
Indicate by check mark whether the registrant has filed a report on and attestation to its management's assessment of the effectiveness of its internal control over financial reporting under Section 404(b) of the Sarbanes-Oxley Act (15 U.S.C. 7262(b)) by the registered public accounting firm that prepared or issued its audit report. ☒
Indicate by check mark whether the registrant is a shell company (as defined in Rule 12b-2 of the Exchange Act).
Yes ☐ No x
The aggregate market value of the Common Stock held by non-affiliates of the registrant as of June 30, 2021, the last business day of the registrant's most recently completed second fiscal quarter, was $29,835,146,952, based on the closing price of the registrant's Common Stock on that date. For purposes of determining this number, all executive officers and directors of the registrant as of June 30, 2021 are considered to be affiliates of the registrant. This number is provided only for the purposes of this report on Form 10-K and does not represent an admission by either the registrant or any such person as to the status of such person.
As of January 21, 2022, the registrant had 575,550,072 shares of Common Stock issued and outstanding.
FASTENAL COMPANY
ANNUAL REPORT ON FORM 10-K
TABLE OF CONTENTS
DOCUMENTS INCORPORATED BY REFERENCE
Portions of our Proxy Statement for the annual meeting of shareholders to be held Saturday, April 23, 2022 (Proxy Statement) are incorporated by reference in Part III.
FORWARD-LOOKING STATEMENTS
Certain statements contained in this Form 10-K, or in other reports of the company and other written and oral statements made from time to time by the company, do not relate strictly to historical or current facts. As such, they are considered 'forward-looking statements' that provide current expectations or forecasts of future events. These forward-looking statements are made pursuant to the safe harbor provisions of the Private Securities Litigation Reform Act of 1995. Such statements can be identified by the use of terminology such as anticipate, believe, should, estimate, expect, intend, may, will, plan, goal, project, hope, trend, target, opportunity, and similar words or expressions, or by references to typical outcomes. Any statement that is not a purely historical fact, including estimates, projections, trends, and the outcome of events that have not yet occurred, is a forward-looking statement. Our forward-looking statements generally relate to our expectations regarding the business environment in which we operate, our projections of future performance, our perceived marketplace opportunities, our strategies, goals, mission and vision, and our expectations about capital expenditures, tax rates, inventory levels, in-market locations and signings of Onsite locations and new machine equivalent units for Fastenal Managed Inventory (FMI) (including bin stock and industrial vending), our digital solutions and other product offerings, national accounts as a percentage of overall sales, the advantages of our integrated physical and virtual model, growth in safety products as a percentage of product sales and the amount of FMI revenue that we may be able to service through local inventory fulfillment terminals. You should understand that forward-looking statements involve a variety of risks and uncertainties, known and unknown, and may be affected by inaccurate assumptions. Consequently, no forward-looking statement can be guaranteed and actual results may vary materially. Factors that could cause our actual results to differ from those discussed in the forward-looking statements include, but are not limited to, economic downturns (including economic downturns as a result of global pandemics, including the ongoing COVID-19 pandemic), weakness in the manufacturing or commercial construction industries, competitive pressure on selling prices, changes in trade policies or tariffs, changes in our current mix of products, customers, or geographic locations, changes in our average branch size, changes in our purchasing patterns, changes in customer needs, changes in fuel or commodity prices, product and transportation inflation, inclement weather, changes in foreign currency exchange rates, difficulty in adapting our business model to different foreign business environments, failure to accurately predict the market potential of our business strategies, the introduction or expansion of new business strategies, increased competition in FMI or Onsite, difficulty in maintaining installation quality as our industrial vending business expands, the failure to meet our goals and expectations regarding expansion of our FMI or Onsite operations, changes in the implementation objectives of our business strategies, difficulty in hiring, relocating, training, or retaining qualified personnel, difficulty in controlling operating expenses, difficulty in collecting receivables or accurately predicting future inventory needs, dramatic changes in sales trends, changes in supplier production lead times, changes in our cash position or our need to make capital expenditures, credit market volatility, changes in tax law or the impact of discrete items on future tax rates, changes in the availability or price of commercial real estate, changes in the nature, price, or availability of distribution, supply chain, or other technology (including software licensed from third parties) and services related to that technology, difficulty in obtaining continued business from new safety product customers, cyber-security incidents, potential liability and reputational damage that can arise if our products are defective, and other risks and uncertainties detailed in this Form 10-K under the heading 'Item 1A. Risk Factors'. Each forward-looking statement speaks only as of the date on which such statement is made, and we undertake no obligation to update any such statement to reflect events or circumstances arising after such date.
PRESENTATION OF DOLLAR AMOUNTS
All dollar amounts in this Form 10-K are presented in millions, except for share and per share amounts or where otherwise noted. Throughout this document, percentage and dollar change calculations, which are based on non-rounded dollar values, may not be able to be recalculated using the dollar values in this document due to the rounding of those dollar values.
STOCK SPLIT
All information contained in this Form 10-K reflects the two-for-one stock split in 2019.
PART I
Item 1. BUSINESS
Note – Information in this section is as of year end unless otherwise noted. The year end is December 31, 2021 unless additional years are included or noted.
Overview
Fastenal Company (together with our subsidiaries, hereinafter referred to as 'Fastenal' or the company or by terms such as we, our, or us) began as a partnership in 1967, and was incorporated under the laws of Minnesota in 1968. We opened our first branch in 1967 in Winona, Minnesota, a city with a population today of approximately 26,000. We began with a marketing strategy of supplying threaded fasteners to customers through a branch network in small, medium-sized, and, in subsequent years, large cities. Over time, that mandate has expanded to a broader range of industrial and construction supplies spanning more than nine major product lines. How we engage with our customers has similarly evolved to include Onsites, Fastenal Managed Inventory and eCommerce. We provide additional descriptions of our product lines and market channels later in this document. The large majority of our transactions are business-to-business, though we also have some walk-in retail business. At the end of 2021, we had 3,209 in-market locations (defined in the table below) in 25 countries supported by 15 distribution centers in North America (12 in the United States, two in Canada, and one in Mexico), and one in Europe, and we employed 20,507 people. We believe our success can be attributed to the high quality of our employees and their convenient proximity to our customers, and our ability to offer customers a full range of products and services to reduce their total cost of procurement.
Our Channels to Market
We engage our customers primarily through branch and Onsite locations. Branches and Onsites exist very close to our customers, usually within miles in the case of the former and most often within or immediately proximate to our customers' physical locations in the case of the latter, and together constitute our 'in-market' network. Many of our customers engage with us through eCommerce, but most of our sales through this channel are with customers that use eCommerce to supplement our service through our other channels.
The following table shows our consolidated net sales for each of the last ten fiscal years; the number of branch, Onsite, and total in-market locations at the end of each of the last ten fiscal years; their respective sales, as well as the average monthly sales per location that were generated from our branch and Onsite locations; and our revenue generated from non-traditional sources:
| 2021 | 2020 | 2019 | 2018 | 2017 | 2016 | 2015 | 2014 | 2013 | 2012 | |||||||||||||||||||||||
| Net sales | $ | 6,010.9 | 5,647.3 | 5,333.7 | 4,965.1 | 4,390.5 | 3,962.0 | 3,869.2 | 3,733.5 | 3,326.1 | 3,133.6 | |||||||||||||||||||||
| Branch locations | 1,793 | 2,003 | 2,114 | 2,227 | 2,383 | 2,503 | 2,622 | 2,637 | 2,687 | 2,652 | ||||||||||||||||||||||
| Branch revenue(1) | $ | 3,726.2 | 3,587.1 | 3,660.1 | 3,625.8 | 3,399.6 | 3,198.1 | 3,281.8 | 3,225.3 | |||||||||||||||||||||||
| Average sales per branch location(2) | $ | 163.6 | 145.2 | 140.5 | 131.1 | 116.0 | 104.0 | 104.0 | 101.0 | |||||||||||||||||||||||
| Onsite locations(3) | 1,416 | 1,265 | 1,114 | 894 | 605 | 401 | 264 | 214 | ||||||||||||||||||||||||
| Onsite revenue(1) | $ | 1,898.0 | 1,485.6 | 1,391.7 | 1,081.7 | 770.2 | 569.2 | 454.3 | 387.7 | |||||||||||||||||||||||
| Average sales per Onsite location(2) | $ | 118.0 | 104.1 | 115.5 | 120.3 | 127.6 | 142.7 | 158.4 | 157.6 | |||||||||||||||||||||||
| Other revenue(4) | $ | 386.7 | 574.6 | 281.9 | 257.6 | 220.7 | 194.7 | 133.1 | 120.5 | |||||||||||||||||||||||
| Total in-market locations(5) | 3,209 | 3,268 | 3,228 | 3,121 | 2,988 | 2,904 | 2,886 | 2,851 | 2,687 | 2,652 |
(1) Revenues attributable to our traditional and international branch locations, and our Onsite locations, respectively.
(2) Average sales per month considers the average active base of branches and Onsites, respectively, in the given year, factoring in the beginning and ending location count, divided by total revenues attributable to our branch and Onsite locations, further divided by twelve months, respectively. This information is presented in thousands.
(3) Onsite information prior to 2014 is intentionally omitted. While such locations have existed since 1992, we did not specifically track their number until we identified our Onsite program as a growth driver in 2014.
(4) This portion of revenue is generated outside of our traditional in-market location presence, examples of which include revenues arising from our custom in-house manufacturing, industrial services, leased locker arrangements, and other non-traditional sources of revenue. The significant increase in other revenue in 2020 largely reflects the onset of the COVID-19 pandemic in that period and the substantial sales of pandemic-related products that we direct-shipped (versus selling through our in-market locations) as a means of delivering critical supplies more quickly. The decline in other revenue in 2021 largely reflects the absence of such direct-shipped revenue as the supply chain for such products stabilized.
(5) 'In-market locations' is defined as the sum of the total number of branch locations and the total number of Onsite locations.
This structure has evolved over time as a result of one of Fastenal's guiding principles since inception: that we can improve our service by getting closer to the customer. This has been achieved by opening branch locations and, more recently, Onsite locations. Today we believe there are few companies that offer our North American in-market location coverage. In 2021, roughly 52% of our sales and 50% of our in-market locations were in major Metropolitan Statistical Areas (MSAs) (populations in the United States and Canada greater than 500,000 people), while 21% of our sales and 19% of our in-market locations were in small MSAs (populations under 500,000 people), and 27% of our sales and 31% of our in-market locations were not in an MSA. In our view, this has proven to be an efficient means of providing customers with a broad range of products and services on a timely basis. Maintaining operations that are physically proximate to our customers' operations have represented, and continue to represent, the foundation of our service approach.
We have two primary versions of our branch locations:
1.) A 'traditional branch' typically services a wide variety of customers, including our larger national and regional accounts as well as retail customers. Locations are selected primarily based on their proximity to our distribution network, population statistics, and employment data for manufacturing and non-residential construction companies. We stock all branches with inventory drawn from all of our product lines, and over time, where appropriate, our district and branch personnel may tailor the inventory offering to the needs of the local customer base. Since Fastenal's founding and through 2013, traditional branch openings were a primary growth driver for the company, and we experienc
Showing the first 8K of 74K characters. Open the full section
Item 1A. RISK FACTORS
In addition to the other information in this Form 10-K, the following factors should be considered in evaluating our business. Our operating results depend upon many factors and are subject to various risks and uncertainties. The material risks and uncertainties known to us which may cause our operating results to vary from anticipated results or which may negatively affect our operating results and profitability are as follows:
Company Specific Risks
Operational Risks
Products that we sell may expose us to potential material liability for property damage, environmental damage, personal injury, or death linked to the use of those products by our customers. Some of our customers operate in challenging industries where there is a material risk of catastrophic events. We are actively seeking to expand our sales to certain categories of customers, some of whose businesses may entail heightened levels of such risk. If any of these events are linked to the use by our customers of any of our products, claims could be brought against us by those customers, by governmental authorities, and by third parties who are injured or damaged as a result of such events. In addition, our reputation could be adversely affected by negative publicity surrounding such events regardless of whether or not claims against us are successful. While we maintain insurance coverage to mitigate a portion of this risk and may have recourse against our suppliers for losses arising out of defects in products procured from them, we could experience significant losses as a result of claims made against us to the extent adequate insurance is not in place, the products are manufactured by us or legal recourse against our suppliers is otherwise not available, or our insurers or suppliers are unwilling or unable to satisfy their obligations to us.
Our ability to successfully attract and retain qualified personnel to staff our selling locations could impact labor costs, sales at existing selling locations, and the successful execution of our growth drivers. Our success depends in part on our ability to attract, motivate, and retain a sufficient number of qualified employees, including inside and outside branch associates, Onsite managers, national account sales representatives, and support personnel, who understand and appreciate our culture and are able to adequately represent this culture to our customers. Qualified individuals of the requisite caliber and number needed to fill these positions may be in short supply in some areas, and the turnover rate in the industry is high, particularly for less tenured employees. If we are unable to hire and retain personnel capable of consistently providing a high level of customer service, as demonstrated by their enthusiasm for our culture and product knowledge, our sales could be materially adversely affected. Additionally, competition for qualified employees could require us to pay higher wages to attract a sufficient number of employees. An inability to recruit and retain a sufficient number of qualified individuals in the future may also delay the planned expansion of our various selling channels.
Cyber security incidents, or violations of data privacy laws and regulations, could cause us to experience certain operational interruptions, incur substantial additional costs, become subject to legal or regulatory proceedings, or suffer damage to our reputation in the marketplace. The nature of our business requires us to receive, retain, and transmit certain personally identifying information that our customers provide to purchase products or services, register on our websites, or otherwise communicate and interact with us. While we have taken and continue to undertake significant steps to protect our customer and confidential information, a compromise of our data security systems or those of businesses we interact with could result in information related to our customers or business being obtained by unauthorized persons. We develop and update processes and maintain systems in an effort to try to prevent such unauthorized access, and have established and maintained disclosure controls and procedures that would permit us to make accurate and timely disclosures of any material event, including any cyber security event. The development and maintenance of these processes and systems are costly and require ongoing monitoring and updating as technologies change and efforts to overcome security measures become more sophisticated. Consequently, despite our efforts, the possibility of cyber security incidents cannot be eliminated entirely. There can be no assurance that we will not experience a cyber security incident that may materially impact our consolidated financial statements. While we also seek to obtain assurances that third parties we interact with will protect confidential information, there is a risk the confidentiality of data held or accessed by third parties may be compromised. If a compromise of our data security were to occur, it could interrupt our operations, subject us to additional legal, regulatory, and operating costs, and damage our reputation in the marketplace. In addition, regulatory authorities have increased their focus on how companies collect, process, use, store, share, and transmit personal data. New privacy security laws and regulations, including the European Union General Data Protection Regulation 2016, the California Consumer Protection Act, and other similar state privacy laws, pose increasingly complex compliance challenges, which may increase compliance costs, and any failure to comply with data privacy laws and regulations could result in significant penalties.
Interruptions in the proper functioning of information systems or the inability to maintain or upgrade our information systems, or convert to alternate systems in a timely and efficient manner, could disrupt operations, cause unanticipated increases in costs and/or decreases in revenues, and result in less efficient operations. The proper functioning of our information systems is critical to many aspects of our business and we could be adversely affected if we experience a disruption or data loss relating to our information systems and are unable to recover in a timely manner. Our information systems are protected with robust backup systems and processes, including physical and software safeguards and remote processing capabilities. Still, information systems are vulnerable to natural disasters, power losses, unauthorized access,
telecommunication failures, and other problems. In addition, certain software used by us is licensed from, and certain services related to our information systems are provided by, third parties who could choose to discontinue their products or services or their relationship with us. It is also possible that we are unable to improve, upgrade, maintain, and expand our information systems. Our ability to process orders, maintain proper levels of inventories, collect accounts receivable, pay expenses, and maintain the security of company and customer data, as well as the success of our growth drivers, is dependent in varying degrees on the effective and timely operation and support of our information technology systems. If critical information systems fail or these systems or related software or services are otherwise unavailable, or if we experience extended delays or unexpected expenses in securing, developing, and otherwise implementing technology solutions to support our growth and operations, it could adversely affect our profitability and/or ability to grow.
The ability to adequately protect our intellectual property or successfully defend against infringement claims by others may have an adverse impact on operations. Our business relies on the use, validity and continued protection of certain proprietary information and intellectual property, which includes current and future patents, trade secrets, trademarks, service marks, copyrights, and confidentiality agreements as well as license and sublicense agreements to use intellectual property owned by affiliated entities or third parties. Unauthorized use of our intellectual property by others could result in harm to various aspects of the business and may result in costly and protracted litigation in order to protect our rights. In addition, we may be subject to claims that we have infringed on the intellectual property rights of others, which could subject us to liability, require us to obtain licenses to use those rights at significant cost or otherwise cause us to modify our operations.
Changes in customer or product mix, downward pressure on sales prices, and changes in volume or timing of orders have caused and could cause our gross profit percentage to fluctuate or decline in the future. Changes in our customer or product mix have caused our gross profit percentage to decline and could cause our gross profit percentage to further fluctuate or decline. For example, the portion of our sales attributable to fasteners has been decreasing for approximately twenty-five years. That has adversely affected our gross profit percentage as our non-fastener products generally carry lower gross profit margins than our fastener products. Similarly, in recent years, revenues from national accounts and/or Onsite customers, which typically have lower gross profit margins by virtue of their scale, available business, and broader offering of products which typically have lower gross margins, have tended to grow faster than revenues from smaller customers. However, whether and to what extent this adverse mix impact will result in a decline of our gross profit percentage in any given year will depend on the extent to which they are, or are not, offset by positive impacts to gross profit margin during such year. For instance, in 2020, our gross profit margin declined significantly as the pandemic generated significant sales of certain products, such as PPE and sanitizer, that have traditionally lower gross profit margins. Conversely, as business conditions normalized in 2021, sales of these products declined versus the prior year, which more than offset our traditional mix-related margin pressure and resulted in improvement of our gross profit margin. Setting aside these or other unusual circumstances, however, customer and product mix have contributed to the decline in our gross profit percentage over time and will likely continue to affect our gross profit percentage into the foreseeable future. Other variables that could cause our gross margin to decline include downward pressure on sales prices, changes in the volume or timing of our orders, and/or an inability to pass higher product costs on to customers. We can experience downward pressure on sales prices as a result of deflation, pressure from customers to reduce costs, or increased competition. Reductions in our volume of purchases can adversely impact gross profit by reducing supplier volume allowances. We may not be able to pass rising product costs to customers if those customers have ready product or supplier alternatives in the marketplace.
Our operating and administrative expenses could grow more rapidly than net sales which could result in failure to achieve our goals related to leveraging revenue growth into higher net earnings. Over time, we have generally experienced an increase in our operating and administrative expenses, including costs related to payroll, occupancy, freight, and information technology, among others, as our net sales have grown. However, historically, a portion of these expenses has not increased at the same rates as net sales, allowing us to leverage our growth and sustain or expand our operating profit margins. There are various scenarios where we may not be able to continue to achieve this leverage as we have been able to do in the past. For instance, it is typical that when demand declines, most commonly from cyclical or general market factors (though it could be due to customer losses or some other company-specific event), our operating and administrative expenses do not fall as quickly as net sales. It is also possible that in the future we will elect to make investments in operating and administrative expenses that would result in costs growing faster than net sales. In addition, market variables, such as labor rates, energy costs, and legal costs, could move in such a way as to cause us to not be able to manage our operating and administrative expenses in a way that would enable us to leverage our revenue growth into higher net earnings. Should any of these scenarios, or a combination of them, occur in the future, it is possible that our operating and pre-tax profit margins could decline even if we are able to grow revenue.
Failure to implement an effective Environmental, Social, and Governance (ESG) strategy could result in financial losses or a tarnished corporate reputation. Customers, suppliers, employees, community partners, shareholders, and regulatory agencies are increasingly requesting disclosure and action relating to ESG performance and objectives. For instance, over the last five years we have included shareholder proposals in our proxy statement seeking specific actions around social and governance policy and reporting. We have also seen an increase in customer requests for information pertaining to diversity and environmental policy, including that our scores with various third-party ESG rating organizations achieve a certain threshold.
An inability to satisfactorily address the concerns of our stakeholders could adversely affect our corporate reputation, image, identity, brand equity, and status, which in turn could hurt our ability to retain and acquire customers and employees or negatively impact the price performance of our common stock. Increasing reporting and operational regulations around ESG matters may result in higher operating expenses and/or capital expenditures that could reduce our profitability and/or cash flow.
Failure to maintain an effective system of internal controls over business processes and/or financial reporting could materially impact our business and results. Company management is responsible for establishing and maintaining effective internal controls designed to provide reasonable assurance regarding the achievement of objectives relating to operations, reporting, and compliance. Any internal control system, no matter how well designed and operated, can only provide reasonable, not absolute, assurance that the objectives of the control system are met. Further, the design of a control system must reflect the fact that there are resource constraints, and the benefits of controls must be considered relative to their costs. Because of the inherent limitations in all internal control systems, internal control over business processes and financial reporting may not prevent or detect fraud or misstatements. Any failure to maintain an effective system of internal control over business processes and financial reporting could limit our ability to report our financial results accurately and timely or to detect and prevent fraud, and could expose us to litigation, economic loss or adversely affect the market price of our common stock.
We may be unable to meet our goals regarding the growth drivers of our business. Our sales growth is dependent primarily on our ability to attract new customers and increase our activity with existing customers within North America and abroad. In recent years, we have increased the resources devoted to our growth drivers, including FMI, Onsites, national accounts, digital solutions, and our international operations. While we have taken steps to build momentum in the growth drivers of our business, we cannot assure you those steps will lead to sales growth. Failure to achieve any of our goals regarding FMI, Onsites, national accounts, digital solutions, and international operations, or other growth drivers could negatively impact our long-term sales growth. In fact, the COVID-19 pandemic has made gaining access to customers more challenging due to both alternative work arrangements to manage risk of infection in workplaces and due to shifts in priorities to short-term crisis management and away from long-term strategic planning. This has resulted in our signings of Onsites and FMI installations, both important indicators of future sales growth, to be below target levels in 2020 and 2021. Further, failure to identify appropriate targets for our Onsite channel and FMI tools or failure to persuade the appropriate targets to adopt these offerings once identified may adversely impact our goals regarding the number of new Onsite locations we are able to open or the number of FMI installations we are able to deploy.
Our competitive advantage in FMI Solutions, which includes industrial vending (FASTVend) and bin stock (FASTStock and FASTBin) tools could be eliminated and, in the case of FASTVend, the loss of key suppliers of equipment and services could be impactful and result in failure to deploy devices. We believe we have a competitive advantage in industrial vending and bin stock due to our hardware and software, our local branch presence (allowing us to service devices and bins more rapidly and with less burden on our customers), our depth of products that lend themselves to being dispensed through industrial vending devices or bin stocks, and, in North America, our distribution strength. These advantages have developed over time; however, other competitors could respond to our expanding industrial vending and bin stock position with highly competitive platforms of their own. Such competition could negatively impact our ability to expand our industrial vending and bin stock tools or negatively impact the economics of that business. In addition, we currently rely on a limited number of suppliers for the vending devices used in our FASTVend platform. While these devices, software, and services can be obtained from other sources, loss of our current suppliers could be disruptive and could result in us failing to meet our goals related to the number of devices we are able to deploy in the next twelve to eighteen months. In addition, as we experienced in 2020 and 2021, our ability to deploy our FMI solutions at targeted levels could be limited by events similar to the COVID-19 pandemic if customers shift their energy to addressing short-term disruptions instead of long-term strategic planning.
The ability to identify new products and product lines, and integrate them into our selling locations and distribution network, may impact our ability to compete, our ability to generate additional sales, and our profit margins. Our success depends in part on our ability to develop product expertise at the selling location level and identify future products and product lines that complement existing products and product lines and that respond to our customers' needs. We may not be able to compete effectively unless our product selection keeps up with trends in the markets in which we compete or trends in new products. In addition, our ability to integrate new products and product lines into our branches and distribution network could impact sales and profit margins.
We may not be able to compete effectively against traditional or non-traditional competitors, which could cause us to lose market share or erode our gross and/or operating income profit and/or percentage. The industrial, construction, and maintenance supply industry, although slowly consolidating, still remains a large, fragmented, and highly competitive industry. Our current or future competitors may include companies with similar or greater market presence, name recognition, and financial, marketing, technological, and other resources, and we believe they will continue to challenge us with their product selection, financial resources, technological advancements, and services. Increased competition from brick-and-mortar retailers could cause us to lose market share, reduce our prices, or increase our spending. Similarly, the emergence of on-line retailers, whether as extensions of our traditional competition or in the form of major, non-traditional competitors, could result in easier
and quicker price discovery and the adoption of aggressive pricing strategies and sales methods. These pressures could have the effect of eroding our gross and/or operating income profit and/or percentage over time.
Our inability to attract or transition key executive officers may divert the attention of other members of our senior leadership and adversely impact our existing operations. Our success depends on the efforts and abilities of our key executive officers and senior leadership. In the event of voluntary or involuntary vacancies in our executive team in the future, the extent to which there is disruption in the oversight and/or leadership of our business will depend on our ability to either transition internal, talented individuals or recruit suitable replacements to serve in these roles. In addition, difficulties in smoothly implementing any transition to new members of our executive team, or recruiting suitable replacements, could divert the attention of other members of our senior leadership team from our existing operations.
We may not be successful in integrating acquisitions and achieving intended benefits and synergies. We have completed several acquisitions of businesses in recent years. We expect to continue to pursue strategic acquisitions that we believe will either expand or complement our business in new or existing markets or further enhance the value and offerings we are able to provide to our existing or future potential customers. Acquisitions involve numerous risks and challenges, including, among others, a risk of potential loss of key employees of an acquired business, inability to achieve identified operating and financial synergies anticipated to result from an acquisition, diversion of our capital and our management's attention from other business issues, and risks related to the integration of the acquired business including unanticipated changes in our business, our industry, or general economic conditions that affect the assumptions underlying the acquisition. Any one or more of these factors could cause us to not realize the benefits anticipated to result from the acquisitions.
Equity Risks
There can be no assurance that our stock price will continue to reflect the current multiple of earnings over time. Stock prices, including ours, are commonly thought to be a function of earnings compounded by a multiple. This is often referred to as a price-to-earnings (or P/E) ratio. Historically, investors have given our earnings a higher multiple, or premium, than is typical of the broader industrial sector of which we are typically associated. We believe we have earned this premium by virtue of a long history of superior growth, profitability, and returns. However, to the extent that we fail to successfully execute our growth strategies and/or poorly navigate the risks that surround our business, including those described throughout this section, or to the extent our industry (industrial distribution, or industrial stocks in general) loses favor in the marketplace, there can be no assurance that investors will continue to afford a premium multiple to our earnings which could adversely affect our stock price.
We cannot provide any guaranty of future dividend payments or that we will continue to purchase shares of our common stock pursuant to our share purchase program. Although our board of directors has historically authorized the payment of quarterly cash dividends on our common stock and indicated an intention to do so in the future, there are no assurances that we will continue to pay dividends in the future or continue to increase dividends at historic rates. In addition, although our board of directors has authorized share purchase programs and we purchased shares in 2020, 2018, and prior years through these programs, we may discontinue doing so at any time. Any decision to continue to pay quarterly dividends on our common stock, to increase those dividends, or to purchase our common stock in the future will be based upon our financial condition and results of operations, the price of our common stock, credit conditions, and such other factors as are deemed relevant by our board of directors.
General Economic and Operating Risks
Operational Risks
A downturn in the economy or in the principal markets served by us and other factors may affect customer spending, which could harm our operating results. In general, our sales represent spending on discretionary items or consumption needs by our customers. This spending is affected by many factors, including, among others:
-
general business conditions,
-
business conditions in our principal markets,
-
interest rates,
-
inflation,
-
liquidity in credit markets,
-
taxation,
-
government regulations and actions,
-
energy and fuel prices and electrical power rates,
-
unemployment trends,
-
terrorist attacks and acts of war,
-
impact of higher sustained global temperatures (global warming)
-
acts of God, which may include, but are not limited to, weather events, earthquakes, pandemics, etc., and
-
other matters that influence customer confidence and spending.
A downturn in either the national or local economy where we operate, or in the principal markets served by us, or changes in any of the other factors described above, could negatively impact sales at our in-market locations, sales through our other selling channels, and the level of profitability of those in-market locations and other selling channels.
This risk was demonstrated in 2021. As economic confidence and general business conditions recovered from the COVID-related downturn in 2020, spending for industrial supplies to companies engaged in construction and the manufacture of components, capital goods, and heavy equipment expanded sharply. This produced a resumption of growth in key cyclical product lines, such as fasteners, that had declined the preceding year (only partly offset by reduced sales of COVID-related supplies to government, healthcare, and warehousing customers). At the same time, we believe our growth was restrained by other economic factors. These include: (1) difficulty adding labor resources, potentially due to low unemployment, concerns about the pandemic, and government stimulus support; (2) supply chain disruption due to constraints for certain raw material and component availability, production capacity, shipping capacity, and labor availability; and (3) the impact of inflation for raw materials, manufactured components, transportation services, and labor. These trends were evident throughout 2021.
Products manufactured in foreign countries may cease to be available, which could adversely affect our inventory levels and opera****ting results. We obtain certain of our products, and our suppliers obtain certain of their products, from China, Taiwan, South Korea, and other foreign countries. Our suppliers could discontinue selling products manufactured in foreign countries at any time for reasons that may or may not be in our control or our suppliers' control, including foreign government regulations, domestic government regulations, disruption in trade relationships and agreements, political unrest, war, disease, or changes in local economic conditions. Additionally, the shipment of goods from foreign countries could be delayed by container shipping companies encountering financial, capacity, or other difficulties. We experienced this in 2021 as a lack of shipping and labor capacity, caused primarily by the strong recovery in global product demand but exacerbated by continued pandemic-related workforce disruption, constrained our ability to efficiently import supplies and increased shipping costs significantly. Our operating results and inventory levels could suffer if we are unable to promptly replace a supplier or shipper who is unwilling or unable to satisfy our requirements with another supplier or shipper providing products and services of comparable quality and utility.
Trade policies could make sourcing product from overseas more difficult and/or more costly, and could adversely impact our gross and/or operating profit percentage. We source a significant amount of the products we sell from outside of North America, primarily Asia. We have made significant structural investments over time to be able to source both directly from Asia through our wholly-owned, Asia-based subsidiary, FASTCO Trading Co., Ltd. and indirectly from suppliers that procure product from international sources. This was initially necessary due to the absence of significant domestic fastener production, but over time we have expanded our non-fastener sourcing as well, and at this time it may be difficult to adjust our sourcing in the short term. In light of this, changes in trade policies could affect our sourcing operations, our ability to secure sufficient product to serve our customers and/or impact the cost or price of our products, with potentially adverse impacts on our gross and operating profit percentages and financial results. China represents a significant source of product for North America. In addition, we move and source products within North America. Any trading disruption (tariffs, product restrictions, etc.) between Canada, the United States, and Mexico, or disruption in their respective trading relationships with other nations can adversely impact our business. There can be no assurances that these disruptions will not continue or increase in the future, with the previously mentioned countries or additional countries with which we do business. The degree to which these changes in the global marketplace affect our financial results will be influenced by the specific details of the changes in trade policies, their timing and duration, and our effectiveness in deploying tools to address these issues.
Changes in energy costs and the cost of raw materials used in our products could impact our net sales, cost of sales, gross profit percentage, distribution expenses, and occupancy expenses, which may result in lower operating income. Costs of raw materials used in our products (e.g., steel, plastic) and energy costs can fluctuate significantly over time. Increases in these costs result in increased production costs for our suppliers. These suppliers typically look to pass their increased costs along to us through price increases. The fuel costs of our distribution and branch operations have fluctuated as well. This was a meaningful issue in 2021, when costs for metals, particularly steel, fuels, and overseas shipping services increased sharply to reflect strong demand, and labor constraints. While we typically try to pass higher supplier prices and fuel costs through to our customers or to modify our activities to mitigate the impact, including in 2021, we may not be successful, particularly if supplier prices or fuel costs rise rapidly. Failure to fully pass any such increased prices and costs through to our customers or to modify our activities to mitigate the impact would have an adverse effect on our operating income. While increases in the cost of fuel or raw materials could be damaging to us, decreases in those costs, particularly if severe, could also adversely impact us by creating deflation in selling prices, which could cause our gross profit to decline, or by negatively impacting customers in certain industries, which could cause our sales to those customers to decline.
Our current estimates of total market potential as well as the market potential of our business strategies could be incorrect. We believe we have a significant opportunity for growth based on our belief that North American market demand for the products we sell is estimated to exceed $140 billion. This figure is not derived from an independent organization or data source that aggregates and publishes widely agreed-upon demand and market share statistics. Instead, we have identified this figure based on our own experience in the marketplace for our products and by evaluating estimates from other sources. If we have
overestimated the size of our market, and in doing so, underestimated our current share of it, the size of our opportunity for growth may not be as significant as we currently believe. Similarly, we have provided estimates of the opportunities we have with some of our specific growth strategies, such as FMI solutions and Onsite locations. Within North America, we believe the potential market opportunity for industrial vending is approximately 1.7 million devices and we have identified over 15,000 customer locations with the potential to implement our Onsite service model within our traditional manufacturing and construction customer base. We have identified additional markets, such as government, healthcare, and academia, and geographies into which we can sell our FMI solutions, which would increase the number of identified potential FMI solutions or customer locations. However, our presence in emerging markets and geographies is not as established as is the case in our traditional markets and geographies, which could extend the sales cycle. Similar to the case for total market size, we use our own experience and data to arrive at the size of these potential opportunities and not independent sources. These estimates are based on our business model today, and the introduction or expansion of other business strategies, such as on-line retailing, could cause them to change. In addition, the market potential of a particular business strategy may vary from expectations due to a change in the marketplace (such as changes in customer concentration or needs), a change in the nature of that business strategy, or weaker than anticipated acceptance by customers of that business strategy. We cannot guarantee that our market potential estimates are accurate or that we will ultimately decide to expand our industrial vending or Onsite service models as we anticipate to reach the full market opportunity.
The ongoing occurrence of the COVID-19 pandemic, or any other such widespread public health crisis, could have a material adverse effect on our business, results of operations, and financial condition. The onset of the COVID-19 pandemic in early 2020 impacted our business due to government authorities and customers imposing facility closures, work-from-home orders, social distancing protocols, and/or other restrictions. These actions had both positive (strong sales of safety and sanitation supplies to government, healthcare and warehousing customers) and negative (weak sales to industrial and construction customers as well as disruption in signings of Onsites and FMI devices) effects. In 2021, though the pandemic continued to impact United States and world populations in the form of high infection and hospitalization rates, including from new variants of COVID-19, this effect on our business and financial condition was secondary to the re-opening and recovery of the global economy. Even so, the continued public health concerns resulting from the COVID-19 pandemic continue to create significant uncertainty, economic disruption, and volatility, all of which have impacted and may continue to impact our business. We may be required to take significant actions to mitigate future outbreaks, including, but not limited to, facility closures and work-from-home policies, and/or customer activity may be affected by their own mitigation actions. This could adversely affect our business, results of operations, and financial condition. However, as we cannot predict the severity and duration of the pandemic, including additional outbreaks, new variants of the virus, and the future availability of effective medical treatments and vaccines, the net financial impact to our operating results cannot be reasonably estimated.
Inclement weather and other disruptions to the transportation network could adversely impact our distribution system and demand for our products. Our ability to provide efficient distribution of core business products to our branch network is an integral component of our overall business strategy. Disruptions at distribution centers or shipping ports may affect our ability to both maintain core products in inventory and deliver products to our customers on a timely basis, which may in turn adversely affect our results of operations. In addition, severe weather conditions could adversely affect demand for our products in particularly hard hit regions.
The industrial, construction, and maintenance supply industry is consolidating, which could cause it to become more competitive and could negatively impact our market share, gross profit, and operating income. The industrial, construction, and maintenance supply industry in North America is consolidating. This consolidation is being driven by customer needs and supplier capabilities, which could cause the industry to become more competitive as greater economies of scale are achieved by suppliers, or as competitors with new business models are willing and able to operate with lower gross profit on select products. Customers are increasingly aware of the total costs of fulfillment and of the need to have consistent sources of supply at multiple locations. We believe these customer needs could result in fewer suppliers as the remaining suppliers become larger and capable of being a consistent source of supply.
There can be no assurance we will be able in the future to take effective advantage of the trend toward consolidation. The trend in our industry toward consolidation could make it more difficult for us to maintain our current gross profit and operating income. Furthermore, as our industrial customers face increased foreign competition, and potentially lose business to foreign competitors or shift their operations overseas in an effort to reduce expenses, we may face increased difficulty in growing and maintaining our market share.
We are exposed to foreign currency exchange rate risk, and changes in foreign exchange rates could increase the cost of purchasing products and impact our foreign sales. Given that we were founded and remain based in the United States and that we are publicly-traded in the United States, we report our results based on the United States dollar. Because the functional currency related to most of our non-United States operations is the applicable local currency, we are exposed to foreign currency exchange rate risk arising from transactions in the normal course of business. Fluctuations in the relative strength of foreign economies and their related currencies could adversely impact our ability to procure products at competitive prices and our foreign sales. Historically, our primary exchange rate exposure has been with the Canadian dollar. There can be no
assurance that currency exchange rate fluctuations with the Canadian dollar and other foreign currencies will not adversely affect our results of operations, financial condition, and cash flows. While the use of currency hedging instruments may provide us with protection from adverse fluctuations in currency exchange rates, we are not currently using these instruments and we have not historically hedged this exposure. If we decide to do so in the future, we could potentially forego the benefits that might result from favorable fluctuations in currency exchange rates.
Legal, Regulatory, and Compliance Risks
Our business is subject to a wide array of operating laws and regulations in every jurisdiction where we operate. Compliance with these laws and regulations increases the cost of doing business and failure to comply could result in the imposition of fines or penalties and the termination of contracts. We are subject to a variety of laws and regulations including without limitation; import and export requirements, anti-bribery and corruption laws, product compliance laws, environmental laws, foreign exchange controls and cash repatriation restrictions, advertising regulations, data privacy (including in the U.S., the California Consumer Privacy Act, and in the European Union, the General Data Protection Regulation 2016, with interpretations varying from state to state and country to country) and cyber security requirements (including protection of information and incident responses), regulations on suppliers regarding the sources of supplies or products, labor and employment laws, and anti-competition regulations. In addition, as a supplier to federal, state, and local government agencies, we must comply with certain laws and regulations relating specifically to the formation, administration, and performance of our governmental contracts. We are also subject to governmental audits and inquiries in the normal course of business. Ongoing audit activity and changes to the legal and regulatory environments could increase the cost of doing business, and such costs may increase in the future as a result of changes in these laws and regulations or in their interpretation. While we have implemented policies and procedures designed to facilitate compliance with these laws and regulations, there can be no assurance that our employees, contractors, or agents will not violate such laws and regulations, or our policies. Any such violations could result in the imposition of fines and penalties, damage to our reputation, and, in the case of laws and regulations relating specifically to governmental contracts, the loss of those contracts.
Tax laws and regulations require compliance efforts that can increase our cost of doing business and changes to these laws and regulations could impact financial results. We are subject to a variety of tax laws and regulations in the jurisdictions in which we operate. Maintaining compliance with these laws can increase our cost of doing business and failure to comply could result in audits or the imposition of fines or penalties. Further, our future effective tax rates in any of these jurisdictions could be affected, positively or negatively, by changing tax priorities, changes in statutory rates, and/or changes in tax laws or the interpretation thereof. The most significant recent example of this is the comprehensive tax legislation commonly referred to as the Tax Cuts and Jobs Act (the Tax Act), which was enacted in the United States in December 2017. However, in September 2021, the Ways and Means Committee of the United States House of Representatives published tax proposals that, if ultimately enacted as proposed, could result in higher tax payments as a result of higher corporate tax rates and higher taxes on earnings from foreign jurisdictions.
Changes in accounting standards and subjective assumptions, estimates, and judgements by management related to complex accounting matters could significantly affect our financial results or financial condition. U.S. generally accepted accounting principles (GAAP) and related accounting pronouncements, implementation guidelines and interpretations with regard to a wide range of matters that are relevant to our business, such as asset impairment, inventories, lease obligations, self-insurance, vendor allowances, tax matters, business combinations, and legal matters, are complex and involve many subjective assumptions, estimates, and judgments. Changes in accounting standards or their interpretation or changes in underlying assumptions, estimates or judgments, could significantly change our reported or expected financial performance or financial condition. The implementation of new accounting standards could also require certain systems, internal process, internal control, and other changes that could increase our operating costs.
Credit and Liquidity Risks
Tight credit markets could impact our ability to obtain financing on reasonable terms or increase the cost of existing or future financing and interest rate fluctuations could adversely impact our results. As of December 31, 2021, we had $390.0 of outstanding debt obligations, of which $365.0 is senior unsecured promissory notes issued under our master note agreement (the Master Note Agreement), while $25.0 is loans outstanding under our revolving credit facility (the Credit Facility). Loans under the Credit Facility bear interest at a rate per annum based on the London Interbank Offered Rate (LIBOR) and mature on November 30, 2023. The notes issued under our Master Note Agreement consist of seven series and are described in further detail in Note 9 of the Notes to Consolidated Financial Statements included later in this Form 10-K.
During periods of volatility and disruption in the United States credit markets, financing may become more costly and more difficult to obtain. This was a factor most recently in 2020. The turmoil that came with the onset of the COVID-19 pandemic did not have a significant adverse impact on our liquidity or borrowing costs given our low level of indebtedness at that time. However, the availability of funds tightened and credit spreads on corporate debt increased. We currently have the capacity under our Credit Facility and Master Note Agreement to increase borrowings in the future. If credit market volatility were to return, the cost of servicing any existing balances on our Credit Facility at that time could increase due to the LIBOR-based interest rate provided for under our Credit Facility. On March 5, 2021, the U.K. Financial Conduct Authority announced that
immediately after December 31, 2021, publication of certain LIBOR settings would permanently cease, with most other LIBOR settings, including 1 month, 3 month, and 6 month LIBOR settings ceasing on June 30, 2023. Our Credit Facility currently uses LIBOR as a reference rate, and, while there are customary LIBOR replacement provisions in our Credit Facility, the transition to alternatives to LIBOR could be modestly disruptive to the credit markets. We are currently evaluating the impact of the new guidance on our consolidated financial statements. In addition, borrowing additional amounts to finance stock purchases, dividends, capital expenditures, and other liquidity needs or to refinance our existing indebtedness could be difficult and the cost of doing so could be high.
Item 1B. UNRESOLVED STAFF COMMENTS
None.
Item 2. PROPERTIES
Note – Information in this section is as of December 31, 2021, unless otherwise noted.
We own, and in some cases, lease, the following facilities, excluding selling locations:
| Location | Purpose | Leased | Tote Locations (ASRS) (1) | Approximate Square Feet | |||||||||||||
| Winona, Minnesota | Distribution center and home office | 246,000 | 331,000 | ||||||||||||||
| Indianapolis, Indiana | Distribution center | 547,000 | (2) | 1,078,000 | |||||||||||||
| Akron, Ohio | Distribution center | 103,000 | 188,000 | ||||||||||||||
| Scranton, Pennsylvania | Distribution center (3) | 104,000 | 222,000 | ||||||||||||||
| Denton, Texas | Distribution center (4) | 41,000 | (5) | 206,000 | |||||||||||||
| Atlanta, Georgia | Distribution center | 77,000 | 252,000 | ||||||||||||||
| Seattle, Washington | Distribution center | 140,000 | 238,000 | ||||||||||||||
| Modesto, California | Distribution center and manufacturing facility | 69,000 | 328,000 | ||||||||||||||
| Salt Lake City, Utah | Distribution center and packaging facility (three buildings) | X | — | 153,000 | |||||||||||||
| High Point, North Carolina | Distribution center (two buildings) (6) | 132,000 | 829,000 | ||||||||||||||
| Kansas City, Kansas | Distribution center | 170,000 | 462,000 | ||||||||||||||
| Jackson, Mississippi | Distribution center | — | 271,000 | ||||||||||||||
| Kitchener, Ontario, Canada | Distribution center | 128,000 | 242,000 | ||||||||||||||
| Edmonton, Alberta, Canada | Distribution center | X | — | 38,000 | |||||||||||||
| Apodaca, Nuevo Leon, Mexico | Distribution center | X | — | 46,000 | |||||||||||||
| Dordrecht, Netherlands | Distribution center | X | — | 44,000 | |||||||||||||
| Shanghai, China | Local re-distribution center | X | — | 17,000 |
(1) Total number of tote locations for small parts storage included in facilities with an ASRS.
(2) This property contains an ASRS with capacity of 52,000 pallet locations, in addition to the 547,000 tote locations for small parts.
(3) Approximately 36,000 square feet is leased space for distribution related activities.
(4) Approximately 30,000 square feet is leased space for distribution related activities.
(5) This facility contains an ASRS with capacity of 14,000 pallet locations, in addition to the 41,000 tote locations for small parts.
(6) In late December 2018, we purchased an additional distribution center in High Point, North Carolina with approximately 750,000 total square feet. Approximately 395,000 square feet will be leased by the building's previous owner until December 2022. We currently utilize approximately 355,000 square feet for distribution activities.
We also own, and in some cases, lease, the following support facilities, excluding selling locations:
| Location | Purpose | Leased | Approximate Square Feet | ||||||||
| Winona, Minnesota | Manufacturing facility | 100,000 | |||||||||
| Indianapolis, Indiana | Manufacturing facility | 198,000 | |||||||||
| Houston, Texas | Manufacturing facility | 122,000 | |||||||||
| Wallingford, Connecticut | Manufacturing facility | 187,000 | |||||||||
| Rockford, Illinois | Manufacturing facility | 101,000 | |||||||||
| Johor, Malaysia | Manufacturing facility | 30,000 | |||||||||
| Modrice, Czech Republic | Manufacturing facility | X | 18,000 | ||||||||
| Leeds, United Kingdom | Manufacturing facility | X | 28,000 | ||||||||
| Winona, Minnesota | Multiple facilities for office space, storage, and packaging operations | 262,000 | |||||||||
| Bangalore, India | International information technology office | X | 15,000 |
In addition, we own 165 buildings that house our in-market locations in various cities throughout North America.
All other buildings we occupy are leased. Leased branches range from approximately 3,000 to 20,000 square feet, with lease terms of up to 120 months (most initial lease terms are for 36 to 60 months).
We currently own land for future distribution center expansion and development. If economic conditions are suitable in the future, we will consider purchasing branch locations to house our older branches. It is anticipated the majority of new branch locations will continue to be leased. It is our policy to negotiate relatively short lease terms to facilitate relocation of particular branch operations, when desirable. Our experience has been that there is sufficient space suitable for our needs and available for leasing.
Item 3. LEGAL PROCEEDINGS
Item 4. MINE SAFETY DISCLOSURES
Not applicable.
PART II
Item 5. MARKET FOR REGISTRANT'S COMMON EQUITY, RELATED STOCKHOLDER MATTERS, AND ISSUER PURCHASES OF EQUITY SECURITIES
Common Stock Data
Dollar amounts in this section are stated in whole numbers.
Our shares are traded on The Nasdaq Stock Market under the symbol 'FAST'. As of January 21, 2022, there were approximately 1,000 record holders of our common stock, which includes nominees or broker dealers holding stock on behalf of an estimated 411,000 beneficial owners.
Issuer Purchases of Equity Securities
The table below sets forth information regarding purchases of our common stock during each of the last three months of 2021:
| (a) | (b) | (c) | (d) | |||||||||||||||||||||||
| Period | Total Number of Shares Purchased | Average Price Paid per Share | Total Number of Shares Purchased as Part of Publicly Announced Plans or Programs (1) | Maximum Number (or Approximate Dollar Value) of Shares that May Yet Be Purchased Under the Plans or Programs (1) | ||||||||||||||||||||||
| October 1-31, 2021 | 0 | — | 0 | 3,200,000 | ||||||||||||||||||||||
| November 1-30, 2021 | 0 | — | 0 | 3,200,000 | ||||||||||||||||||||||
| December 1-31, 2021 | 0 | — | 0 | 3,200,000 | ||||||||||||||||||||||
| Total | 0 | — | 0 | 3,200,000 |
(1) On July 11, 2017, our board of directors established a new authorization for us to repurchase up to 10,000,000 shares of our common stock. The repurchase program has no expiration date. As of December 31, 2021, we had remaining authority to repurchase 3,200,000 shares under this authorization.
Purchases of shares of our common stock, if applicable, are described later in this Form 10-K under the heading 'Item 7. Management's Discussion and Analysis of Financial Condition and Results of Operations'.
Fastenal Company Common Stock Comparative Performance Graph
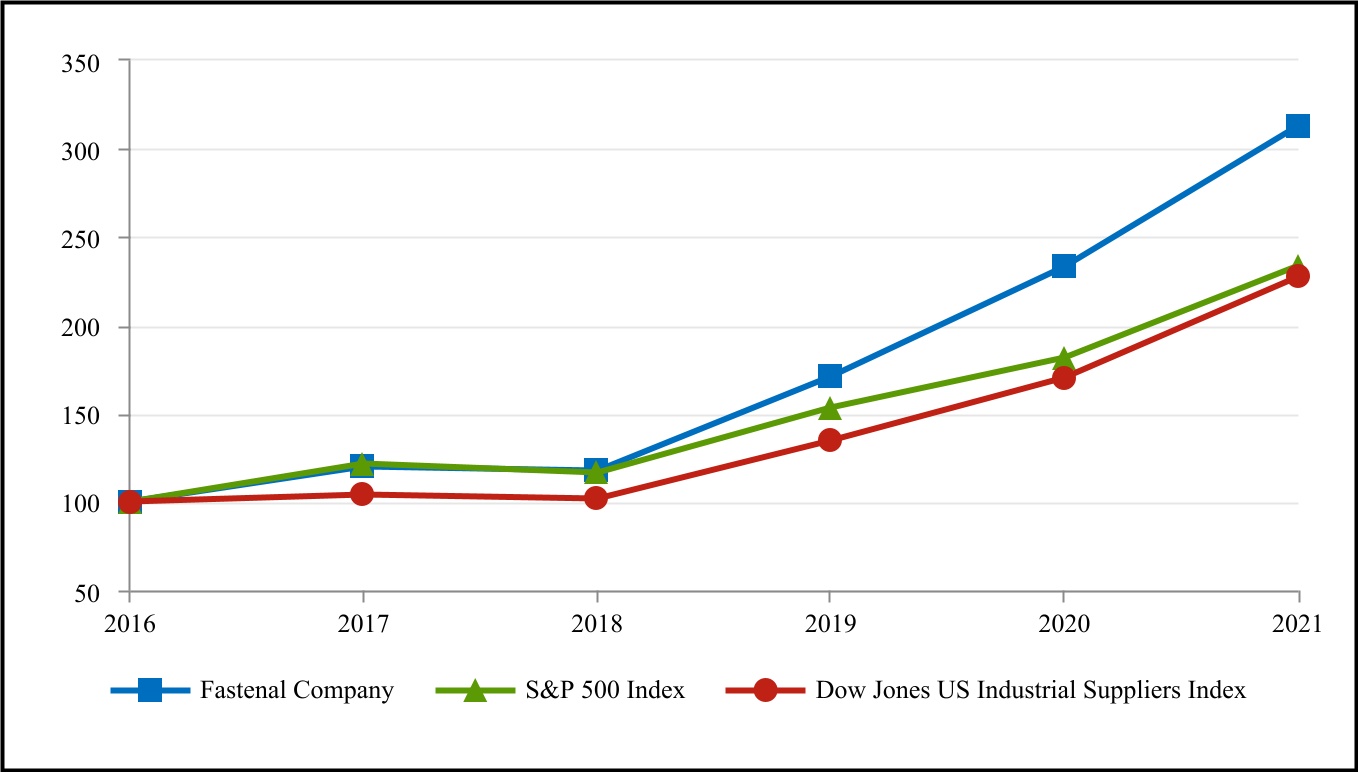
Set forth below is a graph comparing, for the five years ended December 31, 2021, the yearly cumulative total shareholder return on our common stock with the yearly cumulative total shareholder return of the S&P 500 Index and the Dow Jones US Industrial Suppliers Index.
The comparison of total shareholder returns in the performance graph assumes that $100 was invested on December 31, 2016 in Fastenal Company, the S&P 500 Index, and the Dow Jones US Industrial Suppliers Index, and that dividends were reinvested when and as paid.
Comparison of Five-Year Cumulative Total Return Among Fastenal Company, the S&P 500 Index, and the Dow Jones US Industrial Suppliers Index
| 2016 | 2017 | 2018 | 2019 | 2020 | 2021 | |||||||||||||||||||||||||||||||||
| Fastenal Company | $ | 100.00 | 119.67 | 117.79 | 170.84 | 233.32 | 312.73 | |||||||||||||||||||||||||||||||
| S&P 500 Index | 100.00 | 121.83 | 116.49 | 153.17 | 181.35 | 233.41 | ||||||||||||||||||||||||||||||||
| Dow Jones US Industrial Suppliers Index | 100.00 | 104.26 | 101.75 | 134.53 | 170.10 | 227.27 |
Note - The graph and index table above were obtained from Zacks SEC Compliance Services Group.
Item 6. REMOVED AND RESERVED
Item 7. MANAGEMENT'S DISCUSSION AND ANALYSIS OF FINANCIAL CONDITION AND RESULTS OF OPERATIONS
The following is management's discussion and analysis of certain significant factors which have affected our financial position and operating results during the periods included in the accompanying consolidated financial statements and should be read in conjunction with those consolidated financial statements. This section of this 10-K generally discusses 2021 and 2020 items and year-to-year comparisons between 2021 and 2020. Discussions of 2019 items and year-to-date comparisons between 2020 and 2019 that are not included in this Form 10-K, can be found in 'Management's Discussion and Analysis of Financial Condition and Results of Operations' in Part II, Item 7 of our annual report on Form 10-K for the fiscal year ended December 31, 2020. Italicized discussions throughout Item 7 of this Form 10-K indicate discussions of financial condition and results of operations in 2020.
Business and Operational Overview
Fastenal is a North American leader in the wholesale distribution of industrial and construction supplies. We distribute these supplies through a network of over 3,200 in-market locations. Most of our customers are in the manufacturing and non-residential construction markets. The manufacturing market includes sales of products for both original equipment manufacturing (OEM), where our products are consumed in the final products of our customers, and manufacturing, repair and operations (MRO), where are products are consumed to support the facilities and ongoing operations of our customers. The non-residential construction market includes general, electrical, plumbing, sheet metal, and road contractors. Other users of our products include farmers, truckers, railroads, oil exploration companies, oil production and refinement companies, mining companies, federal, state, and local governmental entities, schools, and certain retail trades. Geographically, our branches, Onsite locations, and customers are primarily located in North America.
It is helpful to appreciate several aspects of our marketplace: (1) It's big. We estimate the North American marketplace for industrial supplies is in excess of $140 billion per year (and we have expanded beyond North America) and no company has a significant portion of this market. (2) Many of the products we sell are individually inexpensive, but the cost and time to manage, procure, and transport these products can be quite meaningful. (3) Purchasing professionals often expend disproportionate effort managing the high stock keeping unit (SKU) count of low-volume, low value MRO supplies which is better allocated to their higher volume, higher value OEM supplies. (4) Many customers prefer to reduce their number of suppliers to simplify their business, while also utilizing various technologies and models (including our local branches when they need something quickly or unexpectedly) to improve availability and reduce waste. (5) We believe the markets are efficient. In our view, this means that companies that grow market share are those that develop differentiated capabilities that provide the greatest value to the customer.
Our approach to addressing these aspects of our marketplace is captured in our motto Where Industry Meets Innovation*™*. The concept of growth is simple: find more customers every day and increase our activity with them. However, execution is hard work. First, we recruit service-minded individuals to support customers and empower them to operate in a decentralized fashion to maximize their flexibility to solve customer problems. We support these customer-facing resources with a supply chain capability that is speedy, efficient, and cost-effective. This has formed the foundation of our high-touch model since inception. Second, we invest in, develop, and deploy capabilities that allow us to illuminate and provide greater control over a customer's supply chain. These capabilities range from service models that take advantage of our local presence and/or our ability to more efficiently manage complex procurement needs, to hardware and software technologies that promote actionable data capture, improve operating efficiencies and reduce supply chain risk. Third, we strive to generate strong profits, which produce the cash flow necessary to support our growth, our product and technology development, and the needs of our customers.
The ultimate aim of this 'high-tech, high-touch' approach to gaining market share is to allow us to get closer to our customers, going so far as to be right to the point of consumption within customers' facilities. Marrying our presence, capabilities and technologies deepens our relationships and our understanding of our customers' day-to-day opportunities and obstacles. This, in turn, enhances our ability to provide innovative and comprehensive solutions to our customers' challenges. By doing these things every day, Fastenal remains a growth-centric organization.
Impact of COVID-19 on Our Business
In the second quarter of 2020, the impacts of the COVID-19 pandemic on our business were dramatic in two respects. First, local and national actions taken, such as stay-at-home mandates, reduced business activity sharply as many customers either closed their locations or operated at significantly diminished capacity. This effect was illustrated in a significant decline in sales for our fastener products. Second, social actions taken to mitigate the effects of the pandemic produced significant demand for personal protection equipment (PPE) and sanitation products, generating significant sales of such products not only to certain traditional customers but also to state and local government entities as well as front line responders. This effect was illustrated by a significant increase in sales for our safety products. During that period, improved sales of PPE and sanitation products
more than offset the general economic weakness. These dynamics affected our business throughout the second quarter of 2020, but the effects were greatest in April, with sequential improvements in May and June as business restrictions gradually eased.
The pandemic continued to have a significant impact on our business in the third and fourth quarters of 2020. The marketplace broadly, and Fastenal specifically, continued to operate with certain modifications to balance re-opening with employee and customer safety. However, most of the markets in which we operate began to normalize in the second half of 2020. This improved the outlook of the manufacturing and construction customers that support our traditional branch and Onsite business and moderated the level of demand for PPE and sanitation products that we experienced at the onset of the pandemic. The sequential gains in economic activity that we experienced in the latter part of the second quarter of 2020 continued through the third and fourth quarters of 2020.
In 2021, we saw several distinct business patterns, which mostly persisted throughout the period. First, economic normalization continued, resulting in strong demand from our traditional manufacturing and non-residential construction customers. Second, the pandemic continued, with ebbs and flows in infections during the year. This resulted in businesses, including Fastenal, continuing to take steps to promote workforce and customer health and safety. However, in contrast to the early part of 2020, the pandemic was not primarily responsible for plant shutdowns or production cuts; companies navigated the pandemic mostly without curtailing operations. Third, this combination of strong demand coupled with ongoing adaptations to the pandemic resulted in a number of stresses accompanying economic growth: supply chain disruption, labor force constraints, and product and shipping inflation. As a result, while the economic backdrop was solid throughout 2021, satisfying customer demand was challenged by difficulty in procuring materials, retaining sufficient part- and full-time labor
Showing the first 8K of 87K characters. Open the full section
Item 7A. QUANTITATIVE AND QUALITATIVE DISCLOSURES ABOUT MARKET RISKS
We are exposed to certain market risks from changes in foreign currency exchange rates, commodity steel pricing, commodity energy prices, and interest rates. Changes in these factors cause fluctuations in our earnings and cash flows. Italicized discussions throughout Item 7A of this Form 10-K indicate discussions of market risks in 2020. We evaluate and manage exposure to these market risks as follows:
Foreign currency exchange rates – Foreign currency fluctuations can affect our net investments, our operations in countries other than the U.S., and earnings denominated in foreign currencies. Historically, our primary exchange rate exposure has been with the Canadian dollar against the United States dollar. Our estimated net earnings exposure for foreign currency exchange rates was not material at year end. We have not historically hedged our foreign currency risk given that exposure to date has not been material. During 2021, changes in foreign currency exchange rates increased our reported net sales by $37.4 with the estimated effect on our net earnings being immaterial. During 2020, changes in foreign currency exchange rates decreased our reported net sales by $5.7 with the estimated effect on our net earnings being immaterial.
Commodity steel pricing – We buy and sell various types of steel products; these products consist primarily of different types of threaded fasteners and related hardware. We are exposed to the impacts of commodity steel pricing and our related ability to pass through the impacts to our end customers. During 2021, the price of steel as reflected in many market indexes increased, which contributed to cost inflation in our steel-based products. Based on our ability to pass these higher costs on, the estimated effect on our net earnings was immaterial in 2021. During 2020, the price of commodity steel as reflected in many market indexes fell sharply early in the year as business activity declined in response to actions to address the COVID-19 pandemic, recovered sharply as business activity rebounded, and finished 2020 above the preceding year end levels.
Commodity energy prices – We have market risk for changes in prices of oil, gasoline, diesel fuel, natural gas, and electricity. During 2021, the price of energy as reflected in many market indexes increased as economic activity improved, which contributed to higher costs for fuel in our vehicles and utilities at our facilities. In 2021, our estimated net earnings exposure for commodity energy prices was immaterial. During 2020, prices for energy were mostly lower as business activity declined in response to actions to address the COVID-19 pandemic. As a result, we experienced lower costs for fuel for our vehicles and utilities for our facilities.
Fossil fuels are also often a key feedstock for chemicals and plastics that comprise a key raw material for many products that we sell. During 2021, prices for fossil fuels were generally higher which caused us to experience higher prices for products with high chemical or plastic content. In 2021, our estimated net earnings exposure for materials for which fossil fuels are feedstock was immaterial. During 2020, although fossil fuel prices were generally lower we experienced stable, not lower, prices for products with high chemical or plastic content. We believe that over time these risks are mitigated in part by our ability to pass freight and product costs to our customers, the efficiency of our trucking distribution network, and the ability, over time, to manage our occupancy costs related to the heating and cooling of our facilities through better efficiency.
Interest rates - Loans under our Credit Facility bear interest at floating rates tied to LIBOR (or, if LIBOR is no longer available, at a replacement rate to be determined by the administrative agent for the Credit Facility and consented to by us). As a result, changes in LIBOR can affect our operating results and liquidity to the extent we do not have effective interest rate swap arrangements in place. We have not historically used interest rate swap arrangements to hedge the variable interest rates under our Credit Facility. A one percentage point increase in LIBOR in 2021 would have resulted in approximately $0.2 of additional interest expense. A description of our Credit Facility is contained in Note 9 of the Notes to Consolidated Financial Statements.
Item 8. FINANCIAL STATEMENTS AND SUPPLEMENTARY DATA
REPORT OF INDEPENDENT REGISTERED PUBLIC ACCOUNTING FIRM
To the Stockholders and Board of Directors
Fastenal Company:
Opinions on the Consolidated Financial Statements and Internal Control Over Financial Reporting
We have audited the accompanying consolidated balance sheets of Fastenal Company and subsidiaries (the Company) as of December 31, 2021 and 2020, the related consolidated statements of earnings, comprehensive income, stockholders' equity, and cash flows for each of the years in the three-year period ended December 31, 2021 and the related notes and financial statement schedule listed in the table of contents at Item 15 (collectively, the consolidated financial statements). We also have audited the Company's internal control over financial reporting as of December 31, 2021, based on criteria established in Internal Control - Integrated Framework (2013) issued by the Committee of Sponsoring Organizations of the Treadway Commission.
In our opinion, the consolidated financial statements referred to above present fairly, in all material respects, the financial position of the Company as of December 31, 2021 and 2020, and the results of its operations and its cash flows for each of the years in the three-year period ended December 31, 2021, in conformity with U.S. generally accepted accounting principles. Also in our opinion, the Company maintained, in all material respects, effective internal control over financial reporting as of December 31, 2021 based on criteria established in Internal Control - Integrated Framework (2013) issued by the Committee of Sponsoring Organizations of the Treadway Commission.
Basis for Opinions
The Company's management is responsible for these consolidated financial statements, for maintaining effective internal control over financial reporting, and for its assessment of the effectiveness of internal control over financial reporting, included in the accompanying Management's Annual Report on Internal Control Over Financial Reporting. Our responsibility is to express an opinion on the Company's consolidated financial statements and an opinion on the Company's internal control over financial reporting based on our audits. We are a public accounting firm registered with the Public Company Accounting Oversight Board (United States) (PCAOB) and are required to be independent with respect to the Company in accordance with the U.S. federal securities laws and the applicable rules and regulations of the Securities and Exchange Commission and the PCAOB.
We conducted our audits in accordance with the standards of the PCAOB. Those standards require that we plan and perform the audits to obtain reasonable assurance about whether the consolidated financial statements are free of material misstatement, whether due to error or fraud, and whether effective internal control over financial reporting was maintained in all material respects.
Our audits of the consolidated financial statements included performing procedures to assess the risks of material misstatement of the consolidated financial statements, whether due to error or fraud, and performing procedures that respond to those risks. Such procedures included examining, on a test basis, evidence regarding the amounts and disclosures in the consolidated financial statements. Our audits also included evaluating the accounting principles used and significant estimates made by management, as well as evaluating the overall presentation of the consolidated financial statements. Our audit of internal control over financial reporting included obtaining an understanding of internal control over financial reporting, assessing the risk that a material weakness exists, and testing and evaluating the design and operating effectiveness of internal control based on the assessed risk. Our audits also included performing such other procedures as we considered necessary in the circumstances. We believe that our audits provide a reasonable basis for our opinions.
Definition and Limitations of Internal Control Over Financial Reporting
A company's internal control over financial reporting is a process designed to provide reasonable assurance regarding the reliability of financial reporting and the preparation of financial statements for external purposes in accordance with generally accepted accounting principles. A company's internal control over financial reporting includes those policies and procedures that (1) pertain to the maintenance of records that, in reasonable detail, accurately and fairly reflect the transactions and dispositions of the assets of the company; (2) provide reasonable assurance that transactions are recorded as necessary to permit preparation of financial statements in accordance with generally accepted accounting principles, and that receipts and expenditures of the company are being made only in accordance with authorizations of management and directors of the company; and (3) provide reasonable assurance regarding prevention or timely detection of unauthorized acquisition, use, or disposition of the company's assets that could have a material effect on the financial statements.
Because of its inherent limitations, internal control over financial reporting may not prevent or detect misstatements. Also, projections of any evaluation of effectiveness to future periods are subject to the risk that controls may become inadequate because of changes in conditions, or that the degree of compliance with the policies or procedures may deteriorate.
Critical Audit Matter
The critical audit matter communicated below is a matter arising from the current period audit of the consolidated financial statements that was communicated or required to be communicated to the audit committee and that: (1) relates to accounts or disclosures that are material to the consolidated financial statements and (2) involved our especially challenging, subjective, or complex judgments. The communication of a critical audit matter does not alter in any way our opinion on the consolidated financial statements, taken as a whole, and we are not, by communicating the critical audit matter below, providing a separate opinion on the critical audit matter or on the accounts or disclosures to which it relates.
Sufficiency of audit evidence over inventory quantities at in-market locations
As disclosed in the consolidated balance sheet, the Company held $1,523.6 million of inventory, the majority of which was held at 3,209 in-market locations, as of December 31, 2021. The Company's processes to track and determine consolidated inventory relies on a perpetual inventory system which involves the interaction of information technology (IT) systems.
We identified the evaluation of the sufficiency of audit evidence obtained related to the quantities of inventory at in-market locations as a critical audit matter. Evaluating the sufficiency of audit evidence over quantities of inventory at in-market locations required challenging auditor judgment to assess the number of in-market locations visited and included the involvement of IT professionals with specialized skills and knowledge due to the interaction of IT systems that track physical inventory quantities by location.
The following are the primary procedures we performed to address this critical audit matter: We evaluated the design and tested the operating effectiveness of certain internal controls related to the critical audit matter. This included IT application controls, as well as certain controls related to access to programs and data, program changes, and computer operations. It also included certain controls related to the Company's physical inventory cycle counts. We involved IT professionals with specialized skills and knowledge, who assisted in testing certain IT controls, inclusive of the interface of IT systems, which support the Company's perpetual inventory system. We applied auditor judgment in the determination of
Showing the first 8K of 78K characters. Open the full section
Item 9. CHANGES IN AND DISAGREEMENTS WITH ACCOUNTANTS ON ACCOUNTING AND FINANCIAL DISCLOSURE
None.
Item 9A. CONTROLS AND PROCEDURES
Disclosure Controls and Procedures
As of the end of the period covered by this report, we conducted an evaluation, under the supervision and with the participation of our principal executive officer and principal financial officer, of our disclosure controls and procedures (as defined in Rules 13a-15(e) and 15d-15(e) under the Securities Exchange Act of 1934 (the Securities Exchange Act)). Based on this evaluation, the principal executive officer and principal financial officer concluded that our disclosure controls and procedures are effective to ensure that information required to be disclosed by us in reports that we file or submit under the Securities Exchange Act is recorded, processed, summarized, and reported within the time periods specified in SEC rules and forms, and is accumulated and communicated to our management, including the principal executive officer and principal financial officer, to allow for timely decisions regarding required disclosure.
Attestation Report of Independent Registered Public Accounting Firm
The attestation report required under this item is contained earlier in this Form 10-K under the heading 'Item 8, Financial Statements and Supplementary Data'.
Management's Annual Report on Internal Control Over Financial Reporting
Our management is responsible for establishing and maintaining adequate internal control over financial reporting as defined in Rules 13a-15(f) and 15d-15(f) under the Securities Exchange Act. The company's internal control over financial reporting is designed to provide reasonable assurance regarding the reliability of financial reporting and the preparation of financial statements for external purposes in accordance with U.S. generally accepted accounting principles. The company's internal control over financial reporting includes those policies and procedures that:
(i)pertain to the maintenance of records that, in reasonable detail, accurately and fairly reflect the transactions and dispositions of the assets of the company;
(ii)provide reasonable assurance that the transactions are recorded as necessary to permit preparation of financial statements in accordance with U.S. generally accepted accounting principles, and that receipts and expenditures of the company are being made only in accordance with authorizations of management and directors of the company; and
(iii)provide reasonable assurance regarding prevention or timely detection of unauthorized acquisition, use or disposition of the company's assets that could have a material effect on the financial statements.
Because of its inherent limitations, internal control over financial reporting may not prevent or detect misstatements. Also, projections of any evaluation of effectiveness to future periods are subject to the risk that controls may become inadequate because of changes in conditions, or that the degree of compliance with the policies or procedures may deteriorate.
Under the supervision of our principal executive officer and our principal financial officer, we conducted an evaluation of the effectiveness of our internal control over financial reporting based on the framework in Internal Control – Integrated Framework (2013) issued by the Committee of Sponsoring Organizations of the Treadway Commission. Based on our assessment and those criteria, management believes that the company maintained effective internal control over financial reporting as of December 31, 2021. There was no change in the company's internal control over financial reporting during the company's most recently completed fiscal quarter that has materially affected, or is reasonably likely to materially affect, the company's internal control over financial reporting.
| /s/ Daniel L. Florness | /s/ Holden Lewis | |||||||
| Daniel L. Florness | Holden Lewis | |||||||
| President and Chief Executive Officer | Executive Vice President and Chief Financial Officer | |||||||
| Winona, Minnesota | ||||||||
| February 7, 2022 |
Item 9B. OTHER INFORMATION
None.
Item 9C. DISCLOSURE REGARDING FOREIGN JURISDICTIONS THAT PREVENT INSPECTIONS
None.
PART III
Item 10. DIRECTORS, EXECUTIVE OFFICERS, AND CORPORATE GOVERNANCE
Incorporated herein by reference is the information appearing under the headings 'Proposal #1—Election of Directors', 'Corporate Governance and Director Compensation—Board Leadership Structure and Committee Membership', 'Corporate Governance and Director Compensation—Audit Committee', and 'Corporate Governance and Director Compensation—Delinquent Section 16(a) Reports' in the Proxy Statement.
There have been no material changes to the procedures by which security holders may recommend nominees to the board of directors since our last report.
In January 2004, our board of directors adopted a supplement to our existing standards of conduct designed to qualify the standards of conduct as a code of ethics within the meaning of Item 406(b) of Regulation S-K promulgated by the SEC (Code of Ethics). The standards of conduct, as supplemented, apply to all of our directors, officers, and employees, including without limitation our chief executive officer, chief financial officer, principal accounting officer, and controller (if any), and persons performing similar functions (Senior Financial Officers). Those portions of the standards of conduct, as supplemented, that constitute a required element of a Code of Ethics are available without charge by submitting a request to us pursuant to the directions detailed under 'Does Fastenal have a Code of Conduct?' on the 'Investor FAQs' page of the 'Investor Relations' section of our website at www.fastenal.com. In the event we amend or waive any portion of the standards of conduct, as supplemented, that constitutes a required element of a Code of Ethics and such amendment or waiver applies to any of our Senior Financial Officers, we intend to post on our website at www.fastenal.com, within four business days after the date of such amendment or waiver, a brief description of such amendment or waiver, the name of each Senior Financial Officer to whom the amendment or waiver applies, and the date of the amendment or waiver.
Information about our Executive Officers
As of the date of filing this Form 10-K, the following individuals were executive officers of the Company:
| Name | Employee of Fastenal Since | Age | Position | ||||||||||||||
| Daniel L. Florness | 1996 | 58 | President, Chief Executive Officer, and Director | ||||||||||||||
| William J. Drazkowski | 1995 | 50 | Executive Vice President – Sales | ||||||||||||||
| James C. Jansen | 1992 | 51 | Executive Vice President – Manufacturing | ||||||||||||||
| Holden Lewis | 2016 | 52 | Executive Vice President and Chief Financial Officer | ||||||||||||||
| Sheryl A. Lisowski | 1994 | 54 | Executive Vice President – Chief Accounting Officer and Treasurer | ||||||||||||||
| Charles S. Miller | 1999 | 47 | Senior Executive Vice President – Sales | ||||||||||||||
| Terry M. Owen | 1999 | 53 | Senior Executive Vice President – Sales Operations | ||||||||||||||
| John L. Soderberg | 1993 | 50 | Senior Executive Vice President – Information Technology | ||||||||||||||
| Jeffery M. Watts | 1996 | 50 | Executive Vice President – International Sales | ||||||||||||||
| Reyne K. Wisecup | 1988 | 58 | Senior Executive Vice President – Human Resources and Director |
Mr. Florness has been our president and chief executive officer since January 2016. From December 2002 to December 2015, Mr. Florness was an executive vice president and our chief financial officer. From June 1996 to November 2002, Mr. Florness was our chief financial officer. During his time as chief financial officer, Mr. Florness' responsibilities expanded beyond finance, including leadership of a portion of our manufacturing division, our product development and procurement, and the company's national accounts business. Mr. Florness has served as one of our directors since January 2016.
Mr. Drazkowski has been our executive vice president - sales since October 2019. Mr. Drazkowski's responsibilities include sales and operational oversight of our Western United States business. From December 2016 to September 2019, Mr. Drazkowski was executive vice president – national accounts sales. From October 2014 to December 2016, Mr. Drazkowski was our vice president – national accounts sales, from September 2013 to September 2014, he served as regional vice president of our Minnesota based region, and from November 2007 to August 2013, he served as one of our district managers. Prior to November 2007, Mr. Drazkowski served in various sales leadership roles at our company.
Mr. Jansen has been our executive vice president – manufacturing since January 2016. Mr. Jansen's responsibilities include oversight of our industrial services, quality assurance, aerospace, manufacturing operations, and EHS management. From December 2010 to December 2015, Mr. Jansen was our executive vice president - operations. From November 2007 to December 2010, Mr. Jansen was our executive vice president – internal operations. From May 2005 to November 2007, Mr. Jansen served as our leader of systems development (this role encompassed both information systems and distribution systems development). From April 2000 to April 2005, Mr. Jansen served as regional vice president of our Texas based region.
Mr. Lewis has been our executive vice president and chief financial officer since August 2016. From April 2016 to July 2016, Mr. Lewis was a senior vice president/equity research-industrial technology with FBR Capital Markets & Co. (a full-service investment bank). From September 2014 to January 2016, Mr. Lewis was a managing director/equity research-industrial technology with Oppenheimer & Co Inc. (a full-service investment bank). From August 2002 to August 2014, Mr. Lewis was a managing director/equity research-industrial manufacturing & distribution with BB&T Capital Markets, a division of BB&T Securities LLC (a full-service investment bank). Prior to August 2002, Mr. Lewis held similar roles with various other organizations since 1994. In each of Mr. Lewis' positions prior to joining Fastenal, he was responsible for studying the strategic and financial direction of companies for the purpose of making investment recommendations to institutional clients.
Ms. Lisowski has been our executive vice president - chief accounting officer and treasurer since December 2020. From August 2016 to November 2020, Ms. Lisowski was our controller, chief accounting officer, and treasurer. Ms. Lisowski was our controller and chief accounting officer from October 2013 to August 2016, and also served as our interim chief financial officer from January 2016 to August 2016. From March 2007 to October 2013, Ms. Lisowski served as our controller – accounting operations. Ms. Lisowski joined Fastenal in 1994 and, prior to March 2007, served in various roles of increasing responsibility within our finance and accounting team.
Mr. Miller has been our senior executive vice president – sales since January 2020. Mr. Miller's responsibilities include sales and operational oversight of our Eastern United States business. From November 2015 to December 2019, Mr. Miller was one of our executive vice presidents – sales. From January 2009 to October 2015, Mr. Miller served as regional vice president of our southeast central region based primarily in Tennessee and Kentucky. Prior to January 2009, Mr. Miller served in various sales leadership roles at our company.
Mr. Owen has been our senior executive vice president – sales operations since January 2016. Mr. Owen's responsibilities include oversight of our eCommerce, marketing, national accounts sales, government sales, FAST Solutions® (Onsite and FMI), our Mansco division, manufacturing, distribution, transportation, product development, supplier development, procurement, and supply chain. From July 2015 to December 2015, Mr. Owen was one of our executive vice presidents – sales. From May 2014 to June 2015, Mr. Owen served as our executive vice president – e-business, and from December 2007 to May 2014, Mr. Owen was regional vice president of our Texas based and Mexico regions. Prior to December 2007, Mr. Owen served in various distribution center leadership roles at our company.
Mr. Soderberg has been our senior executive vice president – information technology since December 2020. From May 2016 to November 2020, Mr. Soderberg was our executive vice president – information technology. From May 2014 to May 2016, Mr. Soderberg served as our executive vice president – sales operations and support. From April 2010 to May 2014, Mr. Soderberg was one of our vice presidents – sales. From April 2005 to April 2010, Mr. Soderberg served as regional vice president of our Seattle, Washington based region. Prior to April 2005, Mr. Soderberg served in various sales leadership roles in the mid-Atlantic area of our company.
Mr. Watts has been our executive vice president – international sales since December 2016. From March 2015 to December 2016, Mr. Watts was our vice president – international sales. From June 2005 to February 2015, he served as regional vice president of our Canadian region. Prior to June 2005, Mr. Watts served in various sales leadership roles at our company.
Ms. Wisecup has been our senior executive vice president – human resources since December 2016. From November 2007 to December 2016, Ms. Wisecup was our executive vice president – human resources. Prior to November 2007, she served in various support roles, including director of employee development. Ms. Wisecup has also served as one of our directors since 2000.
The executive officers are elected by our board of directors for a term of one year and serve until their successors are elected and qualified. None of our executive officers is related to any other such executive officer or to any of our directors.
Item 11. EXECUTIVE COMPENSATION
Incorporated herein by reference is the information appearing under the headings 'Corporate Governance and Director Compensation—Compensation Committee Interlocks and Insider Participation', 'Executive Compensation', and 'Corporate Governance and Director Compensation—Compensation of our Directors' in the Proxy Statement.
Item 12. SECURITY OWNERSHIP OF CERTAIN BENEFICIAL OWNERS AND MANAGEMENT AND RELATED STOCKHOLDER MATTERS
Incorporated herein by reference is the information appearing under the heading 'Security Ownership of Principal Shareholders and Management' in the Proxy Statement.
Equity Compensation Plan Information
| Plan Category | Number of Securities to be Issued Upon Exercise of Outstanding Options, Warrants, and Rights | Weighted-Average Exercise Price of Outstanding Options, Warrants, and Rights | Number of Securities Remaining Available for Future Issuance Under Equity Compensation Plans (Excluding Securities Reflected in Column (a)) | ||||||||||||||
| (a) | (b) | (c) | |||||||||||||||
| Equity compensation plans approved by security holders (1) | 5,173,270 | $ | 30.23 | 12,193,276 | |||||||||||||
| Equity compensation plans not approved by security holders | — | — | — | ||||||||||||||
| Total | 5,173,270 | 12,193,276 |
(1) Reflects stock option awards issued and issuable in the future under our Fastenal Company Stock Option Plan and our Fastenal Company Non-Employee Director Stock Option Plan.
Item 13. CERTAIN RELATIONSHIPS AND RELATED TRANSACTIONS, AND DIRECTOR INDEPENDENCE
Incorporated herein by reference is the information appearing under the headings 'Corporate Governance and Director Compensation—Director Independence', 'Corporate Governance and Director Compensation—Related Person Transaction Approval Policy', and 'Corporate Governance and Director Compensation—Transactions with Related Persons' in the Proxy Statement.
Item 14. PRINCIPAL ACCOUNTANT FEES AND SERVICES
Incorporated herein by reference is the information appearing under the heading 'Audit and Related Matters—Audit and Related Fees' and 'Audit and Related Matters—Pre-Approval of Services' in the Proxy Statement.
PART IV
Item 15. EXHIBITS AND FINANCIAL STATEMENT SCHEDULES
| a) | 1. Financial Statements: |
Consolidated Balance Sheets as of December 31, 2021 and 2020
Consolidated Statements of Earnings for the years ended December 31, 2021, 2020, and 2019
Consolidated Statements of Comprehensive Income for the years ended December 31, 2021, 2020, and 2019
Consolidated Statements of Stockholders' Equity for the years ended December 31, 2021, 2020, and 2019
Consolidated Statements of Cash Flows for the years ended December 31, 2021, 2020, and 2019
Notes to Consolidated Financial Statements
Report of Independent Registered Public Accounting Firm (KPMG LLP, Minneapolis, MN, Auditor Firm ID: 185)
| 2. Financial Statement Schedules: |
Schedule II—Valuation and Qualifying Accounts
| 3. Exhibits: |
INDEX TO EXHIBITS
- Management contract or compensatory plan or arrangement required to be filed as an exhibit to this Form 10-K pursuant to Item 15(b).
Item 16. FORM 10-K SUMMARY
Not applicable.
FASTENAL COMPANY
Schedule II—Valuation and Qualifying Accounts
Years ended December 31, 2021, 2020, and 2019
(Amounts in millions)
| Description | Balance at Beginning of Year | "Additions" Charged to Costs and Expenses | "Other" Additions (Deductions) | "Less" Deductions | Balance at End of Year | ||||||||||||||||||||||||
| Year ended December 31, 2021 | |||||||||||||||||||||||||||||
| Allowance for credit losses | $ | 12.3 | 2.5 | — | 2.8 | 12.0 | |||||||||||||||||||||||
| Insurance reserves | $ | 41.0 | 78.6 | (1) | — | 83.9 | (2) | 35.7 | |||||||||||||||||||||
| Year ended December 31, 2020 | |||||||||||||||||||||||||||||
| Allowance for credit losses | $ | 10.9 | 7.5 | — | 6.1 | 12.3 | |||||||||||||||||||||||
| Insurance reserves | $ | 41.1 | 72.1 | (1) | — | 72.2 | (2) | 41.0 | |||||||||||||||||||||
| Year ended December 31, 2019 | |||||||||||||||||||||||||||||
| Allowance for credit losses | $ | 12.8 | 5.5 | — | 7.4 | 10.9 | |||||||||||||||||||||||
| Insurance reserves | $ | 37.6 | 69.7 | (1) | — | 66.2 | (2) | 41.1 |
(1) Includes costs and expenses incurred for premiums and claims related to health and general insurance.
(2) Includes costs and expenses paid for premiums and claims related to health and general insurance.
See accompanying Report of Independent Registered Public Accounting Firm incorporated herein by reference.
SIGNATURES
Pursuant to the requirements of Section 13 or 15(d) of the Securities Exchange Act of 1934, the registrant has duly caused this report to be signed on its behalf by the undersigned, thereunto duly authorized.
| Date: | February 7, 2022 | |||||||
| FASTENAL COMPANY | ||||||||
| By | /s/ Daniel L. Florness | |||||||
| Daniel L. Florness, President and Chief Executive Officer |
Pursuant to the requirements of the Securities Exchange Act of 1934, this report has been signed below by the following persons on behalf of the registrant and in the capacities and on the date indicated.
| Date: | February 7, 2022 |
| /s/ Daniel L. Florness | /s/ Holden Lewis | ||||||||||
| Daniel L. Florness, President and Chief Executive Officer (Principal Executive Officer), and Director | Holden Lewis, Executive Vice President and Chief Financial Officer (Principal Financial Officer) | ||||||||||
| /s/ Sheryl A. Lisowski | |||||||||||
| Sheryl A. Lisowski, Executive Vice President - Chief Accounting Officer and Treasurer (Principal Accounting Officer) | |||||||||||
| /s/ Scott A. Satterlee | /s/ Daniel L. Johnson | ||||||||||
| Scott A. Satterlee, Director (Chair) | Daniel L. Johnson, Director | ||||||||||
| /s/ Michael J. Ancius | /s/ Nicholas J. Lundquist | ||||||||||
| Michael J. Ancius, Director | Nicholas J. Lundquist, Director | ||||||||||
| /s/ Stephen L. Eastman | /s/ Sarah N. Nielsen | ||||||||||
| Stephen L. Eastman, Director | Sarah N. Nielsen, Director | ||||||||||
| /s/ Rita J. Heise | /s/ Reyne K. Wisecup | ||||||||||
| Rita J. Heise, Director | Reyne K. Wisecup, Director | ||||||||||
| /s/ Hsenghung Sam Hsu | |||||||||||
| Hsenghung Sam Hsu, Director | |||||||||||