 filings.tools
Cover and table of contents
158K characters. Original on sec.gov · Markdown
Cover and table of contents
10-K 1 a2016form10-k.htm FORM 10-K
| UNITED STATES | ||
| SECURITIES AND EXCHANGE COMMISSION | ||
| Washington, D.C. 20549 | ||
| FORM 10-K | ||
| (Mark One) | ||
| [X] ANNUAL REPORT PURSUANT TO SECTION 13 OR 15(d) OF THE SECURITIES EXCHANGE ACT OF 1934 | ||
| For the fiscal year ended December 31, 2016 | ||
| OR | ||
| [ ] TRANSITION REPORT PURSUANT TO SECTION 13 OR 15(d) OF THE SECURITIES EXCHANGE ACT OF 1934 | ||
| For the transition period from | to | |
| Commission File Number: 001-11307-01 |
| Freeport-McMoRan Inc. | ||
| (Exact name of registrant as specified in its charter) |
| Delaware | 74-2480931 |
| (State or other jurisdiction of incorporation or organization) | (I.R.S. Employer Identification No.) |
| 333 North Central Avenue | |
| Phoenix, Arizona | 85004-2189 |
| (Address of principal executive offices) | (Zip Code) |
| (602) 366-8100 | |
| (Registrant's telephone number, including area code) |
Securities registered pursuant to Section 12(b) of the Act:
| Title of each class | Name of each exchange on which registered | |
| Common Stock, par value $0.10 per share | New York Stock Exchange |
Securities registered pursuant to Section 12(g) of the Act: None
Indicate by check mark if the registrant is a well-known seasoned issuer, as defined in Rule 405 of the Securities Act þ Yes o No
Indicate by check mark if the registrant is not required to file reports pursuant to Section 13 or Section 15(d) of the Act. o Yes þ No
Indicate by check mark whether the registrant (1) has filed all reports required to be filed by Section 13 or 15(d) of the Securities Exchange Act of 1934 during the preceding 12 months (or for such shorter period that the registrant was required to file such reports), and (2) has been subject to such filing requirements for the past 90 days. þ Yes o No
Indicate by check mark whether the registrant has submitted electronically and posted on its corporate Web site, if any, every Interactive Data File required to be submitted and posted pursuant to Rule 405 of Regulation S-T (§ 232.405 of this chapter) during the preceding 12 months (or for such shorter period that the registrant was required to submit and post such files). þ Yes o No
Indicate by check mark if disclosure of delinquent filers pursuant to Item 405 of Regulation S-K (§229.405 of this chapter) is not contained herein, and will not be contained, to the best of the registrant’s knowledge, in definitive proxy or information statements incorporated by reference in Part III of this Form 10-K or any amendment to this Form 10-K. þ
Indicate by check mark whether the registrant is a large accelerated filer, an accelerated filer, a non-accelerated filer or a smaller reporting company. See the definitions of “large accelerated filer,” “accelerated filer” and “smaller reporting company” in Rule 12b-2 of the Exchange Act. þ Large accelerated filer o Accelerated filer o Non-accelerated filer o Smaller reporting company
Indicate by check mark whether the registrant is a shell company (as defined in Rule 12b-2 of the Act). o Yes þ No
The aggregate market value of common stock held by non-affiliates of the registrant was $19.8 billion on February 15, 2017, and $14.6 billion on June 30, 2016.
Common stock issued and outstanding was 1,445,380,168 shares on February 15, 2017, and 1,317,877,473 shares on June 30, 2016.
DOCUMENTS INCORPORATED BY REFERENCE
| Portions of our proxy statement for our 2017 annual meeting of stockholders are incorporated by reference into Part III (Items 10, 11, 12, 13 and 14) of this report. |
FREEPORT-McMoRan INC.
i
PART I
Items 1. and 2. Business and Properties.
All of our periodic reports filed with the United States (U.S.) Securities and Exchange Commission (SEC) pursuant to Section 13(a) or 15(d) of the Securities Exchange Act of 1934, as amended, are available, free of charge, through our website, www.fcx.com, including our annual reports on Form 10-K, quarterly reports on Form 10-Q, current reports on Form 8-K and any amendments to those reports. These reports and amendments are available through our website as soon as reasonably practicable after we electronically file or furnish such material to the SEC.
References to “we,” “us” and “our” refer to Freeport-McMoRan Inc. (FCX) and its consolidated subsidiaries. References to “Notes” refer to the Notes to Consolidated Financial Statements included herein (refer to Item 8), and references to “MD&A” refer to Management's Discussion and Analysis of Financial Condition and Results of Operations included herein (refer to Item 7).
GENERAL
We are a leading international mining company with headquarters in Phoenix, Arizona. Our company was incorporated under the laws of the state of Delaware on November 10, 1987. We operate large, long-lived geographically diverse assets with significant proven and probable reserves of copper, gold and molybdenum, and we are the world’s largest publicly traded copper producer. Our portfolio of assets includes the Grasberg minerals district in Indonesia, one of the world's largest copper and gold deposits, and significant mining operations in the Americas, including the large-scale Morenci minerals district in North America and the Cerro Verde operation in South America.
During 2016, we took actions to restore our balance sheet strength through a combination of asset sale transactions, cash flow from operations and capital market transactions. During the year, we completed $6.6 billion in asset sale transactions, including the sale of our interest in TF Holdings Limited (TFHL), the sale of an additional 13 percent undivided interest in the Morenci minerals district and the sales of our Deepwater Gulf of Mexico (GOM), onshore California and Haynesville oil and gas properties (refer to Note 2 for further discussion of dispositions). In November 2016, we completed a registered at-the-market offering of our common stock that was announced in July 2016, which generated $1.5 billion in gross proceeds through the sale of 116.5 million shares of our common stock (refer to Note 10 for further discussion). During 2016, we also redeemed $369 million in senior notes for 27.7 million shares of our common stock in a series of privately negotiated transactions and purchased $38 million in senior notes in open-market transactions (refer to Note 8 for further discussion), and in second-quarter 2016, we terminated contracts for deepwater drillships, settling aggregate commitments totaling $1.1 billion for $755 million, of which $540 million was funded with shares of our common stock (refer to Note 10 for further discussion).
We continue to manage production, exploration and administrative costs and capital spending and, subject to commodity prices and operational results, expect to generate cash flows for further debt reduction during 2017.
We believe the underlying long-term fundamentals of the copper business remain positive and have retained a high-quality portfolio of long-lived copper assets positioned to generate long-term value. In addition to debt reduction plans, we are pursuing opportunities to enhance net present values, and we continue to advance studies for future development of our copper resources, the timing of which will be dependent on market conditions.
Following are our ownership interests at December 31, 2016, in operating mines through our subsidiaries, Freeport Minerals Corporation (FMC) and PT Freeport Indonesia (PT-FI):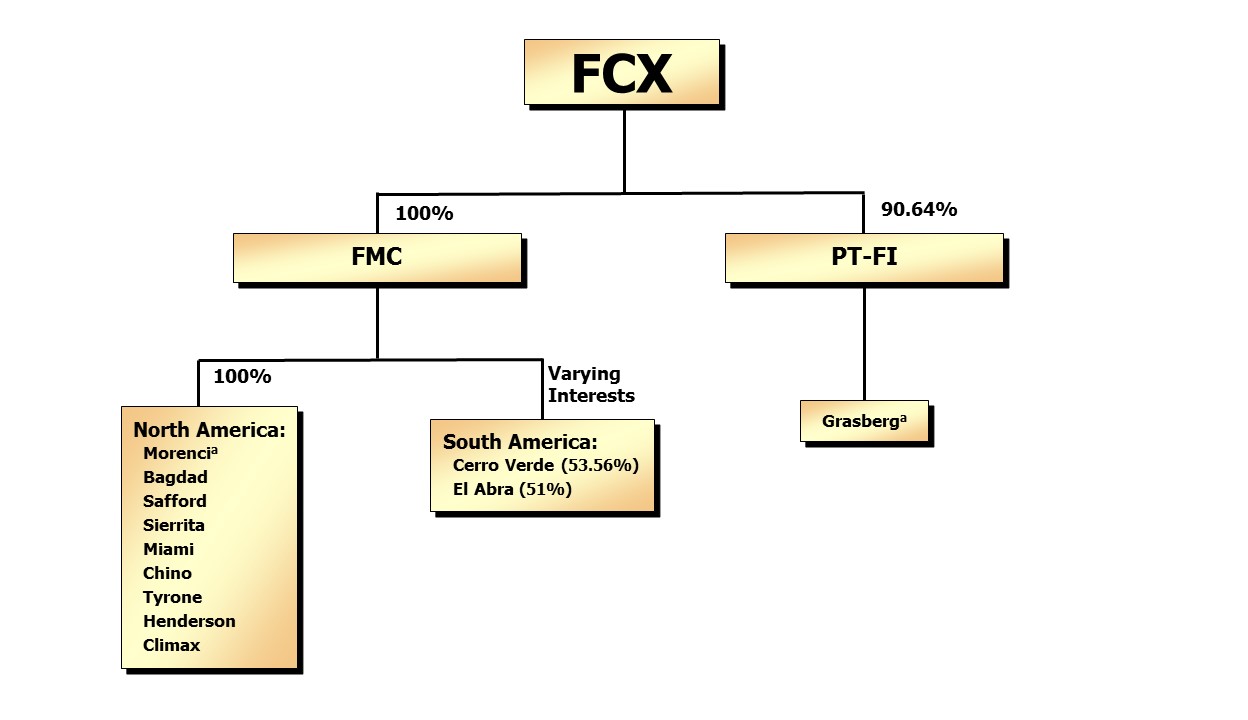
| a. | Effective May 31, 2016, FMC’s undivided interest in Morenci via an unincorporated joint venture was prospectively reduced from 85 percent to 72 percent (refer to Note 2 for further discussion). Additionally, PT-FI has an unincorporated joint venture with Rio Tinto plc (Rio Tinto) related to our Indonesia operations. Refer to Note 3 for further discussion of our ownership in subsidiaries and joint ventures. |
In November 2016, we completed the sale of our interest in TFHL (through which we held an effective 56 percent interest in the Tenke Fungurume (Tenke) mine in the Democratic Republic of Congo (DRC)) and in November 2014, we completed the sale of our 80 percent ownership interests in the Candelaria and Ojos del Salado copper mining operations in Chile.
During 2016, we also completed the sales of our Deepwater GOM, onshore California and Haynesville oil and gas properties, and during 2014, we completed the sale of our Eagle Ford shale assets.
Refer to Note 2 for further discussion of dispositions.
Mining
At December 31, 2016, our estimated consolidated recoverable proven and probable mineral reserves totaled 86.8 billion pounds of copper, 26.1 million ounces of gold and 2.95 billion pounds of molybdenum. Following is a summary of our consolidated recoverable proven and probable mineral reserves at December 31, 2016, by geographic location (refer to “Mining Operations” for further discussion):
| Copper | Gold | Molybdenum | ||||||||
| North America | 35 | % | 1 | % | 78 | % | ||||
| South America | 34 | — | 22 | |||||||
| Indonesia | 31 | 99 | — | |||||||
| 100 | % | 100 | % | 100 | % |
In North America, we operate seven copper mines - Morenci, Bagdad, Safford, Sierrita and Miami in Arizona, and Chino and Tyrone in New Mexico, and two molybdenum mines - Henderson and Climax in Colorado. In addition to copper, certain of our North America copper mines also produce molybdenum concentrate, gold and silver. In South America, we operate two copper mines - Cerro Verde in Peru and El Abra in Chile. In addition to copper, the Cerro Verde mine also produces molybdenum concentrate and silver. In Indonesia, our subsidiary PT-FI operates the
mines in the Grasberg minerals district. In addition to copper, the Grasberg minerals district also produces gold and silver.
Following is a summary of the geographic location of our consolidated copper, gold and molybdenum production (excluding copper production from Tenke, which is reported as a discontinued operation) for the year 2016 (refer to "Mining Operations" for further information):
| Copper | Gold | Molybdenum | |||||||
| North America | 43 | % | 2 | % | 74 | % | a | ||
| South America | 32 | — | 26 | ||||||
| Indonesia | 25 | 98 | — | ||||||
| 100 | % | 100 | % | 100 | % |
| a. | Our Henderson and Climax molybdenum mines produced 33 percent of consolidated molybdenum production, and our North America copper mines produced 41 percent. |
The locations of our operating mines are shown on the world map below. 
Oil and Gas
In December 2016, we completed the sales of our Deepwater GOM and onshore California oil and gas properties and in July 2016, we completed the sale of our Haynesville shale assets (refer to Note 2 for further discussion). In January 2017, we entered into an agreement to sell our property interests in the Madden area in central Wyoming. Following completion of the Madden transaction, our portfolio of oil and gas assets would include oil and natural gas production onshore in South Louisiana and on the GOM Shelf and oil production offshore California.
At December 31, 2016, our estimated proved developed oil and natural gas reserves (all of which are located in the U.S.) totaled 18 million barrels of oil equivalents (MMBOE), comprised of 4 million barrels (MMBbls) of oil and natural gas liquids (NGLs) and 87 billion cubic feet (Bcf) of natural gas, and included 7 MMBOE associated with our property interests in the Madden area. We had no proved undeveloped reserves at December 31, 2016. Refer to Note 21 for further discussion of our proved oil and gas reserves.
COPPER, GOLD AND MOLYBDENUM
Following provides a brief discussion of our primary natural resources – copper, gold and molybdenum. For further discussion of historical and current market prices of these commodities refer to MD&A and Item 1A. "Risk Factors."
Copper
Copper is an internationally traded commodity, and its prices are determined by the major metals exchanges – the London Metal Exchange (LME), New York Mercantile Exchange (NYMEX) and Shanghai Futures Exchange. Prices on these exchanges generally reflect the worldwide balance of copper supply and demand, and can be volatile and cyclical. During 2016, the LME spot copper price averaged $2.21 per pound, ranging from a low of $1.96 per pound to a high of $2.69 per pound, and was $2.50 per pound at December 31, 2016.
In general, demand for copper reflects the rate of underlying world economic growth, particularly in industrial production and construction. According to Wood Mackenzie, a widely followed independent metals market consultant, copper’s end-use markets (and their estimated shares of total consumption) are construction (31 percent), consumer products (24 percent), electrical applications (24 percent), transportation (11 percent) and industrial machinery (10 percent).
Gold
Gold is used for jewelry, coinage and bullion as well as various industrial and electronic applications. Gold can be readily sold on numerous markets throughout the world. Benchmark prices are generally based on London Bullion Market Association (London) PM quotations. During 2016, the London PM gold price averaged $1,250 per ounce, ranging from a low of $1,077 per ounce to a high of $1,366 per ounce, and was $1,159 per ounce at December 31, 2016.
Molybdenum
Molybdenum is a key alloying element in steel and the raw material for several chemical-grade products used in catalysts, lubrication, smoke suppression, corrosion inhibition and pigmentation. Molybdenum, as a high-purity metal, is also used in electronics such as flat-panel displays and in super alloys used in aerospace. Reference prices for molybdenum are available in several publications, including Metals Week, CRU Report and Metal Bulletin. During 2016, the weekly average price of molybdenum quoted by Metals Week averaged $6.47 per pound, ranging from a low of $5.15 per pound to a high of $8.47 per pound, and was $6.74 per pound at December 31, 2016.
PRODUCTS AND SALES
FCX’s consolidated revenues for 2016 primarily included sales of copper (70 percent), gold (10 percent), oil (9 percent) and molybdenum (4 percent). Oil and gas sales to Phillips 66 Company represented 12 percent of our consolidated revenues in 2014; no other customer accounted for more than 10 percent of our consolidated revenues in any of the past three years. Refer to Note 16 for a summary of our consolidated revenues and operating income (loss) by business segment and geographic area.
Copper Products
We are one of the world’s leading producers of copper concentrate, cathode and continuous cast copper rod. During 2016, 58 percent of our mined copper was sold in concentrate, 21 percent as cathode and 21 percent as rod from North America operations.
The copper ore from our mines is generally processed either by smelting and refining or by solution extraction and electrowinning (SX/EW). Before being subject to the smelting and refining process, ore is crushed and treated to produce a copper concentrate with copper content of approximately 20 to 30 percent. Copper concentrate is then smelted (i.e., subjected to extreme heat) to produce copper anode, which weighs between 800 and 900 pounds and has an average copper content of 99.5 percent. The anode is further treated by electrolytic refining to produce copper cathode, which weighs between 100 and 350 pounds and has an average copper content of 99.99 percent. For ore subject to the SX/EW process, copper is extracted from the ore by dissolving it with a weak sulphuric acid solution. The copper content of the solution is increased in two additional solution-extraction stages, and then the copper-bearing solution undergoes an electrowinning process to produce cathode that is, on average, 99.99 percent copper. Our copper cathode is used as the raw material input for copper rod, brass mill products and for other uses.
Copper Concentrate. We produce copper concentrate at six of our mines. In North America, copper concentrate is produced at the Morenci, Bagdad, Sierrita and Chino mines, and a significant portion is shipped to our Miami smelter in Arizona. Copper concentrate is also produced at the Cerro Verde mine in Peru and the Grasberg minerals district in Indonesia.
Copper Cathode. We produce copper cathode at our electrolytic refinery located in El Paso, Texas, and at nine of our mines. SX/EW cathode is produced from the Morenci, Bagdad, Safford, Sierrita, Miami, Chino and Tyrone mines in North America, and from the Cerro Verde and El Abra mines in South America. Copper cathode is also produced at Atlantic Copper (our wholly owned copper smelting and refining unit in Spain) and PT Smelting (PT-FI's 25-percent-owned copper smelter and refinery in Indonesia). Refer to "Mining Operations - Smelting Facilities and Other Mining Properties" for further discussion of Atlantic Copper and PT Smelting.
Continuous Cast Copper Rod. We manufacture continuous cast copper rod at our facilities in El Paso, Texas; Norwich, Connecticut; and Miami, Arizona, primarily using copper cathode produced at our North America copper mines.
Copper Sales
North America. The majority of the copper produced at our North America copper mines and refined in our El Paso, Texas, refinery is consumed at our rod plants. The remainder of our North America copper production is sold in the form of copper cathode or copper concentrate under U.S. dollar-denominated annual contracts. Cathode and rod contract prices are generally based on the prevailing Commodity Exchange Inc. (COMEX - a division of NYMEX) monthly average spot price for the month of shipment and include a premium. Generally, copper rod is sold to wire and cable manufacturers, while cathode is sold to rod, brass or tube fabricators. During 2016, 12 percent of our North America mines' copper concentrate sales volumes were shipped to Atlantic Copper.
South America. Production from our South America mines is sold as copper concentrate or copper cathode under U.S. dollar-denominated, annual and multi-year contracts. During 2016, our South America mines sold approximately 75 percent of their copper production in concentrate and 25 percent as cathode. During 2016, four percent of our South America mines' copper concentrate sales volumes were shipped to Atlantic Copper.
Substantially all of South America’s copper concentrate and cathode sales contracts provide final copper pricing in a specified future month (generally one to four months from the shipment date) primarily based on quoted LME monthly average spot copper prices. Revenues from South America’s concentrate sales are recorded net of royalties and treatment charges (i.e., fees paid to smelters that are generally negotiated annually). In addition, because a portion of the metals contained in copper concentrate is unrecoverable from the smelting process, revenues from South America’s concentrate sales are also recorded net of allowances for unrecoverable metals, which are a negotiated term of the contracts and vary by customer.
Indonesia. PT-FI sells its production in the form of copper concentrate, which contains significant quantities of gold and silver, under U.S. dollar-denominated, long-term contracts. PT-FI also sells a small amount of copper concentrate in the spot market. Following is a summary of PT-FI’s aggregate percentage concentrate sales to third parties, PT Smelting and Atlantic Copper for the years ended December 31:
| 2016 | 2015 | 2014 | ||||||
| Third parties | 56 | % | 61 | % | 36 | % | ||
| PT Smelting | 42 | 37 | 58 | |||||
| Atlantic Copper | 2 | 2 | 6 | |||||
| 100 | % | 100 | % | 100 | % |
Substantially all of PT-FI’s concentrate sales contracts provide final copper pricing in a specified future month (generally one to four months from the shipment date) primarily based on quoted LME monthly average spot copper prices. Revenues from PT-FI’s concentrate sales are recorded net of royalties, export duties, treatment charges and allowances for unrecoverable metals.
Gold Products and Sales
We produce gold mostly from the Grasberg minerals district. Gold is primarily sold as a component of our copper concentrate or in slimes, which are a product of the smelting and refining process at Atlantic Copper. Gold generally is priced at the average London price for a specified month near the month of shipment. Revenues from gold sold
as a component of our copper concentrate are recorded net of treatment and refining charges. Revenues from gold sold in slimes are recorded net of refining charges.
Molybdenum Products and Sales
We are the world’s largest producer of molybdenum and molybdenum-based chemicals. In addition to production from the Henderson and Climax molybdenum mines, we produce molybdenum concentrate at certain of the North America copper mines and the Cerro Verde copper mine in Peru. The majority of our molybdenum concentrate is processed in our own conversion facilities. During 2016, our molybdenum sales were generally priced based on the average published Metals Week price for the month prior to the month of shipment. We have incorporated changes in the commercial pricing structure for our molybdenum-based chemical products to enable continuation of chemical-grade production.
LABOR MATTERS
At December 31, 2016, we employed approximately 30,000 people (12,200 in Indonesia, 11,000 in North America, 5,400 in South America and 1,400 in Europe and other locations). We also had contractors that employ personnel at many of our operations, including approximately 21,300 at the Grasberg minerals district in Indonesia, 3,700 at our South America mining operations, 3,700 in North America and 400 in Europe and other locations. Employees represented by unions at December 31, 2016, are listed below, with the number of employees represented and the expiration date of the applicable union agreements:
| Location | Number of Unions | Number of Union- Represented Employees | Expiration Date | |||
| PT-FI – Indonesia | 2 | 9,456 | September 2017 | |||
| Cerro Verde – Peru | 1 | 3,023 | August 2018 | |||
| El Abra – Chile | 2 | 583 | April 2020 | |||
| Atlantic Copper – Spain | 2 | 422 | December 2015 | a | ||
| Kokkola - Finland | 3 | 409 | November 2017 | |||
| Rotterdam – The Netherlands | 1 | 61 | September 2018 | |||
| Stowmarket – United Kingdom | 1 | 39 | May 2017 |
| a. | The Collective Labor Agreement between Atlantic Copper and its workers' unions expired in December 2015, but has been extended through December 2017 by mutual agreement from both parties in accordance with Spanish law. |
Refer to Item 1A. "Risk Factors" for further information on labor matters.
ENVIRONMENTAL AND RECLAMATION MATTERS
The cost of complying with environmental laws is fundamental to and a substantial cost of our business. For information about environmental regulation, litigation and related costs, refer to Item 1A. “Risk Factors” and Notes 1 and 12.
COMPETITION
The top 10 producers of copper comprise approximately half of total worldwide mined copper production. We currently rank second among those producers, with approximately nine percent of estimated total worldwide mined copper production. Our competitive position is based on the size, quality and grade of our ore bodies and our ability to manage costs compared with other producers. We have a diverse portfolio of mining operations with varying ore grades and cost structures. Our costs are driven by the location, grade and nature of our ore bodies, and the level of input costs, including energy, labor and equipment. The metals markets are cyclical, and our ability to maintain our competitive position over the long term is based on our ability to acquire and develop quality deposits, hire and retain a skilled workforce, and to manage our costs.
MINING OPERATIONS
Following are maps and descriptions of our mining operations in North America (including both copper and molybdenum operations), South America and Indonesia.
North America
In the U.S., most of the land occupied by our copper and molybdenum mines, concentrators, SX/EW facilities, smelter, refinery, rod mills, molybdenum roasters and processing facilities is generally owned by us or is located on unpatented mining claims owned by us. Certain portions of our Bagdad, Sierrita, Miami, Chino, Tyrone, Henderson and Climax operations are located on government-owned land and are operated under a Mine Plan of Operations or other use permit. Various federal and state permits or leases on government land are held for purposes incidental to mine operations.
In response to market conditions, beginning in the second half of 2015, we revised operating plans for our North America copper mines to reduce operating and capital costs and adjust production to reflect market conditions. In addition, we operated the Henderson molybdenum mine at reduced rates, resulting in an approximate 65 percent reduction in its annual production volumes. These operating plans will continue to be reviewed and additional adjustments may be made as market conditions warrant.
Morenci
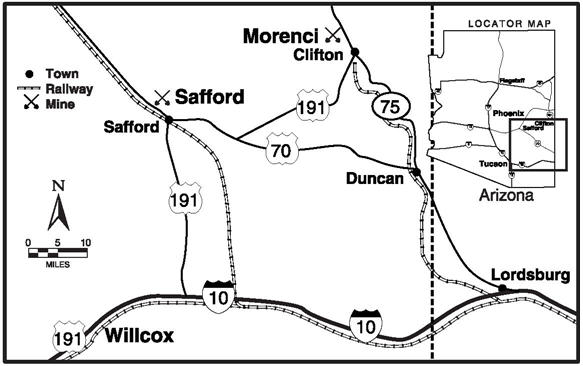
We own a 72 percent undivided interest in Morenci, with the remaining 28 percent owned by Sumitomo Metal Mining Arizona, Inc. (15 percent) and SMM Morenci, Inc. (13 percent). Each partner takes in kind its share of Morenci’s production.
Morenci is an open-pit copper mining complex that has been in continuous operation since 1939 and previously was mined through underground workings. Morenci is located in Greenlee County, Arizona, approximately 50 miles northeast of Safford on U.S. Highway 191. The site is accessible by a paved highway and a railway spur.
The Morenci mine is a porphyry copper deposit that has oxide, secondary sulfide and primary sulfide mineralization. The predominant oxide copper mineral is chrysocolla. Chalcocite is the most important secondary copper sulfide mineral, with chalcopyrite as the dominant primary copper sulfide.
The Morenci operation consists of two concentrators capable of milling 115,000 metric tons of ore per day, which produce copper and molybdenum concentrate; a 68,000 metric ton-per-day, crushed-ore leach pad and stacking system; a low-grade run-of-mine (ROM) leaching system; four SX plants; and three EW tank houses that produce copper cathode. Total EW tank house capacity is approximately 900 million pounds of copper per year. During second-quarter 2015, Morenci’s concentrate leach, direct-electrowinning facility (which was placed on care-and-maintenance status in early 2009) resumed operation. Morenci's available mining fleet consists of one hundred and eleven 236-metric ton haul trucks loaded by 12 shovels with bucket sizes ranging from 47 to 57 cubic meters, which are capable of moving an average of 815,000 metric tons of material per day.
The Morenci mill expansion project, which achieved full rates in second-quarter 2015, expanded mill capacity from 50,000 metric tons of ore per day to approximately 115,000 metric tons of ore per day, which results in incremental annual production of approximately 225 million pounds of copper and an improvement in Morenci's cost structure.
Over the next five years, Morenci's copper production, including our joint venture partner share, is expected to average approximately one billion pounds per year.
Morenci’s production, including our joint venture partner’s share, totaled 1.1 billion pounds of copper and 15 million pounds of molybdenum in 2016, 1.1 billion pounds of copper and 7 million pounds of molybdenum in 2015, and 812 million pounds of copper and less than 1 million pounds of molybdenum in 2014.
Morenci is located in a desert environment with rainfall averaging 13 inches per year. The highest bench elevation is 2,000 meters above sea level, and the ultimate pit bottom is expected to have an elevation of 840 meters above sea level. The Morenci operation encompasses approximately 68,310 acres, comprising 51,170 acres of patented mining claims and other fee lands, 14,420 acres of unpatented mining claims and 2,720 acres of land held by state or federal permits, easements and rights-of-way.
The Morenci operation's electrical power is primarily sourced from Tucson Electric Power Company, Arizona Public Service Company and the Luna Energy facility in Deming, New Mexico. Although we believe the Morenci operation has sufficient water sources to support current operations, we are a party to litigation that may impact our water rights claims or rights to continued use of currently available water supplies, which could adversely affect our water supply for the Morenci operation. Refer to Item 1A. "Risk Factors" and Item 3. “Legal Proceedings” for further discussion.
Bagdad
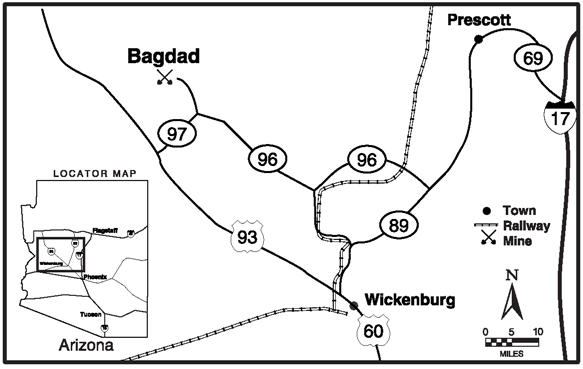
Our wholly owned Bagdad mine is an open-pit copper and molybdenum mining complex located in Yavapai County in west-central Arizona. It is approximately 60 miles west of Prescott and 100 miles northwest of Phoenix. The property can be reached by Arizona Highway 96, which ends at the town of Bagdad. The closest railroad is at Hillside, Arizona, approximately 24 miles southeast on Arizona Highway 96. The open-pit mining operation has been ongoing since 1945, and prior mining was conducted through underground workings.
The Bagdad mine is a porphyry copper deposit containing both sulfide and oxide mineralization. Chalcopyrite and molybdenite are the dominant primary sulfides and are the primary economic minerals in the mine. Chalcocite is the most common secondary copper sulfide mineral, and the predominant oxide copper minerals are chrysocolla, malachite and azurite.
The Bagdad operation consists of a 75,000 metric ton-per-day concentrator that produces copper and molybdenum concentrate, an SX/EW plant that can produce up to 32 million pounds per year of copper cathode from solution generated by low-grade stockpile leaching, and a pressure-leach plant to process molybdenum concentrate. The available mining fleet consists of thirty 235-metric ton haul trucks loaded by six shovels with bucket sizes ranging from 30 to 48 cubic meters, which are capable of moving an average of 250,000 metric tons of material per day.
Bagdad’s production totaled 177 million pounds of copper and 8 million pounds of molybdenum in 2016, 210 million pounds of copper and 9 million pounds of molybdenum in 2015, and 237 million pounds of copper and 9 million pounds of molybdenum in 2014.
Bagdad is located in a desert environment with rainfall averaging 15 inches per year. The highest bench elevation is 1,200 meters above sea level, and the ultimate pit bottom is expected to be 310 meters above sea level. The
Bagdad operation encompasses approximately 21,750 acres, comprising 21,150 acres of patented mining claims and other fee lands and 600 acres of unpatented mining claims.
Bagdad receives electrical power from Arizona Public Service Company. We believe the Bagdad operation has sufficient water sources to support current operations.
Safford
Our wholly owned Safford mine has been in operation since 2007 and is an open-pit copper mining complex located in Graham County, Arizona, approximately 8 miles north of the town of Safford and 170 miles east of Phoenix. The site is accessible by paved county road off U.S. Highway 70.
The Safford mine includes two copper deposits that have oxide mineralization overlaying primary copper sulfide mineralization. The predominant oxide copper minerals are chrysocolla and copper-bearing iron oxides with the predominant copper sulfide material being chalcopyrite.
The property is a mine-for-leach project and produces copper cathode. The operation consists of two open pits feeding a crushing facility with a capacity of 103,000 metric tons per day. The crushed ore is delivered to leach pads by a series of overland and portable conveyors. Leach solutions feed a SX/EW facility with a capacity of 240 million pounds of copper per year. A sulfur burner plant is also in operation at Safford, providing a cost-effective source of sulphuric acid used in SX/EW operations. The available mining fleet consists of sixteen 235-metric ton haul trucks loaded by four shovels with bucket sizes ranging from 31 to 34 cubic meters, which are capable of moving an average of 225,000 metric tons of material per day.
Safford’s copper production totaled 230 million pounds in 2016, 202 million pounds in 2015 and 139 million pounds in 2014.
Safford is located in a desert environment with rainfall averaging 10 inches per year. The highest bench elevation is 1,250 meters above sea level, and the ultimate pit bottom is expected to have an elevation of 750 meters above sea level. The Safford operation encompasses approximately 25,000 acres, comprising 21,000 acres of patented lands, 3,950 acres of unpatented lands and 50 acres of land held by federal permit.
The Safford operation’s electrical power is primarily sourced from Tucson Electric Power Company, Arizona Public Service Company and the Luna Energy facility. Although we believe the Safford operation has sufficient water sources to support current operations, we are a party to litigation that may impact our water right claims or rights to continued use of currently available water supplies, which could adversely affect our water supply for the Safford operation. Refer to Item 1A. "Risk Factors" and Item 3. “Legal Proceedings” for further discussion.
Sierrita

Our wholly owned Sierrita mine has been in operation since 1959 and is an open-pit copper and molybdenum mining complex located in Pima County, Arizona, approximately 20 miles southwest of Tucson and 7 miles west of the town of Green Valley and Interstate Highway 19. The site is accessible by a paved highway and by rail.
The Sierrita mine is a porphyry copper deposit that has oxide, secondary sulfide and primary sulfide mineralization. The predominant oxide copper minerals are malachite, azurite and chrysocolla. Chalcocite is the most important secondary copper sulfide mineral, and chalcopyrite and molybdenite are the dominant primary sulfides.
The Sierrita operation includes a 102,000 metric ton-per-day concentrator that produces copper and molybdenum concentrate. Sierrita also produces copper from a ROM oxide-leaching system. Cathode copper is plated at the Twin Buttes EW facility, which has a design capacity of approximately 50 million pounds of copper per year. The Sierrita operation also has molybdenum facilities consisting of a leaching circuit, two molybdenum roasters and a packaging facility. The molybdenum facilities process molybdenum concentrate produced by Sierrita, from our other mines and from third-party sources. The available mining fleet consists of twenty-five 235-metric ton haul trucks loaded by three shovels with bucket sizes ranging from 34 to 56 cubic meters, which are capable of moving an average of 200,000 metric tons of material per day.
Sierrita’s production totaled 162 million pounds of copper and 14 million pounds of molybdenum in 2016, 189 million pounds of copper and 21 million pounds of molybdenum in 2015, and 195 million pounds of copper and 24 million pounds of molybdenum in 2014.
Sierrita is located in a desert environment with rainfall averaging 12 inches per year. The highest bench elevation is 1,160 meters above sea level, and the ultimate pit bottom is expected to be 440 meters above sea level. The Sierrita operation, including the adjacent Twin Buttes site (refer to "Smelting Facilities and Other Mining Properties" for further discussion), encompasses approximately 37,650 acres, comprising 13,300 acres of patented mining claims and 24,350 acres of split-estate lands.
Sierrita receives electrical power through long-term contracts with the Tucson Electric Power Company. Although we believe the Sierrita operation has sufficient water sources to support current operations, we are a party to litigation that may impact our water rights claims or rights to continued use of currently available water supplies, which could adversely affect our water supply for the Sierrita operation. Refer to Item 1A. "Risk Factors" and Item 3. “Legal Proceedings” for further discussion.
Miami
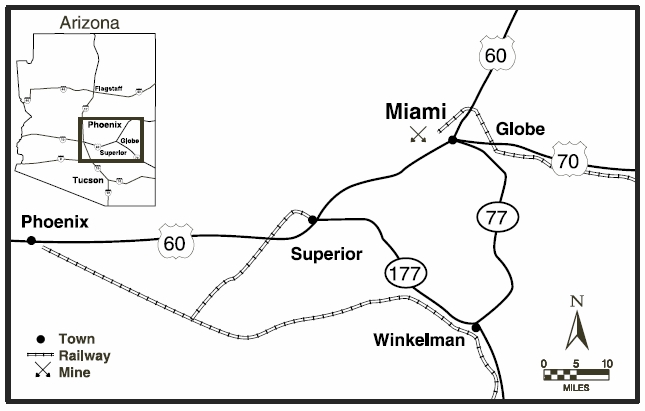
Our wholly owned Miami mine is an open-pit copper mining complex located in Gila County, Arizona, approximately 90 miles east of Phoenix and 6 miles west of the city of Globe on U.S. Highway 60. The site is accessible by a paved highway and by rail.
The Miami mine is a porphyry copper deposit that has leachable oxide and secondary sulfide mineralization. The predominant oxide copper minerals are chrysocolla, copper-bearing clays, malachite and azurite. Chalcocite and covellite are the most important secondary copper sulfide minerals.
Since about 1915, the Miami mining operation had processed copper ore using both flotation and leaching technologies. The design capacity of the SX/EW plant is 200 million pounds of copper per year. During 2015, Miami’s operating plans were revised to suspend mining operations and produce copper through leaching material already placed on stockpiles. Miami’s copper production totaled 25 million pounds in 2016, 43 million pounds in 2015 and 57 million pounds in 2014.
Miami is located in a desert environment with rainfall averaging 18 inches per year. The highest bench elevation is 1,390 meters above sea level, and the pit bottom has an elevation of 810 meters above sea level. The Miami operation encompasses approximately 9,100 acres, comprising 8,750 acres of patented mining claims and other fee lands and 350 acres of unpatented mining claims.
Miami receives electrical power through long-term contracts with the Salt River Project and natural gas through long-term contracts with El Paso Natural Gas as the transporter. We believe the Miami operation has sufficient water sources to support current operations.
Chino and Tyrone
Chino
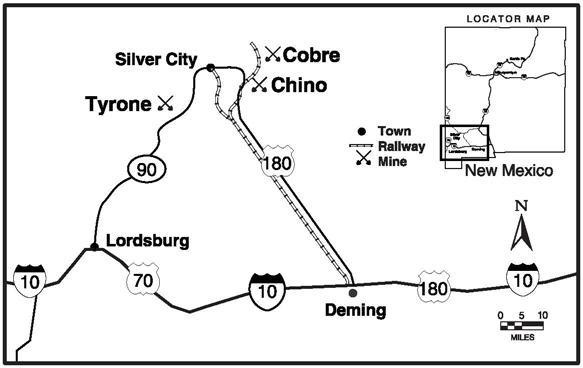
Our wholly owned Chino mine is an open-pit copper mining complex located in Grant County, New Mexico, approximately 15 miles east of the town of Silver City off of State Highway 180. The mine is accessible by paved roads and by rail. Chino has been in operation since 1910.
The Chino mine is a porphyry copper deposit with adjacent copper skarn deposits. There is leachable oxide, secondary sulfide and millable primary sulfide mineralization. The predominant oxide copper mineral is chrysocolla. Chalcocite is the most important secondary copper sulfide mineral, and chalcopyrite and molybdenite the dominant primary sulfides.
The Chino operation consists of a 36,000 metric ton-per-day concentrator that produces copper and molybdenum concentrate, and a 150 million pound-per-year SX/EW plant that produces copper cathode from solution generated by ROM leaching. The available mining fleet consists of thirty-seven 240-metric ton haul trucks loaded by four shovels with bucket sizes ranging from 42 to 48 cubic meters, which are capable of moving an average of 235,000 metric tons of material per day.
Chino's copper production totaled 308 million pounds in 2016, 314 million pounds in 2015 and 250 million pounds in 2014.
Chino is located in a desert environment with rainfall averaging 16 inches per year. The highest bench elevation is 2,250 meters above sea level, and the ultimate pit bottom is expected to be 1,500 meters above sea level. The Chino operation encompasses approximately 118,600 acres, comprising 113,200 acres of patented mining claims and other fee lands and 5,400 acres of unpatented mining claims.
Chino receives power from the Luna Energy facility and from the open market. We believe Chino has sufficient water resources to support current operations.
Tyrone
Our wholly owned Tyrone mine is an open-pit copper mining complex which has been in operation since 1967. It is located in Grant County, New Mexico, approximately 10 miles south of Silver City, New Mexico, along State Highway 90. The site is accessible by paved road and by rail.
The Tyrone mine is a porphyry copper deposit. Mineralization is predominantly secondary sulfide consisting of chalcocite, with leachable oxide mineralization consisting of chrysocolla.
Copper processing facilities consist of a SX/EW operation with a maximum capacity of approximately 100 million pounds of copper cathode per year. The available mining fleet consists of seven 240-metric ton haul trucks loaded by one shovel with a bucket size of 47 cubic meters, which is capable of moving an average of 49,000 metric tons of material per day.
Tyrone’s copper production totaled 76 million pounds in 2016, 84 million pounds in 2015 and 94 million pounds in 2014.
Tyrone is located in a desert environment with rainfall averaging 16 inches per year. The highest bench elevation is 2,000 meters above sea level, and the ultimate pit bottom is expected to have an elevation of 1,500 meters above sea level. The Tyrone operation encompasses approximately 35,200 acres, comprising 18,750 acres of patented mining claims and other fee lands and 16,450 acres of unpatented mining claims.
Tyrone receives electrical power from the Luna Energy facility and from the open market. We believe the Tyrone operation has sufficient water resources to support current operations.
Henderson and Climax

Henderson
Our wholly owned Henderson molybdenum mine has been in operation since 1976 and is located approximately 42 miles west of Denver, Colorado, off U.S. Highway 40. Nearby communities include the towns of Empire, Georgetown and Idaho Springs. The Henderson mill site is located approximately 15 miles west of the mine and is accessible from Colorado State Highway 9. The Henderson mine and mill are connected by a 10-mile conveyor tunnel under the Continental Divide and an additional five-mile surface conveyor. The tunnel portal is located five miles east of the mill.
The Henderson mine is a porphyry molybdenum deposit, with molybdenite as the primary sulfide mineral.
The Henderson operation consists of a large block-cave underground mining complex feeding a concentrator with a current capacity of approximately 32,000 metric tons per day. Henderson has the capacity to produce approximately 35 million pounds of molybdenum per year. The majority of the molybdenum concentrate produced is shipped to our Fort Madison, Iowa, processing facility. The available underground mining equipment fleet consists of seventeen 9-metric ton load-haul-dump (LHD) units and seven 73-metric ton haul trucks, which deliver ore to a gyratory crusher feeding a series of three overland conveyors to the mill stockpiles.
In response to market conditions, the Henderson molybdenum mine operated at reduced rates during 2016. Henderson’s molybdenum production totaled 10 million pounds in 2016, 25 million pounds in 2015 and 30 million pounds in 2014.
The Henderson mine is located in a mountainous region with the main access shaft at 3,180 meters above sea level. The main production levels are currently at elevations of 2,200 and 2,350 meters above sea level. This region experiences significant snowfall during the winter months.
The Henderson mine and mill operations encompass approximately 11,900 acres, comprising 11,850 acres of patented mining claims and other fee lands and a 50-acre easement with the U.S. Forest Service for the surface portion of the conveyor corridor.
Henderson operations receive electrical power through long-term contracts with Xcel Energy and natural gas through long-term contracts with BP Energy Company (with Xcel Energy as the transporter). We believe the Henderson operation has sufficient water resources to support current operations.
Climax
Our wholly owned Climax mine is located 13 miles northeast of Leadville, Colorado, off Colorado State Highway 91 at the top of Fremont Pass. The mine is accessible by paved roads.
The Climax ore body is a porphyry molybdenum deposit, with molybdenite as the primary sulfide mineral.
The Climax open-pit mine includes a 25,000 metric ton-per-day mill facility. Climax has the capacity to produce approximately 30 million pounds of molybdenum per year. The available mining fleet consists of nine 177-metric ton haul trucks loaded by two hydraulic shovels with bucket sizes of 34 cubic meters, which are capable of moving an average of 90,000 metric tons of material per day.
Molybdenum production from Climax totaled 16 million pounds in 2016, 23 million pounds in 2015 and 21 million pounds in 2014.
The Climax mine is located in a mountainous region. The highest bench elevation is approximately 4,050 meters above sea level, and the ultimate pit bottom is expected to have an elevation of approximately 3,100 meters above sea level. This region experiences significant snowfall during the winter months.
The operations encompass approximately 14,350 acres, consisting primarily of patented mining claims and other fee lands.
Climax operations receive electrical power through long-term contracts with Xcel Energy and natural gas through long-term contracts with Andarko Energy and BP Energy Company (with Xcel Energy as the transporter). We believe the Climax operation has sufficient water resources to support current operations.
South America
At our operations in South America, mine properties and facilities are controlled through mining claims or concessions under the general mining laws of the relevant country. The claims or concessions are owned or controlled by the operating companies in which we or our subsidiaries have a controlling ownership interest. Roads, power lines and aqueducts are controlled by easements.
Cerro Verde

We have a 53.56 percent ownership interest in Cerro Verde, with the remaining 46.44 percent held by SMM Cerro Verde Netherlands B.V. (21.0 percent), Compañia de Minas Buenaventura S.A.A. (19.58 percent) and other stockholders whose shares are publicly traded on the Lima Stock Exchange (5.86 percent).
Cerro Verde is an open-pit copper and molybdenum mining complex that has been in operation since 1976 and is located 20 miles southwest of Arequipa, Peru. The site is accessible by paved highway. A majority of Cerro Verde’s copper cathode production is sold locally, and the remaining copper cathode and concentrate production are transported approximately 70 miles by truck and by rail to the Port of Matarani for shipment to international markets.
The Cerro Verde mine is a porphyry copper deposit that has oxide, secondary sulfide and primary sulfide mineralization. The predominant oxide copper minerals are brochantite, chrysocolla, malachite and copper “pitch.” Chalcocite and covellite are the most important secondary copper sulfide minerals. Chalcopyrite and molybdenite are the dominant primary sulfides.
Cerro Verde’s operation consists of an open-pit copper mine, a 360,000 metric ton-per-day concentrator and SX/EW leaching facilities. Leach copper production is derived from a 39,000 metric ton-per-day crushed leach facility and a ROM leach system. This SX/EW leaching operation has a capacity of approximately 200 million pounds of copper per year.
The Cerro Verde expansion project, which commenced operations in September 2015, achieved capacity operating rates during first-quarter 2016. Cerro Verde's expanded operations benefit from its large-scale, long-lived reserves and cost efficiencies. The project expanded the concentrator facilities from 120,000 metric tons of ore per day to 360,000 metric tons of ore per day.
The available fleet consists of eleven 290-metric ton haul trucks and ninety 230-metric ton haul trucks loaded by nine electric shovels with bucket sizes ranging in size from 33 to 57 cubic meters and two hydraulic shovels with a bucket size of 21 cubic meters. This fleet is capable of moving an average of approximately 735,000 metric tons of material per day.
Cerro Verde’s production totaled 1.1 billion pounds of copper and 21 million pounds of molybdenum in 2016, 545 million pounds of copper and 7 million pounds of molybdenum in 2015, and 500 million pounds of copper and 11 million pounds of molybdenum in 2014.
Cerro Verde is located in a desert environment with rainfall averaging 1.5 inches per year and is in an active seismic zone. The highest bench elevation is 2,750 meters above sea level, and the ultimate pit bottom is expected to be 1,570 meters above sea level. The Peruvian general mining law and Cerro Verde's mining stability agreement grant the surface rights of mining concessions located on government land. Additional government land if obtained prior to 1997, must be leased or purchased. Cerro Verde has a mining concession covering approximately 157,000 acres, including 14,500 acres rented from the Regional Government of Arequipa, plus 71 acres of owned property, and 80 acres of rights-of-way outside the mining concession area.
Cerro Verde receives electrical power under long-term contracts with Kallpa Generación SA, ElectroPeru and Engie Energia Peru S.A.
Water for our Cerro Verde processing operations comes from renewable sources through a series of storage reservoirs on the Rio Chili watershed that collect water primarily from seasonal precipitation. In 2015, Cerro Verde completed the construction of a wastewater treatment plant that intercepts raw sewage that would otherwise be discharged into the Rio Chili and processes it for both use at the Cerro Verde mine and for recharge of treated water into the Rio Chili. We believe the Cerro Verde operation has sufficient water resources to support current operations. For further discussion of risks associated with the availability of water, see Item 1A. “Risk Factors.”
El Abra
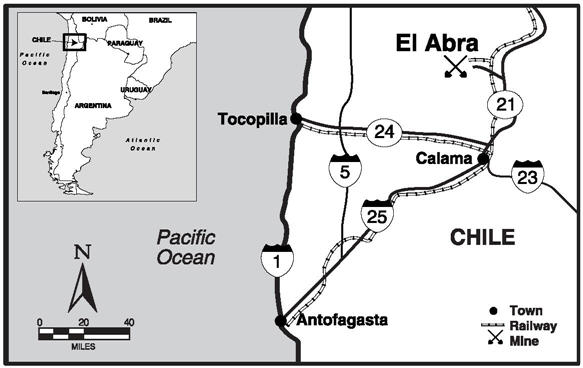
We own a 51 percent interest in El Abra, and the remaining 49 percent interest is held by the state-owned copper enterprise Corporación Nacional del Cobre de Chile (CODELCO).
El Abra is an open-pit copper mining complex that has been in operation since 1996 and is located 47 miles north of Calama in Chile’s El Loa province, Region II. The site is accessible by paved highway and by rail.
The El Abra mine is a porphyry copper deposit that has sulfide and oxide mineralization. The predominant primary sulfide copper minerals are bornite and chalcopyrite. There is a minor amount of secondary sulfide mineralization
as chalcocite. The oxide copper minerals are chrysocolla and pseudomalachite. There are lesser amounts of copper-bearing clays and tenorite.
The El Abra operation consists of an open-pit copper mine and a SX/EW facility with a capacity of 500 million pounds of copper cathode per year from a 125,000 metric ton-per-day crushed leach circuit and a similar-sized ROM leaching operation. The available fleet consists of thirty-six 220-metric ton haul trucks loaded by four shovels with buckets ranging in size from 34 to 63 cubic meters, which are capable of moving an average of 214,000 metric tons of material per day.
In response to market conditions, in the second half of 2015, we adjusted operations at El Abra to reduce mining and stacking rates by approximately 50 percent to achieve lower operating and labor costs, defer capital expenditures and extend the life of the existing operations. El Abra’s copper production totaled 220 million pounds in 2016, 324 million pounds in 2015 and 367 million pounds in 2014.
We continue to evaluate a potential large-scale milling operation at El Abra to process additional sulfide material and to achieve higher recoveries. Exploration results in recent years at El Abra indicate a significant sulfide resource, which could potentially support a major mill project. Future investments will be dependent on technical studies, economic factors and market conditions.
El Abra is located in a desert environment with rainfall averaging less than one inch per year and is in an active seismic zone. The highest bench elevation is 4,180 meters above sea level, and the ultimate pit bottom is expected to be 3,430 meters above sea level. El Abra controls a total of approximately 151,300 acres of mining claims covering the ore deposit, stockpiles, process plant, and water wellfield and pipeline. In addition, El Abra has land surface rights for the road between the processing plant and the mine, the water wellfield, power transmission lines and for the water pipeline from the Salar de Ascotán aquifer.
El Abra currently receives electrical power under a long-term contract with Engie Energia Chile S.A. Water for our El Abra processing operations comes from the continued pumping of groundwater from the Salar de Ascotán aquifer pursuant to regulatory approval. We believe El Abra has sufficient water rights and regulatory approvals to support current operations. For a discussion of risks associated with the availability of water, refer to Item 1A. “Risk Factors.”
Indonesia

Ownership. PT-FI is a limited liability company organized under the laws of the Republic of Indonesia. We directly own 81.28 percent of the outstanding common stock of PT-FI and indirectly own 9.36 percent through our wholly owned subsidiary, PT Indocopper Investama; the Indonesian government owns the remaining 9.36 percent.
PT-FI has an unincorporated joint venture with Rio Tinto, under which Rio Tinto has a 40 percent interest in certain assets and future production exceeding specified annual amounts of copper, gold and silver through 2022 in Block A of PT-FI's Contract of Work (COW), and after 2022, a 40 percent interest in all production from Block A. The Block A area is where all of PT-FI's proven and probable mineral reserves and all of its current mining operations are located. Refer to Note 3 for further discussion of the joint venture agreement.
Contract of Work. PT-FI conducts its current exploration and mining operations in Indonesia through a COW with the Indonesian government. The COW governs our rights and obligations relating to taxes, exchange controls, royalties, repatriation and other matters, and was concluded pursuant to the 1967 Foreign Capital Investment Law, which expresses Indonesia’s foreign investment policy and provides basic guarantees of remittance rights and protection against nationalization, a framework for economic incentives and basic rules regarding other rights and obligations of foreign investors. Specifically, the COW provides that the Indonesian government will not nationalize or expropriate PT-FI’s mining operations. Any disputes regarding the provisions of the COW are subject to international arbitration.
PT-FI’s original COW was entered into in 1967 and was replaced by the current COW in 1991. The initial term of the current COW expires in 2021, but the COW explicitly provides that it can be extended for two 10-year periods subject to Indonesian government approval, which pursuant to the COW cannot be withheld or delayed unreasonably. The COW allows us to conduct exploration, mining and production activities in the 24,700-acre Block A area. Under the COW, PT-FI also conducts exploration activities in the Block B area currently covering 502,000 acres.
Under the COW, PT-FI pays royalties on copper, gold and silver in the concentrate it sells (refer to Note 13 for further discussion of the royalty rates). A large part of the mineral royalties under Indonesian government regulations is designated to the provinces from which the minerals are extracted. In connection with its fourth concentrator mill expansion completed in 1998, PT-FI agreed to pay the Indonesian government additional royalties, which were not required by the COW, to provide further support to the local governments and to the people of the Indonesian province of Papua. PT-FI’s royalties totaled $131 million in 2016, $114 million in 2015 and $115 million in 2014.
Regulatory Matters. PT-FI continues to seek approval from Indonesian authorities for the export of its copper concentrate, consistent with its rights under the COW.
In January 2014, the Indonesian government published regulations that among other things imposed a progressive export duty on copper concentrate and restricts concentrate exports after January 12, 2017. Despite PT-FI’s rights under its COW to export concentrate without the payment of duties, PT-FI was unable to obtain administrative approval for exports and operated at approximately half of its capacity from mid-January 2014 through July 2014.
In July 2014, PT-FI and the Indonesian government entered into a Memorandum of Understanding (MOU) in which, subject to concluding an agreement to extend PT-FI's operations beyond 2021 on acceptable terms, PT-FI agreed to construct new smelter capacity in Indonesia and to divest an additional 20.64 percent interest in PT-FI at fair market value. Under the MOU, PT-FI provided a $115 million assurance bond to support its commitment for smelter development, agreed to increase royalty rates and agreed to pay export duties until certain smelter development milestones were met. The MOU also anticipated an amendment of the COW within six months to address other matters; however, no terms of the COW other than those relating to the smelter bond, increased royalties and export duties were changed. In January 2015, the MOU was extended to July 25, 2015, and it expired on that date. The Indonesian government has continued to impose the increased royalty rates, export duties and smelter assurance bond. PT-FI paid export duties totaling $95 million in 2016, $109 million in 2015 and $77 million in 2014.
In October 2015, the Indonesian government provided a letter of assurance to PT-FI indicating that it would revise regulations allowing it to approve the extension of PT-FI's operations beyond 2021, and provide the same rights and the same level of legal and fiscal certainty provided under the current COW.
In January and February 2017, the Indonesian government issued new regulations to address exports of unrefined metals, including copper concentrate and anode slimes, and other matters related to the mining sector. The new regulations permit the continuation of copper concentrate exports for a five-year period through January 2022, subject to various conditions, including conversion from a contract of work to a special operating license (known as an IUPK, which provides virtually none of the protections of a contract of work), commitment to completion of smelter construction in five years and payment of export duties to be determined by the Ministry of Finance. In addition, the new regulations enable application for extension of operating rights five years before expiration of the IUPK and require foreign IUPK holders to divest 51 percent to Indonesian interests no later than the tenth year of production. Export licenses would be valid for one-year periods, subject to review every six months, depending on smelter construction progress.
The January 2017 regulations permit the export of anode slimes, which is necessary for PT Smelting (PTFI’s 25-percent-owned copper smelter and refinery located in Gresik, Indonesia) to continue operating. PT Smelting is seeking to renew its anode slimes export license; however, we cannot predict when PT Smelting’s anode slimes export license may be renewed. In addition, a labor strike at PT Smelting has resulted in a shutdown of its operations since January 19, 2017. Although PT-FI is taking near-term actions to reduce production to match available processing capacity at PT Smelting, or approximately 40 percent of PT-FI's concentrate production capacity, on February 10, 2017, PT-FI was forced to suspend production as a result of limited storage capacity at PT-FI and PT Smelting. PT Smelting has indicated that it expects to resume operations in March 2017. Delays in PT Smelting obtaining its anode slimes export license or restarting operations could further impact PT-FI's operations.
Following the issuance of the January and February 2017 regulations and discussions with the government, PT-FI advised the Indonesian government that it was prepared to convert its COW to an IUPK, subject to obtaining an investment stability agreement providing equivalent rights with the same level of legal and fiscal certainty enumerated under its COW, and provided that the COW would remain in effect until it is replaced by a mutually satisfactory alternative. PT-FI also committed to commence construction of a new smelter during a five-year timeframe after approval of the extension of its long-term operating rights.
Under its COW, PT-FI has specified rights to export copper concentrate without restriction or payment of export duties. PT-FI has requested that concentrate exports be permitted without the imposition of export duties while the new license and stability agreement are negotiated. The Indonesia government has indicated that in order to export its concentrate production, PT-FI would be required to immediately convert to an IUPK, forgo its current rights to fiscal and legal certainty and commit to a new smelter prior to completing a long-term investment stability agreement. PT-FI has advised the Indonesian government that attempts to enforce the new regulations on PT-FI violates its COW and that it is unwilling to terminate its COW unless replaced by a mutually acceptable form of agreement providing fiscal and legal assurances to support its long-term investment plans in Papua, Indonesia.
As of February 24, 2017, PT-FI has not obtained approval to export concentrate and production remains suspended. PT-FI is taking near-term actions to reduce production to match available processing capacity at PT Smelting, or approximately 40 percent of PT-FI's concentrate production capacity (assuming that PT Smelting's export license is approved and its operations are resumed in March 2017). PT-FI has begun to significantly adjust its cost structure, reduce its workforce and spending with local suppliers, and suspend investments in its underground development projects and new smelter.
On February 17, 2017, pursuant to the COW’s dispute resolution provisions, PT-FI provided formal notice to the Indonesian government of an impending dispute listing the government’s breaches and violations of the COW, which are described in Item 1A. "Risk Factors."
We cannot predict whether or when PT-FI will be able to resume exporting copper concentrate. For each month of delay in obtaining approval to export, PT-FI’s share of production is projected to be reduced by approximately 70 million pounds of copper and 70 thousand ounces of gold. The inability of either PT-FI to export copper concentrate, or PT Smelting to export anode slimes or restart operations, for any extended period of time would lead to the continued suspension of production in Indonesia. We also cannot predict whether PT-FI will be successful in reaching a satisfactory agreement on the terms of PT-FI's long-term mining rights. If PT-FI is unable to reach agreement with the Indonesian government on its long-term mining rights, we may be required to reduce or defer investments in underground development projects.
Refer to Item 1A. "Risk Factors" for further discussion of risks associated with operations in Indonesia.
Grasberg Minerals District. PT-FI operates in the remote highlands of the Sudirman Mountain Range in the province of Papua, Indonesia, which is on the western half of the island of New Guinea. We and our predecessors have been the only operator of exploration and mining activities in Block A since 1967.
The Grasberg minerals district has three operating mines, the Grasberg open pit, the Deep Ore Zone (DOZ) underground mine and the Big Gossan underground mine where operations restarted in fourth-quarter 2016. In addition, in September 2015, PT-FI initiated pre-commercial production at the Deep Mill Level Zone (DMLZ) underground mine. PT-FI also has several projects in progress in the Grasberg minerals district related to the development of the large-scale, long-lived, high-grade underground ore bodies located beneath and nearby the Grasberg open pit, including the Grasberg Block Cave underground mine (refer to MD&A for further discussion). In aggregate, these underground ore bodies are expected to produce large-scale quantities of copper and gold
following the transition from the Grasberg open pit. Our current plans and mineral reserves at PT-FI assume that the COW will be extended beyond 2021 (refer to "Regulatory Matters" above for discussion of matters that could impact PT-FI's development plans).
PT-FI’s production, including our joint venture partner’s share, totaled 1.1 billion pounds of copper and 1.1 million ounces of gold in 2016, 752 million pounds of copper and 1.2 million ounces of gold in 2015 and 651 million pounds of copper and 1.1 million ounces of gold in 2014.
Our principal source of power for all our Indonesian operations is a coal-fired power plant that we built in 1998. Diesel generators supply peaking and backup electrical power generating capacity. A combination of naturally occurring mountain streams and water derived from our underground operations provides water for our operations. Our Indonesian operations are in an active seismic zone and experience average annual rainfall of approximately 200 inches.
Grasberg Open Pit
PT-FI began open-pit mining of the Grasberg ore body in 1990 and is currently mining the final phase of the Grasberg open pit, which contains high copper and gold ore grades. PT-FI expects to mine high-grade ore over the next several quarters prior to transitioning to the Grasberg Block Cave underground mine during 2018. Additionally, production from the ore stockpiles, which are located outside of the pit limits, is expected to continue until early 2019. Production in the open pit is currently at the 3,310- to 3,520-meter elevation level and totaled 44 million metric tons of ore in 2016, which provided 72 percent of PT-FI's 2016 mill feed.
The current open-pit equipment fleet consists of over 500 units. The larger mining equipment directly associated with production includes an available fleet of 132 haul trucks with payloads ranging from 218 to 276 metric tons and 16 shovels with bucket sizes ranging from 17 to 42 cubic meters, which mined an average of 180,500 metric tons of material per day in 2016, 250,400 metric tons per day in 2015 and 298,400 metric tons per day in 2014.
Crushing and conveying systems are integral to the Grasberg mine and provide the capacity to transport more than 250,000 metric tons of ore per day. During 2016, Grasberg's crushing and conveying systems delivered an average of 121,000 metric tons of ore per day to the mill. From January 2016 to May 2016, the Grasberg overburden handling system delivered 1.9 million metric tons of overburden to the overburden stockpiles. The remaining overburden moved by haul trucks averaged 16,100 metric tons per day during 2016. Ore milled from the Grasberg open pit averaged 119,700 metric tons per day in 2016, 115,900 metric tons per day in 2015 and 69,100 metric tons per day in 2014.
DOZ Underground Mine
The DOZ ore body lies vertically below the now depleted Intermediate Ore Zone. PT-FI began production from the DOZ ore body in 1989 using open-stope mining methods, but suspended production in 1991 in favor of production from the Grasberg open pit. Production resumed in September 2000 using the block-cave method and is at the 3,110-meter elevation level.
The DOZ is a mature block-cave mine that previously operated at 80,000 metric tons of ore per day. Current operating rates from the DOZ underground mine are driven by the value of the incremental DOZ ore grade compared to the ore from the Grasberg open pit and ore grade material from the development of the DMLZ and Grasberg Block Cave underground mines. Ore milled from the DOZ underground mine averaged 38,000 metric tons of ore per day in 2016, 43,700 metric tons of ore per day in 2015 and 50,500 metric tons of ore per day in 2014. Production at the DOZ underground mine is expected to continue through 2021 and to ramp up to 60,000 metric tons of ore per day in 2017.
The DOZ mine fleet consists of over 180 pieces of mobile equipment. The primary mining equipment directly associated with production and development includes an available fleet of 46 LHD units and 22 haul trucks. Each production LHD unit typically carries approximately 11 metric tons of ore. Using ore passes and chutes, the LHD units transfer ore into 55-metric ton capacity haul trucks. The trucks dump into two gyratory crushers, and the ore is then conveyed to the surface stockpiles for processing.
The success of the development of the DOZ mine, one of the world’s largest underground mines, provides confidence in the future development of PT-FI’s large-scale, underground ore bodies.
DMLZ Underground Mine
The DMLZ ore body lies below the DOZ underground mine at the 2,590-meter elevation and represents the downward continuation of mineralization in the Ertsberg East Skarn system and neighboring Ertsberg porphyry. In September 2015, PT-FI initiated pre-commercial production at the DMLZ underground mine, which represents ore extracted during the development phase for the purpose of obtaining access to the ore body. Ore milled from the DMLZ underground mine averaged 4,400 metric tons of ore per day in 2016 and 2,900 metric tons per day in 2015. Targeted production rates once the DMLZ underground mine reaches full capacity are expected to approximate 80,000 metric tons of ore per day in 2022. Production at the DMLZ underground mine is expected to continue through 2041.
The DMLZ mine fleet consists of over 210 pieces of mobile equipment, which includes 24 LHD units and 16 haul trucks used in production and development activities.
Big Gossan Underground Mine
Production from the Big Gossan ore body, which restarted in fourth-quarter 2016, is expected to ramp up to 7,000 metric tons of ore per day in 2022. The Big Gossan mine lies underground and adjacent to the current mill site. It is a tabular, near vertical ore body with approximate dimensions of 1,200 meters along strike and 800 meters down dip with varying thicknesses from 20 meters to 120 meters. The mine utilizes a blasthole stoping method with delayed paste backfill. Stopes of varying sizes are mined and the ore dropped down passes to a truck haulage level. Trucks are chute loaded and transport the ore to a jaw crusher. The crushed ore is then hoisted vertically via a two-skip production shaft to a level where it is loaded onto a conveyor belt. The belt carries the ore to one of the main underground conveyors where the ore is transferred and conveyed to the surface stockpiles for processing.
The Big Gossan mine fleet consists of over 71 pieces of mobile equipment, which includes 8 LHD units and 9 haul trucks used in development and production activities.
Description of Ore Bodies. Our Indonesia ore bodies are located within and around two main igneous intrusions, the Grasberg monzodiorite and the Ertsberg diorite. The host rocks of these ore bodies include both carbonate and clastic rocks that form the ridge crests and upper flanks of the Sudirman Range, and the igneous rocks of monzonitic to dioritic composition that intrude them. The igneous-hosted ore bodies (the Grasberg open pit and block cave, and portions of the DOZ block cave) occur as vein stockworks and disseminations of copper sulfides, dominated by chalcopyrite and, to a lesser extent, bornite. The sedimentary-rock hosted ore bodies (portions of the DOZ and all of the Big Gossan) occur as “magnetite-rich, calcium/magnesian skarn” replacements, whose location and orientation are strongly influenced by major faults and by the chemistry of the carbonate rocks along the margins of the intrusions.
The copper mineralization in these skarn deposits is dominated by chalcopyrite, but higher bornite concentrations are common. Moreover, gold occurs in significant concentrations in all of the district’s ore bodies, though rarely visible to the naked eye. These gold concentrations usually occur as inclusions within the copper sulfide minerals, though, in some deposits, these concentrations can also be strongly associated with pyrite.
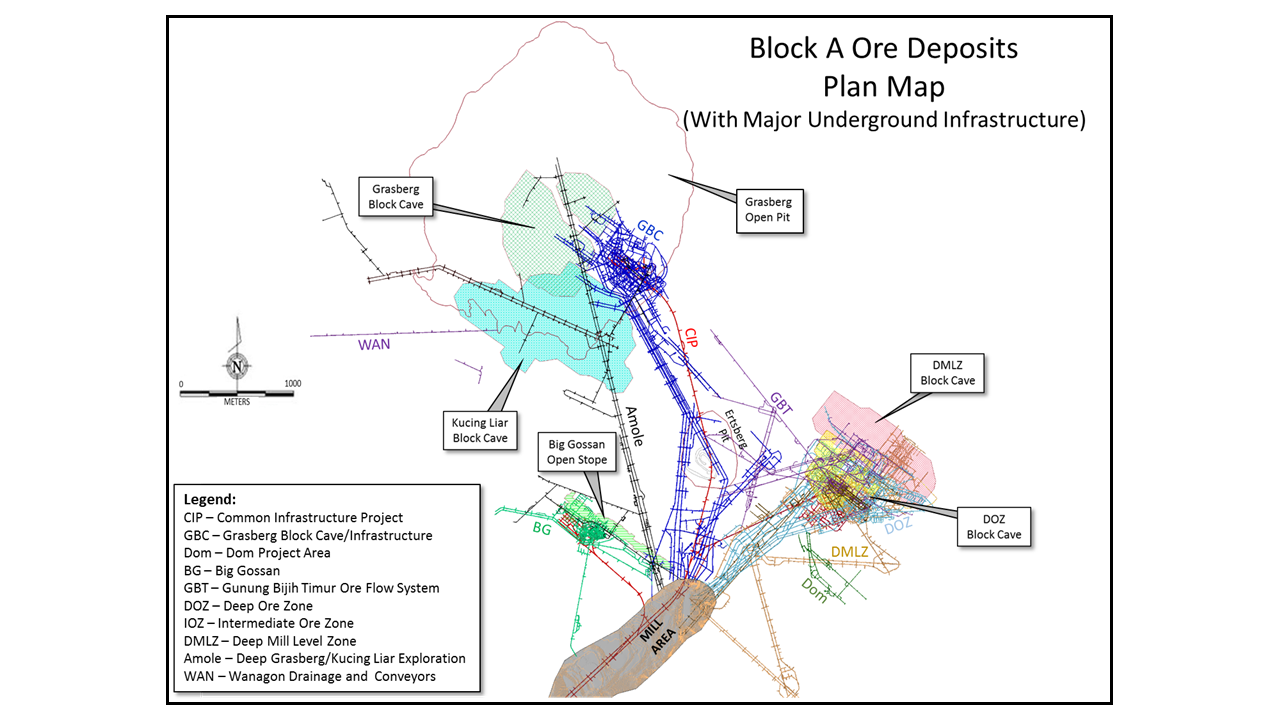
The following diagram indicates the relative elevations (in meters) of our reported Indonesia ore bodies. The following map, which encompasses an area of approximately 42 square kilometers (approximately 16 square miles), indicates the relative positions and sizes of our reported Indonesia ore bodies and their locations.
Smelting Facilities and Other Mining Properties
Atlantic Copper. Our wholly owned Atlantic Copper smelter and refinery is located on land concessions from the Huelva, Spain, port authorities, which are scheduled to expire in 2027.
The design capacity of the smelter is approximately 295,000 metric tons of copper per year, and the refinery has a capacity of 285,000 metric tons of copper per year. Atlantic Copper produced 296,900 metric tons of copper anode
from its smelter and 285,800 metric tons of copper cathode from its refinery in 2016; 293,100 metric tons of copper anode from its smelter and 284,800 metric tons of copper cathode from its refinery in 2015; and 294,100 metric tons of copper anode from its smelter and 283,800 metric tons of copper cathode from its refinery in 2014.
Following is a summary of Atlantic Copper's concentrate purchases from third parties and our copper mining operations for the years ended December 31:
| 2016 | 2015 | 2014 | |||||||
| Third parties | 77 | % | 71 | % | 50 | % | |||
| North America copper mines | 13 | 23 | 21 | ||||||
| South America mining | 7 | 3 | a | 21 | |||||
| Indonesia mining | 3 | 3 | 8 | ||||||
| 100 | % | 100 | % | 100 | % |
| a. | Lower purchases from the South America mines primarily reflect the impact of the November 2014 sale of the Candelaria and Ojos del Salado mines. |
Atlantic Copper's major maintenance turnarounds typically occur approximately every eight years, with shorter-term maintenance turnarounds in the interim. Atlantic Copper completed a 68-day major maintenance turnaround in 2013 and a 13-day shorter-term maintenance in 2015. The next 21-day maintenance turnaround is scheduled for second-quarter 2017.
PT Smelting. PT-FI’s COW required us to construct, or cause to be constructed, a smelter in Indonesia if we and the Indonesian government determined that such a project would be economically viable. In 1995, following the completion of a feasibility study, we entered into agreements relating to the formation of PT Smelting, an Indonesian company, and the construction of the copper smelter and refinery in Gresik, Indonesia. PT Smelting owns and operates the smelter and refinery. PT-FI owns 25 percent of PT Smelting, with the remainder owned by Mitsubishi Materials Corporation (60.5 percent), Mitsubishi Corporation Unimetals Ltd. (9.5 percent) and JX Nippon Mining & Metals Corporation (5 percent).
PT-FI’s contract with PT Smelting requires PT-FI to supply 100 percent of the copper concentrate requirements (at market rates subject to a minimum or maximum treatment charge rate) necessary for PT Smelting to produce 205,000 metric tons of copper annually on a priority basis. An extension of the minimum and maximum treatment charge rate, which expires in April 2017, is currently being negotiated. PT-FI may also sell copper concentrate to PT Smelting at market rates for quantities in excess of 205,000 metric tons of copper annually. PT-FI supplied 88 percent of PT Smelting's concentrate requirements in 2016 and approximately 80 percent in both 2015 and 2014.
PT Smelting produced 255,700 metric tons of copper anode from its smelter and 241,700 metric tons of copper cathode from its refinery in 2016; 199,700 metric tons of copper anode from its smelter and 198,400 metric tons of copper cathode from its refinery in 2015; and 236,900 metric tons of copper anode from its smelter and 231,800 metric tons of copper cathode from its refinery in 2014. Following a temporary suspension in July 2015, PT Smelting operated at approximately 80 percent capacity from September 2015 to November 2015 when required repairs of an acid plant cooling tower that was damaged during the suspension were completed.
PT Smelting's maintenance turnarounds (which range from two weeks to a month to complete) typically are expected to occur approximately every two years, with short-term maintenance turnarounds in the interim. PT Smelting completed a 25-day maintenance turnaround during 2016, and the next major maintenance turnaround is scheduled for 2018.
In January and February 2017, the Indonesian government issued new regulations to address exports of unrefined metals, including copper concentrate and anode slimes, and other matters related to the mining sector. These regulations permit the export of anode slimes, which is necessary for PT Smelting to continue operating. PT Smelting is seeking to renew its anode slimes export license; however, we cannot predict when PT Smelting's anode slimes export license may be renewed. In addition, a labor strike at PT Smelting has resulted in a shutdown of its operations since January 19, 2017. PT Smelting has indicated that it expects to resume operations in March 2017. Refer to Item 1A. “Risk Factors” for further discussion of Indonesia regulatory matters.
Miami Smelter. We own and operate a smelter at our Miami mining operation in Arizona. The smelter has been operating for approximately 100 years and has been upgraded numerous times during that period to implement new technologies, to improve production and to comply with air quality requirements. The Miami smelter is installing emission control equipment that will allow it to operate in compliance with adopted air quality standards (refer to Item 1A. "Risk Factors" for further discussion).
The Miami smelter processes copper concentrate primarily from our North America copper mines. Concentrate processed through the smelter totaled 673,300 metric tons in 2016, 686,700 metric tons in 2015 and 603,700 metric tons in 2014. In addition, because sulphuric acid is a by-product of smelting concentrate, the Miami smelter is also the most significant source of sulphuric acid for our North America leaching operations (refer to Item 1A. "Risk Factors" for further discussion).
Major maintenance turnarounds (which take approximately three weeks to complete) typically occur approximately every 14 months for the Miami smelter, with short-term maintenance turnarounds in the interim. The Miami smelter completed a major maintenance turnaround in third-quarter 2016, and the next major maintenance turnaround is scheduled for second-quarter 2017.
Rod & Refining Operations. Our Rod & Refining operations consist of conversion facilities located in North America, including a refinery in El Paso, Texas; rod mills in El Paso, Texas, Norwich, Connecticut, and Miami, Arizona; and a specialty copper products facility in Bayway, New Jersey. We refine our copper anode production from our Miami smelter at our El Paso refinery. The El Paso refinery has the potential to operate at an annual production capacity of about 900 million pounds of copper cathode, which is sufficient to refine all of the copper anode we produce at our Miami smelter. Our El Paso refinery also produces nickel carbonate, copper telluride and autoclaved slimes material containing gold, silver, platinum and palladium.
Molybdenum Conversion Facilities. We process molybdenum concentrate at our conversion plants in the U.S. and Europe into such products as technical-grade molybdic oxide, ferromolybdenum, pure molybdic oxide, ammonium molybdates and molybdenum disulfide. We operate molybdenum roasters in Sierrita, Arizona; Fort Madison, Iowa; and Rotterdam, the Netherlands, and we operate a molybdenum pressure-leach plant in Bagdad, Arizona. We also produce ferromolybdenum for customers worldwide at our conversion plant located in Stowmarket, United Kingdom.
Freeport Cobalt. In March 2013, we acquired a cobalt chemical refinery in Kokkola, Finland, and the related sales and marketing business which provided direct end-market access for the cobalt hydroxide production at the Tenke mine. The joint venture operates under the name Freeport Cobalt, and we are the operator with an effective 56 percent ownership interest. The remaining effective ownership interest is held by Lundin Mining Corporation (24 percent) and La Générale des Carrières et des Mines (20 percent). The Kokkola refinery has an annual refining capacity of approximately 15,000 metric tons of cobalt.
As further discussed in Note 2, we have agreed to negotiate exclusively with China Molybdenum Co., Ltd. until February 28, 2017, to enter into a definitive agreement to sell our interest in Freeport Cobalt for $100 million.
Other North America Copper Mines. We also have five non-operating copper mines in North America – Ajo, Bisbee, Twin Buttes and Tohono in Arizona, and Cobre in New Mexico – that have been on care-and-maintenance status for several years and would require new or updated environmental studies, new permits, and additional capital investment, which could be significant, to return them to operating status.
Mining Development Projects and Exploration
Capital expenditures for mining operations totaled $1.6 billion (including $1.2 billion for major projects) in 2016, $3.3 billion (including $2.4 billion for major projects) in 2015 and $4.0 billion (including $2.9 billion for major projects) in 2014. Capital expenditures for major projects during the three years ended December 31, 2016, were primarily associated with expansion projects at Morenci and Cerro Verde, and underground development activities at Grasberg. Refer to MD&A for projected capital expenditures for the year 2017. PT-FI has begun suspending investments in its underground development projects, pending resolution of its long-term mining rights. If PT-FI is unable to reach agreement with the Indonesian government on its long-term mining rights, we may be required to further reduce or defer investments in underground development projects.
We have several projects and potential opportunities to expand production volumes, extend mine lives and develop large-scale underground ore bodies. As further discussed in MD&A, our near-term major development projects primarily include the underground development activities in the Grasberg minerals district. Considering the long-
term nature and large size of our development projects, actual costs and timing could vary from estimates. Additionally, in response to market conditions and Indonesian regulatory uncertainty, the timing of our expenditures will continue to be reviewed. As further discussed in "Mining Operations - Indonesia," PT-FI also committed to commence construction of a new smelter during a five year timeframe after obtaining an investment stability agreement providing equivalent rights with the same level of legal and fiscal certainty enumerated under PT-FI's COW, which has not been received as of February 24, 2017. As a result, PT-FI has begun suspending investments in its underground development projects and new smelter. Refer to Item 1A. "Risk Factors" for further discussion of Indonesia regulatory matters. We continue to review our mine development and processing plans to maximize the value of our mineral reserves.
We also have an additional long-term underground mine development project in the Grasberg minerals district for the Kucing Liar ore body, which lies on the southern flank of and underneath the southern portion of the Grasberg open pit at the 2,605-meter elevation level. We expect to mine the Kucing Liar ore body using the block-cave method; aggregate capital cost estimates for development of the Kucing Liar ore body are projected to approximate $2.6 billion (which are expected to be made between 2019 and 2031). Additionally, our current mine development plans include approximately $5.7 billion of capital expenditures at our processing facilities to optimize the handling of underground ore types once the Grasberg open-pit operations cease. We expect substantially all of these expenditures to be made between 2019 and 2034. If PT-FI is unable to reach agreement with the Indonesian government on its long-term mining rights, we may be required to reduce or defer investments in underground development projects.
Our mining exploration activities are generally associated with our existing mines focusing on opportunities to expand reserves and resources to support development of additional future production capacity. Exploration results continue to indicate opportunities for significant future potential reserve additions in North and South America. Exploration spending associated with mining operations totaled $44 million in 2016, $96 million in 2015 and $182 million in 2014. Exploration spending is expected to approximate $47 million for the year 2017.
Sources and Availability of Energy, Natural Resources and Raw Materials
Our copper mining operations require significant energy, principally diesel, electricity, coal and natural gas, most of which is obtained from third parties under long-term contracts. Energy represented approximately 20 percent of our copper mine site operating costs in 2016 and included purchases of approximately 214 million gallons of diesel fuel; 8,400 gigawatt hours of electricity at our North and South America copper mining operations (we generate all of our power at our Indonesia mining operation); 780 thousand metric tons of coal for our coal power plant in Indonesia; and 1 million MMBtu (British thermal units) of natural gas at certain of our North America mines. Based on current cost projections, we estimate energy will approximate 20 percent of our copper mine site operating costs in 2017.
Our mining operations also require significant quantities of water for mining, ore processing and related support facilities. The loss of water rights for any of our mines, in whole or in part, or shortages of water to which we have rights, could require us to curtail or shut down mining operations. For a further discussion of risks and legal proceedings associated with the availability of water, refer to Item 1A. “Risk Factors” and Item 3. “Legal Proceedings.”
Sulphuric acid is used in the SX/EW process and is produced as a by-product of the smelting process at our smelters and from our sulfur burners at the Safford mine. Sulphuric acid needs in excess of the sulphuric acid produced by our operations are purchased from third parties. As further discussed in Item 1A. "Risk Factors," if production were to be curtailed at the Miami smelter, we would be required to export concentrate rather than process it ourselves and to purchase sulphuric acid from third parties, thereby increasing our operating costs.
Community and Human Rights
We have adopted policies that govern our working relationships with the communities where we operate and are designed to guide our practices and programs in a manner that respects human rights and the culture of the local people impacted by our operations. We continue to make significant expenditures on community development, education, training and cultural programs, which include:
| • | comprehensive job training programs |
| • | basic education programs |
| • | public health programs, including malaria control and human immunodeficiency virus |
| • | agricultural assistance programs |
| • | small and medium enterprise development programs |
| • | cultural promotion and preservation programs |
| • | clean water and sanitation projects |
| • | community infrastructure development |
| • | charitable donations |
In December 2000, we endorsed the joint U.S. State Department-British Foreign Office Voluntary Principles on Human Rights and Security (Voluntary Principles). We participated in developing these Voluntary Principles with other major natural resource companies and international human rights organizations and they are incorporated into our human rights policy. The Voluntary Principles provide guidelines for our security programs, including interaction with host-government security personnel, private security contractors and our internal security employees.
We completed a corporate level human rights impact assessment in 2014, the results of which were used to evaluate our human rights program, including a review of our human rights policy. In February 2015, we updated our human rights policy to, among other things, reflect our commitment to integrating the United Nations Guiding Principles on Business and Human Rights into our human rights program. We have embarked on a program to plan and conduct site-level human rights impact assessments at operations with higher potential risks. We also participate in a multi-industry human rights working group to gain insight from peer companies and are integrating human rights due diligence into our business practices.
We believe that our social and economic development programs are responsive to the issues raised by the local communities near our areas of operation and help us maintain good relations with the surrounding communities and avoid disruptions of mining operations. As part of our ongoing commitment to sustainable community development, we make significant investments in social programs, including in-kind support and administration, across our global operations. Over the last five years, these investments have averaged $170 million per year. Nevertheless, social and political instability in the areas of our operations may adversely impact our mining operations. Refer to Item 1A. “Risk Factors” for further discussion.
South America. Cerro Verde has provided a variety of community support projects over the years. Following engagements with regional and local governments, civic leaders and development agencies, in 2006, Cerro Verde committed to support the costs for a new potable water treatment plant to serve Arequipa. In addition, an agreement was reached with the Peruvian government for development of a water storage network that was financed by Cerro Verde and a distribution network that was financed by the Cerro Verde Civil Association (the Association). The Association manages contributions made by Cerro Verde for projects that focus on education, training, health, cultural preservation and basic infrastructure.
Cerro Verde reached an agreement with the Regional Government of Arequipa, the National Government, SEDAPAR and other local institutions to allow it to finance, engineer and construct a wastewater treatment plant for the city of Arequipa, which was completed in 2015. The wastewater treatment plant supplements existing water supplies to support Cerro Verde's concentrator expansion and also improves the regional water quality, enhances agriculture products grown in the area and reduces waterborne illnesses. In addition to these projects, Cerro Verde annually makes significant community development investments in the Arequipa region.
Security Matters. Consistent with our operating permits in Peru and our commitment to protect our employees and property, we have taken steps to provide a safe and secure working environment. As part of its security program, Cerro Verde maintains its own internal security department. Both employees and contractors perform functions such as protecting company facilities, monitoring shipments of supplies and products, assisting in traffic control and aiding in emergency response operations. The security department receives human rights and Voluntary Principles training annually. Some contractors assigned to protection of expatriate personnel are armed. These contractors receive training in motivation and defensive driving weekly; human rights and Voluntary Principles monthly; and firearms quarterly. Cerro Verde’s costs for its internal civilian security department totaled $6 million in both 2016 and 2015 and $7 million in 2014.
Cerro Verde, and all businesses and residents of Peru, rely on the Peruvian government for the maintenance of public order, upholding the rule of law and the protection of personnel and property. The Peruvian government is responsible for employing police and military personnel and directing their operations. Since 1997, the Peruvian government has relied on Cerro Verde to provide logistical and infrastructure support and assistance for these necessary services because of the limited resources of the Peruvian government. Cerro Verde’s financial support for the Peruvian government security institutions assigned to the operations area represents a prudent response to its requirements to protect its workforce and property, better ensuring that personnel are properly fed and lodged,
and have the logistical resources to secure Cerro Verde’s operating area. In addition, providing such support reflects our philosophy of responsible corporate citizenship, and is in keeping with our commitment to pursue practices that promote human rights.
Cerro Verde’s share of support costs for the government-provided security approximated $1 million in each of the years 2016, 2015 and 2014. This supplemental support consists of various infrastructure and other costs, such as food, housing, fuel, travel, vehicle repairs, allowances to cover incidental and administrative costs, and community assistance programs conducted by the military and police.
Indonesia. In 1996, PT-FI established the Freeport Partnership Fund for Community Development (the Partnership Fund) through which PT-FI has made available funding and technical assistance to support community development initiatives in the areas of health, education and economic development of the area. PT-FI has committed through 2018 to provide one percent of its annual revenue for the development of the local people in its area of operations through the Partnership Fund. PT-FI recognized $33 million in 2016, $27 million in 2015 and $31 million in 2014 for this commitment.
The Amungme and Kamoro Community Development Organization (Lembaga Pengembangan Masyarakat Amungme dan Kamoro or LPMAK) oversees disbursement of the program funds we contribute to the Partnership Fund. LPMAK is governed by a board of commissioners and a board of directors, which are comprised of representatives from the local Amungme and Kamoro tribal communities, government leaders, church leaders, and one representative of PT-FI on each board. The Amungme and Kamoro people are original inhabitants of the land in our area of operations. In addition to the Partnership Fund, PT-FI annually makes significant investments in public health, education, community infrastructure and economic development.
Security Matters. Consistent with our COW in Indonesia and our commitment to protect our employees and property, we have taken steps to provide a safe and secure working environment. As part of its security program, PT-FI maintains its own internal security department. Both employees and contractors are unarmed and perform functions such as protecting company facilities, monitoring shipments of supplies and products, assisting in traffic control and aiding in emergency response operations. The security department receives human rights training annually.
PT-FI’s share of costs for its internal civilian security department totaled $58 million for both 2016 and 2015 and $57 million for 2014.
PT-FI, and all businesses and residents of Indonesia, rely on the Indonesian government for the maintenance of public order, upholding the rule of law and the protection of personnel and property. The Grasberg minerals district has been designated by the Indonesian government as one of Indonesia’s vital national assets. This designation results in the police, and to a lesser extent, the military, playing a significant role in protecting the area of our operations. The Indonesian government is responsible for employing police and military personnel and directing their operations.
From the outset of PT-FI’s operations, the Indonesian government has looked to PT-FI to provide logistical and infrastructure support and assistance for these necessary services because of the limited resources of the Indonesian government and the remote location of and lack of development in Papua. PT-FI’s financial support for the Indonesian government security institutions assigned to the operations area represents a prudent response to its requirements to protect its workforce and property, better ensuring that personnel are properly fed and lodged, and have the logistical resources to patrol PT-FI’s roads and secure its operating area. In addition, the provision of such support is consistent with PT-FI’s obligations under the COW, reflects our philosophy of responsible corporate citizenship, and is in keeping with our commitment to pursue practices that will promote human rights.
PT-FI’s share of support costs for the government-provided security was $20 million in 2016, $21 million in 2015 and $27 million in 2014. This supplemental support consists of various infrastructure and other costs, such as food, housing, fuel, travel, vehicle repairs, allowances to cover incidental and administrative costs, and community assistance programs conducted by the military and police.
Refer to Item 1A. "Risk Factors" for further discussion of security risks in Indonesia.
Mining Production and Sales Data
| Years Ended December 31, | |||||||||||||||||||||
| Production | Sales | ||||||||||||||||||||
| COPPER (millions of recoverable pounds) | 2016 | 2015 | 2014 | 2016 | 2015 | 2014 | |||||||||||||||
| (FCX’s net interest in %) | |||||||||||||||||||||
| North America | |||||||||||||||||||||
| Morenci (72%)a | 848 | 902 | 691 | 855 | 915 | 680 | |||||||||||||||
| Bagdad (100%) | 177 | 210 | 237 | 180 | 222 | 240 | |||||||||||||||
| Safford (100%) | 230 | 202 | 139 | 229 | 198 | 142 | |||||||||||||||
| Sierrita (100%) | 162 | 189 | 195 | 162 | 196 | 196 | |||||||||||||||
| Miami (100%) | 25 | 43 | 57 | 27 | 46 | 60 | |||||||||||||||
| Chino (100%) | 308 | 314 | 250 | 308 | 319 | 243 | |||||||||||||||
| Tyrone (100%) | 76 | 84 | 94 | 75 | 89 | 96 | |||||||||||||||
| Other (100%) | 5 | 3 | 7 | 5 | 3 | 7 | |||||||||||||||
| Total North America | 1,831 | 1,947 | 1,670 | 1,841 | 1,988 | 1,664 | |||||||||||||||
| South America | |||||||||||||||||||||
| Cerro Verde (53.56%) | 1,108 | 545 | 500 | 1,105 | 544 | 501 | |||||||||||||||
| El Abra (51%) | 220 | 324 | 367 | 227 | 327 | 366 | |||||||||||||||
| Candelaria/Ojos del Salado (80%)b | — | — | 284 | — | — | 268 | |||||||||||||||
| Total South America | 1,328 | 869 | 1,151 | 1,332 | 871 | 1,135 | |||||||||||||||
| Indonesia | |||||||||||||||||||||
| Grasberg (90.64%)c | 1,063 | 752 | 636 | 1,054 | 744 | 664 | |||||||||||||||
| Consolidated - continuing operations | 4,222 | 3,568 | 3,457 | 4,227 | d | 3,603 | d | 3,463 | d | ||||||||||||
| Discontinued operationse | 425 | 449 | 447 | 424 | 467 | 425 | |||||||||||||||
| Total | 4,647 | 4,017 | 3,904 | 4,651 | 4,070 | 3,888 | |||||||||||||||
| Less noncontrolling interests | 909 | 680 | 725 | 910 | 688 | 715 | |||||||||||||||
| Net | 3,738 | 3,337 | 3,179 | 3,741 | 3,382 | 3,173 | |||||||||||||||
| Average realized price per pound (continuing operations) | $ | 2.28 | $ | 2.42 | $ | 3.09 | |||||||||||||||
| GOLD (thousands of recoverable ounces) | |||||||||||||||||||||
| North America (100%) | 27 | 25 | 12 | 25 | 23 | 13 | |||||||||||||||
| South America (80%)b | — | — | 72 | — | — | 67 | |||||||||||||||
| Indonesia (90.64%)c | 1,061 | 1,232 | 1,130 | 1,054 | 1,224 | 1,168 | |||||||||||||||
| Consolidated | 1,088 | 1,257 | 1,214 | 1,079 | 1,247 | 1,248 | |||||||||||||||
| Less noncontrolling interests | 99 | 115 | 120 | 99 | 115 | 123 | |||||||||||||||
| Net | 989 | 1,142 | 1,094 | 980 | 1,132 | 1,125 | |||||||||||||||
| Average realized price per ounce | $ | 1,238 | $ | 1,129 | $ | 1,231 | |||||||||||||||
| MOLYBDENUM (millions of recoverable pounds) | |||||||||||||||||||||
| Henderson (100%) | 10 | 25 | 30 | N/A | N/A | N/A | |||||||||||||||
| Climax (100%) | 16 | 23 | 21 | N/A | N/A | N/A | |||||||||||||||
| North America copper mines (100%)a | 33 | 37 | 33 | N/A | N/A | N/A | |||||||||||||||
| Cerro Verde (53.56%) | 21 | 7 | 11 | N/A | N/A | N/A | |||||||||||||||
| Consolidated | 80 | 92 | 95 | 74 | 89 | 95 | |||||||||||||||
| Less noncontrolling interest | 9 | 3 | 5 | 6 | 4 | 5 | |||||||||||||||
| Net | 71 | 89 | 90 | 68 | 85 | 90 | |||||||||||||||
| Average realized price per pound | $ | 8.33 | $ | 8.70 | $ | 12.74 |
| a. | Amounts are net of Morenci’s undivided joint venture partners' interest; effective May 31, 2016, FCX's undivided interest in Morenci was prospectively reduced from 85 percent to 72 percent. |
| b. | In November 2014, we completed the sale of our 80 percent interests in the Candelaria and Ojos del Salado mines. |
| c. | Amounts are net of Grasberg's joint venture partner interest, which varies in accordance with terms of the joint venture agreement (refer to Note 3). Under the joint venture agreement, PT-FI's share of copper production and sales was 100 percent in 2016 and 2015 and 98 percent in 2014. PT-FI's share of gold production and sales was 100 percent in 2016, 2015 and 2014. |
| d. | Consolidated sales volumes exclude purchased copper of 188 million pounds for 2016, 121 million pounds for 2015 and 125 million pounds for 2014. |
| e. | In November 2016, we completed the sale of our interest in TFHL, through which we held an interest in the Tenke mine, which is reported as a discontinued operation for all periods presented (refer to Note 2 for further discussion). |
Mineral Reserves
Recoverable proven and probable reserves have been calculated in accordance with Industry Guide 7 as required by the Securities Exchange Act of 1934. Proven and probable reserves may not be comparable to similar information regarding mineral reserves disclosed in accordance with the guidance in other countries. Proven and probable reserves were determined by the use of mapping, drilling, sampling, assaying and evaluation methods generally applied in the mining industry, as more fully discussed below. The term “reserve,” as used in the reserve data presented here, means that part of a mineral deposit that can be economically and legally extracted or produced at the time of the reserve determination. The term “proven reserves” means reserves for which (i) quantity is computed from dimensions revealed in outcrops, trenches, workings or drill holes; (ii) grade and/or quality are computed from the results of detailed sampling; and (iii) the sites for inspection, sampling and measurements are spaced so closely and the geologic character is sufficiently defined that size, shape, depth and mineral content of reserves are well established. The term “probable reserves” means reserves for which quantity and grade are computed from information similar to that used for proven reserves but the sites for sampling are farther apart or are otherwise less adequately spaced. The degree of assurance, although lower than that for proven reserves, is high enough to assume continuity between points of observation.
Our mineral reserve estimates are based on the latest available geological and geotechnical studies. We conduct ongoing studies of our ore bodies to optimize economic values and to manage risk. We revise our mine plans and estimates of recoverable proven and probable mineral reserves as required in accordance with the latest available studies.
Estimated recoverable proven and probable reserves at December 31, 2016, were determined using long-term average prices of $2.00 per pound for copper, $1,000 per ounce for gold and $10 per pound for molybdenum. For the three-year period ended December 31, 2016, LME spot copper prices averaged $2.60 per pound, London PM gold prices averaged $1,226 per ounce and the weekly average price for molybdenum quoted by Metals Week averaged $8.18 per pound.
The recoverable proven and probable reserves presented in the table below represent the estimated metal quantities from which we expect to be paid after application of estimated metallurgical recovery rates and smelter recovery rates, where applicable. Recoverable reserves are that part of a mineral deposit that we estimate can be economically and legally extracted or produced at the time of the reserve determination.
| Recoverable Proven and Probable Mineral Reserves Estimated at December 31, 2016 | |||||||||
| Coppera (billion pounds) | Gold (million ounces) | Molybdenum (billion pounds) | |||||||
| North America | 30.4 | 0.3 | 2.31 | ||||||
| South America | 29.5 | — | 0.64 | ||||||
| Indonesiab | 26.9 | 25.8 | — | ||||||
| Consolidated basisc | 86.8 | 26.1 | 2.95 | ||||||
| Net equity interestd | 70.5 | 23.7 | 2.65 |
| a. | Consolidated recoverable copper reserves include 2.2 billion pounds in leach stockpiles and 1.0 billion pounds in mill stockpiles (refer to “Mill and Leach Stockpiles” for further discussion). |
| b. | Recoverable proven and probable reserves from Indonesia reflect estimates of minerals that can be recovered through the end of 2041. Refer to Note 13 and to Item 1A. "Risk Factors" for discussion of PT-FI's COW and Indonesian regulatory matters. |
| c. | Consolidated reserves represent estimated metal quantities after reduction for joint venture partner interests at the Morenci mine in North America and the Grasberg minerals district in Indonesia (refer to Note 3 for further discussion of our joint ventures). Excluded from the table above were our estimated recoverable proven and probable reserves of 281.8 million ounces of silver in North America, South America and Indonesia, which were determined using a long term average price of $15 per ounce. |
| d. | Net equity interest reserves represent estimated consolidated metal quantities further reduced for noncontrolling interest ownership (refer to Note 3 for further discussion of our ownership in subsidiaries). Excluded from the table above were our estimated recoverable proven and probable reserves of 226.0 million ounces of silver in North America, South America and Indonesia. |
| Recoverable Proven and Probable Mineral Reserves | ||||||||||||||||||||||||||||||||||
| Estimated at December 31, 2016 | ||||||||||||||||||||||||||||||||||
| Proven Reserves | Probable Reserves | |||||||||||||||||||||||||||||||||
| Average Ore Grade | Average Ore Grade | |||||||||||||||||||||||||||||||||
| Processing | Million | Copper | Gold | Moly | Silver | Million | Copper | Gold | Moly | Silver | ||||||||||||||||||||||||
| Method | metric tons | % | g/t | % | g/t | metric tons | % | g/t | % | g/t | ||||||||||||||||||||||||
| North America | ||||||||||||||||||||||||||||||||||
| Morenci | Mill | 591 | 0.43 | — | 0.02 | — | 93 | 0.40 | — | 0.02 | — | |||||||||||||||||||||||
| Crushed leach | 290 | 0.52 | — | — | — | 66 | 0.46 | — | — | — | ||||||||||||||||||||||||
| ROM leach | 1,711 | 0.18 | — | — | — | 523 | 0.16 | — | — | — | ||||||||||||||||||||||||
| Bagdad | Mill | 969 | 0.35 | — | a | 0.02 | 1.46 | 136 | 0.32 | — | a | 0.02 | 1.36 | |||||||||||||||||||||
| ROM leach | 88 | 0.17 | — | — | — | 51 | 0.14 | — | — | — | ||||||||||||||||||||||||
| Safford | Crushed leach | 50 | 0.31 | — | — | — | 25 | 0.31 | — | — | — | |||||||||||||||||||||||
| Sierrita | Mill | 2,220 | 0.23 | — | a | 0.03 | 1.39 | 214 | 0.19 | — | a | 0.02 | 1.10 | |||||||||||||||||||||
| Chino | Mill | 87 | 0.61 | 0.04 | 0.01 | 0.51 | 48 | 0.56 | 0.04 | — | a | 0.49 | ||||||||||||||||||||||
| ROM leach | 73 | 0.28 | — | — | — | 18 | 0.29 | — | — | — | ||||||||||||||||||||||||
| Tyrone | ROM leach | 6 | 0.51 | — | — | — | — | a | 1.23 | — | — | — | ||||||||||||||||||||||
| Henderson | Mill | 63 | — | — | 0.18 | — | 14 | — | — | 0.14 | — | |||||||||||||||||||||||
| Climax | Mill | 146 | — | — | 0.16 | — | 24 | — | — | 0.09 | — | |||||||||||||||||||||||
| Cobreb | Mill | 13 | 0.57 | — | — | — | — | a | 0.49 | — | — | — | ||||||||||||||||||||||
| ROM leach | 72 | 0.30 | — | — | — | 1 | 0.22 | — | — | — | ||||||||||||||||||||||||
| 6,379 | 1,213 | |||||||||||||||||||||||||||||||||
| South America | ||||||||||||||||||||||||||||||||||
| Cerro Verde | Mill | 854 | 0.38 | — | 0.01 | 1.92 | 2,698 | 0.37 | — | 0.01 | 1.88 | |||||||||||||||||||||||
| Crushed leach | 32 | 0.50 | — | — | — | 40 | 0.34 | — | — | — | ||||||||||||||||||||||||
| ROM leach | 11 | 0.21 | — | — | — | 38 | 0.20 | — | — | — | ||||||||||||||||||||||||
| El Abra | Crushed leach | 333 | 0.46 | — | — | — | 86 | 0.43 | — | — | — | |||||||||||||||||||||||
| ROM leach | 9 | 0.19 | — | — | — | 3 | 0.21 | — | — | — | ||||||||||||||||||||||||
| 1,239 | 2,865 | |||||||||||||||||||||||||||||||||
| Indonesia | ||||||||||||||||||||||||||||||||||
| DMLZ | Mill | 73 | 1.00 | 0.83 | — | 4.75 | 366 | 0.88 | 0.74 | — | 4.27 | |||||||||||||||||||||||
| Grasberg open pit | Mill | 20 | 1.81 | 3.65 | — | 5.14 | 36 | 0.95 | 1.25 | — | 2.76 | |||||||||||||||||||||||
| DOZ | Mill | 30 | 0.54 | 0.71 | — | 2.25 | 70 | 0.50 | 0.69 | — | 2.04 | |||||||||||||||||||||||
| Big Gossan | Mill | 18 | 2.33 | 1.00 | — | 14.62 | 42 | 2.13 | 0.96 | — | 12.69 | |||||||||||||||||||||||
| Grasberg Block Caveb | Mill | 374 | 1.14 | 0.89 | — | 4.12 | 590 | 0.96 | 0.70 | — | 3.26 | |||||||||||||||||||||||
| Kucing Liarb | Mill | 152 | 1.34 | 1.16 | — | 7.09 | 256 | 1.22 | 1.06 | — | 5.94 | |||||||||||||||||||||||
| 667 | 1,360 | |||||||||||||||||||||||||||||||||
| Total FCX - 100% Basis | 8,285 | 5,438 | ||||||||||||||||||||||||||||||||
| a. | Grade not shown because of rounding. |
| b. | Would require additional capital investment, which could be significant, to bring into production. |
The reserve table above and the tables on the following pages utilize the abbreviations described below:
| • | g/t – grams per metric ton |
| • | Moly – Molybdenum |
| • | ROM – Run of Mine |
| Recoverable Proven and Probable Mineral Reserves | |||||||||||||||||||||||||||||
| Estimated at December 31, 2016 | |||||||||||||||||||||||||||||
| (continued) | |||||||||||||||||||||||||||||
| Proven and | |||||||||||||||||||||||||||||
| Probable | Average Ore Grade | Recoveriesa | |||||||||||||||||||||||||||
| Processing | Million | Copper | Gold | Moly | Silver | Copper | Gold | Moly | Silver | ||||||||||||||||||||
| Method | metric tons | % | g/t | % | g/t | % | % | % | % | ||||||||||||||||||||
| North America | |||||||||||||||||||||||||||||
| Morenci | Mill | 684 | 0.42 | — | 0.02 | — | 81.4 | — | 49.3 | — | |||||||||||||||||||
| Crushed leach | 356 | 0.51 | — | — | — | 78.5 | — | — | — | ||||||||||||||||||||
| ROM leach | 2,234 | 0.18 | — | — | — | 43.0 | — | — | — | ||||||||||||||||||||
| Bagdad | Mill | 1,105 | 0.34 | — | b | 0.02 | 1.45 | 86.3 | 59.1 | 70.8 | 49.3 | ||||||||||||||||||
| ROM leach | 139 | 0.16 | — | — | — | 27.3 | — | — | — | ||||||||||||||||||||
| Safford | Crushed leach | 75 | 0.31 | — | — | — | 70.4 | — | — | — | |||||||||||||||||||
| Sierrita | Mill | 2,434 | 0.23 | — | b | 0.02 | 1.36 | 83.1 | 59.3 | 79.5 | 49.3 | ||||||||||||||||||
| Chino | Mill | 135 | 0.59 | 0.04 | 0.01 | 0.50 | 82.1 | 86.6 | 40.7 | 87.3 | |||||||||||||||||||
| ROM leach | 91 | 0.28 | — | — | — | 29.2 | — | — | — | ||||||||||||||||||||
| Tyrone | ROM leach | 6 | 0.51 | — | — | — | 67.8 | — | — | — | |||||||||||||||||||
| Henderson | Mill | 77 | — | — | 0.17 | — | — | — | 86.3 | — | |||||||||||||||||||
| Climax | Mill | 170 | — | — | 0.15 | — | — | — | 89.6 | — | |||||||||||||||||||
| Cobrec | Mill | 13 | 0.57 | — | — | — | 81.7 | — | — | — | |||||||||||||||||||
| ROM leach | 73 | 0.30 | — | — | — | 47.7 | — | — | — | ||||||||||||||||||||
| 7,592 | |||||||||||||||||||||||||||||
| South America | |||||||||||||||||||||||||||||
| Cerro Verde | Mill | 3,552 | 0.37 | — | 0.01 | 1.89 | 86.3 | — | 54.3 | 44.8 | |||||||||||||||||||
| Crushed leach | 72 | 0.41 | — | — | — | 79.9 | — | — | — | ||||||||||||||||||||
| ROM leach | 49 | 0.20 | — | — | — | 52.5 | — | — | — | ||||||||||||||||||||
| El Abra | Crushed leach | 419 | 0.46 | — | — | — | 59.0 | — | — | — | |||||||||||||||||||
| ROM leach | 12 | 0.20 | — | — | — | 42.6 | — | — | — | ||||||||||||||||||||
| 4,104 | |||||||||||||||||||||||||||||
| Indonesia | |||||||||||||||||||||||||||||
| DMLZ | Mill | 439 | 0.90 | 0.75 | — | 4.35 | 86.9 | 79.3 | — | 64.3 | |||||||||||||||||||
| Grasberg open pit | Mill | 56 | 1.26 | 2.11 | — | 3.62 | 89.0 | 86.5 | — | 45.2 | |||||||||||||||||||
| DOZ | Mill | 100 | 0.51 | 0.70 | — | 2.10 | 90.2 | 81.9 | — | 67.1 | |||||||||||||||||||
| Big Gossan | Mill | 60 | 2.19 | 0.97 | — | 13.29 | 91.5 | 67.2 | — | 63.7 | |||||||||||||||||||
| Grasberg Block Cavec | Mill | 964 | 1.03 | 0.78 | — | 3.60 | 84.4 | 65.3 | — | 56.9 | |||||||||||||||||||
| Kucing Liarc | Mill | 408 | 1.26 | 1.10 | — | 6.37 | 85.3 | 46.5 | — | 39.5 | |||||||||||||||||||
| 2,027 | |||||||||||||||||||||||||||||
| Total FCX - 100% Basis | 13,723 | ||||||||||||||||||||||||||||
| a. | Recoveries are net of estimated mill and smelter losses. |
| b. | Grade not shown because of rounding. |
| c. | Would require additional capital investment, which could be significant, to bring into production. |
| Recoverable Proven and Probable Mineral Reserves | ||||||||||||||||
| Estimated at December 31, 2016 | ||||||||||||||||
| (continued) | ||||||||||||||||
| Recoverable Reserves | ||||||||||||||||
| Copper | Gold | Moly | Silver | |||||||||||||
| FCX’s | Processing | billion | million | billion | million | |||||||||||
| Interest | Method | lbs. | ozs. | lbs. | ozs. | |||||||||||
| North America | ||||||||||||||||
| Morenci | 72% | Mill | 5.2 | — | 0.15 | — | ||||||||||
| Crushed leach | 3.1 | — | — | — | ||||||||||||
| ROM leach | 3.8 | — | — | — | ||||||||||||
| Bagdad | 100% | Mill | 7.2 | 0.1 | 0.36 | 25.4 | ||||||||||
| ROM leach | 0.2 | — | — | — | ||||||||||||
| Safford | 100% | Crushed leach | 0.3 | — | — | — | ||||||||||
| Sierrita | 100% | Mill | 10.2 | 0.1 | 1.04 | 52.5 | ||||||||||
| Chino | 100% | Mill | 1.4 | 0.1 | 0.01 | 1.9 | ||||||||||
| ROM leach | 0.2 | — | — | — | ||||||||||||
| Tyrone | 100% | ROM leach | 0.1 | — | — | — | ||||||||||
| Henderson | 100% | Mill | — | — | 0.25 | — | ||||||||||
| Climax | 100% | Mill | — | — | 0.52 | — | ||||||||||
| Cobre | 100% | Mill | 0.1 | — | — | — | ||||||||||
| ROM leach | 0.3 | — | — | — | ||||||||||||
| 32.1 | 0.3 | 2.33 | 79.8 | |||||||||||||
| Recoverable metal in stockpilesa | 1.9 | — | 0.02 | — | ||||||||||||
| 100% operations | 34.0 | 0.3 | 2.35 | 79.8 | ||||||||||||
| Consolidatedb | 30.4 | 0.3 | 2.31 | 79.8 | ||||||||||||
| Net equity interestc | 30.4 | 0.3 | 2.31 | 79.8 | ||||||||||||
| South America | ||||||||||||||||
| Cerro Verde | 53.56% | Mill | 25.0 | — | 0.62 | 96.7 | ||||||||||
| Crushed leach | 0.5 | — | — | — | ||||||||||||
| ROM leach | 0.2 | — | — | — | ||||||||||||
| El Abra | 51% | Crushed leach | 2.5 | — | — | — | ||||||||||
| ROM leach | — | d | — | — | — | |||||||||||
| 28.2 | — | 0.62 | 96.7 | |||||||||||||
| Recoverable metal in stockpilesa | 1.3 | — | 0.02 | 2.9 | ||||||||||||
| 100% operations | 29.5 | — | 0.64 | 99.6 | ||||||||||||
| Consolidatedb | 29.5 | — | 0.64 | 99.6 | ||||||||||||
| Net equity interestc | 15.7 | — | 0.34 | 53.4 | ||||||||||||
| Indonesia | ||||||||||||||||
| DMLZ | e | Mill | 7.6 | 8.4 | — | 39.5 | ||||||||||
| Grasberg open pit | e | Mill | 1.4 | 3.3 | — | 2.9 | ||||||||||
| DOZ | e | Mill | 1.0 | 1.8 | — | 4.5 | ||||||||||
| Big Gossan | e | Mill | 2.6 | 1.3 | — | 16.3 | ||||||||||
| Grasberg Block Cave | e | Mill | 18.5 | 15.7 | — | 63.5 | ||||||||||
| Kucing Liar | e | Mill | 9.7 | 6.7 | — | 33.0 | ||||||||||
| 40.8 | 37.2 | — | 159.7 | |||||||||||||
| Recoverable metal in stockpilesa | 0.3 | 0.1 | — | 0.6 | ||||||||||||
| 100% operations | 41.1 | 37.3 | — | 160.3 | ||||||||||||
| Consolidatedb | 26.9 | 25.8 | — | 102.4 | ||||||||||||
| Net equity interestc | 24.4 | 23.4 | — | 92.8 | ||||||||||||
| Total FCX – 100% basis | 104.6 | 37.6 | 2.99 | 339.7 | ||||||||||||
| Total FCX – Consolidated basisb | 86.8 | 26.1 | 2.95 | 281.8 | ||||||||||||
| Total FCX – Net equity interestc | 70.5 | 23.7 | 2.65 | 226.0 |
| a. | Refer to "Mill and Leach Stockpiles" for additional information. |
| b. | Consolidated reserves represent estimated metal quantities after reduction for joint venture partner interests at the Morenci mine in North America and the Grasberg minerals district in Indonesia. Refer to Note 3 for further discussion of our joint ventures. |
| c. | Net equity interest represents estimated consolidated metal quantities further reduced for noncontrolling interest ownership. Refer to Note 3 for further discussion of our ownership in subsidiaries. |
| d. | Amount not shown because of rounding. |
| e. | Our joint venture agreement with Rio Tinto provides that PT-FI will receive cash flow from specified annual amounts of copper, gold and silver through 2022, calculated by reference to its proven and probable reserves as of December 31,1994, and 60 percent of all remaining cash flow. |
In defining our open-pit reserves, we apply a “variable cutoff grade” strategy. The objective of this strategy is to maximize the net present value of our operations. We use a "break-even cutoff grade" to define the in-situ reserves for our underground ore bodies. The break-even cutoff grade is defined for a metric ton of ore as that equivalent copper grade, once produced and sold, that generates sufficient revenue to cover all operating and administrative costs associated with our production.
Our copper mines may contain other commercially recoverable metals, such as gold, molybdenum and silver. We value all commercially recoverable metals in terms of a copper equivalent percentage to determine a single cutoff grade. Copper equivalent percentage is used to express the relative value of multi-metal ores in terms of one metal. The calculation expresses the relative value of the ore using estimates of contained metal quantities, metals prices as used for reserve determination, recovery rates, treatment charges and royalties. Our molybdenum properties use a molybdenum cutoff grade.
The table below shows the minimum cutoff grade by process for each of our existing ore bodies as of December 31, 2016:
| Copper Equivalent Cutoff Grade (Percent) | Molybdenum Cutoff Grade (Percent) | ||||||
| Mill | Crushed or Agitation Leach | ROM Leach | Mill | ||||
| North America | |||||||
| Morenci | 0.27 | 0.17 | 0.03 | — | |||
| Bagdad | 0.20 | — | 0.06 | — | |||
| Safford | — | 0.12 | — | — | |||
| Sierrita | 0.17 | — | — | — | |||
| Chino | 0.23 | — | 0.08 | — | |||
| Tyrone | — | — | 0.11 | — | |||
| Henderson | — | — | — | 0.12 | |||
| Climax | — | — | — | 0.05 | |||
| Cobre | 0.28 | — | 0.10 | — | |||
| South America | |||||||
| Cerro Verde | 0.17 | 0.14 | 0.14 | — | |||
| El Abra | — | 0.10 | 0.08 | — | |||
| Indonesia | |||||||
| DMLZ | 0.85 | — | — | — | |||
| Grasberg open pit | 0.25 | — | — | — | |||
| DOZ | 0.92 | — | — | — | |||
| Big Gossan | 1.52 | — | — | — | |||
| Grasberg Block Cave | 0.78 | — | — | — | |||
| Kucing Liar | 1.01 | — | — | — |
Drill hole spacing data is used by mining professionals, such as geologists and geological engineers, in determining the suitability of data coverage (on a relative basis) in a given deposit type and mining method scenario so as to achieve a given level of confidence in the resource estimate. Drill hole spacing is only one of several criteria necessary to establish resource classification. Drilling programs are typically designed to achieve an optimum sample spacing to support the level of confidence in results that apply to a particular stage of development of a mineral deposit.
The following table sets forth the average drill hole spacing based on average sample distance or drill pattern spacing for proven and probable ore reserves by process type:
| Average Drill Hole Spacing (in Meters) | |||||||||
| Proven | Probable | ||||||||
| Mining Unit | Mill | Leach | Mill | Leach | |||||
| North America | |||||||||
| Morenci | Open Pit | 86 | 86 | 122 | 122 | ||||
| Bagdad | Open Pit | 86 | 86 | 122 | 122 | ||||
| Safford | Open Pit | — | 86 | — | 122 | ||||
| Sierrita | Open Pit | 73 | — | 104 | — | ||||
| Miami | Open Pit | — | 61 | — | 91 | ||||
| Chino | Open Pit | 43 | 86 | 86 | 122 | ||||
| Tyrone | Open Pit | — | 86 | — | 86 | ||||
| Henderson | Block Cave | 47 | — | 96 | — | ||||
| Climax | Open Pit | 61 | — | 91 | — | ||||
| Cobre | Open Pit | 61 | 61 | 91 | 91 | ||||
| South America | |||||||||
| Cerro Verde | Open Pit | 55 | 55 | 100 | 100 | ||||
| El Abra | Open Pit | — | 75 | — | 120 | ||||
| Indonesia | |||||||||
| DMLZ | Block Cave | 21 | — | 65 | — | ||||
| Grasberg open pit | Open Pit | 34 | — | 68 | — | ||||
| DOZ | Block Cave | 23 | — | 58 | — | ||||
| Big Gossan | Open Stope | 12 | — | 35 | — | ||||
| Grasberg Block Cave | Block Cave | 34 | — | 79 | — | ||||
| Kucing Liar | Block Cave | 33 | — | 88 | — |
Production Sequencing
The following chart illustrates our current plans for sequencing and producing our proven and probable reserves at each of our ore bodies and the years in which we currently expect production from each ore body and from related stockpiles. The chart also shows the term of PT-FI's COW. Production volumes are typically lower in the first few years for each ore body as development activities are ongoing and as the mine ramps up to full production and production volumes may also be lower as the mine reaches the end of its life. The sequencing dates shown in the chart below include development activity that results in metal production. The ultimate timing of the start of production from our undeveloped mines is dependent upon a number of factors, including the results of our exploration and development efforts, and may vary from the dates shown below. In addition, we develop our mine plans based on maximizing the net present value from the ore bodies. Significant additional capital expenditures will be required at many of these mines in order to achieve the life-of-mine plans reflected below.

Mill and Leach Stockpiles
Mill and leach stockpiles generally contain lower grade ores that have been extracted from an ore body and are available for copper recovery. Mill stockpiles contain sulfide ores and recovery of metal is through milling, concentrating, smelting and refining or, alternatively, by concentrate leaching. Leach stockpiles contain oxide ores and certain secondary sulfide ores and recovery of metal is through exposure to acidic solutions that dissolve contained copper and deliver it in solution to extraction processing facilities.
Because it is generally impracticable to determine copper contained in mill and leach stockpiles by physical count, reasonable estimation methods are employed. The quantity of material delivered to mill and leach stockpiles is based on surveyed volumes of mined material and daily production records. Sampling and assaying of blasthole cuttings determine the estimated copper grades of material delivered to mill and leach stockpiles.
Expected copper recovery rates for mill stockpiles are determined by metallurgical testing. The recoverable copper in mill stockpiles, once entered into the production process, can be produced into copper concentrate almost immediately.
Expected copper recovery rates for leach stockpiles are determined using small-scale laboratory tests, small- to large-scale column testing (which simulates the production process), historical trends and other factors, including mineralogy of the ore and rock type. Total copper recovery in leach stockpiles can vary significantly from a low
percentage to more than 90 percent depending on several variables, including processing methodology, processing variables, mineralogy and particle size of the rock. For newly placed material on active stockpiles, as much as 80 percent of total copper recovery may be extracted during the first year, and the remaining copper may be recovered over many years. Processes and recovery rates are monitored regularly, and recovery rate estimates are adjusted periodically as additional information becomes available and as related technology changes.
Following are our stockpiles and the estimated recoverable copper contained within those stockpiles as of December 31, 2016:
| Recoverable | ||||||||||||
| Million | Average | Recovery | Copper | |||||||||
| Metric Tons | Ore Grade (%) | Rate (%) | (billion pounds) | |||||||||
| Mill stockpiles | ||||||||||||
| Cerro Verde | 151 | 0.32 | 73.1 | 0.8 | ||||||||
| Grasberg minerals district | 33 | 0.53 | 65.8 | 0.3 | ||||||||
| 184 | 1.1 | |||||||||||
| Leach stockpiles | ||||||||||||
| Morenci | 6,204 | 0.24 | 2.2 | 0.7 | ||||||||
| Bagdad | 499 | 0.24 | 0.9 | — | a | |||||||
| Safford | 237 | 0.47 | 10.9 | 0.3 | ||||||||
| Sierrita | 650 | 0.15 | 10.7 | 0.2 | ||||||||
| Miami | 498 | 0.39 | 2.3 | 0.1 | ||||||||
| Chino | 1,722 | 0.25 | 4.9 | 0.5 | ||||||||
| Tyrone | 1,130 | 0.28 | 1.9 | 0.1 | ||||||||
| Cerro Verde | 436 | 0.50 | 4.8 | 0.2 | ||||||||
| El Abra | 670 | 0.44 | 4.9 | 0.3 | ||||||||
| 12,046 | 2.4 | |||||||||||
| Total FCX - 100% basis | 3.5 | |||||||||||
| Total FCX - Consolidated basisb | 3.2 | |||||||||||
| Total FCX - Net equity interestc | 2.6 | |||||||||||
| a. | Amounts not shown because of rounding. |
| b. | Consolidated stockpiles represent estimated metal quantities after reduction for joint venture partner interests at the Morenci mine in North America and the Grasberg minerals district in Indonesia. Refer to Note 3 for further discussion of our joint ventures. |
| c. | Net equity interest represents estimated consolidated metal quantities further reduced for noncontrolling interest ownership. Refer to Note 3 for further discussion of our ownership in subsidiaries. |
Mineralized Material
We hold various properties containing mineralized material that we believe could be brought into production should market conditions warrant. However, permitting and significant capital expenditures would be required before operations could commence at these properties. Mineralized material is a mineralized body that has been delineated by appropriately spaced drilling and/or underground sampling to support the reported tonnage and average metal grades. Such a deposit cannot qualify as recoverable proven and probable reserves until legal and economic feasibility are confirmed based upon a comprehensive evaluation of development costs, unit costs, grades, recoveries and other material factors. Estimated mineralized materials as presented on the following page were assessed using prices of $2.20 per pound for copper, $1,000 per ounce for gold, $12 per pound for molybdenum and $20 per ounce for silver.
| Mineralized Material | |||||||||||||||||||||||||||
| Estimated at December 31, 2016 | |||||||||||||||||||||||||||
| Milling Material | Leaching Material | Total Mineralized Material | |||||||||||||||||||||||||
| Million | Million | Million | |||||||||||||||||||||||||
| FCX’s | metric | Copper | Gold | Moly | SIlver | metric | Copper | metric | |||||||||||||||||||
| Interest | tons | % | g/t | % | g/t | tons | % | tons | |||||||||||||||||||
| North America | |||||||||||||||||||||||||||
| Morenci | 72% | 551 | 0.30 | — | 0.02 | — | 905 | 0.22 | 1,456 | ||||||||||||||||||
| Bagdad | 100% | 839 | 0.27 | — | a | 0.02 | 1.2 | 4 | 0.19 | 843 | |||||||||||||||||
| Safford | 100% | 226 | 0.63 | 0.12 | — | 2.4 | 116 | 0.26 | 342 | ||||||||||||||||||
| Sierrita | 100% | 1,768 | 0.18 | — | a | 0.02 | 1.1 | — | — | 1,768 | |||||||||||||||||
| Chino | 100% | 146 | 0.48 | 0.03 | 0.01 | 0.4 | 11 | 0.26 | 157 | ||||||||||||||||||
| Tyrone | 100% | — | — | — | — | — | 18 | 0.38 | 18 | ||||||||||||||||||
| Henderson | 100% | 77 | — | — | 0.14 | — | — | — | 77 | ||||||||||||||||||
| Climax | 100% | 414 | — | — | 0.15 | — | — | — | 414 | ||||||||||||||||||
| Cobre | 100% | 30 | 0.46 | 0.07 | — | 1.1 | 4 | 0.29 | 34 | ||||||||||||||||||
| Ajo | 100% | 438 | 0.40 | 0.06 | 0.01 | 0.9 | — | — | 438 | ||||||||||||||||||
| Cochise/Bisbee | 100% | — | — | — | — | — | 255 | 0.46 | 255 | ||||||||||||||||||
| Lone Star | 100% | — | — | — | — | — | 642 | 0.47 | 642 | ||||||||||||||||||
| Sanchez | 100% | — | — | — | — | — | 153 | 0.29 | 153 | ||||||||||||||||||
| Tohono | 100% | 230 | 0.71 | — | — | — | 271 | 0.67 | 501 | ||||||||||||||||||
| Twin Buttes | 100% | 76 | 0.61 | — | 0.04 | 6.3 | 42 | 0.23 | 118 | ||||||||||||||||||
| Christmas | 100% | 203 | 0.40 | 0.05 | — | a | 1.0 | — | — | 203 | |||||||||||||||||
| South America | |||||||||||||||||||||||||||
| Cerro Verde | 53.56% | 972 | 0.36 | — | 0.02 | 1.8 | 8 | 0.34 | 980 | ||||||||||||||||||
| El Abra | 51% | 1,999 | 0.45 | 0.02 | 0.01 | 1.4 | 188 | 0.28 | 2,187 | ||||||||||||||||||
| Indonesia | |||||||||||||||||||||||||||
| Grasberg minerals district | 54.38%b | 2,004 | 0.72 | 0.64 | — | 3.7 | — | — | 2,004 | ||||||||||||||||||
| Total FCX - 100% basis | 9,973 | 2,617 | 12,590 | c | |||||||||||||||||||||||
| Total FCX - Consolidated basisd | 9,017 | 2,363 | 11,380 | ||||||||||||||||||||||||
| Total FCX - Net equity intereste | 7,474 | 2,267 | 9,741 | ||||||||||||||||||||||||
| a. | Amounts not shown because of rounding. |
| b. | FCX's interest in the Grasberg minerals district reflects our 60 percent joint venture ownership further reduced by noncontrolling interest ownership. |
| c. | Excludes mineralized material of 89 million metric tons associated with Kisanfu, which in accordance with accounting guidelines is included in assets held for sale. |
| d. | Consolidated basis represents estimated mineralized materials after reduction for joint venture partner interests in the Morenci mine in North America and the Grasberg minerals district in Indonesia. Refer to Note 3 for further discussion of our joint ventures. |
| e. | Net equity interest represents estimated consolidated mineralized material further reduced for noncontrolling interest ownership. Refer to Note 3 for further discussion of our ownership in subsidiaries. |
OIL AND GAS OPERATIONS
As further discussed in Note 2, during 2016, we completed the sales of our Deepwater GOM, onshore California and Haynesville oil and gas properties, which represented 90 percent of our total proved reserves as of December 31, 2015, and 83 percent of our total oil and natural gas production for the year ended December 31, 2016. In January 2017, we entered into an agreement to sell our property interests in the Madden area in central Wyoming. Following the completion of the Madden transaction, our portfolio of oil and gas assets would include oil and natural gas production onshore in South Louisiana and on the GOM Shelf and oil production offshore California, which had total oil and gas sales volumes of 6.4 MMBOE in 2016.
Acreage
At December 31, 2016, we owned interests in oil and gas leases covering 411 thousand gross acres (218 thousand acres net to our interest), consisting of 325 thousand gross (160 thousand net) of developed acres and 86 thousand gross (58 thousand net) of undeveloped acres. Developed acres are acres spaced or assigned to productive wells and do not include undrilled acreage held by production under the terms of the lease. Undeveloped acres are acres on which wells have not been drilled or completed to a point that would permit the production of commercial quantities of oil or gas, regardless of whether such acreage contains proved reserves.
Exploration and Development Activities
Capital expenditures for our oil and gas operations totaled $1.2 billion in 2016 (including $0.6 billion incurred for GOM and $0.5 billion for changes in capital expenditure accruals), $3.0 billion in 2015 (including $2.6 billion incurred for GOM) and $3.2 billion in 2014 (including $2.6 billion incurred for GOM). During second-quarter 2016, we terminated contracts for deepwater drillships and settled aggregate commitments totaling $1.1 billion for $755 million, of which $540 million was funded with shares of our common stock. We currently have no plans to incur oil and gas exploration expenditures in future periods.
Production and Sales Data
The following table presents summary oil and gas production and sales data for the years ended December 31:
| 2016 | 2015 | 2014 | ||||||||||
| GOMa | ||||||||||||
| Oil (MMBbls) | 22.9 | 22.2 | 19.7 | |||||||||
| Natural gas (Bcf) | 39.0 | b | 35.9 | b | 28.7 | |||||||
| NGLs (MMBbls) | 1.7 | 2.2 | 2.0 | |||||||||
| MMBOE | 31.1 | 30.3 | 26.5 | |||||||||
| Californiac | ||||||||||||
| Oil (MMBbls) | 11.4 | 12.9 | 13.7 | |||||||||
| Natural gas (Bcf) | 1.8 | b | 2.2 | b | 2.4 | b | ||||||
| NGLs (MMBbls) | 0.1 | 0.2 | 0.2 | |||||||||
| MMBOE | 11.8 | 13.5 | 14.3 | |||||||||
| Haynesville/Madden/Otherd | ||||||||||||
| Oil (MMBbls) | 0.1 | 0.2 | 0.2 | |||||||||
| Natural gas (Bcf) | 24.3 | 51.6 | 42.4 | |||||||||
| MMBOE | 4.2 | 8.8 | 7.3 | |||||||||
| Eagle Forde | ||||||||||||
| Oil (MMBbls) | — | — | 6.5 | |||||||||
| Natural gas (Bcf) | — | — | 7.4 | |||||||||
| NGLs (MMBbls) | — | — | 1.0 | |||||||||
| MMBOE | — | — | 8.7 | |||||||||
| Total U.S. oil and gas operations | ||||||||||||
| Oil (MMBbls) | 34.4 | 35.3 | 40.1 | |||||||||
| Natural gas (Bcf) | 65.1 | 89.7 | 80.9 | |||||||||
| NGLs (MMBbls) | 1.8 | 2.4 | 3.2 | |||||||||
| MMBOE | 47.1 | 52.6 | 56.8 | |||||||||
| Average cost per BOE: | ||||||||||||
| Production costsf | $ | 14.51 | $ | 17.14 | $ | 18.00 | ||||||
| Production and ad valorem taxes | 0.68 | 1.45 | 2.08 | |||||||||
| Cash production costsg | $ | 15.19 | $ | 18.59 | $ | 20.08 |
| a. | Includes properties in the Deepwater GOM and on the Shelf. In December 2016, we completed the sale of the Deepwater GOM properties, which had sales volumes of 26.4 MMBOE in 2016. |
| b. | Natural gas sales from GOM are net of fuel used in operations totaling 3.8 Bcf in 2016 and 1.1 Bcf in 2015. Natural gas sales from California are net of fuel used in operations totaling 0.1 Bcf in 2016, 0.6 Bcf in 2015 and 1.2 Bcf in 2014. |
| c. | Includes properties onshore and offshore California. In December 2016, we completed the sale of the onshore California properties, which had sales volumes of 10.2 MMBOE in 2016. |
| d. | In July 2016, we completed the sale of the Haynesville shale assets, which had sales volumes of 2.7 MMBOE in 2016. In January 2017, we entered into an agreement to sell our property interests in the Madden area, which had sales volumes of 1.2 MMBOE in 2016. |
| e. | In June 2014, we completed the sale of Eagle Ford shale assets. |
| f. | Reflects costs incurred to operate and maintain wells and related equipment and facilities. |
| g. | Refer to MD&A for further discussion of cash production costs per BOE and for a reconciliation to production costs reported in our consolidated financial statements. |
Oil and Gas Reserves
At December 31, 2016, our estimated proved developed oil and gas reserves (all of which are located in the U.S.) totaled 18 MMBOE, comprised of 4 MMBbls of oil and NGLs and 87 Bcf of natural gas, and included 7 MMBOE associated with our property interests in the Madden area. We had no proved undeveloped reserves at December 31, 2016. Refer to Note 21 for further discussion of our proved oil and gas reserves.
Drilling Activities
The following table provides the total number of wells that we drilled during the years ended December 31:
| 2016 | 2015 | 2014 | |||||||||||||||||
| Gross | Net | Gross | Net | Gross | Net | ||||||||||||||
| Exploratory | |||||||||||||||||||
| Productive: | |||||||||||||||||||
| Oil | 2 | 2 | 2 | 1 | 25 | 21 | |||||||||||||
| Gas | 1 | — | 31 | 5 | 21 | 2 | |||||||||||||
| Dry | — | — | 4 | 3 | 10 | 7 | |||||||||||||
| 3 | 2 | 37 | 9 | 56 | 30 | ||||||||||||||
| Development | |||||||||||||||||||
| Productive: | |||||||||||||||||||
| Oil | 8 | 5 | 7 | 3 | 184 | 174 | |||||||||||||
| Gas | 1 | — | 17 | 2 | 75 | 10 | |||||||||||||
| Dry | — | — | 2 | 2 | 2 | — | |||||||||||||
| 9 | 5 | 26 | 7 | 261 | 184 | ||||||||||||||
| 12 | 7 | 63 | 16 | 317 | 214 |
In addition to the wells drilled, there was one gross exploratory and one gross development well (zero net exploratory and zero net development wells) in progress at December 31, 2016.
Productive Wells
We had working interests in 120 gross (94 net) active producing oil wells and 640 gross (100 net) active producing natural gas wells at December 31, 2016 (of which 293 gross (40 net) active producing natural gas wells were in the Madden area); 3,060 gross (2,976 net) active producing oil wells and 1,759 gross (213 net) active producing natural gas wells at December 31, 2015; and 3,069 gross (2,991 net) active producing oil wells and 1,710 gross (211 net) active producing natural gas wells at December 31, 2014. One or more completions in the same well bore are considered one well. If any well in which one of the multiple completions is an oil completion, such well is classified as an oil well. At December 31, 2016, we owned interests in two gross wells containing multiple completions.