 filings.tools
Item 6. Selected Financial Data.
300K characters. Original on sec.gov · Markdown
Item 6. Selected Financial Data.
FREEPORT-McMoRan INC.
SELECTED FINANCIAL AND OPERATING DATA
| Years Ended December 31, | ||||||||||||||||||||
| 2016 | 2015 | 2014 | 2013a | 2012 | ||||||||||||||||
| CONSOLIDATED FINANCIAL DATA | (In millions, except per share amounts) | |||||||||||||||||||
| Revenues | $ | 14,830 | b | $ | 14,607 | b | $ | 20,001 | b | $ | 19,331 | b | $ | 16,661 | ||||||
| Operating (loss) incomec | $ | (2,792 | ) | d | $ | (13,512 | ) | e | $ | (298 | ) | f | $ | 4,820 | g | $ | 5,299 | h | ||
| Net (loss) income from continuing operations | $ | (3,832 | ) | i,j | $ | (12,180 | ) | k | $ | (1,022 | ) | i,j | $ | 3,053 | i,j,l | $ | 3,578 | i,j | ||
| Net (loss) income from discontinued operationsm | $ | (193 | ) | $ | 91 | $ | 277 | $ | 388 | $ | 402 | |||||||||
| Net (loss) income attributable to common stock | $ | (4,154 | ) | n | $ | (12,236 | ) | $ | (1,308 | ) | $ | 2,658 | $ | 3,041 | ||||||
| Basic net (loss) income per share attributable to common stock: | ||||||||||||||||||||
| Continuing operations | $ | (2.96 | ) | $ | (11.32 | ) | $ | (1.37 | ) | $ | 2.45 | $ | 2.96 | |||||||
| Discontinued operations | (0.20 | ) | 0.01 | 0.11 | 0.20 | 0.24 | ||||||||||||||
| $ | (3.16 | ) | $ | (11.31 | ) | $ | (1.26 | ) | $ | 2.65 | $ | 3.20 | ||||||||
| Basic weighted-average common shares outstanding | 1,318 | 1,082 | 1,039 | 1,002 | 949 | |||||||||||||||
| Diluted net (loss) income per share attributable to common stock: | ||||||||||||||||||||
| Continuing operations | $ | (2.96 | ) | $ | (11.32 | ) | $ | (1.37 | ) | $ | 2.44 | $ | 2.94 | |||||||
| Discontinued operations | (0.20 | ) | 0.01 | 0.11 | 0.20 | 0.25 | ||||||||||||||
| $ | (3.16 | ) | $ | (11.31 | ) | $ | (1.26 | ) | $ | 2.64 | $ | 3.19 | ||||||||
| Diluted weighted-average common shares outstanding | 1,318 | 1,082 | 1,039 | 1,006 | 954 | |||||||||||||||
| Dividends declared per share of common stock | $ | — | $ | 0.2605 | $ | 1.25 | $ | 2.25 | $ | 1.25 | ||||||||||
| Operating cash flows | $ | 3,729 | $ | 3,220 | $ | 5,631 | $ | 6,139 | $ | 3,774 | ||||||||||
| Capital expenditures | $ | 2,813 | $ | 6,353 | $ | 7,215 | $ | 5,286 | $ | 3,494 | ||||||||||
| At December 31: | ||||||||||||||||||||
| Cash and cash equivalents | $ | 4,245 | $ | 177 | $ | 298 | $ | 1,864 | $ | 3,567 | ||||||||||
| Property, plant, equipment and mine development costs, net | $ | 23,219 | $ | 23,986 | $ | 22,649 | $ | 20,401 | $ | 17,499 | ||||||||||
| Oil and gas properties, net | $ | 74 | $ | 7,093 | $ | 19,274 | $ | 23,359 | $ | — | ||||||||||
| Assets held for sale, including current portiono | $ | 344 | $ | 5,306 | $ | 5,339 | $ | 5,128 | $ | 4,717 | ||||||||||
| Total assets | $ | 37,317 | $ | 46,577 | $ | 58,674 | $ | 63,385 | $ | 35,421 | ||||||||||
| Total debt, including current portion | $ | 16,027 | $ | 20,324 | $ | 18,741 | $ | 20,476 | $ | 3,340 | ||||||||||
| Redeemable noncontrolling interest | $ | — | $ | 764 | $ | 751 | $ | 716 | $ | — | ||||||||||
| Total stockholders’ equity | $ | 6,051 | $ | 7,828 | $ | 18,287 | $ | 20,934 | $ | 17,543 |
The selected consolidated financial data shown above is derived from our audited consolidated financial statements. These historical results are not necessarily indicative of results that you can expect for any future period. You should read this data in conjunction with Items 7. and 7A. Management’s Discussion and Analysis of Financial Condition and Results of Operations and Quantitative and Qualitative Disclosures about Market Risks (MD&A) and Item 8. Financial Statements and Supplementary Data thereto contained in our annual report on Form 10-K for the year ended December 31, 2016. All references to income or losses per share are on a diluted basis, unless otherwise noted. Additionally, in accordance with accounting guidelines, TF Holdings Limited (TFHL), through which we held an interest in the Tenke Fungurume (Tenke) mine until it was sold on November 16, 2016, is reported as discontinued operations for all periods presented.
| a. | Includes the results of oil and gas operations beginning June 1, 2013. |
| b. | Includes net noncash mark-to-market (losses) gains associated with crude oil and natural gas derivative contracts totaling $(41) million ($(41) million to net loss attributable to common stock or $(0.03) per share) in 2016, $(319) million ($(198) million to net loss attributable to common stock or $(0.18) per share) in 2015, $627 million ($389 million to net loss attributable to common stock or $0.37 per share) in 2014 and $(312) million ($(194) million to net income attributable to common stock or $(0.19) per share) for the seven-month period from June 1, 2013, to December 31, 2013. |
| c. | Includes net (credits) charges for adjustments to environmental obligations and related litigation reserves of $(16) million ($(16) million to net loss attributable to common stock or $(0.01) per share) in 2016, $43 million ($28 million to net loss attributable to common stock or $0.03 per share) in 2015, $76 million ($50 million to net loss attributable to common stock or $0.05 per share) in 2014, $19 million ($17 million to net income attributable to common stock or $0.02 per share) in 2013 and $(62) million ($(40) million to net income attributable to common stock or $(0.04) per share) in 2012. |
| d. | The year 2016 includes net charges totaling $4.9 billion to operating loss ($4.8 billion to net loss attributable to common stock or $3.67 per share) consisting of (i) $4.3 billion for impairment of oil and gas properties, (ii) $926 million for drillship settlements/idle |
rig and contract termination costs, (iii) $196 million for other charges at oil and gas operations primarily associated with inventory adjustments, asset impairment and other restructuring charges and (iv) $69 million for charges at mining operations for metals inventory adjustments, PT Freeport Indonesia (PT-FI) asset retirement and Cerro Verde social commitments, partly offset by (v) net gains on sales of assets totaling $649 million mostly associated with the Morenci and Timok transactions, partly offset by estimated losses associated with assets held for sale.
| e. | The year 2015 includes net charges totaling $13.8 billion to operating loss ($12.0 billion to net loss attributable to common stock or $11.10 per share) consisting of (i) $13.1 billion for impairment of oil and gas properties, (ii) $338 million for metals inventory adjustments, (iii) $188 million for charges at oil and gas operations primarily associated with other asset impairment and inventory adjustments, idle/terminated rig costs and prior year mineral tax assessments related to the California properties, (iv) $145 million for charges at mining operations primarily associated with asset impairment, restructuring and other net charges and (v) $18 million for executive retirement benefits, partly offset by (vi) a net gain of $39 million for the sale of our interest in the Luna Energy power facility. |
| f. | The year 2014 includes net charges totaling $4.8 billion to operating loss ($3.6 billion to net loss attributable to common stock or $3.46 per share) consisting of (i) $3.7 billion for impairment of oil and gas properties, (ii) $1.7 billion to impair the full carrying value of goodwill, (ii) $46 million for charges at oil and gas operations primarily associated with idle/terminated rig costs and inventory adjustments and (iv) $6 million for adjustments to molybdenum inventories, partly offset by (v) net gains on sales of assets of $717 million primarily from the sale of our 80 percent interests in the Candelaria and Ojos del Salado mining operations. |
| g. | The year 2013 includes net charges totaling $232 million to operating income ($137 million to net income attributable to common stock or $0.14 per share) consisting of (i) $80 million for transaction and related costs principally associated with oil and gas acquisitions, (ii) $76 million associated with updated mine plans at Morenci that resulted in a loss in recoverable leach stockpiles, (iii) $37 million for restructuring an executive employment arrangement, (iv) $36 million associated with a labor agreement at Cerro Verde and (v) $3 million for adjustments to molybdenum inventories. |
| h. | The year 2012 includes net charges totaling $16 million to operating income ($8 million to net income attributable to common stockholders or $0.01 per share) associated with a labor agreement at Candelaria. |
| i. | Includes after-tax net gains (losses) on exchanges and early extinguishment of debt totaling $26 million ($0.02 per share) in 2016, $3 million (less than $0.01 per share) in 2014, $(28) million ($(0.03) per share) in 2013 and $(149) million ($(0.16) per share) in 2012. |
| j. | As further discussed in "Consolidated Results - Income Taxes" contained in MD&A, amounts include net tax credits (charges) of $370 million ($374 million net of noncontrolling interests or $0.28 per share) in 2016 and $(121) million ($(103) million net of noncontrolling interests or $(0.10) per share) in 2014. In addition, the year 2013 includes a net tax benefit of $199 million ($0.20 per share) for reductions in our valuation allowances resulting from the oil and gas acquisitions and the year 2012 includes a net tax benefit of $205 million ($98 million net of noncontrolling interests or $0.11 per share) primarily for adjustments to Cerro Verde's deferred income taxes. |
| k. | The year 2015 includes a gain of $92 million ($92 million to net loss attributable to common stock or $0.09 per share) related to net proceeds received from insurance carriers and other third parties related to the shareholder derivative litigation settlement. |
| l. | The year 2013 includes a gain of $128 million ($0.13 per share) related to our preferred stock investments in and the subsequent acquisition of McMoRan Exploration Co. |
| m. | Reflects the results of TFHL through November 16, 2016, and includes charges for allocated interest expense associated with the portion of the term loan that was required to be repaid as a result of the sale of our interest in TFHL. The year 2016 also includes a net charge of $198 million for the loss on disposal. |
| n. | The year 2016 includes a gain on redemption of a redeemable noncontrolling interest of $199 million ($0.15 per share) associated with the settlement of a preferred stock obligation at our Plains Offshore Operations Inc. subsidiary. |
| o. | In accordance with accounting guidelines, the assets and liabilities of TFHL, Freeport Cobalt and the Kisanfu exploration project have been presented as held for sale in the consolidated balance sheets for all periods presented. |
FREEPORT-McMoRan INC.
SELECTED FINANCIAL AND OPERATING DATA (Continued)
| Years Ended December 31, | ||||||||||||||||||||
| 2016 | 2015 | 2014 | 2013 | 2012 | ||||||||||||||||
| CONSOLIDATED MINING (CONTINUING OPERATIONS)a,b | ||||||||||||||||||||
| Copper (millions of recoverable pounds) | ||||||||||||||||||||
| Production | 4,222 | 3,568 | 3,457 | 3,669 | 3,315 | |||||||||||||||
| Sales, excluding purchases | 4,227 | 3,603 | 3,463 | 3,632 | 3,312 | |||||||||||||||
| Average realized price per pound | $ | 2.28 | $ | 2.42 | $ | 3.09 | $ | 3.32 | $ | 3.61 | ||||||||||
| Gold (thousands of recoverable ounces) | ||||||||||||||||||||
| Production | 1,088 | 1,257 | 1,214 | 1,250 | 958 | |||||||||||||||
| Sales, excluding purchases | 1,079 | 1,247 | 1,248 | 1,204 | 1,010 | |||||||||||||||
| Average realized price per ounce | $ | 1,238 | $ | 1,129 | $ | 1,231 | $ | 1,315 | $ | 1,665 | ||||||||||
| Molybdenum (millions of recoverable pounds) | ||||||||||||||||||||
| Production | 80 | 92 | 95 | 94 | 85 | |||||||||||||||
| Sales, excluding purchases | 74 | 89 | 95 | 93 | 83 | |||||||||||||||
| Average realized price per pound | $ | 8.33 | $ | 8.70 | $ | 12.74 | $ | 11.85 | $ | 14.26 | ||||||||||
| NORTH AMERICA COPPER MINES | ||||||||||||||||||||
| Operating Data, Net of Joint Venture Interest | ||||||||||||||||||||
| Copper (millions of recoverable pounds) | ||||||||||||||||||||
| Production | 1,831 | 1,947 | 1,670 | 1,431 | 1,363 | |||||||||||||||
| Sales, excluding purchases | 1,841 | 1,988 | 1,664 | 1,422 | 1,351 | |||||||||||||||
| Average realized price per pound | $ | 2.24 | $ | 2.47 | $ | 3.13 | $ | 3.36 | $ | 3.64 | ||||||||||
| Molybdenum (millions of recoverable pounds) | ||||||||||||||||||||
| Production | 33 | 37 | 33 | 32 | 36 | |||||||||||||||
| 100% Operating Data | ||||||||||||||||||||
| Solution extraction/electrowinning (SX/EW) operations | ||||||||||||||||||||
| Leach ore placed in stockpiles (metric tons per day) | 739,200 | 909,900 | 1,005,300 | 1,003,500 | 998,600 | |||||||||||||||
| Average copper ore grade (percent) | 0.31 | 0.26 | 0.25 | 0.22 | 0.22 | |||||||||||||||
| Copper production (millions of recoverable pounds) | 1,224 | 1,134 | 963 | 889 | 866 | |||||||||||||||
| Mill operations | ||||||||||||||||||||
| Ore milled (metric tons per day) | 300,500 | 312,100 | 273,800 | 246,500 | 239,600 | |||||||||||||||
| Average ore grade (percent): | ||||||||||||||||||||
| Copper | 0.47 | 0.49 | 0.45 | 0.39 | 0.37 | |||||||||||||||
| Molybdenum | 0.03 | 0.03 | 0.03 | 0.03 | 0.03 | |||||||||||||||
| Copper recovery rate (percent) | 85.5 | 85.4 | 85.8 | 85.3 | 83.9 | |||||||||||||||
| Copper production (millions of recoverable pounds) | 854 | 972 | 828 | 642 | 592 | |||||||||||||||
| SOUTH AMERICA MININGb | ||||||||||||||||||||
| Copper (millions of recoverable pounds) | ||||||||||||||||||||
| Production | 1,328 | 869 | 1,151 | 1,323 | 1,257 | |||||||||||||||
| Sales | 1,332 | 871 | 1,135 | 1,325 | 1,245 | |||||||||||||||
| Average realized price per pound | $ | 2.31 | $ | 2.38 | $ | 3.08 | $ | 3.30 | $ | 3.58 | ||||||||||
| Molybdenum (millions of recoverable pounds) | ||||||||||||||||||||
| Production | 21 | 7 | 11 | 13 | 8 | |||||||||||||||
| SX/EW operations | ||||||||||||||||||||
| Leach ore placed in stockpiles (metric tons per day) | 151,600 | 193,900 | 275,200 | 274,600 | 229,300 | |||||||||||||||
| Average copper ore grade (percent) | 0.41 | 0.44 | 0.48 | 0.50 | 0.55 | |||||||||||||||
| Copper production (millions of recoverable pounds) | 328 | 430 | 491 | 448 | 457 | |||||||||||||||
| Mill operations | ||||||||||||||||||||
| Ore milled (metric tons per day) | 353,400 | 152,100 | 180,500 | 192,600 | 191,400 | |||||||||||||||
| Average ore grade: | ||||||||||||||||||||
| Copper (percent) | 0.43 | 0.46 | 0.54 | 0.65 | 0.60 | |||||||||||||||
| Molybdenum (percent) | 0.02 | 0.02 | 0.02 | 0.02 | 0.02 | |||||||||||||||
| Copper recovery rate (percent) | 85.8 | 81.5 | 88.1 | 90.9 | 90.1 | |||||||||||||||
| Copper production (millions of recoverable pounds) | 1,000 | 439 | 660 | 875 | 800 |
FREEPORT-McMoRan INC.
SELECTED FINANCIAL AND OPERATING DATA (Continued)
| Years Ended December 31, | ||||||||||||||||||||
| 2016 | 2015 | 2014 | 2013 | 2012 | ||||||||||||||||
| INDONESIA MINING | ||||||||||||||||||||
| Operating Data, Net of Joint Venture Interest | ||||||||||||||||||||
| Copper (millions of recoverable pounds) | ||||||||||||||||||||
| Production | 1,063 | 752 | 636 | 915 | 695 | |||||||||||||||
| Sales | 1,054 | 744 | 664 | 885 | 716 | |||||||||||||||
| Average realized price per pound | $ | 2.32 | $ | 2.33 | $ | 3.01 | $ | 3.28 | $ | 3.58 | ||||||||||
| Gold (thousands of recoverable ounces) | ||||||||||||||||||||
| Production | 1,061 | 1,232 | 1,130 | 1,142 | 862 | |||||||||||||||
| Sales | 1,054 | 1,224 | 1,168 | 1,096 | 915 | |||||||||||||||
| Average realized price per ounce | $ | 1,237 | $ | 1,129 | $ | 1,229 | $ | 1,312 | $ | 1,664 | ||||||||||
| 100% Operating Data | ||||||||||||||||||||
| Ore milled (metric tons per day) | 165,700 | 162,500 | 120,500 | 179,200 | 165,000 | |||||||||||||||
| Average ore grade: | ||||||||||||||||||||
| Copper (percent) | 0.91 | 0.67 | 0.79 | 0.76 | 0.62 | |||||||||||||||
| Gold (grams per metric ton) | 0.68 | 0.79 | 0.99 | 0.69 | 0.59 | |||||||||||||||
| Recovery rates (percent): | ||||||||||||||||||||
| Copper | 91.0 | 90.4 | 90.3 | 90.0 | 88.7 | |||||||||||||||
| Gold | 82.2 | 83.4 | 83.2 | 80.0 | 75.7 | |||||||||||||||
| Production: | ||||||||||||||||||||
| Copper (millions of recoverable pounds) | 1,063 | 752 | 651 | 928 | 695 | |||||||||||||||
| Gold (thousands of recoverable ounces) | 1,061 | 1,232 | 1,132 | 1,142 | 862 | |||||||||||||||
| MOLYBDENUM MINESc | ||||||||||||||||||||
| Molybdenum production (millions of recoverable pounds) | 26 | 48 | 51 | 49 | 41 | |||||||||||||||
| Ore milled (metric tons per day) | 18,300 | 34,800 | 39,400 | 35,700 | 20,800 | |||||||||||||||
| Average molybdenum ore grade (percent) | 0.21 | 0.20 | 0.19 | 0.19 | 0.23 | |||||||||||||||
| OIL AND GAS OPERATIONSd | ||||||||||||||||||||
| Sales Volumes: | ||||||||||||||||||||
| Oil (million barrels) | 34.4 | 35.3 | 40.1 | 26.6 | ||||||||||||||||
| Natural gas (billion cubic feet) | 65.1 | 89.7 | 80.8 | 54.2 | — | |||||||||||||||
| Natural gas liquids (NGLs) (million barrels) | 1.8 | 2.4 | 3.2 | 2.4 | — | |||||||||||||||
| Million barrels of oil equivalents | 47.1 | 52.6 | 56.8 | 38.1 | — | |||||||||||||||
| Average Realizations: | ||||||||||||||||||||
| Oil (per barrel) | $ | 39.13 | $ | 57.11 | $ | 90.00 | $ | 98.32 | — | |||||||||||
| Natural gas (per million British thermal units) | $ | 2.38 | $ | 2.59 | $ | 4.23 | $ | 3.99 | — | |||||||||||
| NGLs (per barrel) | $ | 18.11 | $ | 18.90 | $ | 39.73 | $ | 38.20 | — | |||||||||||
| AFRICA MINING (DISCONTINUED OPERATIONS)e | ||||||||||||||||||||
| Copper (millions of recoverable pounds) | ||||||||||||||||||||
| Production | 425 | 449 | 447 | 462 | 348 | |||||||||||||||
| Sales | 424 | 467 | 425 | 454 | 336 | |||||||||||||||
| Average realized price per pound | $ | 2.10 | $ | 2.42 | $ | 3.06 | $ | 3.21 | $ | 3.51 | ||||||||||
| Cobalt (millions of contained pounds) | ||||||||||||||||||||
| Production | 32 | 35 | 29 | 28 | 26 | |||||||||||||||
| Sales | 33 | 35 | 30 | 25 | 25 | |||||||||||||||
| Average realized price per pound | $ | 7.45 | $ | 8.21 | $ | 9.66 | $ | 8.02 | $ | 7.83 | ||||||||||
| Ore milled (metric tons per day) | 15,200 | 14,900 | 14,700 | 14,900 | 13,000 | |||||||||||||||
| Average ore grade (percent): | ||||||||||||||||||||
| Copper | 4.18 | 4.00 | 4.06 | 4.22 | 3.62 | |||||||||||||||
| Cobalt | 0.44 | 0.43 | 0.34 | 0.37 | 0.37 | |||||||||||||||
| Copper recovery rate (percent) | 93.6 | 94.0 | 92.6 | 91.4 | 92.4 |
| a. | Excludes the results from Africa mining, which is reported as discontinued operations. |
| b. | Includes the results of the Candelaria and Ojos del Salado mines prior to their sale in November 2014. |
| c. | Includes production from the Climax molybdenum mine beginning in May 2012. |
| d. | Represents the results of FM O&G beginning June 1, 2013. In June 2014, we completed the sale of the Eagle Ford shale assets, in July 2016, we completed the sale of the Haynesville shale assets and in December 2016, we completed the sales of the Deepwater Gulf of Mexico and onshore California oil and gas properties. |
| e. | On November 16, 2016, we completed the sale of our interest in TFHL, through which we held an interest in the Tenke mine. |
Ratio of Earnings to Fixed Charges
For the ratio of earnings to fixed charges calculation, earnings consist of (loss) income from continuing operations before income taxes, noncontrolling interests in consolidated subsidiaries, equity in affiliated companies’ net (losses) earnings, cumulative effect of accounting changes and fixed charges. Fixed charges include interest and that portion of rent deemed representative of interest. The ratio of earnings to fixed charges and preferred stock dividends is the same as the ratio of earnings to fixed charges for the years presented because no shares of FCX preferred stock were outstanding during these years. Our ratio of earnings to fixed charges was as follows for the years presented:
| Years Ended December 31, | |||||||||
| 2016 | 2015 | 2014 | 2013 | 2012 | |||||
| Ratio of earnings to fixed charges | — | a | — | a | — | a | 6.8x | 18.3x |
| a. | As a result of the losses recorded in 2016, 2015 and 2014, the ratio coverage was less than 1:1. To achieve coverage of 1:1, FCX would have needed to generate additional earnings of $3.5 billion in 2016, $14.3 billion in 2015 and $1.0 billion in 2014. |
Items 7. and 7A. Management's Discussion and Analysis of Financial Condition and Results of Operations and Quantitative and Qualitative Disclosures About Market Risk.
In Management’s Discussion and Analysis of Financial Condition and Results of Operations and Quantitative and Qualitative Disclosures About Market Risk, “we,” “us” and “our” refer to Freeport-McMoRan Inc. (FCX) and its consolidated subsidiaries. The results of operations reported and summarized below are not necessarily indicative of future operating results (refer to “Cautionary Statement” for further discussion). References to “Notes” are Notes included in our Notes to Consolidated Financial Statements. Throughout Management's Discussion and Analysis of Financial Condition and Results of Operations and Quantitative and Qualitative Disclosures About Market Risk, all references to earnings or losses per share are on a diluted basis, unless otherwise noted. Additionally, in accordance with accounting guidelines, TF Holdings Limited (TFHL), through which we held an interest in the Tenke
Fungurume (Tenke) mine until it was sold on November 16, 2016, is reported as a discontinued operation for all periods presented.
OVERVIEW
We are a leading international mining company with headquarters in Phoenix, Arizona. We operate large, long-lived, geographically diverse assets with significant proven and probable reserves of copper, gold and molybdenum. We are the world's largest publicly traded copper producer. Our portfolio of assets includes the Grasberg minerals district in Indonesia, one of the world's largest copper and gold deposits; and significant mining operations in the Americas, including the large-scale Morenci minerals district in North America and the Cerro Verde operation in South America.
Net loss attributable to common stock totaled $4.2 billion in 2016, $12.2 billion in 2015 and $1.3 billion in 2014, which included charges for the impairment of oil and gas properties totaling $4.3 billion in 2016, $11.6 billion in 2015 and $2.3 billion in 2014. In addition to lower charges for the impairment of oil and gas properties, our results for 2016, compared to 2015, reflected higher net gains on the sales of assets, and a gain on redemption of a redeemable noncontrolling interest, net tax credits, higher copper sales volumes and lower metals inventory adjustments, partly offset by charges at our oil and gas operations for the termination and settlements of drillship and other contracts, a loss on discontinued operations and lower copper prices. Refer to “Consolidated Results” for discussion of items impacting our consolidated results for the three years ended December 31, 2016.
During 2016, we took actions to restore our balance sheet strength through a combination of asset sale transactions, cash flow from operations and capital market transactions. During the year, we completed $6.6 billion in asset sale transactions and generated gross proceeds of $1.5 billion from a registered at-the-market offering of common stock. Refer to Notes 2 and 10 for further discussion.
At December 31, 2016, we had $4.2 billion in consolidated cash and cash equivalents and $16.0 billion in total debt, compared with consolidated cash and cash equivalents of $177 million and total debt of $20.3 billion at December 31, 2015. We had no borrowings and $3.5 billion available under our $3.5 billion revolving credit facility at year-end 2016.
During 2016, we also terminated contracts for deepwater drillships and settled aggregate commitments totaling $1.1 billion for $755 million (excluding contingent consideration), of which $540 million was funded with shares of our common stock (refer to Notes 10 and 13 for further discussion).
We continue to manage production, exploration and administrative costs and capital spending and, subject to commodity prices and operational results, expect to generate cash flows for further debt reduction during 2017.
We have retained a high-quality portfolio of long-lived copper assets positioned to generate long-term value. In addition to debt reduction plans, we are pursuing opportunities to enhance net present values, and we continue to advance studies for future development of our copper resources, the timing of which is dependent on market conditions.
We have significant mineral reserves, resources and future development opportunities within our portfolio of mining assets. At December 31, 2016, our estimated consolidated recoverable proven and probable mineral reserves totaled 86.8 billion pounds of copper, 26.1 million ounces of gold and 2.95 billion pounds of molybdenum, which were determined using long-term average prices of $2.00 per pound for copper, $1,000 per ounce for gold and $10 per pound for molybdenum. Refer to “Critical Accounting Estimates – Mineral Reserves” for further discussion.
A summary of the sources of our consolidated copper, gold and molybdenum production (excluding copper production from Tenke) for the year 2016 by geographic location follows:
| Copper | Gold | Molybdenum | |||||||
| North America | 43 | % | 2 | % | 74 | % | a | ||
| South America | 32 | — | 26 | ||||||
| Indonesia | 25 | 98 | — | ||||||
| 100 | % | 100 | % | 100 | % |
| a. | Our Henderson and Climax molybdenum mines produced 33 percent of consolidated molybdenum production, and our North America copper mines produced 41 percent. |
Copper production from the Grasberg mine in Indonesia, Morenci mine in North America and Cerro Verde mine in Peru together totaled 72 percent of our consolidated copper production in 2016.
As further discussed in “Operations - Indonesia Mining,” in January and February 2017, the Indonesian government issued new regulations to address exports of unrefined metals, including copper concentrate and anode slimes, and other matters related to the mining sector. Following the issuance of the January and February 2017 regulations and discussions with the government, PT Freeport Indonesia (PT-FI) advised the Indonesian government that it was prepared to convert its Contract of Work (COW) to a special operating license (known as an IUPK), subject to obtaining an investment stability agreement providing equivalent rights with the same level of legal and fiscal certainty enumerated under its COW, and provided that the COW would remain in effect until it is replaced by a mutually satisfactory alternative. PT-FI has requested that concentrate exports be permitted without the imposition of export duties while the new license and stability agreement are negotiated. The Indonesia government has indicated that in order to export its concentrate production, PT-FI would be required to immediately convert to an IUPK, forgo its current rights to fiscal and legal certainty and commit to a new smelter prior to completing a long-term investment stability agreement. PT-FI has advised the Indonesian government attempts to enforce the new regulations on PT-FI violates its COW and that it is unwilling to terminate its COW unless replaced by a mutually acceptable form of agreement providing fiscal and legal assurances to support its long-term investment plans in Papua, Indonesia.
As of February 24, 2017, PT-FI has not obtained approval to export concentrate. Although PT-FI is taking near-term actions to reduce production to match available processing capacity at PT Smelting, or approximately 40 percent of PT-FI's concentrate production capacity, on February 10, 2017, PT-FI was forced to suspend production as a result of limited storage capacity at PT-FI and PT Smelting (PT-FI’s 25-percent-owned copper smelter and refinery located in Gresik, Indonesia). PT-FI has also begun to significantly adjust its cost structure, reduce its workforce and spending with local suppliers, and suspend investments in its underground development projects and new smelter.
On February 17, 2017, pursuant to the COW’s dispute resolution provisions, PT-FI provided formal notice to the Indonesian government of an impending dispute listing the government’s breaches and violations of the COW.
Refer to “Risk Factors” contained in Part I, Item 1A of our annual report on Form 10-K for the year ended December 31, 2016, for further discussion.
OUTLOOK
We view the long-term outlook for our business positively, supported by limitations on supplies of copper and by the requirements for copper in the world’s economy. Our financial results vary as a result of fluctuations in market prices primarily for copper, gold and molybdenum, as well as other factors. World market prices for these commodities have fluctuated historically and are affected by numerous factors beyond our control. Because we cannot control the price of our products, the key measures that management focuses on in operating our business are sales volumes, unit net cash costs, operating cash flow and capital expenditures.
The below projections for 2017 were prepared in January 2017 and assumed the resumption of concentrate exports by PT-FI in February 2017 and the renewal of PT Smelting’s anode slimes export license, neither of which has occurred as of February 24, 2017. As a result of regulations passed by the Indonesian government in January and February 2017, PT-FI has been unable to export concentrate and is proceeding with its plan to suspend investments in Papua, Indonesia, reduce its production by approximately 60 percent from normal levels and implement cost savings plans involving significant reductions in its workforce and spending levels with local suppliers, which are not reflected in our projections for 2017.
Sales Volumes
Following are projected consolidated sales volumes for 2017, as prepared in January 2017 based on the assumptions described above, and actual consolidated sales volumes from continuing operations for 2016:
| 2017 | 2016 | |||||
| (Projected) | (Actual) | |||||
| Copper (millions of recoverable pounds): | ||||||
| North America copper mines | 1,465 | 1,841 | ||||
| South America mining | 1,315 | 1,332 | ||||
| Indonesia mining | 1,325 | 1,054 | ||||
| 4,105 | 4,227 | |||||
| Gold (thousands of recoverable ounces) | 2,170 | 1,079 | ||||
| Molybdenum (millions of recoverable pounds) | 92 | a | 74 |
| a. | Projected molybdenum sales include 36 million pounds produced by our Molybdenum mines and 56 million pounds produced by our North and South America copper mines. |
Consolidated sales for first-quarter 2017 were expected to approximate 1.0 billion pounds of copper, 460 thousand ounces of gold and 23 million pounds of molybdenum. First-quarter 2017 production has been adversely impacted by the suspension of concentrate exports from PT-FI and a labor strike at PT Smelting, which resulted in a shutdown of its operations since January 19, 2017. PT Smelting has advised PT-FI that it expects to resume operations in March 2017. Assuming resumption of PT Smelting’s operations in March 2017 and a continuation of the ban on PT-FI's copper concentrate exports, we estimate our first-quarter 2017 sales will be reduced, resulting in deferrals of approximately 170 million pounds of copper and 270 thousand ounces of gold, representing a 17 percent reduction in first-quarter 2017 consolidated copper sales and a 59 percent reduction in first-quarter 2017 consolidated gold sales. For each month of delay in obtaining approval to export, PT-FI’s share of production is projected to be reduced by approximately 70 million pounds of copper and 70 thousand ounces of gold.
Projected sales volumes are dependent on operational performance and other factors. For other important factors that could cause results to differ materially from projections, refer to "Cautionary Statement."
Unit Net Cash Costs
Assuming average prices of $1,200 per ounce of gold and $7.00 per pound of molybdenum, and achievement of the volume and cost estimates included in our January 2017 projections (including the resumption of concentrate exports by PT-FI in February 2017, which has not occurred as of February 24, 2017), consolidated unit net cash costs (net of by-product credits) for our copper mines were expected to average $1.06 per pound in 2017. The impact of price changes in 2017 on consolidated unit net cash costs would approximate $0.025 per pound for each
$50 per ounce change in the average price of gold and $0.025 per pound for each $2 per pound change in the average price of molybdenum. Quarterly unit net cash costs vary with fluctuations in volumes and average realized prices, primarily for gold and molybdenum. Refer to “Consolidated Results – Production and Delivery Costs” for further discussion of consolidated production costs for our mining operations.
Consolidated Operating Cash Flow
Our consolidated operating cash flows vary with volumes, prices realized from copper, gold and molybdenum, production costs, income taxes, other working capital changes and other factors. Based on the sales volume and cost estimates included in our January 2017 projections (including the resumption of concentrate exports by PT-FI in February 2017, which has not occurred as of February 24, 2017), and assuming average prices of $2.50 per pound of copper, $1,200 per ounce of gold and $7.00 per pound of molybdenum, we estimated consolidated operating cash flows for 2017 of $4.3 billion (including $1.0 billion for working capital sources and changes in other tax payments). Projected consolidated operating cash flows for 2017 also reflected an estimated income tax provision of $1.4 billion primarily associated with income from our international mining operations (refer to "Consolidated Results - Income Taxes" for further discussion of projected income taxes). The impact of price changes in 2017 on consolidated operating cash flows would approximate $385 million for each $0.10 per pound change in the average price of copper, $95 million for each $50 per ounce change in the average price of gold and $100 million for each $2 per pound change in the average price of molybdenum.
Consolidated Capital Expenditures
Consolidated capital expenditures were expected to approximate $1.8 billion for 2017, including $1.1 billion for major mining projects primarily for underground development activities at Grasberg. PT-FI has begun suspending investments in its underground development projects, pending resolution of its long-term mining rights. If PT-FI is unable to reach agreement with the Indonesian government on its long-term mining rights, we may be required to further reduce or defer investments in underground development projects. For further discussion of regulatory matters in Indonesia, which may impact future investment in PT-FI’s underground development projects, refer to “Operations - Indonesia Mining.”
MARKETS
Metals
World prices for copper, gold and molybdenum can fluctuate significantly. During the period from January 2007 through December 2016, the London Metal Exchange (LME) spot copper price varied from a low of $1.26 per pound in 2008 to a record high of $4.60 per pound in 2011; the London Bullion Market Association (London) PM gold price fluctuated from a low of $608 per ounce in 2007 to a record high of $1,895 per ounce in 2011, and the Metals Week Molybdenum Dealer Oxide weekly average price ranged from a low of $4.46 per pound in 2015 to a high of $33.88 per pound in 2008. Copper, gold and molybdenum prices are affected by numerous factors beyond our control as described further in our “Risk Factors” contained in Part I, Item 1A. of our annual report on Form 10-K for the year ended December 31, 2016.
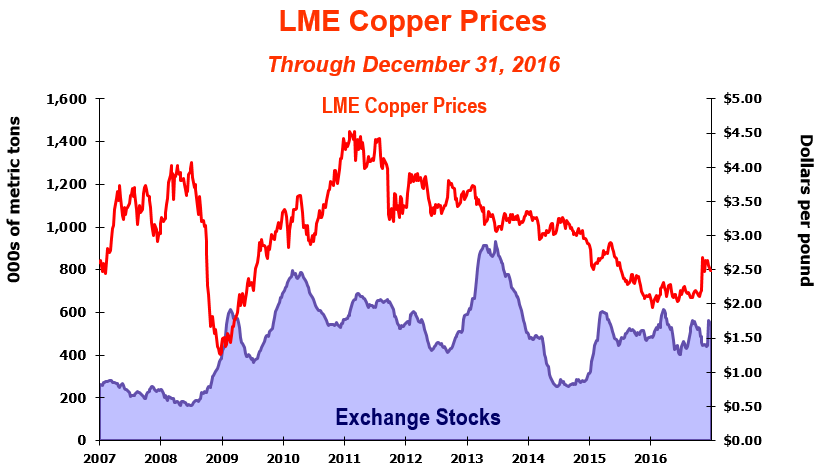
This graph presents LME spot copper prices and combined reported stocks of copper at the LME, Commodity Exchange Inc. (COMEX), a division of the New York Mercantile Exchange (NYMEX), and the Shanghai Futures Exchange from January 2007 through December 2016. Since mid-2014, copper prices have declined because of concerns about slowing growth rates in China, a stronger U.S. dollar and a broad-based decline in commodity prices. During fourth-quarter 2016, copper prices improved with the LME spot copper prices averaging $2.39 per pound and closing at $2.50 per pound on December 31, 2016. For the year 2016, LME spot copper prices ranged from a low of $1.96 per pound to a high of $2.69 per pound and averaged $2.21 per pound. The LME spot copper price closed at $2.73 per pound on February 15, 2017.
We believe the underlying long-term fundamentals of the copper business remain positive, supported by the significant role of copper in the global economy and a challenging long-term supply environment attributable to difficulty in replacing existing large mines' output with new production sources. Future copper prices are expected to be volatile and are likely to be influenced by demand from China and emerging markets, as well as economic activity in the U.S. and other industrialized countries, the timing of the development of new supplies of copper and production levels of mines and copper smelters.

This graph presents London PM gold prices from January 2007 through December 2016. An improving economic outlook, stronger U.S. dollar and positive equity performance contributed to lower demand for gold since 2014. During 2016, London PM gold prices ranged from a low of $1,077 per ounce to a high of $1,366 per ounce, averaged $1,250 per ounce and closed at $1,159 per ounce on December 31, 2016. Gold prices closed at $1,224 per ounce on February 15, 2017.

This graph presents the Metals Week Molybdenum Dealer Oxide weekly average price from January 2007 through December 2016. Molybdenum prices have declined since mid-2014 because of weaker demand from global steel and stainless steel producers. During 2016, the weekly average price for molybdenum ranged from a low of $5.15 per pound to a high of $8.47 per pound, averaged $6.47 per pound and was $6.74 per pound on December 31, 2016. The Metals Week Molybdenum Dealer Oxide weekly average price was $7.59 per pound on February 15, 2017.
Oil and Gas
Our results for the three years ended December 31, 2016, were impacted by market prices for crude oil, and to a lesser extent natural gas, which can fluctuate significantly. Crude oil prices reached a record high of $146.08 per barrel in 2008 as economic growth in emerging economies and the U.S. created high global demand for oil and lower inventories. Beginning mid-2014, oil prices significantly declined because of concerns of global oversupply and reached a low of $27.88 per barrel in January 2016. During 2016, the Brent crude oil price ranged from a low of $27.88 per barrel to a high of $56.82 per barrel, averaged $45.13 per barrel and was $56.82 per barrel on December 31, 2016.
CRITICAL ACCOUNTING ESTIMATES
Management’s Discussion and Analysis of Financial Condition and Results of Operations is based on our consolidated financial statements, which have been prepared in conformity with generally accepted accounting principles (GAAP) in the U.S. The preparation of these statements requires that we make estimates and assumptions that affect the reported amounts of assets, liabilities, revenues and expenses. We base these estimates on historical experience and on assumptions that we consider reasonable under the circumstances; however, reported results could differ from those based on the current estimates under different assumptions or conditions. The areas requiring the use of management’s estimates are also discussed in Note 1 under the subheading “Use of Estimates.” Management has reviewed the following discussion of its development and selection of critical accounting estimates with the Audit Committee of our Board of Directors (Board).
Mineral Reserves
Recoverable proven and probable reserves are the part of a mineral deposit that can be economically and legally extracted or produced at the time of the reserve determination. The determination of reserves involves numerous uncertainties with respect to the ultimate geology of the ore bodies, including quantities, grades and recovery rates. Estimating the quantity and grade of mineral reserves requires us to determine the size, shape and depth of our ore bodies by analyzing geological data, such as samplings of drill holes, tunnels and other underground workings. In addition to the geology of our mines, assumptions are required to determine the economic feasibility of mining these reserves, including estimates of future commodity prices and demand, the mining methods we use and the related costs incurred to develop and mine our reserves. Our estimates of recoverable proven and probable mineral reserves are prepared by and are the responsibility of our employees. A majority of these estimates are reviewed annually and verified by independent experts in mining, geology and reserve determination.
At December 31, 2016, our consolidated estimated recoverable proven and probable reserves were determined using long-term average prices of $2.00 per pound for copper, $1,000 per ounce for gold and $10 per pound for molybdenum. The following table summarizes changes in our estimated consolidated recoverable proven and probable copper, gold and molybdenum reserves during 2016 and 2015:
| Coppera (billion pounds) | Gold (million ounces) | Molybdenum (billion pounds) | |||||
| Consolidated reserves at December 31, 2014 | 103.5 | 28.5 | 3.11 | ||||
| Net additions/revisions | — | (0.1) | 0.03 | ||||
| Production | (4.0 | ) | (1.3) | (0.09) | |||
| Consolidated reserves at December 31, 2015 | 99.5 | 27.1 | 3.05 | ||||
| Net additions | 0.5 | 0.1 | — | ||||
| Production | (4.6 | ) | b | (1.1) | (0.08) | ||
| Sale of interest in Tenke | (6.8 | ) | — | — | |||
| Sale of 13 percent interest in Morenci | (1.8 | ) | — | (0.02) | |||
| Consolidated reserves at December 31, 2016 | 86.8 | 26.1 | 2.95 | ||||
| a. | Includes estimated recoverable metals contained in stockpiles. See below for additional discussion of recoverable copper in stockpiles. |
| b. | Includes copper production of 0.4 billion pounds from the Tenke mine. |
Refer to Note 20 for further information regarding estimated recoverable proven and probable mineral reserves.
As discussed in Note 1, we depreciate our life-of-mine mining and milling assets and values assigned to proven and probable mineral reserves using the unit-of-production (UOP) method based on our estimated recoverable proven
and probable mineral reserves. Because the economic assumptions used to estimate mineral reserves may change from period to period and additional geological data is generated during the course of operations, estimates of reserves may change, which could have a significant impact on our results of operations, including changes to prospective depreciation rates and impairments of long-lived asset carrying values. Excluding impacts associated with changes in the levels of finished goods inventories and based on projected copper sales volumes, if estimated copper reserves at our mines were 10 percent higher at December 31, 2016, we estimate that our annual depreciation, depletion and amortization (DD&A) expense for 2017 would decrease by $53 million ($29 million to net income attributable to common stockholders), and a 10 percent decrease in copper reserves would increase DD&A expense by $64 million ($36 million to net income attributable to common stockholders). We perform annual assessments of our existing assets in connection with the review of mine operating and development plans. If it is determined that assigned asset lives do not reflect the expected remaining period of benefit, any change could affect prospective depreciation rates.
As discussed below and in Note 1, we review and evaluate our long-lived assets for impairment when events or changes in circumstances indicate that the related carrying amount of such assets may not be recoverable, and changes to our estimates of recoverable proven and probable mineral reserves could have an impact on our assessment of asset recoverability. Refer to “Risk Factors” contained in Part I, Item 1A of our annual report on Form 10-K for the year ended December 31, 2016, for further discussion of Indonesian regulatory matters that could have a material adverse affect on our cash flow, results of operations and financial position, and could result in asset impairments at PT-FI.
Recoverable Copper in Stockpiles
We record, as inventory, applicable costs for copper contained in mill and leach stockpiles that are expected to be processed in the future based on proven processing technologies. Mill and leach stockpiles are evaluated periodically to ensure that they are stated at the lower of weighted-average cost or net realizable value (refer to Note 4 and "Consolidated Results" for further discussion of inventory adjustments recorded for the three years ended December 31, 2016). Accounting for recoverable copper from mill and leach stockpiles represents a critical accounting estimate because (i) it is generally impracticable to determine copper contained in mill and leach stockpiles by physical count, thus requiring management to employ reasonable estimation methods and (ii) recovery rates from leach stockpiles can vary significantly. Refer to Note 1 for further discussion of our accounting policy for recoverable copper in stockpiles.
At December 31, 2016, estimated consolidated recoverable copper was 2.2 billion pounds in leach stockpiles (with a carrying value of $2.2 billion) and 1.0 billion pounds in mill stockpiles (with a carrying value of $746 million), compared with 2.6 billion pounds in leach stockpiles (with a carrying value of $2.6 billion) and 1.0 billion pounds in mill stockpiles (with a carrying value of $617 million) at December 31, 2015.
Impairment of Long-Lived Assets
Mining. As discussed in Note 1, we assess the carrying values of our long-lived mining assets when events or changes in circumstances indicate that the related carrying amounts of such assets may not be recoverable. In evaluating our long-lived mining assets for recoverability, we use estimates of pre-tax undiscounted future cash flows of our individual mines. Estimates of future cash flows are derived from current business plans, which are developed using near-term metal price forecasts reflective of the current price environment and management's projections for long-term average metal prices. In addition to near- and long-term metal price assumptions, other key assumptions include estimates of commodity-based and other input costs; proven and probable mineral reserves estimates, including the timing and cost to develop and produce the reserves; value beyond proven and probable mineral reserve estimates (refer to Note 1); and the use of appropriate discount rates in the measurement of fair value. We believe our estimates and models used to determine fair value are similar to what a market participant would use. As quoted market prices are unavailable for our individual mining operations, fair value is determined through the use of after-tax discounted estimated future cash flows.
As a result of declining copper and molybdenum prices, during 2015, we evaluated our long-lived mining assets for impairment, which resulted in charges of $37 million at our Tyrone mine, net of a revision to asset retirement obligations (AROs). The December 31, 2015, evaluations of the recoverability of our copper mines were based on near-term price assumptions reflecting prevailing copper futures prices, ranging from $2.15 per pound to $2.17 per pound for COMEX and from $2.13 per pound to $2.16 per pound for LME, and a long-term average price of $3.00 per pound. The December 31, 2015, evaluations of the recoverability of our molybdenum mines used near-term price assumptions that were consistent with then-current market prices for molybdenum and a long-term average of $10 per pound.
During the year 2016, we concluded there were no events or changes in circumstances that would indicate that the carrying amount of our long-lived mining assets might not be recoverable. Additionally, copper and molybdenum prices have improved. The LME copper spot price of $2.50 per pound at December 31, 2016, was 17 percent higher than the LME spot price of $2.13 per pound at December 31, 2015, and the weekly average price for molybdenum of $6.74 per pound on December 31, 2016, was 29 percent higher than the weekly average price of $5.23 per pound at December 31, 2015.
In addition to decreases in future metal price assumptions, other events that could result in future impairment of our long-lived mining assets include, but are not limited to, decreases in estimated recoverable proven and probable mineral reserves and any event that might otherwise have a material adverse effect on mine site production levels or costs. Refer to “Risk Factors” contained in Part I, Item 1A of our annual report on Form 10-K for the year ended December 31, 2016, for further discussion of Indonesian regulatory matters that could have a material adverse affect on our cash flow, results of operations and financial position, and could result in asset impairments at PT-FI.
Oil and Gas Properties. As discussed in Note 1, we follow the full cost method of accounting for our oil and gas operations, whereby all costs associated with oil and gas property acquisition, exploration and development activities are capitalized and amortized to expense under the UOP method on a country-by-country basis using estimates of proved oil and natural gas reserves relating to each country where such activities are conducted. The costs of unproved oil and gas properties are excluded from amortization until the properties are evaluated.
Under full cost accounting rules, a "ceiling test" is conducted each quarter to review the carrying value of our oil and gas properties for impairment (refer to Note 1 for further discussion). The U.S. Securities and Exchange Commission (SEC) requires that the twelve-month average of the first-day-of-the-month historical reference prices be used to determine the ceiling test limitation. The reference pricing in ceiling test impairment calculations may cause results that do not reflect current market conditions that exist at the end of an accounting period. For example, in periods of increasing oil and gas prices, the use of a twelve-month historical average price in the ceiling test calculation may result in an impairment. Conversely, in times of declining prices, ceiling test calculations may not result in an impairment.
Using West Texas Intermediate (WTI) as the reference oil price, the average price was $42.75 per barrel at December 31, 2016, compared with $50.28 per barrel at December 31, 2015, and $94.99 per barrel at December 31, 2014. The combined impact of the reduction in twelve-month historical prices and reserve revisions caused net capitalized costs with respect to our proved U.S. oil and gas properties to exceed the ceiling test limitation specified by the SEC's full cost accounting rules, which resulted in the recognition of impairment charges totaling $4.3 billion in 2016, $13.0 billion in 2015 and $3.7 billion in 2014. Impairment charges were also recognized for our international oil and gas properties, primarily related to Morocco, totaling $18 million in 2016 and $164 million in 2015.
Following the completion of the sales of our Deepwater Gulf of Mexico (GOM) and onshore California oil and gas properties, at December 31, 2016, we had $74 million remaining in our consolidated balance sheet for proved oil and gas properties, and no amounts recorded for unproved oil and gas properties.
Environmental Obligations
Our current and historical operating activities are subject to various national, state and local environmental laws and regulations that govern the protection of the environment, and compliance with those laws requires significant expenditures. Environmental expenditures are charged to expense or capitalized, depending upon their future economic benefits. The guidance provided by U.S. GAAP requires that liabilities for contingencies be recorded when it is probable that obligations have been incurred, and the cost can be reasonably estimated. At December 31, 2016, environmental obligations recorded in our consolidated balance sheet totaled $1.2 billion, which reflect obligations for environmental liabilities attributed to the Comprehensive Environmental Response, Compensation, and Liability Act of 1980 (CERCLA) or analogous state programs and for estimated future costs associated with environmental matters. Refer to Notes 1 and 12 for further discussion of environmental obligations, including a summary of changes in our estimated environmental obligations for the three years ended December 31, 2016.
Accounting for environmental obligations represents a critical accounting estimate because changes to environmental laws and regulations and/or circumstances affecting our operations could result in significant changes to our estimates, which could have a significant impact on our results of operations. We perform a
comprehensive annual review of our environmental obligations and also review changes in facts and circumstances associated with these obligations at least quarterly. Judgments and estimates are based upon currently available facts, existing technology, presently enacted laws and regulations, remediation experience, whether or not we are a potentially responsible party (PRP), the ability of other PRPs to pay their allocated portions and take into consideration reasonably possible outcomes. Our cost estimates can change substantially as additional information becomes available regarding the nature or extent of site contamination, updated cost assumptions (including increases and decreases to cost estimates), changes in the anticipated scope and timing of remediation activities, the settlement of environmental matters, required remediation methods and actions by or against governmental agencies or private parties.
Asset Retirement Obligations
We record the fair value of our estimated AROs associated with tangible long-lived assets in the period incurred. Fair value is measured as the present value of cash flow estimates after considering inflation and a market risk premium. Our cost estimates are reflected on a third-party cost basis and comply with our legal obligation to retire tangible long-lived assets in the period incurred. These cost estimates may differ from financial assurance cost estimates for reclamation activities because of a variety of factors, including obtaining updated cost estimates for reclamation activities, the timing of reclamation activities, changes in scope and the exclusion of certain costs not considered reclamation and closure costs. At the end of 2016, PT-FI revised its estimates for the overburden stockpile to address ongoing erosion that occurred during 2016, a design change that increased the volume and updated cost estimates reflecting more recent productivity and costs at the stockpile, which resulted in an increase in the ARO of $372 million. At December 31, 2016, AROs recorded in our consolidated balance sheet totaled $2.6 billion, including $0.6 billion associated with our remaining oil and gas operations. Refer to Notes 1 and 12 for further discussion of reclamation and closure costs, including a summary of changes in our AROs for the three years ended December 31, 2016.
Generally, ARO activities are specified by regulations or in permits issued by the relevant governing authority, and management judgment is required to estimate the extent and timing of expenditures. Accounting for AROs represents a critical accounting estimate because (i) we will not incur most of these costs for a number of years, requiring us to make estimates over a long period, (ii) reclamation and closure laws and regulations could change in the future and/or circumstances affecting our operations could change, either of which could result in significant changes to our current plans, (iii) the methods used or required to plug and abandon non-producing oil and gas wellbores, remove platforms, tanks, production equipment and flow lines, and restore the wellsite could change, (iv) calculating the fair value of our AROs requires management to estimate projected cash flows, make long-term assumptions about inflation rates, determine our credit-adjusted, risk-free interest rates and determine market risk premiums that are appropriate for our operations and (v) given the magnitude of our estimated reclamation, mine closure and wellsite abandonment and restoration costs, changes in any or all of these estimates could have a significant impact on our results of operations.
Taxes
In preparing our annual consolidated financial statements, we estimate the actual amount of income taxes currently payable or receivable as well as deferred income tax assets and liabilities attributable to temporary differences between the financial statement carrying amounts of existing assets and liabilities and their respective tax bases. Deferred income tax assets and liabilities are measured using enacted tax rates expected to apply to taxable income in the years in which these temporary differences are expected to be recovered or settled. The effect on deferred income tax assets and liabilities of a change in tax rates or laws is recognized in income in the period in which such changes are enacted.
Our operations are in multiple jurisdictions where uncertainties arise in the application of complex tax regulations. Some of these tax regimes are defined by contractual agreements with the local government, while others are defined by general tax laws and regulations. We and our subsidiaries are subject to reviews of our income tax filings and other tax payments, and disputes can arise with the taxing authorities over the interpretation of our contracts or laws. Final taxes paid may be dependent upon many factors, including negotiations with taxing authorities. In certain jurisdictions, we must pay a portion of the disputed amount to the local government in order to formally appeal an assessment. Such payment is recorded as a receivable if we believe the amount is collectible.
A valuation allowance is provided for those deferred income tax assets for which the weight of available evidence suggests that the related benefits will not be realized. In determining the amount of the valuation allowance, we consider estimated future taxable income or loss as well as feasible tax planning strategies in each jurisdiction. If we determine that we will not realize all or a portion of our deferred income tax assets, we will increase our
valuation allowance. Conversely, if we determine that we will ultimately be able to realize all or a portion of the related benefits for which a valuation allowance has been provided, all or a portion of the related valuation allowance will be reduced.
Our valuation allowances totaled $6.1 billion at December 31, 2016, which covered U.S. federal and state deferred tax assets, including all of our U.S. foreign tax credit carryforwards, U.S. federal net operating loss carryforwards, U.S. federal capital loss carryforwards, foreign net operating loss carryforwards, and substantially all of our U.S. minimum tax credit carryforwards and U.S. state net operating loss carryforwards. Refer to Note 11 for further discussion.
CONSOLIDATED RESULTS
| Years Ended December 31, | ||||||||||||
| 2016 | 2015 | 2014a | ||||||||||
| SUMMARY FINANCIAL DATA | (in millions, except per share amounts) | |||||||||||
| Revenuesb,c,d | $ | 14,830 | $ | 14,607 | $ | 20,001 | ||||||
| Operating lossb,e,f,g,h,i | $ | (2,792 | ) | j | $ | (13,512 | ) | j | $ | (298 | ) | k |
| Net loss from continuing operationsl | $ | (3,832 | ) | m,n | $ | (12,180 | ) | o | $ | (1,022 | ) | m,n |
| Net (loss) income from discontinued operationsp | $ | (193 | ) | $ | 91 | $ | 277 | |||||
| Net loss attributable to common stock | $ | (4,154 | ) | q | $ | (12,236 | ) | $ | (1,308 | ) | ||
| Diluted net (loss) income per share attributable to common stock: | ||||||||||||
| Continuing operations | $ | (2.96 | ) | $ | (11.32 | ) | $ | (1.37 | ) | |||
| Discontinued operations | (0.20 | ) | 0.01 | 0.11 | ||||||||
| $ | (3.16 | ) | $ | (11.31 | ) | $ | (1.26 | ) | ||||
| Diluted weighted-average common shares outstanding | 1,318 | 1,082 | 1,039 | |||||||||
| Operating cash flowsr | $ | 3,729 | $ | 3,220 | $ | 5,631 | ||||||
| Capital expenditures | $ | 2,813 | $ | 6,353 | $ | 7,215 | ||||||
| At December 31: | ||||||||||||
| Cash and cash equivalents | $ | 4,245 | $ | 177 | $ | 298 | ||||||
| Total debt, including current portion | $ | 16,027 | $ | 20,324 | $ | 18,741 |
| a. | Includes the results of the Candelaria and Ojos del Salado mines prior to their sale in November 2014, and the results of the Eagle Ford shale assets prior to their sale in June 2014. |
| b. | As further detailed in Note 16, following is a summary of revenues and operating income (loss) by operating division (in millions): |
| Years Ended December 31, | |||||||||||
| Revenues | 2016 | 2015 | 2014 | ||||||||
| North America copper mines | $ | 4,374 | $ | 5,126 | $ | 5,616 | |||||
| South America mining | 2,938 | 1,934 | 3,532 | ||||||||
| Indonesia mining | 3,295 | 2,653 | 3,071 | ||||||||
| Molybdenum mines | 186 | 348 | 587 | ||||||||
| Rod & Refining | 3,862 | 4,154 | 4,655 | ||||||||
| Atlantic Copper Smelting & Refining | 1,830 | 1,970 | 2,412 | ||||||||
| U.S. Oil & Gas operations | 1,513 | 1,994 | 4,710 | ||||||||
| Other mining, corporate, other & eliminations | (3,168 | ) | (3,572 | ) | (4,582 | ) | |||||
| Total revenues | $ | 14,830 | $ | 14,607 | $ | 20,001 | |||||
| Operating income (loss) | |||||||||||
| North America copper mines | $ | 1,479 | $ | 648 | $ | 1,698 | |||||
| South America mining | 618 | 67 | 1,220 | ||||||||
| Indonesia mining | 1,027 | 449 | 719 | ||||||||
| Molybdenum mines | (96 | ) | (72 | ) | 167 | ||||||
| Rod & Refining | 16 | 16 | 12 | ||||||||
| Atlantic Copper Smelting & Refining | 72 | 67 | (2 | ) | |||||||
| U.S. Oil & Gas operations | (5,711 | ) | (14,189 | ) | (4,479 | ) | |||||
| Other mining, corporate, other & eliminations | (197 | ) | (498 | ) | 367 | ||||||
| Total operating loss | $ | (2,792 | ) | $ | (13,512 | ) | $ | (298 | ) |
| c. | Includes favorable (unfavorable) adjustments to provisionally priced concentrate and cathode copper sales recognized in prior periods totaling $5 million ($2 million to net loss attributable to common stock or less than $0.01 per share) in 2016, $(100) million ($(50) million to net loss attributable to common stock or $(0.05) per share) in 2015 and $(117) million ($(65) million to net loss attributable to common stock or $(0.06) per share) in 2014. Refer to “Revenues” for further discussion. |
| d. | Includes net noncash mark-to-market (losses) gains associated with crude oil and natural gas derivative contracts totaling $(41) million ($(41) million to net loss attributable to common stock or $(0.03) per share) in 2016, $(319) million ($(198) million to net loss attributable to common stock or $(0.18) per share) in 2015 and $627 million ($389 million to net loss attributable to common stock or $0.37 per share) in 2014. Refer to "Revenues" for further discussion. |
| e. | Includes the following charges to reduce the carrying value of oil and gas properties pursuant to full cost accounting rules (in millions except per share amounts): |
| Years Ended December 31, | |||||||||||
| 2016 | 2015 | 2014 | |||||||||
| Operating loss | $ | 4,317 | $ | 13,144 | $ | 3,737 | |||||
| Net loss attributable to common stock | 4,317 | 11,598 | 2,324 | ||||||||
| Net loss per share of common stock | 3.28 | 10.72 | 2.24 |
As a result of the impairment to U.S. oil and gas properties, we recorded tax charges totaling $1.6 billion in 2016 and $3.3 billion in 2015 to establish valuation allowances against U.S. federal and state deferred tax assets that are not expected to generate a future benefit, which have been reflected in the above after-tax impacts for the impairment of oil and gas properties.
| f. | Includes net charges at oil and gas operations totaling $1.1 billion ($1.1 billion to net loss attributable to common stock or $0.84 per share) in 2016, primarily for drillship settlements/idle rig costs, the termination of contracts for support vessels and equipment, inventory adjustments, asset impairment and restructuring charges, $188 million ($117 million to net loss attributable to common stock or $0.11 per share) in 2015, primarily for asset impairments, inventory adjustments and idle rig costs, and $46 million ($29 million to net loss attributable to common stock or $0.03 per share) in 2014, primarily for idle rig costs and inventory adjustments. |
| g. | Includes charges for metals inventory adjustments totaling $36 million ($36 million to net loss attributable to common stock or $0.03 per share) in 2016, $338 million ($217 million to net loss attributable to common stock or $0.20 per share) in 2015 and $6 million ($4 million to net loss attributable to common stock or less than $0.01 per share) in 2014. |
| h. | Includes net (credits) charges for adjustments to environmental obligations and related litigation reserves of $(16) million ($(16) million to net loss attributable to common stock or $(0.01) per share) in 2016, $43 million ($28 million to net loss attributable to common stock or $0.03 per share) in 2015 and $76 million ($50 million to net loss attributable to common stock or $0.05 per share) in 2014. |
| i. | Includes net gains on sales of assets of $649 million ($649 million to net loss attributable to common stock or $0.49 per share) in 2016, $39 million ($25 million to net loss attributable to common stock or $0.02 per share) in 2015 and $717 million ($481 million to net loss attributable to common stockholders or $0.46 per share) in 2014. Refer to Note 2 and "Net Gain on Sales of Assets" below for further discussion. |
| j. | Includes net charges at mining operations totaling $33 million ($14 million to net loss attributable to common stock or $0.01 per share) in 2016 for an asset retirement at PT-FI and social commitments at Cerro Verde and $145 million ($90 million to net loss attributable to common stock or $0.08 per share) in 2015 for asset impairment, restructuring and other net charges. The year 2015 also includes $18 million ($12 million to net loss attributable to common stock or $0.01 per share) for executive retirement benefits. |
| k. | Includes an impairment charge of $1.7 billion ($1.7 billion to net loss attributable to common stockholders or $1.65 per share) for the full carrying value of goodwill associated with our 2013 oil and gas acquisitions. |
| l. | We defer recognizing profits on intercompany sales until final sales to third parties occur. Refer to "Operations - Smelting & Refining" for a summary of net impacts from changes in these deferrals. |
| m. | Includes net gains on exchanges and early extinguishment of debt totaling $26 million ($26 million to net loss attributable to common stock or $0.02 per share) in 2016 and $73 million ($3 million to net loss attributable to common stock or less than $0.01 per share) in 2014. Refer to Note 8 for further discussion. |
| n. | Includes net tax credits (charges) of $374 million ($0.28 per share) in 2016 and $(103) million ($(0.10) per share) in 2014. Refer to "Income Taxes" below for further discussion. |
| o. | The year 2015 includes a gain of $92 million ($92 million to net loss attributable to common stock or $0.09 per share) related to net proceeds received from insurance carriers and other third parties related to the shareholder derivative litigation settlement. |
| p. | Reflects the results of TFHL through November 16, 2016, and includes charges for allocated interest expense associated with the portion of our term loan that was required to be repaid as a result of the sale of our interest in TFHL. The year |
2016 also includes $198 million for the loss on disposal. Refer to Note 2 and “Net (Loss) Income from Discontinued Operations” below for further discussion.
| q. | Includes a gain on redemption of noncontrolling interest of $199 million for the settlement of our preferred stock obligation at our Plains Offshore Operations Inc. (Plains Offshore) subsidiary. |
| r. | Includes net working capital sources (uses) and changes in other tax payments of $57 million in 2016, $373 million in 2015 and $(632) million in 2014. |
| Years Ended December 31, | ||||||||||||
| 2016 | 2015 | 2014a,b | ||||||||||
| SUMMARY OPERATING DATA | ||||||||||||
| Copper (millions of recoverable pounds)c | ||||||||||||
| Production | 4,222 | 3,568 | 3,457 | |||||||||
| Sales, excluding purchases | 4,227 | 3,603 | 3,463 | |||||||||
| Average realized price per pound | $ | 2.28 | $ | 2.42 | $ | 3.09 | ||||||
| Site production and delivery costs per poundd | $ | 1.42 | $ | 1.81 | $ | 1.95 | ||||||
| Unit net cash costs per poundd | $ | 1.26 | $ | 1.57 | $ | 1.55 | ||||||
| Gold (thousands of recoverable ounces) | ||||||||||||
| Production | 1,088 | 1,257 | 1,214 | |||||||||
| Sales, excluding purchases | 1,079 | 1,247 | 1,248 | |||||||||
| Average realized price per ounce | $ | 1,238 | $ | 1,129 | $ | 1,231 | ||||||
| Molybdenum (millions of recoverable pounds) | ||||||||||||
| Production | 80 | 92 | 95 | |||||||||
| Sales, excluding purchases | 74 | 89 | 95 | |||||||||
| Average realized price per pound | $ | 8.33 | $ | 8.70 | $ | 12.74 | ||||||
| Oil Equivalents | ||||||||||||
| Sales volumes: | ||||||||||||
| Million barrels of oil equivalent (MMBOE) | 47.1 | 52.6 | 56.8 | |||||||||
| Thousand BOE (MBOE) per day | 128 | 144 | 156 | |||||||||
| Cash operating margin per BOE:e | ||||||||||||
| Realized revenuesf | $ | 32.59 | $ | 43.54 | $ | 71.83 | ||||||
| Cash production costs | (15.19 | ) | (18.59 | ) | (20.08 | ) | ||||||
| Cash operating margin | $ | 17.40 | $ | 24.95 | $ | 51.75 |
| a. | Includes the results of the Candelaria and Ojos del Salado mines prior to their sale in November 2014. Sales volumes from the Candelaria and Ojos del Salado mines totaled 268 million pounds of copper and 67 thousand ounces of gold in 2014. |
| b. | Includes the results of the Eagle Ford shale assets prior to their sale in June 2014. Sales volumes from Eagle Ford totaled 8.7 MMBOE (24 MBOE per day) in 2014; excluding Eagle Ford, oil and gas cash production costs were $21.36 per BOE for the year 2014. |
| c. | Excludes results from the Tenke mine, which is reported as a discontinued operation. Refer to "Discontinued Operations" for further discussion of Tenke's operating results. |
| d. | Reflects per pound weighted-average production and delivery costs and unit net cash costs (net of by-product credits) for all copper mines, before net noncash and other costs. For reconciliations of the per pound unit costs by operating division to production and delivery costs applicable to sales reported in our consolidated financial statements, refer to “Product Revenues and Production Costs.” |
| e. | Cash operating margin for oil and gas operations reflects realized revenues less cash production costs. Realized revenues exclude noncash mark-to-market adjustments on derivative contracts, and cash production costs exclude accretion and other costs. For reconciliations of realized revenues and cash production costs per BOE to revenues and production and delivery costs reported in our consolidated financial statements, refer to "Product Revenues and Production Costs." |
| f. | Includes realized cash gains (losses) on crude oil and natural gas derivative contracts of $0.13 per BOE in 2016, $7.72 per BOE in 2015 and $(2.15) per BOE in 2014. We do not have any oil and gas derivative contracts in place for future periods. |
Revenues
Consolidated revenues totaled $14.8 billion in 2016, $14.6 billion in 2015 and $20.0 billion in 2014. Revenues from our mining operations primarily include the sale of copper concentrate, copper cathode, copper rod, gold and molybdenum. Revenue from our oil and gas operations include the sale of oil, natural gas and natural gas liquids (NGLs). Following is a summary of changes in our consolidated revenues between periods (in millions):
| 2016 | 2015 | |||||||
| Consolidated revenues - prior year | $ | 14,607 | $ | 20,001 | ||||
| Mining operations: | ||||||||
| Higher (lower) sales volumes: | ||||||||
| Copper | 1,508 | 433 | ||||||
| Gold | (190 | ) | (1 | ) | ||||
| Molybdenum | (128 | ) | (72 | ) | ||||
| (Lower) higher averaged realized prices: | ||||||||
| Copper | (592 | ) | (2,414 | ) | ||||
| Gold | 117 | (127 | ) | |||||
| Molybdenum | (27 | ) | (360 | ) | ||||
| Net adjustments for prior year provisionally priced copper sales | 105 | 17 | ||||||
| Higher (lower) revenues from purchased copper | 117 | (95 | ) | |||||
| Lower Atlantic Copper revenues | (140 | ) | (442 | ) | ||||
| Oil and gas operations: | ||||||||
| Lower oil sales volumes | (40 | ) | (451 | ) | ||||
| Lower oil average realized prices, excluding derivative contracts | (228 | ) | (1,663 | ) | ||||
| Net mark-to-market adjustments on derivative contracts | (122 | ) | (418 | ) | ||||
| Other, including intercompany eliminations | (157 | ) | 199 | |||||
| Consolidated revenues - current year | $ | 14,830 | $ | 14,607 |
Mining Operations
Sales Volumes. Consolidated copper sales volumes totaled 4.2 billion pounds in 2016, 3.6 billion pounds in 2015 and 3.5 billion pounds in 2014. Higher copper sales volumes in 2016, compared to 2015, primarily reflect higher volumes from Cerro Verde and PT-FI, partly offset by lower sales volumes in North America primarily reflecting reduced mining rates and the impact of the May 2016 sale of an additional 13 percent undivided interest in Morenci. Higher copper sales volumes in 2015, compared to 2014, primarily reflect higher volumes from North America associated with increased production from the Morenci mill expansion project and higher ore grades at the Chino mine, and higher volumes from Indonesia associated with higher mill throughput because of export restrictions in 2014, partly offset by lower volumes from South America as a result of the sale of the Candelaria and Ojos del Salado mines in November 2014.
Consolidated gold sales volumes totaled 1.1 million ounces in 2016 and 1.25 million ounces in both 2015 and 2014. Lower gold sales volumes in 2016, compared with 2015, primarily reflect lower ore grades at PT-FI.
Consolidated molybdenum sales volumes totaled 74 million pounds in 2016, 89 million pounds in 2015 and 95 million pounds in 2015. Lower molybdenum sales volumes in 2016, compared with 2015, primarily reflect reduced operating rates in response to weak demand.
Refer to “Operations” for further discussion of sales volumes at our operating divisions.
Metals Realized Prices. Our consolidated revenues can vary significantly as a result of fluctuations in the market prices of copper, gold and molybdenum. Our average realized prices were 6 percent lower for copper, 10 percent higher for gold and 4 percent lower for molybdenum in 2016, compared with 2015. In 2015, our average realized prices were 22 percent lower for copper, 8 percent lower for gold and 32 percent lower for molybdenum, compared with 2014.
Provisionally Priced Copper Sales. Impacts of net adjustments for prior year provisionally priced sales primarily relate to copper sales. Substantially all of our copper concentrate and cathode sales contracts provide final copper pricing in a specified future month (generally one to four months from the shipment date) based primarily on quoted LME monthly average spot copper prices (refer to "Disclosures About Market Risks-Commodity Price Risk" for further discussion). Revenues include favorable (unfavorable) net adjustments to prior years' provisionally priced copper sales totaling $5 million in 2016, $(100) million in 2015 and $(117) million in 2014.
Purchased Copper. We purchased copper cathode primarily for processing by our Rod & Refining operations. Purchased copper volumes totaled 188 million pounds in 2016, 121 million pounds in 2015 and 125 million pounds in 2014.
Atlantic Copper Revenues. Atlantic Copper revenues totaled $1.8 billion in 2016, $2.0 billion in 2015 and $2.4 billion in 2014. Lower Atlantic Copper revenues in 2016, compared with 2015, and in 2015, compared with 2014, primarily reflect lower copper prices.
Oil & Gas Operations
Oil Sales Volumes. Oil sales volumes totaled 34.4 million barrels (MMBbls) in 2016, 35.3 MMBbls in 2015 and 40.1 MMBbls in 2014. Lower oil sales volumes in 2016, compared with 2015, primarily reflect lower volumes from California. Lower oil sales volumes in 2015, compared with 2014, primarily reflect the sale of the Eagle Ford shale assets in June 2014, partly offset by higher volumes in the GOM. Refer to “Operations” for further discussion of sales volumes at our oil and gas operations.
Realized Oil Prices Excluding Derivative Contracts. Our average realized price for oil (excluding the impact of derivative contracts) of $38.96 per barrel in 2016 was 15 percent lower than our average realized price of $45.58 per barrel in 2015. Our average realized price for oil (excluding the impact of derivative contracts) in 2015 was 51 percent lower than our average realized price of $92.76 per barrel for 2014.
Oil and Gas Derivative Contracts. During 2016, 2015 and 2014, we had derivative contracts that were not designated as hedging instruments; accordingly, they were recorded at fair value with the mark-to-market gains and losses recorded in revenues each period (refer to Note 14 for further discussion of oil and gas derivative contracts). Net mark-to-market (losses) gains on oil and gas derivative contracts totaled $(35) million in 2016, compared with $87 million in 2015 and $505 million in 2014. We currently have no derivative contracts in place for future periods.
Production and Delivery Costs
Consolidated production and delivery costs totaled $10.7 billion in both 2016 and 2015 and $11.1 billion in 2014. Production and delivery costs for mining operations were $640 million lower in 2016, compared to 2015, primarily reflecting the impact of cost reduction initiatives. Production and delivery costs for our U.S. oil and gas operations were $590 million higher in 2016, compared to 2015, primarily reflecting higher charges for drillship settlements/idle rig and contract termination costs (which totaled $926 million in 2016, compared to $26 million in 2015), partly offset by the impact of cost reduction efforts.
Production and delivery costs from mining operations were $394 million lower in 2015, compared with 2014, primarily reflecting lower costs at our South America mines as a result of the sale of the Candelaria and Ojos del Salado mines in November 2014 and lower diesel costs in Indonesia, partly offset by higher costs at our North America mines associated with higher volumes. Production and delivery costs for our U.S. oil and gas operations were $26 million lower in 2015, compared with 2014, primarily reflecting the sale of the Eagle Ford shale assets in June 2014 and lower well workover expense and steam gas costs in California.
Mining Unit Site Production and Delivery Costs
Site production and delivery costs for our copper mining operations primarily include labor, energy and commodity-based inputs, such as sulphuric acid, reagents, liners, tires and explosives. Consolidated unit site production and delivery costs (before net noncash and other costs) for our copper mines averaged $1.42 per pound of copper in 2016, $1.81 per pound in 2015 and $1.95 per pound in 2014. Lower consolidated unit site production and delivery costs in 2016, compared with 2015, primarily reflect higher sales volumes and the impact of cost reduction initiatives. Lower consolidated unit site production and delivery costs in 2015, compared with 2014, primarily reflect higher copper sales volumes in North America and Indonesia. Refer to “Operations – Unit Net Cash Costs” for further discussion of unit net cash costs associated with our operating divisions, and to “Product Revenues and
Production Costs” for reconciliations of per pound costs by operating division to production and delivery costs applicable to sales reported in our consolidated financial statements.
Our copper mining operations require significant energy, principally diesel, electricity, coal and natural gas, most of which is obtained from third parties under long-term contracts. Energy represented approximately 20 percent of our copper mine site operating costs in 2016, including purchases of approximately 214 million gallons of diesel fuel; 8,400 gigawatt hours of electricity at our North America and South America copper mining operations (we generate all of our power at our Indonesia mining operation); 780 thousand metric tons of coal for our coal power plant in Indonesia; and 1 million MMBtu (million British thermal units) of natural gas at certain of our North America mines. Based on current cost estimates, energy will approximate 20 percent of our copper mine site operating costs for 2017.
Oil and Gas Production Costs per BOE
Production costs for our oil and gas operations primarily include costs incurred to operate and maintain wells and related equipment and facilities, such as lease operating expenses, steam gas costs, electricity, production and ad valorem taxes, and gathering and transportation expenses. Cash production costs for our oil and gas operations averaged $15.19 per BOE in 2016, $18.59 per BOE in 2015 and $20.08 per BOE in 2014. Lower cash production costs in 2016, compared with 2015, primarily resulted from cost reduction efforts. Lower cash production costs in 2015, compared with 2014, primarily reflect lower well workover expense and steam gas costs in California. Refer to "Operations" for further discussion of cash production costs at our oil and gas operations.
Depreciation, Depletion and Amortization
Depreciation will vary under the UOP method as a result of changes in sales volumes and the related UOP rates at our mining and oil and gas operations. Consolidated DD&A totaled $2.5 billion in 2016, $3.2 billion in 2015 and $3.6 billion in 2014.
DD&A from our mining operations was $225 million higher in 2016, compared with 2015, primarily associated with higher sales volumes at Cerro Verde. DD&A from U.S. oil and gas operations was $935 million lower in 2016, compared with 2015, primarily reflecting lower DD&A rates as a result of impairment of our oil and gas properties.
DD&A from our mining operations was $92 million higher in 2015, compared with 2014, primarily associated with higher sales volumes in North America and Indonesia. DD&A from U.S. oil and gas operations was $487 million lower in 2015, compared with 2014, primarily reflecting lower DD&A rates as a result of impairment of our oil and gas properties.
Impairment of Oil and Gas Properties
Under the full cost accounting rules, a "ceiling test" is conducted each quarter to review the carrying value of our U.S. oil and gas properties for impairment, which resulted in the recognition of impairment charges totaling $4.3 billion in 2016, $13.0 billion in 2015 and $3.7 billion in 2014. We also recognized impairment charges of $18 million in 2016 and $164 million in 2015 for international oil and gas properties, primarily related to Morocco. Refer to Note 1 and "Critical Accounting Estimates" for further discussion.
Metals Inventory Adjustments
Lower copper and molybdenum prices resulted in adjustments to related inventory carrying values totaling $36 million in 2016, $338 million in 2015 and $6 million in 2014. Refer to Notes 1 and 4 for further discussion.
Selling, General and Administrative Expenses
Consolidated selling, general and administrative expenses totaled $607 million in 2016, $558 million in 2015 and $580 million in 2014. Selling, general and administrative expenses included net restructuring charges of $85 million in 2016 associated with oil and gas operations and $18 million in 2015 for executive retirement benefits.
Consolidated selling, general and administrative expenses were net of capitalized general and administrative expenses at our oil and gas operations totaling $78 million in 2016, $124 million in 2015 and $143 million in 2014.
Mining Exploration and Research Expenses
Consolidated exploration and research expenses for our mining operations totaled $64 million in 2016, $107 million in 2015 and $106 million in 2014. Our mining exploration activities are generally associated with our existing mines focusing on opportunities to expand reserves and resources to support development of additional future production capacity. Exploration results continue to indicate opportunities for significant future potential reserve additions in
North and South America. Exploration spending continues to be constrained by market conditions and is expected to approximate $47 million in 2017.
Environmental Obligations and Shutdown Costs
Environmental obligation costs reflect net revisions to our long-term environmental obligations, which vary from period to period because of changes to environmental laws and regulations, the settlement of environmental matters and/or circumstances affecting our operations that could result in significant changes in our estimates (refer to "Critical Accounting Estimates - Environmental Obligations" for further discussion). Shutdown costs include care-and-maintenance costs and any litigation, remediation or related expenditures associated with closed facilities or operations. Net charges for environmental obligations and shutdown costs totaled $20 million in 2016, $78 million in 2015 and $119 million in 2014. Refer to Note 12 for further discussion of environmental obligations and litigation matters.
Goodwill Impairment
As further discussed in Note 1, the fourth-quarter 2014 goodwill assessment resulted in an impairment charge of $1.7 billion for the full carrying value of goodwill associated with the 2013 oil and gas acquisitions.
Net Gain on Sales of Assets
Net gain on sales of assets totaled $649 million in 2016, primarily related to the gains recognized for the Morenci and Timok transactions, partly offset by estimated losses on assets held for sale related to the potential Freeport Cobalt and Kisanfu transactions. Net gain on sales of assets for the year 2016 also reflects $183 million for contingent consideration, including $150 million associated with the sale of the Deepwater GOM oil and gas properties, which is payable to us as the buyer realizes future cash flows in connection with a third-party production handling agreement and $33 million for the fair value of the potential $150 million in contingent consideration from the sale of the onshore California oil and gas properties, which in accordance with accounting guidelines will continue to be adjusted to fair value through December 31, 2020.
Net gain on sales of assets totaled $39 million in 2015 related to the sale of our one-third interest in the Luna Energy power facility in New Mexico and $717 million in 2014 primarily related to the sale of our 80 percent interests in the Candelaria and Ojos del Salado mines.
Refer to Note 2 for further discussion of dispositions.
Interest Expense, Net
Consolidated interest expense (excluding capitalized interest and interest expense allocated to discontinued operations) totaled $854 million in 2016, $832 million in 2015 and $842 million in 2014. Refer to Note 2 for a summary of interest allocated to discontinued operations.
Capitalized interest varies with the level of expenditures for our development projects and average interest rates on our borrowings, and totaled $99 million in 2016, $215 million in 2015 and $236 million in 2014. Refer to "Operations" and "Capital Resources and Liquidity - Investing Activities" for further discussion of current development projects.
Net Gain on Exchanges and Early Extinguishment of Debt
Net gains on exchanges and early extinguishment of debt totaled $26 million in 2016, primarily related to the redemption of certain senior notes in exchange for common stock, partly offset by losses associated with prepayments of the term loan and fees associated with the exchange of Freeport-McMoRan Oil & Gas LLC senior notes for new FCX senior notes. Net gains on exchanges and early extinguishment of debt totaled $73 million in 2014, primarily related to senior note redemptions and tender offers. Refer to Note 8 for further discussion.
Other Income, Net
Other income, net, primarily includes foreign currency translation adjustments and interest income, and totaled $49 million in 2016, $1 million in 2015 and $31 million in 2014. The year 2015 also includes a gain of $92 million associated with net proceeds received from insurance carriers and other third parties related to the shareholder derivative litigation.
Income Taxes
Following is a summary of the approximate amounts used in the calculation of our consolidated income tax (provision) benefit from continuing operations for the years ended December 31 (in millions, except percentages):
| 2016 | 2015 | |||||||||||||||||||
| Income (Loss)a | Effective Tax Rate | Income Tax (Provision) Benefit | Income (Loss)a | Effective Tax Rate | Income Tax (Provision) Benefit | |||||||||||||||
| U.S. | $ | (865 | ) | 41% | $ | 357 | b | $ | (1,626 | ) | c | 44% | $ | 720 | ||||||
| South America | 501 | 43% | (216 | ) | d | (40 | ) | (10)% | (4 | ) | ||||||||||
| Indonesia | 1,058 | 42% | (442 | ) | 430 | 45% | (195 | ) | ||||||||||||
| Impairment of oil and gas properties | (4,317 | ) | 38% | 1,632 | (13,144 | ) | 37% | 4,884 | ||||||||||||
| Valuation allowance, nete | — | N/A | (1,632 | ) | — | N/A | (3,338 | ) | ||||||||||||
| Eliminations and other | 151 | N/A | (70 | ) | 252 | N/A | (116 | ) | ||||||||||||
| Consolidated FCX | $ | (3,472 | ) | (11)% | $ | (371 | ) | $ | (14,128 | ) | 14% | $ | 1,951 |
| 2014 | ||||||||||
| Income (Loss)a | Effective Tax Rate | Income Tax (Provision) Benefit | ||||||||
| U.S. | $ | 1,881 | 28% | $ | (527 | ) | f | |||
| South America | 1,221 | 43% | (531 | ) | g | |||||
| Indonesia | 709 | 41% | (293 | ) | ||||||
| Impairment of oil and gas properties | (3,737 | ) | 38% | 1,413 | ||||||
| Gain on sale of Candelaria and Ojos del Salado mines | 671 | 33% | (221 | ) | ||||||
| Eliminations and other | 172 | N/A | (66 | ) | ||||||
| 917 | 25% | (225 | ) | |||||||
| Adjustments | (1,717 | ) | h | N/A | — | |||||
| Consolidated FCX | $ | (800 | ) | (28)% | $ | (225 | ) |
| a. | Represents income (loss) by geographic location before income taxes and equity in affiliated companies’ net earnings(losses). |
| b. | Includes net tax credits of $357 million associated with alternative minimum tax credits, changes to valuation allowances and net operating loss carryback claims. |
| c. | Includes a gain of $92 million related to net proceeds received from insurance carriers and other third parties related to the shareholder derivative litigation settlement for which there was no related tax provision. |
| d. | Includes a net tax credit of $13 million ($17 million net of noncontrolling interests) related to changes in Peruvian tax rules. |
| e. | As a result of the impairment to U.S. oil and gas properties, we recorded tax charges to establish valuation allowances against U.S. federal and state deferred tax assets that will not generate a future benefit. |
| f. | Includes a charge of $84 million for deferred taxes recorded in connection with the allocation of goodwill to the sale of Eagle Ford shale assets; partly offset by a net benefit of $41 million (comprised of $57 million related to changes in U.S. state income tax filing positions and a charge of $16 million for a change in U.S. federal income tax law regulations). |
| g. | Includes charges of $78 million ($60 million net of noncontrolling interests) related to changes in Chilean and Peruvian tax rules. |
| h. | Reflects goodwill impairment charges, which were non-deductible for tax purposes. |
Our consolidated effective income tax rate is a function of the combined effective tax rates for the jurisdictions in which we operate. Accordingly, variations in the relative proportions of jurisdictional income result in fluctuations to our consolidated effective income tax rate. Assuming achievement of current sales volume and cost estimates and average prices of $2.50 per pound for copper, $1,200 per ounce for gold and $7.00 per pound for molybdenum for 2017, we estimate our consolidated effective tax rate for the year 2017 will approximate 46 percent and would decrease with higher prices.
Refer to Note 11 for further discussion of income taxes.
Net (Loss) Income from Discontinued Operations
As further discussed in Note 2, in November 2016, we completed the sale of our interest in TFHL, through which we had an effective 56 percent interest in the Tenke copper and cobalt concessions in the Southeast region of the Democratic Republic of Congo (DRC). In accordance with accounting guidelines, the results of TFHL through November 16, 2016, have been reported as discontinued operations for all periods presented.
Net (loss) income from discontinued operations totaled $(193) million in 2016, $91 million in 2015 and $277 million in 2014, and included allocated interest expense of $39 million in 2016, $28 million in 2015 and $24 million in 2014 associated with the portion of the term loan that was required to be repaid as a result of the sale of our interest in TFHL. The year 2016 also included $198 million for the loss on disposal, which includes (i) a charge of $33 million for our share of the settlement agreement entered into with La Générale des Carrières et des Mines (Gécamines), which is wholly owned by the DRC government, resulting in the resolution of all claims brought by Gécamines against us (refer to Note 2 for further discussion) and (ii) a gain of $13 million recognized for the fair value of contingent consideration, which in accordance with accounting guidelines will continue to be adjusted through December 31, 2019.
Gain on Redemption and Preferred Dividends Attributable to Redeemable Noncontrolling Interest
In connection with the December 2016 sale of the Deepwater GOM oil and gas properties, we settled a preferred stock obligation at our Plains Offshore subsidiary, which resulted in the recognition of a $199 million gain on redemption. Refer to Note 2 for further discussion.
OPERATIONS
North America Copper Mines
We operate seven open-pit copper mines in North America – Morenci, Bagdad, Safford, Sierrita and Miami in Arizona, and Chino and Tyrone in New Mexico. All of the North America mining operations are wholly owned, except for Morenci.
We record our undivided joint venture interest in Morenci using the proportionate consolidation method. On May 31,
2016, we completed the sale of an additional 13 percent undivided interest in Morenci. As a result of the transaction, our undivided interest in Morenci was prospectively reduced from 85 percent to 72 percent. Refer to Note 2 for further discussion.
The North America copper mines include open-pit mining, sulfide ore concentrating, leaching and solution extraction/electrowinning (SX/EW) operations. A majority of the copper produced at our North America copper mines is cast into copper rod by our Rod & Refining segment. The remainder of our North America copper sales is in the form of copper cathode or copper concentrate, a portion of which is shipped to Atlantic Copper (our wholly owned smelter). Molybdenum concentrate, gold and silver are also produced by certain of our North America copper mines.
Operating and Development Activities. We have significant undeveloped reserves and resources in North America
and a portfolio of long-term development projects. Future investments will be undertaken based on the results of economic and technical feasibility studies, and market conditions.
In response to market conditions, beginning in the second half of 2015, we took actions to reduce operating and capital costs and adjusted production to reflect market conditions. These operating plans will continue to be reviewed and additional adjustments may be made as market conditions warrant.
Operating Data. Following is summary operating data for the North America copper mines for the years ended December 31:
| 2016 | 2015 | 2014 | |||||||||
| Operating Data, Net of Joint Venture Interest | |||||||||||
| Copper (millions of recoverable pounds) | |||||||||||
| Production | 1,831 | 1,947 | 1,670 | ||||||||
| Sales, excluding purchases | 1,841 | 1,988 | 1,664 | ||||||||
| Average realized price per pound | $ | 2.24 | $ | 2.47 | $ | 3.13 | |||||
| Molybdenum (millions of recoverable pounds) | |||||||||||
| Productiona | 33 | 37 | 33 | ||||||||
| 100% Operating Data | |||||||||||
| SX/EW operations | |||||||||||
| Leach ore placed in stockpiles (metric tons per day) | 739,200 | 909,900 | 1,005,300 | ||||||||
| Average copper ore grade (percent) | 0.31 | 0.26 | 0.25 | ||||||||
| Copper production (millions of recoverable pounds) | 1,224 | 1,134 | 963 | ||||||||
| Mill operations | |||||||||||
| Ore milled (metric tons per day) | 300,500 | 312,100 | 273,800 | ||||||||
| Average ore grade (percent): | |||||||||||
| Copper | 0.47 | 0.49 | 0.45 | ||||||||
| Molybdenum | 0.03 | 0.03 | 0.03 | ||||||||
| Copper recovery rate (percent) | 85.5 | 85.4 | 85.8 | ||||||||
| Copper production (millions of recoverable pounds) | 854 | 972 | 828 |
| a. | Refer to "Consolidated Results" for our consolidated molybdenum sales volumes, which includes sales of molybdenum produced at the North America copper mines. |
Copper sales volumes from our North America copper mines decreased to 1.8 billion pounds in 2016, compared with 2.0 billion pounds in 2015, primarily reflecting the impact of the May 2016 sale of an additional 13 percent undivided interest in Morenci and reduced mining rates.
Copper sales volumes from our North America copper mines increased to 2.0 billion pounds in 2015, compared with 1.7 billion pounds in 2014, primarily because of higher mining and milling rates at Morenci and higher ore grades at Morenci, Chino and Safford.
Copper sales from North America are expected to approximate 1.5 billion pounds in 2017. Refer to "Outlook" for projected molybdenum sales volumes.
Unit Net Cash Costs. Unit net cash costs per pound of copper is a measure intended to provide investors with information about the cash-generating capacity of our mining operations expressed on a basis relating to the primary metal product for our respective operations. We use this measure for the same purpose and for monitoring operating performance by our mining operations. This information differs from measures of performance determined in accordance with U.S. GAAP and should not be considered in isolation or as a substitute for measures of performance determined in accordance with U.S. GAAP. This measure is presented by other metals mining companies, although our measure may not be comparable to similarly titled measures reported by other companies.
Gross Profit per Pound of Copper and Molybdenum
The following tables summarize unit net cash costs and gross profit per pound of copper at our North America copper mines for the years ended December 31. Refer to “Product Revenues and Production Costs” for an explanation of the “by-product” and “co-product” methods and a reconciliation of unit net cash costs per pound to production and delivery costs applicable to sales reported in our consolidated financial statements.
| 2016 | 2015 | ||||||||||||||||||||||
| By- | Co-Product Method | By- | Co-Product Method | ||||||||||||||||||||
| Product Method | Copper | Molyb- denuma | Product Method | Copper | Molyb- denuma | ||||||||||||||||||
| Revenues, excluding adjustments | $ | 2.24 | $ | 2.24 | $ | 6.34 | $ | 2.47 | $ | 2.47 | $ | 7.02 | |||||||||||
| Site production and delivery, before net noncash | |||||||||||||||||||||||
| and other costs shown below | 1.42 | 1.35 | 4.93 | 1.68 | 1.59 | 5.61 | |||||||||||||||||
| By-product credits | (0.12 | ) | — | — | (0.13 | ) | — | — | |||||||||||||||
| Treatment charges | 0.11 | 0.10 | — | 0.12 | 0.12 | — | |||||||||||||||||
| Unit net cash costs | 1.41 | 1.45 | 4.93 | 1.67 | 1.71 | 5.61 | |||||||||||||||||
| DD&A | 0.29 | 0.27 | 0.60 | 0.28 | 0.27 | 0.53 | |||||||||||||||||
| Metals inventory adjustments | — | — | — | 0.07 | 0.07 | 0.07 | |||||||||||||||||
| Noncash and other costs, net | 0.05 | 0.05 | 0.06 | 0.12 | b | 0.11 | 0.16 | ||||||||||||||||
| Total unit costs | 1.75 | 1.77 | 5.59 | 2.14 | 2.16 | 6.37 | |||||||||||||||||
| Revenue adjustments, primarily for pricing on prior period open sales | — | — | — | (0.01 | ) | (0.01 | ) | — | |||||||||||||||
| Gross profit per pound | $ | 0.49 | $ | 0.47 | $ | 0.75 | $ | 0.32 | $ | 0.30 | $ | 0.65 | |||||||||||
| Copper sales (millions of recoverable pounds) | 1,836 | 1,836 | 1,985 | 1,985 | |||||||||||||||||||
| Molybdenum sales (millions of recoverable pounds)a | 33 | 37 |
| a. | Reflects sales of molybdenum produced by certain of the North America copper mines to our molybdenum sales company at market-based pricing. |
| b. | Includes $99 million ($0.05 per pound) in 2015 for asset impairment, restructuring and other net charges. |
Our North America copper mines have varying cost structures because of differences in ore grades and characteristics, processing costs, by-product credits and other factors. During 2016, average unit net cash costs (net of by-product credits) for the North America copper mines ranged from $1.28 per pound to $2.01 per pound at the individual mines and averaged $1.41 per pound. Lower average unit net cash costs (net of by-product credits) in 2016, compared with $1.67 per pound in 2015, reflects cost reduction initiatives.
Because certain assets are depreciated on a straight-line basis, North America's average unit depreciation rate may vary with asset additions and the level of copper production and sales.
Average unit net cash costs (net of by-product credits) for our North America copper mines are expected to
approximate $1.55 per pound of copper for the year 2017, based on achievement of current sales volume and cost
estimates, and assuming an average molybdenum price of $7.00 per pound. North America's average unit net cash costs for the year 2017 would change by approximately $0.04 per pound for each $2 per pound change in the average price of molybdenum.
| 2015 | 2014 | ||||||||||||||||||||||
| By- | Co-Product Method | By- | Co-Product Method | ||||||||||||||||||||
| Product Method | Copper | Molyb- denuma | Product Method | Copper | Molyb- denuma | ||||||||||||||||||
| Revenues, excluding adjustments | $ | 2.47 | $ | 2.47 | $ | 7.02 | $ | 3.13 | $ | 3.13 | $ | 11.74 | |||||||||||
| Site production and delivery, before net noncash | |||||||||||||||||||||||
| and other costs shown below | 1.68 | 1.59 | 5.61 | 1.85 | 1.73 | 6.85 | |||||||||||||||||
| By-product credits | (0.13 | ) | — | — | (0.24 | ) | — | — | |||||||||||||||
| Treatment charges | 0.12 | 0.12 | — | 0.12 | 0.12 | — | |||||||||||||||||
| Unit net cash costs | 1.67 | 1.71 | 5.61 | 1.73 | 1.85 | 6.85 | |||||||||||||||||
| DD&A | 0.28 | 0.27 | 0.53 | 0.29 | 0.27 | 0.60 | |||||||||||||||||
| Metals inventory adjustments | 0.07 | 0.07 | 0.07 | — | — | — | |||||||||||||||||
| Noncash and other costs, net | 0.12 | b | 0.11 | 0.16 | 0.09 | 0.09 | 0.07 | ||||||||||||||||
| Total unit costs | 2.14 | 2.16 | 6.37 | 2.11 | 2.21 | 7.52 | |||||||||||||||||
| Revenue adjustments, primarily for pricing on prior period open sales | (0.01 | ) | (0.01 | ) | — | — | — | — | |||||||||||||||
| Gross profit per pound | $ | 0.32 | $ | 0.30 | $ | 0.65 | $ | 1.02 | $ | 0.92 | $ | 4.22 | |||||||||||
| Copper sales (millions of recoverable pounds) | 1,985 | 1,985 | 1,657 | 1,657 | |||||||||||||||||||
| Molybdenum sales (millions of recoverable pounds)a | 37 | 33 |
| a. | Reflects sales of molybdenum produced by certain of the North America copper mines to our molybdenum sales company at market-based pricing. |
| b. | Includes $99 million ($0.05 per pound) in 2015 for asset impairment, restructuring and other net charges. |
Unit net cash costs (net of by-product credits) for our North America copper mines decreased to $1.67 per pound of copper in 2015, compared with $1.73 per pound in 2014, primarily reflecting favorable impacts from higher copper sales volumes, partly offset by lower by-product credits.
South America Mining
We operate two copper mines in South America – Cerro Verde in Peru (in which we own a 53.56 percent interest) and El Abra in Chile (in which we own a 51 percent interest), which are consolidated in our financial statements.
South America mining includes open-pit mining, sulfide ore concentrating, leaching and SX/EW operations. Production from our South America mines is sold as copper concentrate or cathode under long-term contracts. Our South America mines also ship a portion of their copper concentrate and cathode to Atlantic Copper. In addition to copper, the Cerro Verde mine produces molybdenum concentrate and silver.
As further discussed in Note 2, in November 2014, we completed the sale of our 80 percent ownership interests in the Candelaria and Ojos del Salado mines.
Operating and Development Activities. The Cerro Verde expansion project commenced operations in September 2015 and achieved capacity operating rates during first-quarter 2016. Cerro Verde's expanded operations benefit from its large-scale, long-lived reserves and cost efficiencies. The project expanded the concentrator facilities from 120,000 metric tons of ore per day to 360,000 metric tons of ore per day and is expected to provide incremental annual production of approximately 600 million pounds of copper and 15 million pounds of molybdenum. Cerro Verde's copper production totaled 1.1 billion pounds in 2016, compared with 545 million pounds in 2015.
In response to market conditions, in the second half of 2015, we adjusted operations at our El Abra mine to
reduce mining and stacking rates by approximately 50 percent to achieve lower operating and labor costs, defer
capital expenditures and extend the life of the existing operations.
We continue to evaluate a potential large-scale milling operation at El Abra to process additional sulfide material
and to achieve higher recoveries. Exploration results in recent years at El Abra indicate a significant sulfide
resource, which could potentially support a major mill project. Future investments will depend on technical studies,
economic factors and market conditions.
Operating Data. Following is summary operating data for our South America mining operations for the years ended December 31.
| 2016 | 2015 | 2014a | |||||||||
| Copper (millions of recoverable pounds) | |||||||||||
| Production | 1,328 | 869 | 1,151 | ||||||||
| Sales | 1,332 | 871 | 1,135 | ||||||||
| Average realized price per pound | $ | 2.31 | $ | 2.38 | $ | 3.08 | |||||
| Molybdenum (millions of recoverable pounds) | |||||||||||
| Productionb | 21 | 7 | 11 | ||||||||
| SX/EW operations | |||||||||||
| Leach ore placed in stockpiles (metric tons per day) | 151,600 | 193,900 | 275,200 | ||||||||
| Average copper ore grade (percent) | 0.41 | 0.44 | 0.48 | ||||||||
| Copper production (millions of recoverable pounds) | 328 | 430 | 491 | ||||||||
| Mill operations | |||||||||||
| Ore milled (metric tons per day) | 353,400 | 152,100 | 180,500 | ||||||||
| Average ore grade: | |||||||||||
| Copper (percent) | 0.43 | 0.46 | 0.54 | ||||||||
| Molybdenum (percent) | 0.02 | 0.02 | 0.02 | ||||||||
| Copper recovery rate (percent) | 85.8 | 81.5 | 88.1 | ||||||||
| Copper production (millions of recoverable pounds) | 1,000 | 439 | 660 |
| a. | Includes the results of the Candelaria and Ojos del Salado mines prior to their sale in November 2014; sales volumes from the Candelaria and Ojos del Salado mines totaled 268 million pounds of copper in 2014. |
| b. | Refer to "Consolidated Results" for our consolidated molybdenum sales volumes, which includes sales of molybdenum produced at Cerro Verde. |
Higher consolidated copper sales volumes from South America of 1.3 billion pounds in 2016, compared with 871 million in 2015, primarily reflect Cerro Verde's expanded operations.
Copper sales volumes from our South America mining operations totaled 871 million pounds in 2015, and were lower compared with 1.1 billion pounds in 2014, primarily reflecting the November 2014 sale of the Candelaria and Ojos del Salado mines and lower ore grades at El Abra, partly offset by higher mining and milling rates at Cerro Verde.
For the year 2017, consolidated sales volumes from South America mines are expected to approximate 1.3 billion pounds of copper. Refer to "Outlook" for projected molybdenum sales volumes.
Unit Net Cash Costs. Unit net cash costs per pound of copper is a measure intended to provide investors with information about the cash-generating capacity of our mining operations expressed on a basis relating to the primary metal product for our respective operations. We use this measure for the same purpose and for monitoring operating performance by our mining operations. This information differs from measures of performance determined in accordance with U.S. GAAP and should not be considered in isolation or as a substitute for measures of performance determined in accordance with U.S. GAAP. This measure is presented by other metals mining companies, although our measure may not be comparable to similarly titled measures reported by other companies.
Gross Profit per Pound of Copper
The following tables summarize unit net cash costs and gross profit per pound of copper at our South America mining operations for the years ended December 31. Unit net cash costs per pound of copper are reflected under the by-product and co-product methods as the South America mining operations also had sales of molybdenum, gold and silver. Refer to “Product Revenues and Production Costs” for an explanation of the “by-product” and “co-product” methods and a reconciliation of unit net cash costs per pound to production and delivery costs applicable to sales reported in our consolidated financial statements.
| 2016 | 2015 | 2014 | |||||||||||||||||||||
| By-Product Method | Co-Product Method | By-Product Method | Co-Product Method | By-Product Method | Co-Product Method | ||||||||||||||||||
| Revenues, excluding adjustments | $ | 2.31 | $ | 2.31 | $ | 2.38 | $ | 2.38 | $ | 3.08 | $ | 3.08 | |||||||||||
| Site production and delivery, before net noncash | |||||||||||||||||||||||
| and other costs shown below | 1.26 | 1.20 | 1.60 | 1.56 | 1.62 | 1.51 | |||||||||||||||||
| By-product credits | (0.10 | ) | — | (0.05 | ) | — | (0.22 | ) | — | ||||||||||||||
| Treatment charges | 0.24 | 0.24 | 0.19 | 0.19 | 0.17 | 0.17 | |||||||||||||||||
| Royalty on metals | 0.01 | — | — | — | 0.01 | — | |||||||||||||||||
| Unit net cash costs | 1.41 | 1.44 | 1.74 | 1.75 | 1.58 | a | 1.68 | ||||||||||||||||
| DD&A | 0.41 | 0.39 | 0.40 | 0.39 | 0.32 | 0.31 | |||||||||||||||||
| Metals inventory adjustments | — | — | 0.08 | 0.08 | — | — | |||||||||||||||||
| Noncash and other costs, net | 0.03 | 0.03 | 0.05 | 0.05 | 0.06 | 0.06 | |||||||||||||||||
| Total unit costs | 1.85 | 1.86 | 2.27 | 2.27 | 1.96 | 2.05 | |||||||||||||||||
| Revenue adjustments, primarily for pricing on | |||||||||||||||||||||||
| prior period open sales | 0.01 | 0.01 | (0.03 | ) | (0.03 | ) | (0.05 | ) | (0.05 | ) | |||||||||||||
| Gross profit per pound | $ | 0.47 | $ | 0.46 | $ | 0.08 | $ | 0.08 | $ | 1.07 | $ | 0.98 | |||||||||||
| Copper sales (millions of recoverable pounds) | 1,332 | 1,332 | 871 | 871 | 1,135 | 1,135 |
| a. | Excluding the results of Candelaria and Ojos del Salado mines, South America mining's unit net cash costs averaged $1.57 per pound of copper in 2014. |
During 2016, unit net cash costs (net of by-product credits) for the South America mines were $1.33 per pound of copper for the Cerro Verde mine and $1.77 per pound for the El Abra mine and averaged $1.41 per pound. Lower average unit net cash costs (net of by-product credits) for our South America mining operations in 2016, compared with $1.74 per pound in 2015, primarily reflect higher copper sales volumes and efficiencies associated with the Cerro Verde expansion.
Unit net cash costs (net of by-product credits) for our South America mining operations increased to $1.74 per pound of copper in 2015, compared with $1.58 per pound in 2014, primarily reflecting lower by-product credits.
Revenues from Cerro Verde's concentrate sales are recorded net of treatment charges. Accordingly, treatment charges will vary with Cerro Verde's sales volumes and the price of copper.
Because certain assets are depreciated on a straight-line basis, South America's unit depreciation rate may vary with asset additions and the level of copper production and sales.
Revenue adjustments primarily result from changes in prices on provisionally priced copper sales recognized in prior periods. Refer to “Consolidated Results - Revenues” for further discussion of adjustments to prior period provisionally priced copper sales.
Average unit net cash costs (net of by-product credits) for our South America mining operations are expected to
approximate $1.61 per pound of copper for the year 2017, based on current sales volume and cost estimates, and
assuming average prices of $7.00 per pound of molybdenum in 2017.
Indonesia Mining
Indonesia mining includes PT-FI’s Grasberg minerals district, one of the world's largest copper and gold deposits, in Papua, Indonesia. We own 90.64 percent of PT-FI, including 9.36 percent owned through our wholly owned subsidiary, PT Indocopper Investama.
PT-FI proportionately consolidates an unincorporated joint venture with Rio Tinto plc (Rio Tinto), under which Rio Tinto has a 40 percent interest in certain assets and a 40 percent interest through 2022 (previously 2021 before recent adjustments caused by production shortfalls) in production exceeding specified annual amounts of copper, gold and silver. After 2022, all production and related revenues and costs are shared 60 percent PT-FI and 40 percent Rio Tinto. Refer to Note 3 for further discussion of our joint venture with Rio Tinto. Under the joint venture arrangements, PT-FI was allocated nearly 100 percent of copper, gold and silver production and sales for each of the three years ended December 31, 2016. At December 31, 2016, the amounts allocated 100 percent to PT-FI remaining to be produced totaled 5.7 billion pounds of copper, 8.6 million ounces of gold and 15.7 million ounces of silver. Based on the current mine plans, PT-FI anticipates that it will be allocated most of the production and related revenues and costs through 2022.
PT-FI produces copper concentrate that contains significant quantities of gold and silver. Substantially all of PT-FI’s copper concentrate is sold under long-term contracts, and in 2016, approximately 42 percent of PT-FI's copper concentrate was sold to PT Smelting.
Regulatory Matters. PT-FI continues to seek approval from Indonesian authorities for the export of its copper concentrate, consistent with its rights under the COW.
In January 2014, the Indonesian government published regulations that among other things imposed a progressive export duty on copper concentrate and restricts concentrate exports after January 12, 2017. Despite PT-FI’s rights under its COW to export concentrate without the payment of duties, PT-FI was unable to obtain administrative approval for exports and operated at approximately half of its capacity from mid-January 2014 through July 2014.
In July 2014, PT-FI and the Indonesian government entered into a Memorandum of Understanding (MOU) in which, subject to concluding an agreement to extend PT-FI's operations beyond 2021 on acceptable terms, PT-FI agreed to construct new smelter capacity in Indonesia and to divest an additional 20.64 percent interest in PT-FI at fair market value. Under the MOU, PT-FI provided a $115 million assurance bond to support its commitment for smelter development, agreed to increase royalty rates and agreed to pay export duties until certain smelter development milestones were met. The MOU also anticipated an amendment of the COW within six months to address other matters; however, no terms of the COW other than those relating to the smelter bond, increased royalties and export duties were changed. In January 2015, the MOU was extended to July 25, 2015, and it expired on that date. The Indonesian government has continued to impose the increased royalty rates, export duties and smelter assurance bond.
In October 2015, the Indonesian government provided a letter of assurance to PT-FI indicating that it would revise regulations allowing it to approve the extension of PT-FI's operations beyond 2021, and provide the same rights and the same level of legal and fiscal certainty provided under the current COW.
In January and February 2017, the Indonesian government issued new regulations to address exports of unrefined metals, including copper concentrate and anode slimes, and other matters related to the mining sector. The new regulations permit the continuation of copper concentrate exports for a five-year period through January 2022, subject to various conditions, including conversion from a contract of work to a special operating license (known as an IUPK, which provides virtually none of the protections of a contract of work), commitment to completion of smelter construction in five years and payment of export duties to be determined by the Ministry of Finance. In addition, the new regulations enable application for extension of operating rights five years before expiration of the IUPK and require foreign IUPK holders to divest 51 percent to Indonesian interests no later than the tenth year of production. Export licenses would be valid for one-year periods, subject to review every six months, depending on smelter construction progress.
The January 2017 regulations permit the export of anode slimes, which is necessary for PT Smelting to continue operating. PT Smelting is seeking to renew its anode slimes export license; however, we cannot predict when PT Smelting’s anode slimes export license may be renewed. In addition, a labor strike at PT Smelting has resulted in a shutdown of its operations since January 19, 2017. Although PT-FI is taking near-term actions to reduce production to match available processing capacity at PT Smelting, or approximately 40 percent of PT-FI's concentrate production capacity, on February 10, 2017, PT-FI was forced to suspend production as a result of limited storage capacity at PT-FI and PT Smelting. PT Smelting has indicated that it expects to resume operations in March 2017. Delays in PT Smelting obtaining its anode slimes export license or restarting operations could further impact PT-FI's operations.
Following the issuance of the January and February 2017 regulations and discussions with the government, PT-FI advised the Indonesian government that it was prepared to convert its COW to an IUPK, subject to obtaining an investment stability agreement providing equivalent rights with the same level of legal and fiscal certainty enumerated under its COW, and provided that the COW would remain in effect until it is replaced by a mutually satisfactory alternative. PT-FI also committed to commence construction of a new smelter during a five-year timeframe after approval of the extension of its long-term operating rights.
Under its COW, PT-FI has specified rights to export copper concentrate without restriction or payment of export duties. PT-FI has requested that concentrate exports be permitted without the imposition of export duties while the new license and stability agreement are negotiated. The Indonesia government has indicated that in order to export its concentrate production, PT-FI would be required to immediately convert to an IUPK, forgo its current rights to fiscal and legal certainty and commit to a new smelter prior to completing a long-term investment stability agreement. PT-FI has advised the Indonesian government that attempts to enforce the new regulations on PT-FI violates its COW and that it is unwilling to terminate its COW unless replaced by a mutually acceptable form of agreement providing fiscal and legal assurances to support its long-term investment plans in Papua, Indonesia.
As of February 24, 2017, PT-FI has not obtained approval to export concentrate and production remains suspended. PT-FI is taking near-term actions to reduce production to match available processing capacity at PT Smelting, or approximately 40 percent of PT-FI's concentrate production capacity (assuming that PT Smelting's export license is approved and its operations are resumed in March 2017). PT-FI has begun to significantly adjust its cost structure, reduce its workforce and spending with local suppliers, and suspend investments in its underground development projects and new smelter.
On February 17, 2017, pursuant to the COW’s dispute resolution provisions, PT-FI provided formal notice to the Indonesian government of an impending dispute listing the government’s breaches and violations of the COW, which are described in "Risk Factors" contained in Part 1, Item 1A. of our annual report on Form 10-K for the year ended December 31, 2016.
In January 2017, the Indonesia Tax Court issued a ruling against PT-FI with respect to assessments from the local regional tax authority in Papua, Indonesia, for additional taxes and penalties related to surface water taxes for the period from January 2011 through July 2015 in the amount of $376 million (based on the exchange rate as of December 31, 2016, and including $227 million in penalties). The aggregate amount of assessments received from August 2015 through December 2016 was an additional $93 million, including penalties (based on the exchange rate as of December 31, 2016). PT-FI continues to believe that its COW exempts it from these payments, and that PT-FI has the right to contest these assessments by appeal to the Indonesia Supreme Court and/or by instituting dispute resolution proceedings under the COW. In addition, on February 17, 2017, PT-FI provided formal notice to the Indonesian government of an impending dispute listing the government’s breaches and violations of the COW, including the imposition of surface water taxes in excess of the restrictions imposed by the COW. As of February 24, 2017, PT-FI has not paid and does not intend to pay amounts to the local regional tax authority related to these assessments for additional taxes and penalties. Refer to Note 12 for further discussion.
Refer to "Risk Factors" contained in Part I, Item 1A. of our annual report on Form 10-K for the year ended December 31, 2016, for discussion of risks associated with our operations in Indonesia.
Operating and Development Activities. PT-FI is currently mining the final phase of the Grasberg open pit, which
contains high copper and gold ore grades. PT-FI expects to mine high-grade ore over the next several quarters
prior to transitioning to the Grasberg Block Cave underground mine during 2018.
PT-FI has several projects in progress in the Grasberg minerals district related to the development of its large-scale,
long-lived, high-grade underground ore bodies. In aggregate, these underground ore bodies are expected to
produce large-scale quantities of copper and gold following the transition from the Grasberg open pit. From 2017 to
2021, estimated aggregate capital spending on these projects was expected to average $1.0 billion per year ($0.8 billion per year net to PT-FI). Considering the long-term nature and size of these projects, actual costs could vary from these estimates. Additionally, in response to market conditions and Indonesian regulatory uncertainty, the timing of these expenditures continues to be reviewed. PT-FI has begun suspending investments in its underground development projects, pending resolution of its long-term mining rights. If PT-FI is unable to reach agreement with the Indonesian government on its long-term mining rights, we may be required to further reduce or defer investments in underground development projects.
The following provides additional information on the continued development of the Common Infrastructure project, the Grasberg Block Cave underground mine and the Deep Mill Level Zone (DMLZ) ore body that lies below the Deep Ore Zone (DOZ) underground mine. Our current plans and mineral reserves in Indonesia assume that PT-FI's COW will be extended beyond 2021.
Common Infrastructure and Grasberg Block Cave Mine. In 2004, PT-FI commenced its Common Infrastructure project to provide access to its large undeveloped underground ore bodies located in the Grasberg minerals district through a tunnel system located approximately 400 meters deeper than its existing underground tunnel system. In addition to providing access to our underground ore bodies, the tunnel system will enable PT-FI to conduct future exploration in prospective areas associated with currently identified ore bodies. The tunnel system was completed to the Big Gossan terminal, and the Big Gossan mine was brought into production in 2010. Production from the Big Gossan mine restarted in fourth-quarter 2016 and is expected to ramp up to 7,000 metric tons of ore per day in 2022. Development of the DMLZ and Grasberg Block Cave underground mines is advancing using the Common Infrastructure project tunnels as access.
The Grasberg Block Cave underground mine accounts for approximately half of our recoverable proven and probable reserves in Indonesia. Production from the Grasberg Block Cave mine is expected to commence in 2018, following the end of mining of the Grasberg open pit. Targeted production rates once the Grasberg Block Cave mining operation reaches full capacity are expected to approximate 160,000 metric tons of ore per day. As a result of current market conditions, PT-FI is reviewing its operating plans to determine the optimum mine plan for the Grasberg Block Cave.
Previous estimates for aggregate mine development capital for the Grasberg Block Cave mine and associated Common Infrastructure approximated $6.3 billion (incurred between 2008 to 2022), with PT-FI’s share totaling approximately $5.8 billion. Aggregate project costs totaling $2.8 billion have been incurred through December 31, 2016 ($0.6 billion during 2016). PT-FI has begun suspending investments in its underground development projects, pending resolution of its long-term mining rights. If PT-FI is unable to reach agreement with the Indonesian government on its long-term mining rights, we may be required to further reduce or defer investments in underground development projects.
DMLZ. The DMLZ ore body lies below the DOZ mine at the 2,590-meter elevation and represents the downward continuation of mineralization in the Ertsberg East Skarn system and neighboring Ertsberg porphyry. In September 2015, PT-FI initiated pre-commercial production that represents ore extracted during the development phase for the purpose of obtaining access to the ore body. Targeted production rates once the DMLZ underground mine reaches full capacity are expected to approximate 80,000 metric tons of ore per day in 2022.
Drilling efforts continue to determine the extent of the ore body. Aggregate mine development capital costs for the DMLZ underground mine are expected to approximate $3.2 billion (incurred between 2009 and 2021), with PT-FI’s share totaling approximately $1.9 billion. Aggregate project costs totaling $1.8 billion have been incurred through December 31, 2016 ($0.3 billion during 2016). PT-FI has begun suspending investments in its underground development projects, pending resolution of its long-term mining rights. If PT-FI is unable to reach agreement with the Indonesian government on its long-term mining rights, we may be required to further reduce or defer investments in underground development projects.
Operating Data. Following is summary operating data for our Indonesia mining operations for the years ended December 31.
| 2016 | 2015 | 2014 | |||||||||
| Operating Data, Net of Joint Venture Interest | |||||||||||
| Copper (millions of recoverable pounds) | |||||||||||
| Production | 1,063 | 752 | 636 | ||||||||
| Sales | 1,054 | 744 | 664 | ||||||||
| Average realized price per pound | $ | 2.32 | $ | 2.33 | $ | 3.01 | |||||
| Gold (thousands of recoverable ounces) | |||||||||||
| Production | 1,061 | 1,232 | 1,130 | ||||||||
| Sales | 1,054 | 1,224 | 1,168 | ||||||||
| Average realized price per ounce | $ | 1,237 | $ | 1,129 | $ | 1,229 | |||||
| 100% Operating Data | |||||||||||
| Ore milled (metric tons per day):a | |||||||||||
| Grasberg open pit | 119,700 | 115,900 | 69,100 | ||||||||
| DOZ underground mineb | 38,000 | 43,700 | 50,500 | ||||||||
| DMLZ underground mine | 4,400 | 2,900 | — | ||||||||
| Grasberg Block Cave underground mine | 2,700 | — | — | ||||||||
| Big Gossan underground mine | 900 | — | 900 | ||||||||
| Total | 165,700 | 162,500 | 120,500 | ||||||||
| Average ore grade: | |||||||||||
| Copper (percent) | 0.91 | 0.67 | 0.79 | ||||||||
| Gold (grams per metric ton) | 0.68 | 0.79 | 0.99 | ||||||||
| Recovery rates (percent): | |||||||||||
| Copper | 91.0 | 90.4 | 90.3 | ||||||||
| Gold | 82.2 | 83.4 | 83.2 | ||||||||
| Production (recoverable): | |||||||||||
| Copper (millions of pounds) | 1,063 | 752 | 651 | ||||||||
| Gold (thousands of ounces) | 1,061 | 1,232 | 1,132 |
| a. | Amounts represent the approximate average daily throughput processed at PT-FI’s mill facilities from each producing mine and from development activities that result in metal production. |
| b. | Ore milled from the DOZ underground mine is expected to ramp up to over 60,000 metric tons of ore per day in 2017. |
Sales volumes from our Indonesia mining operations totaled 1.1 billion pounds of copper and 1.1 million ounces of gold in 2016, compared with 744 million pounds of copper and 1.2 million ounces of gold in 2015. Higher copper sales volumes in 2016 primarily reflect higher copper ore grades. Lower gold sales volumes in 2016 primarily reflect lower gold ore grades.
Sales volumes from our Indonesia mining operations totaled 744 million pounds of copper and 1.2 million ounces of gold in 2015, compared with 664 million pounds of copper and 1.2 million ounces of gold in 2014, reflecting higher mill rates because of the 2014 export restrictions, partly offset by lower ore grades.
At the Grasberg mine, the sequencing of mining areas with varying ore grades causes fluctuations in quarterly and annual production of copper and gold. Consolidated sales volumes from Indonesia mining operations included in our January 2017 projections (assuming the resumption of concentrate exports in February 2017, which has not occurred as of February 24, 2017) were expected to approximate 1.3 billion pounds of copper and 2.2 million ounces of gold for 2017. PT-FI’s first-quarter 2017 production has been adversely impacted by the suspension of its concentrate exports and a labor strike at PT Smelting, which resulted in a shutdown of its operations since January 19, 2017. PT Smelting has advised PT-FI that it expects to resume operations in March 2017. Assuming resumption of PT Smelting’s operations in March 2017 and a continuation of the ban on PT-FI's copper concentrate exports, we estimate our first-quarter 2017 sales will be reduced, resulting in deferrals of approximately 170 million pounds of copper and 270 thousand ounces of gold. For each month of delay in obtaining approval to export, PT-FI's share of production is projected to be reduced by approximately 70 million pounds of copper and 70 thousand ounces of gold.
Unit Net Cash Costs. Unit net cash costs per pound of copper is a measure intended to provide investors with information about the cash-generating capacity of our mining operations expressed on a basis relating to the primary metal product for our respective operations. We use this measure for the same purpose and for monitoring operating performance by our mining operations. This information differs from measures of performance determined in accordance with U.S. GAAP and should not be considered in isolation or as a substitute for measures of performance determined in accordance with U.S. GAAP. This measure is presented by other metal mining companies, although our measure may not be comparable to similarly titled measures reported by other companies.
Gross Profit per Pound of Copper and per Ounce of Gold
The following tables summarize the unit net cash costs and gross profit per pound of copper and per ounce of gold at our Indonesia mining operations for the years ended December 31. Refer to “Product Revenues and Production Costs” for an explanation of “by-product” and “co-product” methods and a reconciliation of unit net cash costs per pound to production and delivery costs applicable to sales reported in our consolidated financial statements.
| 2016 | 2015 | ||||||||||||||||||||||
| By- Product | Co-Product Method | By- Product | Co-Product Method | ||||||||||||||||||||
| Method | Copper | Gold | Method | Copper | Gold | ||||||||||||||||||
| Revenues, excluding adjustments | $ | 2.32 | $ | 2.32 | $ | 1,237 | $ | 2.33 | $ | 2.33 | $ | 1,129 | |||||||||||
| Site production and delivery, before net noncash | |||||||||||||||||||||||
| and other costs shown below | 1.63 | 1.05 | 559 | 2.39 | 1.32 | 638 | |||||||||||||||||
| Gold and silver credits | (1.30 | ) | — | — | (1.91 | ) | — | — | |||||||||||||||
| Treatment charges | 0.28 | 0.18 | 97 | 0.31 | 0.17 | 83 | |||||||||||||||||
| Export duties | 0.09 | 0.06 | 31 | 0.15 | 0.08 | 39 | |||||||||||||||||
| Royalty on metals | 0.13 | 0.07 | 47 | 0.15 | 0.09 | 41 | |||||||||||||||||
| Unit net cash costs | 0.83 | 1.36 | 734 | 1.09 | 1.66 | 801 | |||||||||||||||||
| DD&A | 0.36 | 0.24 | 125 | 0.39 | 0.22 | 105 | |||||||||||||||||
| Noncash and other costs, net | 0.05 | 0.03 | 17 | 0.05 | 0.03 | 14 | |||||||||||||||||
| Total unit costs | 1.24 | 1.63 | 876 | 1.53 | 1.91 | 920 | |||||||||||||||||
| Revenue adjustments, primarily for pricing on | |||||||||||||||||||||||
| prior period open sales | — | — | 16 | (0.07 | ) | (0.06 | ) | 7 | |||||||||||||||
| PT Smelting intercompany (loss) profit | (0.02 | ) | (0.02 | ) | (8 | ) | 0.01 | 0.01 | 4 | ||||||||||||||
| Gross profit per pound/ounce | $ | 1.06 | $ | 0.67 | $ | 369 | $ | 0.74 | $ | 0.37 | $ | 220 | |||||||||||
| Copper sales (millions of recoverable pounds) | 1,054 | 1,054 | 744 | 744 | |||||||||||||||||||
| Gold sales (thousands of recoverable ounces) | 1,054 | 1,224 |
A significant portion of PT-FI's costs are fixed and unit costs vary depending on volumes and other factors. Indonesia's unit net cash costs (including gold and silver credits) of $0.83 per pound of copper in 2016 were lower than unit net cash costs of $1.09 per pound in 2015, primarily reflecting higher copper sales volumes, partly offset by lower gold and silver credits.
Treatment charges vary with the volume of metals sold and the price of copper, and royalties vary with the volume
of metals sold and the prices of copper and gold.
Export duties were initially set at 7.5 percent in July 2014 and were reduced to 5.0 percent in July 2015 as a result
of smelter development progress. Export duties totaled $95 million in 2016, $109 million in 2015 and $77 million in 2014.
PT-FI's royalties totaled $131 million in 2016, $114 million in 2015 and $115 million in 2014. Refer to Note 13 for further discussion of PT-FI's royalties.
Because certain assets are depreciated on a straight-line basis, PT-FI’s unit depreciation rate varies with the level of copper production and sales.
Revenue adjustments primarily result from changes in prices on provisionally priced copper sales recognized in prior periods. Refer to “Consolidated Results - Revenues” for further discussion of adjustments to prior period provisionally priced copper sales.
PT Smelting intercompany (loss) profit represents the change in the deferral of 25 percent of PT-FI's profit on sales to PT Smelting. Refer to "Operations - Smelting & Refining" for further discussion.
Anticipated higher ore grades from the Grasberg mine are expected to result in lower unit net cash costs in 2017. Assuming an average gold price of $1,200 per ounce for 2017 and achievement of the sales volume and
cost estimates included in our January 2017 projections (including the resumption of concentrate exports by PT-FI in February 2017, which has not occurred as of February 24, 2017), unit net cash credits (net of gold and silver credits) for Indonesia mining were expected to approximate $0.03 per pound of copper for the year 2017. Indonesia mining's unit net cash credits would change by approximately $0.075 per pound for each $50 per ounce change in the average price of gold during 2017. Because of the fixed nature of a large portion of Indonesia's costs, unit costs vary from quarter to quarter depending on copper and gold volumes.
| 2015 | 2014 | ||||||||||||||||||||||
| By- Product | Co-Product Method | By- Product | Co-Product Method | ||||||||||||||||||||
| Method | Copper | Gold | Method | Copper | Gold | ||||||||||||||||||
| Revenues, excluding adjustments | $ | 2.33 | $ | 2.33 | $ | 1,129 | $ | 3.01 | $ | 3.01 | $ | 1,229 | |||||||||||
| Site production and delivery, before net noncash | |||||||||||||||||||||||
| and other costs shown below | 2.39 | 1.32 | 638 | 2.76 | a | 1.59 | 648 | ||||||||||||||||
| Gold and silver credits | (1.91 | ) | — | — | (2.25 | ) | — | — | |||||||||||||||
| Treatment charges | 0.31 | 0.17 | 83 | 0.26 | 0.15 | 61 | |||||||||||||||||
| Export duties | 0.15 | 0.08 | 39 | 0.12 | 0.06 | 27 | |||||||||||||||||
| Royalty on metals | 0.15 | 0.09 | 41 | 0.17 | 0.10 | 41 | |||||||||||||||||
| Unit net cash costs | 1.09 | 1.66 | 801 | 1.06 | 1.90 | 777 | |||||||||||||||||
| DD&A | 0.39 | 0.22 | 105 | 0.40 | 0.23 | 94 | |||||||||||||||||
| Noncash and other costs, net | 0.05 | 0.03 | 14 | 0.29 | a | 0.17 | 68 | ||||||||||||||||
| Total unit costs | 1.53 | 1.91 | 920 | 1.75 | 2.30 | 939 | |||||||||||||||||
| Revenue adjustments, primarily for pricing on | |||||||||||||||||||||||
| prior period open sales | (0.07 | ) | (0.06 | ) | 7 | (0.08 | ) | (0.08 | ) | 15 | |||||||||||||
| PT Smelting intercompany profit | 0.01 | 0.01 | 4 | 0.05 | 0.03 | 12 | |||||||||||||||||
| Gross profit per pound/ounce | $ | 0.74 | $ | 0.37 | $ | 220 | $ | 1.23 | $ | 0.66 | $ | 317 | |||||||||||
| Copper sales (millions of recoverable pounds) | 744 | 744 | 664 | 664 | |||||||||||||||||||
| Gold sales (thousands of recoverable ounces) | 1,224 | 1,168 |
| a. | Fixed costs totaling $0.22 per pound of copper charged directly to cost of sales as a result of the impact of export restrictions on PT-FI's operating rates are excluded from site production and delivery and included in net noncash and other costs in 2014. |
Unit net cash costs (net of gold and silver credits) for our Indonesia mining operations of $1.09 per pound of copper in 2015 were higher than unit net cash costs of $1.06 per pound in 2014, primarily reflecting lower gold and silver credits, partly offset by lower site production and delivery mostly associated with lower diesel costs and foreign exchange impacts.
Molybdenum Mines
We have two wholly owned molybdenum mines in North America – the Henderson underground mine and the Climax open-pit mine, both in Colorado. The Henderson and Climax mines produce high-purity, chemical-grade molybdenum concentrate, which is typically further processed into value-added molybdenum chemical products. The majority of the molybdenum concentrate produced at the Henderson and Climax mines, as well as from our North and South America copper mines, is processed at our own conversion facilities.
Operating and Development Activities. In response to market conditions, the Henderson molybdenum mine operated at reduced rates during 2016, resulting in an approximate 65 percent reduction in its annual production volumes. During 2016, we incorporated changes in the commercial pricing structure for our molybdenum-based chemical products to enable continuation of chemical-grade production.
Production from the Molybdenum mines totaled 26 million pounds of molybdenum in 2016, 48 million pounds in 2015 and 51 million pounds in 2014 . Refer to "Consolidated Results" for our consolidated molybdenum operating data, which includes sales of molybdenum produced at our Molybdenum mines, and from our North and South America copper mines, and refer to "Outlook" for projected consolidated molybdenum sales volumes.
Unit Net Cash Costs Per Pound of Molybdenum. Unit net cash costs per pound of molybdenum is a measure intended to provide investors with information about the cash-generating capacity of our mining operations expressed on a basis relating to the primary metal product for our respective operations. We use this measure for the same purpose and for monitoring operating performance by our mining operations. This information differs from measures of performance determined in accordance with U.S. GAAP and should not be considered in isolation or as a substitute for measures of performance determined in accordance with U.S. GAAP. This measure is presented by other metals mining companies, although our measure may not be comparable to similarly titled measures reported by other companies.
Average unit net cash costs for our molybdenum mines totaled $8.36 per pound of molybdenum in 2016, $7.11 per pound in 2015 and $7.08 per pound in 2014. The increase in the average unit net cash costs for molybdenum in 2016, compared to 2015 and 2014, primarily reflects lower volumes. Assuming achievement of current sales volume and cost estimates, we estimate unit net cash costs for the Molybdenum mines to average $7.75 per pound of molybdenum for the year 2017. Refer to "Product Revenues and Production Costs" for a reconciliation of unit net cash costs per pound to production and delivery costs applicable to sales reported in our consolidated financial statements.
Smelting & Refining
We wholly own and operate a smelter in Arizona (Miami smelter) and a smelter and refinery in Spain (Atlantic
Copper). Additionally, PT-FI owns 25 percent of a smelter and refinery in Gresik, Indonesia (PT Smelting).
Treatment charges for smelting and refining copper concentrate consist of a base rate per pound of copper and per
ounce of gold and are generally fixed. Treatment charges represent a cost to our mining operations and income to
Atlantic Copper and PT Smelting. Thus, higher treatment charges benefit our smelter operations and adversely
affect our mining operations. Our North America copper mines are less significantly affected by changes in
treatment charges because these operations are largely integrated with our Miami smelter. Through this form of
downstream integration, we are assured placement of a significant portion of our concentrate production.
Atlantic Copper smelts and refines copper concentrate and markets refined copper and precious metals in slimes. Following is a summary of Atlantic Copper's concentrate purchases from our copper mining operations and third parties for the years ended December 31:
| 2016 | 2015 | 2014 | ||||||
| North America copper mines | 13 | % | 23 | % | 21 | % | ||
| South America mining | 7 | 3 | a | 21 | ||||
| Indonesia mining | 3 | 3 | 8 | |||||
| Third parties | 77 | 71 | 50 | |||||
| 100 | % | 100 | % | 100 | % |
| a. | The decrease in purchases from the South America mines, compared to 2014, primarily reflects the impact of the November 2014 sale of the Candelaria and Ojos del Salado mines. |
PT-FI's contract with PT Smelting provides for PT-FI to supply 100 percent of the copper concentrate requirements
(subject to a minimum or maximum treatment charge rate) necessary for PT Smelting to produce 205,000 metric tons of copper annually on a priority basis. An extension of the minimum and maximum treatment charge rate, which expires in April 2017, is currently being negotiated. PT-FI may also sell copper concentrate to PT Smelting at market rates for quantities in excess of 205,000 metric tons of copper annually. PT-FI supplied 88 percent of PT Smelting's concentrate requirements in 2016 and approximately 80 percent in both 2015 and 2014. PT Smelting processed 42 percent in 2016, 37 percent in 2015 and 58 percent in 2014 of PT-FI's concentrate production.
Refer to "Operations - Indonesia Mining" and "Risk Factors" contained in Part I, Item IA. of our annual report on Form 10-K for the year ended December 31, 2016, for information regarding Indonesia regulatory matters that impact the export of anode slimes by PT Smelting.
We defer recognizing profits on sales from our mining operations to Atlantic Copper and on 25 percent of PT-FI's sales to PT Smelting until final sales to third parties occur. Changes in these deferrals attributable to variability in intercompany volumes resulted in net (reductions) additions to net income attributable to common stock of $(8) million ($(0.01) per share) in 2016, $42 million ($0.04 per share) in 2015 and $43 million ($0.04 per share) in 2014. Our net deferred profits on our inventories at Atlantic Copper and PT Smelting to be recognized in future periods' net income attributable to common stock totaled $43 million at December 31, 2016. Quarterly variations in ore grades, the timing of intercompany shipments and changes in product prices will result in variability in our net deferred profits and quarterly earnings.
Oil and Gas Operations
In December 2016, we completed the sales of the Deepwater GOM and onshore California oil and gas properties and, in July 2016, completed the sale of the Haynesville shale assets (refer to Note 2 for further discussion). In January 2017, we entered into an agreement to sell our property interests in the Madden area. Following the completion of the Madden transaction, our portfolio of oil and gas assets would include oil and natural gas production onshore in South Louisiana and on the GOM Shelf and oil production offshore California, which had total oil and gas sales volumes of 6.4 MMBOE during 2016.
Impairment of Oil and Gas Properties. Under the SEC's full cost accounting rules, a "ceiling test" is conducted each quarter to review the carrying value of the oil and gas properties for impairment. Refer to Note 1 and "Critical Accounting Estimates" for further discussion. The combined impact of the reduction in twelve-month historical prices and reserve revisions caused net capitalized costs with respect to FM O&G's proved U.S. oil and gas properties to exceed the ceiling test limitation specified by full cost accounting rules, which resulted in the recognition of impairment charges totaling $4.3 billion in 2016, $13.0 billion in 2015 and $3.7 billion in 2014. We also recognized impairment charges of $18 million in 2016 and $164 million in 2015 for international oil and gas properties, primarily related to unsuccessful exploration activities in Morocco.
Following completion of the sales of our Deepwater GOM and onshore California oil and gas properties, at December 31, 2016, we had $74 million remaining in our consolidated balance sheet for proved oil and gas properties, and no amounts recorded for unproved oil and gas properties.
U.S. Oil and Gas Operations. Following is summary operating results for the U.S. oil and gas operations for the years ended December 31:
| 2016 | 2015 | 2014a | ||||||||||
| Sales Volumes | ||||||||||||
| Oil (MMBbls) | 34.4 | 35.3 | 40.1 | |||||||||
| Natural gas (Bcf) | 65.1 | 89.7 | 80.8 | |||||||||
| NGLs (MMBbls) | 1.8 | 2.4 | 3.2 | |||||||||
| MMBOE | 47.1 | 52.6 | 56.8 | |||||||||
| Average Realizationsb | ||||||||||||
| Oil (per barrel) | $ | 39.13 | $ | 57.11 | $ | 90.00 | ||||||
| Natural gas (per MMBtu) | $ | 2.38 | $ | 2.59 | $ | 4.23 | ||||||
| NGLs (per barrel) | $ | 18.11 | $ | 18.90 | $ | 39.73 | ||||||
| Gross Loss per BOE | ||||||||||||
| Realized revenuesb | $ | 32.59 | $ | 43.54 | $ | 71.83 | ||||||
| Cash production costsb | (15.19 | ) | (18.59 | ) | (20.08 | ) | ||||||
| Cash operating marginb | 17.40 | 24.95 | 51.75 | |||||||||
| DD&A | (18.47 | ) | (34.28 | ) | (40.34 | ) | ||||||
| Impairment of oil and gas properties | (91.35 | ) | (246.67 | ) | (65.80 | ) | ||||||
| Accretion and other costs | (23.10 | ) | c | (4.41 | ) | c | (1.69 | ) | ||||
| Net noncash mark-to-market (losses) gains on derivative contracts | (0.87 | ) | (6.07 | ) | 11.03 | |||||||
| Other revenues | 0.44 | 0.43 | 0.06 | |||||||||
| Gross loss | $ | (115.95 | ) | $ | (266.05 | ) | $ | (44.99 | ) |
| a. | Includes results of the Eagle Ford shale assets prior to their sale in June 2014. |
| b. | Cash operating margin for oil and gas operations reflects realized revenues less cash production costs. Realized revenues exclude noncash mark-to-market adjustments on derivative contracts, and cash production costs exclude accretion and other costs. For reconciliations of realized revenues (including average realizations for oil, natural gas and NGLs) and cash production costs to revenues and production and delivery costs reported in our consolidated financial statements, refer to the supplemental schedule, "Product Revenues and Production Costs." |
| c. | Includes $21.63 per BOE in 2016 and $3.58 per BOE in 2015 primarily for drillship settlements/idle rig and contract termination costs, inventory adjustments and other asset impairments. |
Excluding the impact of realized cash gains (losses) on derivative contracts of $0.17 per barrel in 2016, $11.53 per barrel in 2015 and $(2.76) per barrel in 2014, the average realized price for crude oil was $38.96 per barrel in 2016 (86 percent of the average Brent crude oil price of $45.13 per barrel), $45.58 per barrel in 2015 (85 percent of the average Brent crude oil price of $53.64 per barrel) and $92.76 per barrel in 2014 (93 percent of the average Brent crude oil price of $99.45 per barrel).
The average realized price for natural gas was $2.38 per MMBtu in 2016, $2.59 per MMBtu in 2015 and $4.23 per MMBtu in 2014 ($4.37 per MMBtu excluding the impact of derivative contracts), compared to the NYMEX natural gas price average of $2.46 per MMBtu for the year 2016 contracts, $2.26 per MMBtu for the year 2015 contracts, and $4.41 per MMBtu for the year 2014 contracts.
Realized revenues for oil and gas operations of $32.59 per BOE for 2016 were lower than realized revenues of $43.54 per BOE for 2015, primarily reflecting lower oil prices and the impact of realized cash gains on derivative contracts in 2015 (cash gains of $0.13 per BOE in 2016, compared with $7.72 per BOE in 2015). Realized revenues for oil and gas operations of $43.54 per BOE for 2015 were lower than realized revenues of $71.83 per BOE for 2014, primarily reflecting lower oil prices and higher cash gains on derivative contracts (cash gains of $7.72 per BOE in 2015, compared with cash losses of $2.15 per BOE in 2014).
Cash production costs for oil and gas operations of $15.19 per BOE for 2016 were lower than cash production costs of $18.59 for 2015, primarily reflecting the impact of cost reduction efforts. Cash production costs of $18.59 per BOE for 2015 were lower than cash production costs of $20.08 per BOE for 2014, primarily reflecting lower well workover expense and steam gas costs in California.
Daily Sales Volumes. Following is a summary of average sales volumes per day by region for oil and gas operations for the years ended December 31:
| 2016 | 2015 | 2014 | ||||||||
| Sales Volumes (MBOE per day): | ||||||||||
| GOMa | 85 | 83 | 73 | |||||||
| Californiaa | 32 | 37 | 39 | |||||||
| Haynesville/Madden/Otherb | 11 | 24 | 20 | |||||||
| Eagle Fordc | — | — | 24 | |||||||
| Total oil and gas operations | 128 | 144 | 156 |
| a. | In December 2016, we completed the sales of the Deepwater GOM and onshore California oil and gas properties, which had average sales volumes of 100 MBOE per day in 2016. |
| b. | In July 2016, we completed the sale of the Haynesville shale assets, which contributed 7 MBOE per day to the 2016 average daily sales volumes. |
| c. | In June 2014, we completed the sale of the Eagle Ford shale assets. |
Daily sales volumes averaged 128 MBOE for 2016, including 94 MBbls of crude oil, 178 MMcf of natural gas and 5 MBbls of NGLs; 144 MBOE for 2015, including 96 MBbls of crude oil, 246 MMcf of natural gas and 7 MBbls of NGLs; and 156 MBOE for 2014, including 110 MBbls of crude oil, 221 MMcf of natural gas and 9 MBbls of NGLs.
DISCONTINUED OPERATIONS
Africa Mining
In November 2016, we completed the sale of our interest in TFHL, through which we held an effective 56 percent interest in the Tenke copper and cobalt mining concessions in the Southeast region of the DRC. In accordance with accounting guidelines, the operating results of Africa mining have been separately reported as discontinued operations in the consolidated statements of operations for all periods presented.
Operating Data. Following is summary operating data for our Africa mining operations for the years ended December 31:
| 2016a | 2015 | 2014 | ||||||||||
| Copper (millions of recoverable pounds) | ||||||||||||
| Production | 425 | 449 | 447 | |||||||||
| Sales | 424 | 467 | 425 | |||||||||
| Average realized price per poundb | $ | 2.10 | $ | 2.42 | $ | 3.06 | ||||||
| Cobalt (millions of contained pounds) | ||||||||||||
| Production | 32 | 35 | 29 | |||||||||
| Sales | 33 | 35 | 30 | |||||||||
| Average realized price per pound | $ | 7.45 | $ | 8.21 | $ | 9.66 | ||||||
| Ore milled (metric tons per day) | 15,200 | 14,900 | 14,700 | |||||||||
| Average ore grade (percent): | ||||||||||||
| Copper | 4.18 | 4.00 | 4.06 | |||||||||
| Cobalt | 0.44 | 0.43 | 0.34 | |||||||||
| Copper recovery rate (percent) | 93.6 | 94.0 | 92.6 |
| a. | Includes the results of Tenke through November 16, 2016. |
| b. | Includes point-of-sale transportation costs as negotiated in customer contracts. |
Sales volumes from TFM decreased to 424 million pounds of copper and 33 million pounds of cobalt in 2016, compared with 467 million pounds of copper and 35 million pounds of cobalt in 2015, primarily reflecting the November 2016 sale of our interest in TFHL.
Sales volumes from TFM increased to 467 million pounds of copper and 35 million pounds of cobalt in 2015, compared with 425 million pounds of copper and 30 million pounds of cobalt in 2014. Higher copper sales volumes primarily reflect timing of shipments and higher cobalt sales volumes primarily reflect higher ore grades.
Unit Net Cash Costs. Unit net cash costs per pound of copper is a measure intended to provide investors with information about the cash-generating capacity of our mining operations expressed on a basis relating to the primary metal product for our respective operations. We use this measure for the same purpose and for monitoring operating performance by our mining operations. This information differs from measures of performance determined in accordance with U.S. GAAP and should not be considered in isolation or as a substitute for measures of performance determined in accordance with U.S. GAAP. This measure is presented by other metals mining companies, although our measure may not be comparable to similarly titled measures reported by other companies.
Gross Profit per Pound of Copper and Cobalt. The following tables summarize the unit net cash costs and gross profit per pound of copper and cobalt at our Africa mining operations for the period from January 1, 2016, through November 16, 2016, and for the years ended December 31, 2015 and 2014. Refer to “Product Revenues and Production Costs” for an explanation of “by-product” and “co-product” methods and a reconciliation of unit net cash costs per pound to production and delivery costs applicable to sales reported in our consolidated financial statements.
| 2016 | 2015 | ||||||||||||||||||||||
| By-Product | Co-Product Method | By-Product | Co-Product Method | ||||||||||||||||||||
| Method | Copper | Cobalt | Method | Copper | Cobalt | ||||||||||||||||||
| Revenues, excluding adjustmentsa | $ | 2.10 | $ | 2.10 | $ | 7.45 | $ | 2.42 | $ | 2.42 | $ | 8.21 | |||||||||||
| Site production and delivery, before net noncash | |||||||||||||||||||||||
| and other costs shown below | 1.58 | 1.37 | 5.25 | 1.58 | 1.37 | 5.40 | |||||||||||||||||
| Cobalt creditsb | (0.39 | ) | — | — | (0.42 | ) | — | — | |||||||||||||||
| Royalty on metals | 0.05 | 0.04 | 0.12 | 0.05 | 0.04 | 0.14 | |||||||||||||||||
| Unit net cash costs | 1.24 | 1.41 | 5.37 | 1.21 | 1.41 | 5.54 | |||||||||||||||||
| DD&A | 0.50 | 0.41 | 1.16 | 0.55 | 0.46 | 1.26 | |||||||||||||||||
| Noncash and other costs, net | 0.05 | 0.04 | 0.12 | 0.07 | 0.06 | 0.16 | |||||||||||||||||
| Total unit costs | 1.79 | 1.86 | 6.65 | 1.83 | 1.93 | 6.96 | |||||||||||||||||
| Revenue adjustments, primarily for pricing on | |||||||||||||||||||||||
| prior period open sales | (0.01 | ) | (0.01 | ) | 0.12 | (0.01 | ) | (0.01 | ) | (0.02 | ) | ||||||||||||
| Gross profit per pound | $ | 0.30 | $ | 0.23 | $ | 0.92 | $ | 0.58 | $ | 0.48 | $ | 1.23 | |||||||||||
| Copper sales (millions of recoverable pounds) | 424 | 424 | 467 | 467 | |||||||||||||||||||
| Cobalt sales (millions of contained pounds) | 33 | 35 |
| a. | Includes point-of-sale transportation costs as negotiated in customer contracts. |
| b. | Net of cobalt downstream processing and freight costs. |
Higher unit net cash costs (net of cobalt credits) for Africa mining of $1.24 per pound of copper in 2016, compared with $1.21 per pound of copper in 2015, primarily reflects lower cobalt credits.
| 2015 | 2014 | ||||||||||||||||||||||
| By-Product | Co-Product Method | By-Product | Co-Product Method | ||||||||||||||||||||
| Method | Copper | Cobalt | Method | Copper | Cobalt | ||||||||||||||||||
| Revenues, excluding adjustmentsa | $ | 2.42 | $ | 2.42 | $ | 8.21 | $ | 3.06 | $ | 3.06 | $ | 9.66 | |||||||||||
| Site production and delivery, before net noncash | |||||||||||||||||||||||
| and other costs shown below | 1.58 | 1.37 | 5.40 | 1.56 | 1.39 | 5.30 | |||||||||||||||||
| Cobalt creditsb | (0.42 | ) | — | — | (0.48 | ) | — | — | |||||||||||||||
| Royalty on metals | 0.05 | 0.04 | 0.14 | 0.07 | 0.06 | 0.16 | |||||||||||||||||
| Unit net cash costs | 1.21 | 1.41 | 5.54 | 1.15 | 1.45 | 5.46 | |||||||||||||||||
| DD&A | 0.55 | 0.46 | 1.26 | 0.54 | 0.46 | 1.13 | |||||||||||||||||
| Noncash and other costs, net | 0.07 | 0.06 | 0.16 | 0.05 | 0.04 | 0.11 | |||||||||||||||||
| Total unit costs | 1.83 | 1.93 | 6.96 | 1.74 | 1.95 | 6.70 | |||||||||||||||||
| Revenue adjustments, primarily for pricing on | |||||||||||||||||||||||
| prior period open sales | (0.01 | ) | (0.01 | ) | (0.02 | ) | — | — | 0.07 | ||||||||||||||
| Gross profit per pound | $ | 0.58 | $ | 0.48 | $ | 1.23 | $ | 1.32 | $ | 1.11 | $ | 3.03 | |||||||||||
| Copper sales (millions of recoverable pounds) | 467 | 467 | 425 | 425 | |||||||||||||||||||
| Cobalt sales (millions of contained pounds) | 35 | 30 |
| a. | Includes point-of-sale transportation costs as negotiated in customer contracts. |
| b. | Net of cobalt downstream processing and freight costs. |
Higher unit net cash costs (net of cobalt credits) for Africa mining of $1.21 per pound of copper in 2015, compared with $1.15 per pound of copper in 2014, primarily reflects lower cobalt credits.
CAPITAL RESOURCES AND LIQUIDITY
Our consolidated operating cash flows vary with prices realized from copper, gold and molybdenum, our sales volumes, production costs, income taxes, other working capital changes and other factors. During 2016, we took actions to restore our balance sheet strength through a combination of asset sale transactions, cash flow from operations and capital market transactions. During the year, we completed $6.6 billion in asset sale transactions and generated gross proceeds of $1.5 billion from a registered at-the-market offering of common stock. Refer to Notes 2 and 10 for further discussion. During 2016, we reduced total debt by $4.3 billion, which included the repayment of the $3.0 billion balance of the our term loan.
We have retained a high-quality portfolio of long-lived copper assets positioned to generate long-term value. In addition to debt reduction plans, we are pursuing opportunities to enhance our mines' net present values, and we continue to advance studies for future development of our copper resources, the timing of which will be dependent on market conditions.
Cash
Following is a summary of the U.S. and international components of consolidated cash and cash equivalents available to the parent company (excluding cash and cash equivalents in assets held for sale of $16 million at December 31, 2016), net of noncontrolling interests' share, taxes and other costs at December 31, 2016 (in millions):
| Cash at domestic companies | $ | 3,908 | |
| Cash at international operations | 337 | ||
| Total consolidated cash and cash equivalents | 4,245 | ||
| Noncontrolling interests’ share | (95 | ) | |
| Cash, net of noncontrolling interests’ share | 4,150 | ||
| Withholding taxes and other | (22 | ) | |
| Net cash available | $ | 4,128 |
Cash held at our international operations is generally used to support our foreign operations' capital expenditures, operating expenses, working capital and other tax payments or other cash needs. Management believes that sufficient liquidity is available in the U.S. from cash balances and availability from our revolving credit facility and uncommitted lines of credit. We have not elected to permanently reinvest earnings from our foreign subsidiaries, and we have recorded deferred tax liabilities for foreign earnings that are available to be repatriated to the U.S. From time to time, our foreign subsidiaries distribute earnings to the U.S. through dividends that are subject to applicable withholding taxes and noncontrolling interests' share.
Debt
Following is a summary of our total debt and related weighted-average interest rates at December 31, 2016 (in billions, except percentages):
| Weighted- | |||||
| Average | |||||
| Interest Rate | |||||
| Senior Notes | $ | 14.4 | 4.4% | ||
| Cerro Verde Credit Facility | 1.4 | 2.7% | |||
| Other FCX debt | 0.2 | 3.1% | |||
| Total debt | $ | 16.0 | 4.2% | ||
At December 31, 2016, we had no borrowings, $43 million in letters of credit issued and availability of $3.5 billion under our revolving credit facility.
During 2016, we repaid the $3.0 billion balance of our term loan with proceeds from asset sale transactions, purchased $38 million of our senior notes in open-market transactions and exchanged $369 million in senior notes for 27.7 million shares of our common stock in a series of privately negotiated transactions. Additionally, in December 2016, we completed an exchange offer and consent solicitations associated with the Freeport-McMoRan Oil & Gas LLC senior notes. Refer to Note 8 for further discussion of debt.
Operating Activities
We generated consolidated operating cash flows totaling $3.7 billion in 2016 (including $57 million in working capital sources and changes in other tax payments), $3.2 billion in 2015 (including $0.4 billion in working capital sources and changes in other tax payments) and $5.6 billion in 2014 (net of $0.6 billion in working capital uses and changes in other tax payments).
Higher consolidated operating cash flows for 2016, compared with 2015, primarily reflects the impact of cost reduction efforts, partly offset by a decrease in working capital sources mostly resulting from higher trade receivables, partly offset by lower tax payments by our international mining operations.
Lower consolidated operating cash flows for 2015, compared with 2014, primarily reflects the impact of lower commodity price realizations, partly offset by an increase in working capital sources mostly associated with accounts receivable associated with settlements of oil and gas derivative contracts and inventories reflecting a decrease in volumes and lower average costs.
Subject to future commodity prices for copper, gold and molybdenum, we expect estimated consolidated operating cash flows for the year 2017, plus available cash and availability under our credit facility and uncommitted lines of credit, to be sufficient to fund our budgeted capital expenditures, scheduled debt maturities, noncontrolling interest distributions and other cash requirements for the year. Refer to “Outlook” for further discussion of projected operating cash flows for the year 2017, and to "Operations - Indonesia Mining" and "Risk Factors" contained in Part I, Item 1A. of our annual report on Form 10-K for the year ended December 31, 2016, for discussion of regulatory matters in Indonesia, which may have a significant impact on future results.
Investing Activities
Capital Expenditures. Capital expenditures, including capitalized interest, totaled $2.8 billion in 2016, consisting of $1.6 billion for mining operations (including $1.2 billion for major projects) and $1.2 billion for oil and gas operations; $6.4 billion in 2015, consisting of $3.3 billion for mining operations (including $2.4 billion for major projects) and $3.0 billion for oil and gas operations; and $7.2 billion in 2014, consisting of $4.0 billion for mining operations (including $2.9 billion for major projects) and $3.2 billion for oil and gas operations.
Lower capital expenditures in 2016, compared with 2015, primarily reflect a decrease in oil and gas exploration and development activities in Deepwater GOM and lower spending for major mining projects, mostly resulting from the completion of the Cerro Verde expansion.
Lower capital expenditures in 2015, compared with 2014, primarily reflected decreased spending for major projects at mining operations, mostly resulting from the completion of the Morenci mill expansion, which was substantially completed in May 2014.
Refer to "Outlook" for further discussion of projected capital expenditures for the year 2017.
Dispositions and Acquisitions. Proceeds, net of closing adjustments, from asset sales totaled $6.4 billion in 2016, primarily associated with the sales of our interest in TFHL, the Deepwater GOM, onshore California and Haynesville oil and gas properties, an additional 13 percent undivided interest in Morenci, and an interest in the Timok exploration project in Serbia.
Proceeds, net of closing adjustments, from asset sales in 2014 totaled $4.6 billion, associated with the sales of our 80 percent ownership interest in the Candelaria and Ojos del Salado mines and the Eagle Ford shale assets. In 2014, we also acquired additional Deepwater GOM interests for $1.4 billion.
Refer to Note 2 for further discussion of these dispositions and acquisitions.
Financing Activities
Debt Transactions. Net repayments of debt in 2016 totaled $3.9 billion primarily for the repayment of the term loan and payments on the Cerro Verde credit facility.
Net proceeds from debt in 2015 totaled $1.6 billion primarily reflecting borrowings of $1.4 billion under Cerro Verde's credit facility to fund its expansion project.
During 2014, we completed the sale of $3.0 billion of senior notes. The proceeds from these senior notes were used to fund our December 2014 tender offers for $1.14 billion aggregate principal of senior notes, essentially all of our 2015 scheduled debt maturities, $300 million of 7.625% Senior Notes, and to repay borrowings under our revolving credit facility.
Refer to Note 8 for further discussion of debt.
Equity Transactions. Net proceeds from the sale of common stock of $1.5 billion in 2016 and $1.9 billion in 2015 reflect sales of our common stock under registered at-the-market equity offerings. Refer to Note 10 for further discussion.
Dividends. The Board reduced our annual common stock dividend from $1.25 per share to $0.20 per share in
March 2015, and subsequently suspended the annual common stock dividend in December 2015. The declaration of dividends is at the discretion of our Board and will depend upon our financial results, cash requirements, future prospects and other factors deemed relevant by our Board. Additionally, in connection with the February 2016 amendment to the revolving credit facility, we are not permitted to pay dividends on our common stock on or prior to March 31, 2017.
We paid dividends on our common stock totaling $6 million in 2016 (all of which is related to accumulated dividends paid for vested stock-based compensation), $605 million in 2015 (including $115 million for a special dividend paid in accordance with the settlement terms of the shareholder derivative litigation) and $1.3 billion in 2014.
Cash dividends and other distributions paid to noncontrolling interests totaled $693 million (including $582 million for the redemption of a redeemable noncontrolling interest) in 2016, $120 million in 2015 and $424 million in 2014. These payments will vary based on the operating results and cash requirements of our consolidated subsidiaries.
CONTRACTUAL OBLIGATIONS
We have contractual and other long-term obligations, including debt maturities based on the principal amounts, which we expect to fund with available cash, projected operating cash flows, availability under our revolving credit facility or future financing transactions, if necessary. Following is a summary of these various obligations at December 31, 2016 (in millions):
| Total | 2017 | 2018 to 2019 | 2020 to 2021 | Thereafter | |||||||||||||||
| Debt maturities | $ | 15,948 | $ | 1,234 | $ | 3,381 | $ | 2,479 | $ | 8,854 | |||||||||
| Scheduled interest payment obligationsa | 6,134 | 654 | 1,174 | 995 | 3,311 | ||||||||||||||
| ARO and environmental obligationsb | 7,285 | 500 | 783 | 482 | 5,520 | ||||||||||||||
| Take-or-pay contractsc | 3,435 | 1,753 | 1,032 | 308 | 342 | ||||||||||||||
| Operating lease obligations | 251 | 45 | 58 | 39 | 109 | ||||||||||||||
| Totald | $ | 33,053 | $ | 4,186 | $ | 6,428 | $ | 4,303 | $ | 18,136 |
| a. | Scheduled interest payment obligations were calculated using stated coupon rates for fixed-rate debt and interest rates applicable at December 31, 2016, for variable-rate debt. |
| b. | Represents estimated cash payments, on an undiscounted and unescalated basis, associated with ARO and environmental activities (including $714 million for our oil and gas operations). The timing and the amount of these payments could change as a result of changes in regulatory requirements, changes in scope and timing of ARO activities, the settlement of environmental matters and as actual spending occurs. Refer to Note 12 for additional discussion of environmental and ARO matters. |
| c. | Represents contractual obligations for purchases of goods or services agreements enforceable and legally binding and that specify all significant terms, and primarily include the procurement of copper concentrate ($1.4 billion), cobalt ($0.8 billion), electricity ($0.5 billion) and transportation services ($0.4 billion). Some of our take-or-pay contracts are settled based on the prevailing market rate for the service or commodity purchased, and in some cases, the amount of the actual obligation may change over time because of market conditions. Obligations for copper concentrate provide for deliveries of specified volumes to Atlantic Copper at market-based prices. Obligations for cobalt provide for deliveries of specified volumes to Freeport Cobalt at market-based prices. Electricity obligations are primarily for long-term power purchase agreements in North America and contractual minimum demand at the South America mines. Transportation obligations are primarily for South America contracted ocean freight. |
As part of the termination and settlement of the drillship contracts, we agreed to provide contingent payments of up to $105 million, depending on the average price of crude oil over the 12-month period ending June 30, 2017. At December 31, 2016,
we had recorded $23 million for the fair value of contingent payments related to drillship settlements, which is included within the above amounts. Also included in the above amounts are oil and gas obligations related to the termination of contracts for support vessels and equipment.
| d. | This table excludes certain other obligations in our consolidated balance sheets, such as estimated funding for pension, postretirement and other employee benefit obligations as the funding may vary from year to year based on changes in the fair value of plan assets and actuarial assumptions, commitments and contingencies totaling $102 million and unrecognized tax benefits totaling $167 million where the timing of settlement is not determinable, and other less significant amounts. This table also excludes purchase orders for inventory and other goods and services, as purchase orders typically represent authorizations to purchase rather than binding agreements. |
In addition to our debt maturities and other contractual obligations discussed above, we have other commitments, which we expect to fund with available cash, projected operating cash flows, available credit facilities or future financing transactions, if necessary. These include (i) PT-FI's commitment to provide one percent of its annual revenue for the development of the local people in its area of operations through the Freeport Partnership Fund for Community Development, (ii) Cerro Verde's scheduled installment payments for disputed mining royalty assessments and (iii) other commercial commitments, including standby letters of credit, surety bonds and guarantees. Refer to Notes 12 and 13 for further discussion.
CONTINGENCIES
Environmental
The cost of complying with environmental laws is a fundamental and substantial cost of our business. At December 31, 2016, we had $1.2 billion recorded in our consolidated balance sheet for environmental obligations attributed to CERCLA or analogous state programs and for estimated future costs associated with environmental obligations that are considered probable based on specific facts and circumstances.
We incurred environmental capital expenditures and other environmental costs (including our joint venture partners’ shares) to comply with applicable environmental laws and regulations that affect our operations totaling $0.4 billion in each of 2016, 2015 and 2014. For 2017, we expect to incur approximately $0.6 billion of aggregate environmental capital expenditures and other environmental costs, which includes expenditures for Miami smelter pollution control equipment. The timing and amount of estimated payments could change as a result of changes in regulatory requirements, changes in scope and timing of reclamation and plug and abandonment activities, the settlement of environmental matters and the rate at which actual spending occurs on continuing matters.
Refer to Note 12 and "Risk Factors" contained in Part I, Item 1A. of our annual report on Form 10-K for the year ended December 31, 2016, for further information about environmental regulation, including significant environmental matters.
Asset Retirement Obligations
We recognize AROs as liabilities when incurred, with the initial measurement at fair value. These obligations, which are initially estimated based on discounted cash flow estimates, are accreted to full value over time through charges to cost of sales. Mine reclamation costs for disturbances are recorded as an ARO and as a related asset retirement cost (ARC) (included in property, plant, equipment and mine development costs) in the period of disturbance. Oil and gas plugging and abandonment costs are recognized as an ARO and as a related ARC (included in oil and gas properties) in the period in which the well is drilled or acquired. Our cost estimates are reflected on a third-party cost basis and comply with our legal obligation to retire tangible, long-lived assets. At December 31, 2016, we had $2.6 billion recorded in our consolidated balance sheet for AROs, including $0.6 billion related to our oil and gas properties. Spending on AROs totaled $188 million in 2016, $132 million in 2015 and $101 million in 2014 (including $133 million in 2016, $92 million in 2015 and $74 million in 2014 for our oil and gas operations). For 2017, we expect to incur approximately $240 million in aggregate ARO payments. Refer to Note 12 for further discussion.
Litigation and Other Contingencies
Refer to Notes 2 and 12 and "Legal Proceedings" contained in Part I, Item 3. of our annual report on Form 10-K for the year ended December 31, 2016, for further discussion of contingencies associated with legal proceedings and other matters.
DISCLOSURES ABOUT MARKET RISKS
Commodity Price Risk
Our consolidated revenues from our mining operations include the sale of copper concentrate, copper cathode, copper rod, gold, molybdenum and other metals by our North and South America mines, the sale of copper concentrate (which also contains significant quantities of gold and silver) by our Indonesia mining operations, the sale of molybdenum in various forms by our molybdenum operations, and the sale of copper cathode, copper anode and gold in anode and slimes by Atlantic Copper. Our financial results will vary with fluctuations in the market prices of the commodities we produce, primarily copper and gold, and to a lesser extent molybdenum and silver. For projected sensitivities of our operating cash flow to changes in commodity prices, refer to "Outlook." World market prices for these commodities have fluctuated historically and are affected by numerous factors beyond our control. Refer to "Risk Factors" contained in Part I, Item 1A. of our annual report on Form 10-K for the year ended December 31, 2016, for further discussion of financial risks associated with fluctuations in the market prices of the commodities we sell.
During 2016, our mined copper (excluding volumes from Tenke) was sold 58 percent in concentrate, 21 percent as cathode and 21 percent as rod from North America operations. Substantially all of our copper concentrate and cathode sales contracts provide final copper pricing in a specified future month (generally one to four months from the shipment date) based primarily on quoted LME monthly average spot copper prices. We receive market prices based on prices in the specified future period, which results in price fluctuations recorded through revenues until the date of settlement. We record revenues and invoice customers at the time of shipment based on then-current LME prices, which results in an embedded derivative on our provisionally priced concentrate and cathode sales that is adjusted to fair value through earnings each period, using the period-end forward prices, until final pricing on the date of settlement. To the extent final prices are higher or lower than what was recorded on a provisional basis, an increase or decrease to revenues is recorded each reporting period until the date of final pricing. Accordingly, in times of rising copper prices, our revenues benefit from adjustments to the final pricing of provisionally priced sales pursuant to contracts entered into in prior periods; in times of falling copper prices, the opposite occurs.
Following are the favorable (unfavorable) impacts of net adjustments to the prior years' provisionally priced copper sales for the years ended December 31 (in millions, except per share amounts):
| 2016 | 2015 | 2014 | |||||||||
| Revenues | $ | 5 | $ | (100 | ) | $ | (117 | ) | |||
| Net income attributable to common stock | $ | 2 | $ | (50 | ) | $ | (65 | ) | |||
| Net income per share attributable to common stock | $ | — | $ | (0.05 | ) | $ | (0.06 | ) |
At December 31, 2016, we had provisionally priced copper sales at our copper mining operations totaling 466 million pounds of copper (net of intercompany sales and noncontrolling interests) recorded at an average price of $2.51 per pound, subject to final pricing over the next several months. We estimate that each $0.05 change in the price realized from the December 31, 2016, provisional price recorded would have an approximate $15 million effect on 2017 net income attributable to common stock. The LME spot copper price closed at $2.73 per pound on February 15, 2017.
Foreign Currency Exchange Risk
The functional currency for most of our operations is the U.S. dollar. Substantially all of our revenues and a significant portion of our costs are denominated in U.S. dollars; however, some costs and certain asset and liability accounts are denominated in local currencies, including the Indonesian rupiah, Australian dollar, Peruvian sol, Chilean peso and euro. We recognized foreign currency translation gains (losses) on balances denominated in foreign currencies totaling $32 million in 2016, $(90) million in 2015 and $(2) million in 2014, primarily at our Indonesia and South America mines. Generally, our operating results are positively affected when the U.S. dollar strengthens in relation to those foreign currencies and adversely affected when the U.S. dollar weakens in relation to those foreign currencies.
Following is a summary of estimated annual payments and the impact of changes in foreign currency rates on our annual operating costs:
| Exchange Rate per $1 at December 31, | Estimated Annual Payments | 10% Change in Exchange Rate (in millions)a | ||||||||||||||||||||
| 2016 | 2015 | 2014 | (in local currency) | (in millions)b | Increase | Decrease | ||||||||||||||||
| Indonesia | ||||||||||||||||||||||
| Rupiah | 13,369 | 13,726 | 12,378 | 7.7 trillion | $ | 576 | $ | (52 | ) | $ | 64 | |||||||||||
| Australian dollar | 1.39 | 1.37 | 1.22 | 230 million | $ | 166 | $ | (15 | ) | $ | 18 | |||||||||||
| South America | ||||||||||||||||||||||
| Peruvian sol | 3.36 | 3.41 | 2.99 | 1.08 billion | $ | 321 | $ | (29 | ) | $ | 36 | |||||||||||
| Chilean peso | 670 | 710 | 607 | 104 billion | $ | 155 | $ | (14 | ) | $ | 17 | |||||||||||
| Atlantic Copper | ||||||||||||||||||||||
| Euro | 0.95 | 0.92 | 0.82 | 140 million | $ | 147 | $ | (13 | ) | $ | 16 |
| a. | Reflects the estimated impact on annual operating costs assuming a 10 percent increase or decrease in the exchange rate reported at December 31, 2016. |
| b. | Based on exchange rates at December 31, 2016. |
Interest Rate Risk
At December 31, 2016, we had total debt maturities based on the principal amounts of $15.9 billion, of which approximately 10 percent was variable-rate debt with interest rates based on the London Interbank Offered Rate. The table below presents average interest rates for our scheduled maturities of principal for our outstanding debt (excluding fair value adjustments) and the related fair values at December 31, 2016 (in millions, except percentages):
| 2017 | 2018 | 2019 | 2020 | 2021 | Thereafter | Fair Value | |||||||||||||||||||||
| Fixed-rate debt | $ | 1,234 | $ | 1,483 | $ | 237 | $ | 1,617 | $ | 862 | $ | 8,854 | $ | 13,590 | |||||||||||||
| Average interest rate | 2.2 | % | 2.4 | % | 6.1 | % | 4.4 | % | 4.8 | % | 4.9 | % | 4.4 | % | |||||||||||||
| Variable-rate debt | — | $ | 770 | $ | 891 | — | — | — | $ | 1,606 | |||||||||||||||||
| Average interest rate | — | 2.7 | % | 2.8 | % | — | — | — | 2.7 | % |
NEW ACCOUNTING STANDARDS
Refer to Note 1 for discussion of recently issued accounting standards and their projected impact on our future financial statements and disclosures.
OFF-BALANCE SHEET ARRANGEMENTS
Refer to Note 13 for discussion of off-balance sheet arrangements.
PRODUCT REVENUES AND PRODUCTION COSTS
Mining Product Revenues and Unit Net Cash Costs
Unit net cash costs per pound of copper and molybdenum are measures intended to provide investors with information about the cash-generating capacity of our mining operations expressed on a basis relating to the primary metal product for the respective operations. We use this measure for the same purpose and for monitoring operating performance by our mining operations. This information differs from measures of performance determined in accordance with U.S. GAAP and should not be considered in isolation or as a substitute for measures of performance determined in accordance with U.S. GAAP. This measure is presented by other metals mining companies, although our measures may not be comparable to similarly titled measures reported by other companies.
We present gross profit per pound of copper in the following tables using both a “by-product” method and a “co-product” method. We use the by-product method in our presentation of gross profit per pound of copper because (i) the majority of our revenues are copper revenues, (ii) we mine ore, which contains copper, gold, molybdenum and other metals, (iii) it is not possible to specifically assign all of our costs to revenues from the copper, gold, molybdenum and other metals we produce, (iv) it is the method used to compare mining operations in certain industry publications and (v) it is the method used by our management and the Board to monitor operations. In the co-product method presentation below, shared costs are allocated to the different products based on their relative revenue values, which will vary to the extent our metals sales volumes and realized prices change.
We show revenue adjustments for prior period open sales as separate line items. Because these adjustments do not result from current period sales, we have reflected these separately from revenues on current period sales. Noncash and other costs, which are removed from site production and delivery costs in the calculation of unit net cash costs, consist of items such as stock-based compensation costs, start-up costs, inventory adjustments, long-lived asset impairments, restructuring and/or unusual charges. As discussed above, gold, molybdenum and other metal revenues at copper mines are reflected as credits against site production and delivery costs in the by-product method. The following schedules for our mining operations are presentations under both the by-product and co-product methods together with reconciliations to amounts reported in our consolidated financial statements.
Oil and Gas Product Revenues and Cash Production Costs per Unit
Realized revenues and cash production costs per unit are measures intended to provide investors with information about the cash operating margin of our oil and gas operations expressed on a BOE basis. We use this measure for the same purpose and for monitoring operating performance by our oil and gas operations. This information differs from measures of performance determined in accordance with U.S. GAAP and should not be considered in isolation or as a substitute for measures of performance determined in accordance with U.S. GAAP. Our measures may not be comparable to similarly titled measures reported by other companies.
We show adjustments from derivative contracts as separate line items. Because these adjustments do not result from oil and gas sales, these gains and losses have been reflected separately from revenues on current period sales. Additionally, accretion, charges for asset retirement obligations and other costs, such as idle/terminated rig costs, inventory and/or unusual charges, are removed from production and delivery costs in the calculation of cash production costs per BOE. The following schedules include calculations of oil and gas product revenues and cash production costs together with a reconciliation to amounts reported in our consolidated financial statements.
North America Copper Mines Product Revenues and Production Costs
| Year Ended December 31, 2016 | ||||||||||||||||||||
| (In millions) | By-Product | Co-Product Method | ||||||||||||||||||
| Method | Copper | Molybdenuma | Otherb | Total | ||||||||||||||||
| Revenues, excluding adjustments | $ | 4,113 | $ | 4,113 | $ | 213 | $ | 94 | $ | 4,420 | ||||||||||
| Site production and delivery, before net noncash | ||||||||||||||||||||
| and other costs shown below | 2,613 | 2,474 | 166 | 58 | 2,698 | |||||||||||||||
| By-product credits | (222 | ) | — | — | — | — | ||||||||||||||
| Treatment charges | 193 | 185 | — | 8 | 193 | |||||||||||||||
| Net cash costs | 2,584 | 2,659 | 166 | 66 | 2,891 | |||||||||||||||
| DD&A | 527 | 496 | 20 | 11 | 527 | |||||||||||||||
| Metals inventory adjustments | 1 | 1 | — | — | 1 | |||||||||||||||
| Noncash and other costs, net | 87 | 84 | 2 | 1 | 87 | |||||||||||||||
| Total costs | 3,199 | 3,240 | 188 | 78 | 3,506 | |||||||||||||||
| Revenue adjustments, primarily for pricing on prior period open sales | (1 | ) | (1 | ) | — | — | (1 | ) | ||||||||||||
| Gross profit | $ | 913 | $ | 872 | $ | 25 | $ | 16 | $ | 913 | ||||||||||
| Copper sales (millions of recoverable pounds) | 1,836 | 1,836 | ||||||||||||||||||
| Molybdenum sales (millions of recoverable pounds)a | 33 | |||||||||||||||||||
| Gross profit per pound of copper/molybdenum: | ||||||||||||||||||||
| Revenues, excluding adjustments | $ | 2.24 | $ | 2.24 | $ | 6.34 | ||||||||||||||
| Site production and delivery, before net noncash | ||||||||||||||||||||
| and other costs shown below | 1.42 | 1.35 | 4.93 | |||||||||||||||||
| By-product credits | (0.12 | ) | — | — | ||||||||||||||||
| Treatment charges | 0.11 | 0.10 | — | |||||||||||||||||
| Unit net cash costs | 1.41 | 1.45 | 4.93 | |||||||||||||||||
| DD&A | 0.29 | 0.27 | 0.60 | |||||||||||||||||
| Metals inventory adjustments | — | — | — | |||||||||||||||||
| Noncash and other costs, net | 0.05 | 0.05 | 0.06 | |||||||||||||||||
| Total unit costs | 1.75 | 1.77 | 5.59 | |||||||||||||||||
| Revenue adjustments, primarily for pricing | ||||||||||||||||||||
| on prior period open sales | — | — | — | |||||||||||||||||
| Gross profit per pound | $ | 0.49 | $ | 0.47 | $ | 0.75 | ||||||||||||||
| Reconciliation to Amounts Reported | ||||||||||||||||||||
| (In millions) | Metals | |||||||||||||||||||
| Production | Inventory | |||||||||||||||||||
| Revenues | and Delivery | DD&A | Adjustments | |||||||||||||||||
| Totals presented above | $ | 4,420 | $ | 2,698 | $ | 527 | $ | 1 | ||||||||||||
| Treatment charges | — | 193 | — | — | ||||||||||||||||
| Noncash and other costs, net | — | 87 | — | — | ||||||||||||||||
| Revenue adjustments, primarily for pricing on prior period open sales | (1 | ) | — | — | — | |||||||||||||||
| Eliminations and other | (45 | ) | (46 | ) | 3 | — | ||||||||||||||
| North America copper mines | 4,374 | 2,932 | 530 | 1 | ||||||||||||||||
| Other mining & eliminationsc | 8,943 | 5,911 | 1,117 | 35 | ||||||||||||||||
| Total mining | 13,317 | 8,843 | 1,647 | 36 | ||||||||||||||||
| U.S. oil & gas operations | 1,513 | 1,801 | 869 | — | ||||||||||||||||
| Corporate, other & eliminations | — | 53 | 14 | — | ||||||||||||||||
| As reported in FCX’s consolidated financial statements | $ | 14,830 | $ | 10,697 | $ | 2,530 | $ | 36 |
| a. | Reflects sales of molybdenum produced by certain of the North America copper mines to our molybdenum sales company at market-based pricing. |
| b. | Includes gold and silver product revenues and production costs. |
| c. | Represents the combined total for all other mining operations and the related eliminations, as presented in Note 16. |
| Year Ended December 31, 2015 | ||||||||||||||||||||
| (In millions) | By-Product | Co-Product Method | ||||||||||||||||||
| Method | Copper | Molybdenuma | Otherb | Total | ||||||||||||||||
| Revenues, excluding adjustments | $ | 4,907 | $ | 4,907 | $ | 261 | $ | 102 | $ | 5,270 | ||||||||||
| Site production and delivery, before net noncash | ||||||||||||||||||||
| and other costs shown below | 3,339 | 3,161 | 209 | 71 | 3,441 | |||||||||||||||
| By-product credits | (261 | ) | — | — | — | — | ||||||||||||||
| Treatment charges | 240 | 233 | — | 7 | 240 | |||||||||||||||
| Net cash costs | 3,318 | 3,394 | 209 | 78 | 3,681 | |||||||||||||||
| DD&A | 558 | 528 | 20 | 10 | 558 | |||||||||||||||
| Metals inventory adjustments | 142 | 139 | 2 | 1 | 142 | |||||||||||||||
| Noncash and other costs, net | 233 | c | 225 | 6 | 2 | 233 | ||||||||||||||
| Total costs | 4,251 | 4,286 | 237 | 91 | 4,614 | |||||||||||||||
| Revenue adjustments, primarily for pricing on prior period open sales | (28 | ) | (28 | ) | — | — | (28 | ) | ||||||||||||
| Gross profit | $ | 628 | $ | 593 | $ | 24 | $ | 11 | $ | 628 | ||||||||||
| Copper sales (millions of recoverable pounds) | 1,985 | 1,985 | ||||||||||||||||||
| Molybdenum sales (millions of recoverable pounds)a | 37 | |||||||||||||||||||
| Gross profit per pound of copper/molybdenum: | ||||||||||||||||||||
| Revenues, excluding adjustments | $ | 2.47 | $ | 2.47 | $ | 7.02 | ||||||||||||||
| Site production and delivery, before net noncash | ||||||||||||||||||||
| and other costs shown below | 1.68 | 1.59 | 5.61 | |||||||||||||||||
| By-product credits | (0.13 | ) | — | — | ||||||||||||||||
| Treatment charges | 0.12 | 0.12 | — | |||||||||||||||||
| Unit net cash costs | 1.67 | 1.71 | 5.61 | |||||||||||||||||
| DD&A | 0.28 | 0.27 | 0.53 | |||||||||||||||||
| Metals inventory adjustments | 0.07 | 0.07 | 0.07 | |||||||||||||||||
| Noncash and other costs, net | 0.12 | c | 0.11 | 0.16 | ||||||||||||||||
| Total unit costs | 2.14 | 2.16 | 6.37 | |||||||||||||||||
| Revenue adjustments, primarily for pricing | ||||||||||||||||||||
| on prior period open sales | (0.01 | ) | (0.01 | ) | — | |||||||||||||||
| Gross profit per pound | $ | 0.32 | $ | 0.30 | $ | 0.65 | ||||||||||||||
| Reconciliation to Amounts Reported | ||||||||||||||||||||
| (In millions) | Metals | |||||||||||||||||||
| Production | Inventory | |||||||||||||||||||
| Revenues | and Delivery | DD&A | Adjustments | |||||||||||||||||
| Totals presented above | $ | 5,270 | $ | 3,441 | $ | 558 | $ | 142 | ||||||||||||
| Treatment charges | — | 240 | — | — | ||||||||||||||||
| Noncash and other costs, net | — | 233 | — | — | ||||||||||||||||
| Revenue adjustments, primarily for pricing on prior period open sales | (28 | ) | — | — | — | |||||||||||||||
| Eliminations and other | (116 | ) | (115 | ) | 2 | — | ||||||||||||||
| North America copper mines | 5,126 | 3,799 | 560 | 142 | ||||||||||||||||
| Other mining & eliminationsd | 7,486 | 5,684 | 862 | 196 | ||||||||||||||||
| Total mining | 12,612 | 9,483 | 1,422 | 338 | ||||||||||||||||
| U.S. oil & gas operations | 1,994 | 1,211 | 1,804 | — | ||||||||||||||||
| Corporate, other & eliminations | 1 | (1 | ) | 14 | — | |||||||||||||||
| As reported in FCX’s consolidated financial statements | $ | 14,607 | $ | 10,693 | $ | 3,240 | $ | 338 |
| a. | Reflects sales of molybdenum produced by certain of the North America copper mines to our molybdenum sales company at market-based pricing. |
| b. | Includes gold and silver product revenues and production costs. |
| c. | Includes $99 million ($0.05 per pound) for asset impairment, restructuring and other net charges. |
| d. | Represents the combined total for all other mining operations and the related eliminations, as presented in Note 16. |
| Year Ended December 31, 2014 | ||||||||||||||||||||
| (In millions) | By-Product | Co-Product Method | ||||||||||||||||||
| Method | Copper | Molybdenuma | Otherb | Total | ||||||||||||||||
| Revenues, excluding adjustments | $ | 5,186 | $ | 5,186 | $ | 386 | $ | 120 | $ | 5,692 | ||||||||||
| Site production and delivery, before net noncash | ||||||||||||||||||||
| and other costs shown below | 3,057 | 2,860 | 226 | 78 | 3,164 | |||||||||||||||
| By-product credits | (399 | ) | — | — | — | — | ||||||||||||||
| Treatment charges | 203 | 198 | — | 5 | 203 | |||||||||||||||
| Net cash costs | 2,861 | 3,058 | 226 | 83 | 3,367 | |||||||||||||||
| DD&A | 473 | 448 | 19 | 6 | 473 | |||||||||||||||
| Noncash and other costs, net | 149 | 146 | 2 | 1 | 149 | |||||||||||||||
| Total costs | 3,483 | 3,652 | 247 | 90 | 3,989 | |||||||||||||||
| Revenue adjustments, primarily for pricing on prior period open sales | (7 | ) | (7 | ) | — | — | (7 | ) | ||||||||||||
| Gross profit | $ | 1,696 | $ | 1,527 | $ | 139 | $ | 30 | $ | 1,696 | ||||||||||
| Copper sales (millions of recoverable pounds) | 1,657 | 1,657 | ||||||||||||||||||
| Molybdenum sales (millions of recoverable pounds)a | 33 | |||||||||||||||||||
| Gross profit per pound of copper/molybdenum: | ||||||||||||||||||||
| Revenues, excluding adjustments | $ | 3.13 | $ | 3.13 | $ | 11.74 | ||||||||||||||
| Site production and delivery, before net noncash | ||||||||||||||||||||
| and other costs shown below | 1.85 | 1.73 | 6.85 | |||||||||||||||||
| By-product credits | (0.24 | ) | — | — | ||||||||||||||||
| Treatment charges | 0.12 | 0.12 | — | |||||||||||||||||
| Unit net cash costs | 1.73 | 1.85 | 6.85 | |||||||||||||||||
| DD&A | 0.29 | 0.27 | 0.60 | |||||||||||||||||
| Noncash and other costs, net | 0.09 | 0.09 | 0.07 | |||||||||||||||||
| Total unit costs | 2.11 | 2.21 | 7.52 | |||||||||||||||||
| Revenue adjustments, primarily for pricing | ||||||||||||||||||||
| on prior period open sales | — | — | — | |||||||||||||||||
| Gross profit per pound | $ | 1.02 | $ | 0.92 | $ | 4.22 | ||||||||||||||
| Reconciliation to Amounts Reported | ||||||||||||||||||||
| (In millions) | ||||||||||||||||||||
| Production | ||||||||||||||||||||
| Revenues | and Delivery | DD&A | ||||||||||||||||||
| Totals presented above | $ | 5,692 | $ | 3,164 | $ | 473 | ||||||||||||||
| Treatment charges | — | 203 | — | |||||||||||||||||
| Noncash and other costs, net | — | 149 | — | |||||||||||||||||
| Revenue adjustments, primarily for pricing on prior period open sales | (7 | ) | — | — | ||||||||||||||||
| Eliminations and other | (69 | ) | (76 | ) | 11 | |||||||||||||||
| North America copper mines | 5,616 | 3,440 | 484 | |||||||||||||||||
| Other mining & eliminationsc | 9,675 | 6,437 | 846 | |||||||||||||||||
| Total mining | 15,291 | 9,877 | 1,330 | |||||||||||||||||
| U.S. oil & gas operations | 4,710 | 1,237 | 2,291 | |||||||||||||||||
| Corporate, other & eliminations | — | 2 | 14 | |||||||||||||||||
| As reported in FCX’s consolidated financial statements | $ | 20,001 | $ | 11,116 | $ | 3,635 |
| a. | Reflects sales of molybdenum produced by certain of the North America copper mines to our molybdenum sales company at market-based pricing. |
| b. | Includes gold and silver product revenues and production costs. |
| c. | Represents the combined total for all other mining operations and the related eliminations, as presented in Note 16. |
South America Mining Product Revenues and Production Costs
| Year Ended December 31, 2016 | |||||||||||||||
| (In millions) | By-Product | Co-Product Method | |||||||||||||
| Method | Copper | Othera | Total | ||||||||||||
| Revenues, excluding adjustments | $ | 3,077 | $ | 3,077 | $ | 176 | $ | 3,253 | |||||||
| Site production and delivery, before net noncash | |||||||||||||||
| and other costs shown below | 1,681 | 1,601 | 120 | 1,721 | |||||||||||
| By-product credits | (136 | ) | — | — | — | ||||||||||
| Treatment charges | 320 | 320 | — | 320 | |||||||||||
| Royalty on metals | 7 | 6 | 1 | 7 | |||||||||||
| Net cash costs | 1,872 | 1,927 | 121 | 2,048 | |||||||||||
| DD&A | 552 | 523 | 29 | 552 | |||||||||||
| Noncash and other costs, net | 40 | 38 | 2 | 40 | |||||||||||
| Total costs | 2,464 | 2,488 | 152 | 2,640 | |||||||||||
| Revenue adjustments, primarily for pricing on prior period open sales | 11 | 11 | — | 11 | |||||||||||
| Gross profit | $ | 624 | $ | 600 | $ | 24 | $ | 624 | |||||||
| Copper sales (millions of recoverable pounds) | 1,332 | 1,332 | |||||||||||||
| Gross profit per pound of copper: | |||||||||||||||
| Revenues, excluding adjustments | $ | 2.31 | $ | 2.31 | |||||||||||
| Site production and delivery, before net noncash | |||||||||||||||
| and other costs shown below | 1.26 | 1.20 | |||||||||||||
| By-product credits | (0.10 | ) | — | ||||||||||||
| Treatment charges | 0.24 | 0.24 | |||||||||||||
| Royalty on metals | 0.01 | — | |||||||||||||
| Unit net cash costs | 1.41 | 1.44 | |||||||||||||
| DD&A | 0.41 | 0.39 | |||||||||||||
| Noncash and other costs, net | 0.03 | 0.03 | |||||||||||||
| Total unit costs | 1.85 | 1.86 | |||||||||||||
| Revenue adjustments, primarily for pricing | |||||||||||||||
| on prior period open sales | 0.01 | 0.01 | |||||||||||||
| Gross profit per pound | $ | 0.47 | $ | 0.46 | |||||||||||
| Reconciliation to Amounts Reported | |||||||||||||||
| (In millions) | |||||||||||||||
| Production | |||||||||||||||
| Revenues | and Delivery | DD&A | |||||||||||||
| Totals presented above | $ | 3,253 | $ | 1,721 | $ | 552 | |||||||||
| Treatment charges | (320 | ) | — | — | |||||||||||
| Royalty on metals | (7 | ) | — | — | |||||||||||
| Noncash and other costs, net | — | 40 | — | ||||||||||||
| Revenue adjustments, primarily for pricing on prior period open sales | 11 | — | — | ||||||||||||
| Eliminations and other | 1 | (3 | ) | 1 | |||||||||||
| South America mining | 2,938 | 1,758 | 553 | ||||||||||||
| Other mining & eliminationsb | 10,379 | 7,085 | 1,094 | ||||||||||||
| Total mining | 13,317 | 8,843 | 1,647 | ||||||||||||
| U.S. oil & gas operations | 1,513 | 1,801 | 869 | ||||||||||||
| Corporate, other & eliminations | — | 53 | 14 | ||||||||||||
| As reported in FCX’s consolidated financial statements | $ | 14,830 | $ | 10,697 | $ | 2,530 |
| a. | Includes silver sales of 3.7 million ounces ($18.05 per ounce average realized price). Also reflects sales of molybdenum produced by Cerro Verde to our molybdenum sales company at market-based pricing. |
| b. | Represents the combined total for all other mining operations and the related eliminations, as presented in Note 16. |
| Year Ended December 31, 2015 | |||||||||||||||
| (In millions) | By-Product | Co-Product Method | |||||||||||||
| Method | Copper | Othera | Total | ||||||||||||
| Revenues, excluding adjustments | $ | 2,075 | $ | 2,075 | $ | 65 | $ | 2,140 | |||||||
| Site production and delivery, before net noncash | |||||||||||||||
| and other costs shown below | 1,393 | 1,355 | 59 | 1,414 | |||||||||||
| By-product credits | (44 | ) | — | — | — | ||||||||||
| Treatment charges | 161 | 161 | — | 161 | |||||||||||
| Royalty on metals | 4 | 4 | — | 4 | |||||||||||
| Net cash costs | 1,514 | 1,520 | 59 | 1,579 | |||||||||||
| DD&A | 352 | 341 | 11 | 352 | |||||||||||
| Metals inventory adjustments | 73 | 73 | — | 73 | |||||||||||
| Noncash and other costs, net | 41 | 41 | — | 41 | |||||||||||
| Total costs | 1,980 | 1,975 | 70 | 2,045 | |||||||||||
| Revenue adjustments, primarily for pricing on prior period open sales | (28 | ) | (28 | ) | — | (28 | ) | ||||||||
| Gross profit (loss) | $ | 67 | $ | 72 | $ | (5 | ) | $ | 67 | ||||||
| Copper sales (millions of recoverable pounds) | 871 | 871 | |||||||||||||
| Gross profit per pound of copper: | |||||||||||||||
| Revenues, excluding adjustments | $ | 2.38 | $ | 2.38 | |||||||||||
| Site production and delivery, before net noncash | |||||||||||||||
| and other costs shown below | 1.60 | 1.56 | |||||||||||||
| By-product credits | (0.05 | ) | — | ||||||||||||
| Treatment charges | 0.19 | 0.19 | |||||||||||||
| Royalty on metals | — | — | |||||||||||||
| Unit net cash costs | 1.74 | 1.75 | |||||||||||||
| DD&A | 0.40 | 0.39 | |||||||||||||
| Metals inventory adjustments | 0.08 | 0.08 | |||||||||||||
| Noncash and other costs, net | 0.05 | 0.05 | |||||||||||||
| Total unit costs | 2.27 | 2.27 | |||||||||||||
| Revenue adjustments, primarily for pricing | |||||||||||||||
| on prior period open sales | (0.03 | ) | (0.03 | ) | |||||||||||
| Gross profit per pound | $ | 0.08 | $ | 0.08 | |||||||||||
| Reconciliation to Amounts Reported | |||||||||||||||
| (In millions) | Metals | ||||||||||||||
| Production | Inventory | ||||||||||||||
| Revenues | and Delivery | DD&A | Adjustments | ||||||||||||
| Totals presented above | $ | 2,140 | $ | 1,414 | $ | 352 | $ | 73 | |||||||
| Treatment charges | (161 | ) | — | — | — | ||||||||||
| Royalty on metals | (4 | ) | — | — | — | ||||||||||
| Noncash and other costs, net | — | 41 | — | — | |||||||||||
| Revenue adjustments, primarily for pricing on prior period open sales | (28 | ) | — | — | — | ||||||||||
| Eliminations and other | (13 | ) | (17 | ) | — | — | |||||||||
| South America mining | 1,934 | 1,438 | 352 | 73 | |||||||||||
| Other mining & eliminationsb | 10,678 | 8,045 | 1,070 | 265 | |||||||||||
| Total mining | 12,612 | 9,483 | 1,422 | 338 | |||||||||||
| U.S. oil & gas operations | 1,994 | 1,211 | 1,804 | — | |||||||||||
| Corporate, other & eliminations | 1 | (1 | ) | 14 | — | ||||||||||
| As reported in FCX’s consolidated financial statements | $ | 14,607 | $ | 10,693 | $ | 3,240 | $ | 338 |
| a. | Includes silver sales of 2.0 million ounces ($14.48 per ounce average realized price). Also reflects sales of molybdenum produced by Cerro Verde to our molybdenum sales company at market-based pricing. |
| b. | Represents the combined total for all other mining operations and the related eliminations, as presented in Note 16. |
| Year Ended December 31, 2014 | |||||||||||||||
| (In millions) | By-Product | Co-Product Method | |||||||||||||
| Method | Copper | Othera | Total | ||||||||||||
| Revenues, excluding adjustments | $ | 3,498 | $ | 3,498 | $ | 269 | $ | 3,767 | |||||||
| Site production and delivery, before net noncash | |||||||||||||||
| and other costs shown below | 1,839 | 1,710 | 151 | 1,861 | |||||||||||
| By-product credits | (247 | ) | — | — | — | ||||||||||
| Treatment charges | 191 | 191 | — | 191 | |||||||||||
| Royalty on metals | 6 | 5 | 1 | 6 | |||||||||||
| Net cash costs | 1,789 | b | 1,906 | 152 | 2,058 | ||||||||||
| DD&A | 367 | 345 | 22 | 367 | |||||||||||
| Noncash and other costs, net | 67 | 64 | 3 | 67 | |||||||||||
| Total costs | 2,223 | 2,315 | 177 | 2,492 | |||||||||||
| Revenue adjustments, primarily for pricing on prior period open sales | (65 | ) | (65 | ) | — | (65 | ) | ||||||||
| Gross profit | $ | 1,210 | $ | 1,118 | $ | 92 | $ | 1,210 | |||||||
| Copper sales (millions of recoverable pounds) | 1,135 | b | 1,135 | ||||||||||||
| Gross profit per pound of copper: | |||||||||||||||
| Revenues, excluding adjustments | $ | 3.08 | $ | 3.08 | |||||||||||
| Site production and delivery, before net noncash | |||||||||||||||
| and other costs shown below | 1.62 | 1.51 | |||||||||||||
| By-product credits | (0.22 | ) | — | ||||||||||||
| Treatment charges | 0.17 | 0.17 | |||||||||||||
| Royalty on metals | 0.01 | — | |||||||||||||
| Unit net cash costs | 1.58 | b | 1.68 | ||||||||||||
| DD&A | 0.32 | 0.31 | |||||||||||||
| Noncash and other costs, net | 0.06 | 0.06 | |||||||||||||
| Total unit costs | 1.96 | 2.05 | |||||||||||||
| Revenue adjustments, primarily for pricing | |||||||||||||||
| on prior period open sales | (0.05 | ) | (0.05 | ) | |||||||||||
| Gross profit per pound | $ | 1.07 | $ | 0.98 | |||||||||||
| Reconciliation to Amounts Reported | |||||||||||||||
| (In millions) | |||||||||||||||
| Production | |||||||||||||||
| Revenues | and Delivery | DD&A | |||||||||||||
| Totals presented above | $ | 3,767 | $ | 1,861 | $ | 367 | |||||||||
| Treatment charges | (191 | ) | — | — | |||||||||||
| Royalty on metals | (6 | ) | — | — | |||||||||||
| Noncash and other costs, net | — | 67 | — | ||||||||||||
| Revenue adjustments, primarily for pricing on prior period open sales | (65 | ) | — | — | |||||||||||
| Eliminations and other | 27 | 11 | — | ||||||||||||
| South America mining | 3,532 | 1,939 | 367 | ||||||||||||
| Other mining & eliminationsc | 11,759 | 7,938 | 963 | ||||||||||||
| Total mining | 15,291 | 9,877 | 1,330 | ||||||||||||
| U.S. oil & gas operations | 4,710 | 1,237 | 2,291 | ||||||||||||
| Corporate, other & eliminations | — | 2 | 14 | ||||||||||||
| As reported in FCX’s consolidated financial statements | $ | 20,001 | $ | 11,116 | $ | 3,635 |
| a. | Includes gold sales of 67 thousand ounces ($1,271 per ounce average realized price) and silver sales of 2.9 million ounces ($18.54 per ounce average realized price). Also reflects sales of molybdenum produced by Cerro Verde to our molybdenum sales company at market-based pricing. |
b.Following is a reconciliation of South America mining's 2014 unit net cash costs, excluding the Candelaria and Ojos del Salado mines:
| Net Cash Costs (in millions) | Copper Sales (millions of recoverable pounds) | Unit Net Cash Costs (per pound of copper) | |||||||||
| Presented above | $ | 1,789 | 1,135 | $ | 1.58 | ||||||
| Less: Candelaria and Ojos del Salado | 425 | 268 | |||||||||
| $ | 1,364 | 867 | $ | 1.57 |
| c. | Represents the combined total for all other mining operations and the related eliminations, as presented in Note 16. |
Indonesia Mining Product Revenues and Production Costs
| Year Ended December 31, 2016 | |||||||||||||||||||
| (In millions) | By-Product | Co-Product Method | |||||||||||||||||
| Method | Copper | Gold | Silvera | Total | |||||||||||||||
| Revenues, excluding adjustments | $ | 2,448 | $ | 2,448 | $ | 1,304 | $ | 50 | $ | 3,802 | |||||||||
| Site production and delivery, before net noncash | |||||||||||||||||||
| and other costs shown below | 1,717 | 1,106 | 589 | 22 | 1,717 | ||||||||||||||
| Gold and silver credits | (1,371 | ) | — | — | — | — | |||||||||||||
| Treatment charges | 297 | 191 | 102 | 4 | 297 | ||||||||||||||
| Export duties | 95 | 61 | 33 | 1 | 95 | ||||||||||||||
| Royalty on metals | 131 | 79 | 50 | 2 | 131 | ||||||||||||||
| Net cash costs | 869 | 1,437 | 774 | 29 | 2,240 | ||||||||||||||
| DD&A | 384 | 247 | 132 | 5 | 384 | ||||||||||||||
| Noncash and other costs, net | 51 | 33 | 17 | 1 | 51 | ||||||||||||||
| Total costs | 1,304 | 1,717 | 923 | 35 | 2,675 | ||||||||||||||
| Revenue adjustments, primarily for pricing on prior period open sales | (1 | ) | (1 | ) | 17 | — | 16 | ||||||||||||
| PT Smelting intercompany loss | (26 | ) | (17 | ) | (9 | ) | — | (26 | ) | ||||||||||
| Gross profit | $ | 1,117 | $ | 713 | $ | 389 | $ | 15 | $ | 1,117 | |||||||||
| Copper sales (millions of recoverable pounds) | 1,054 | 1,054 | |||||||||||||||||
| Gold sales (thousands of recoverable ounces) | 1,054 | ||||||||||||||||||
| Gross profit per pound of copper/per ounce of gold: | |||||||||||||||||||
| Revenues, excluding adjustments | $ | 2.32 | $ | 2.32 | $ | 1,237 | |||||||||||||
| Site production and delivery, before net noncash | |||||||||||||||||||
| and other costs shown below | 1.63 | 1.05 | 559 | ||||||||||||||||
| Gold and silver credits | (1.30 | ) | — | — | |||||||||||||||
| Treatment charges | 0.28 | 0.18 | 97 | ||||||||||||||||
| Export duties | 0.09 | 0.06 | 31 | ||||||||||||||||
| Royalty on metals | 0.13 | 0.07 | 47 | ||||||||||||||||
| Unit net cash costs | 0.83 | 1.36 | 734 | ||||||||||||||||
| DD&A | 0.36 | 0.24 | 125 | ||||||||||||||||
| Noncash and other costs, net | 0.05 | 0.03 | 17 | ||||||||||||||||
| Total unit costs | 1.24 | 1.63 | 876 | ||||||||||||||||
| Revenue adjustments, primarily for pricing | |||||||||||||||||||
| on prior period open sales | — | — | 16 | ||||||||||||||||
| PT Smelting intercompany loss | (0.02 | ) | (0.02 | ) | (8 | ) | |||||||||||||
| Gross profit per pound/ounce | $ | 1.06 | $ | 0.67 | $ | 369 | |||||||||||||
| Reconciliation to Amounts Reported | |||||||||||||||||||
| (In millions) | |||||||||||||||||||
| Production | |||||||||||||||||||
| Revenues | and Delivery | DD&A | |||||||||||||||||
| Totals presented above | $ | 3,802 | $ | 1,717 | $ | 384 | |||||||||||||
| Treatment charges | (297 | ) | — | — | |||||||||||||||
| Export duties | (95 | ) | — | — | |||||||||||||||
| Royalty on metals | (131 | ) | — | — | |||||||||||||||
| Noncash and other costs, net | — | 51 | — | ||||||||||||||||
| Revenue adjustments, primarily for pricing on prior period open sales | 16 | — | — | ||||||||||||||||
| PT Smelting intercompany loss | — | 26 | — | ||||||||||||||||
| Indonesia mining | 3,295 | 1,794 | 384 | ||||||||||||||||
| Other mining & eliminationsb | 10,022 | 7,049 | 1,263 | ||||||||||||||||
| Total mining | 13,317 | 8,843 | 1,647 | ||||||||||||||||
| U.S. oil & gas operations | 1,513 | 1,801 | 869 | ||||||||||||||||
| Corporate, other & eliminations | — | 53 | 14 | ||||||||||||||||
| As reported in FCX’s consolidated financial statements | $ | 14,830 | $ | 10,697 | $ | 2,530 |
a.Includes silver sales of 2.9 million ounces ($17.09 per ounce average realized price).
b.Represents the combined total for all other mining operations and the related eliminations, as presented in Note 16.
| Year Ended December 31, 2015 | |||||||||||||||||||
| (In millions) | By-Product | Co-Product Method | |||||||||||||||||
| Method | Copper | Gold | Silvera | Total | |||||||||||||||
| Revenues, excluding adjustments | $ | 1,735 | $ | 1,735 | $ | 1,382 | $ | 31 | $ | 3,148 | |||||||||
| Site production and delivery, before net noncash | |||||||||||||||||||
| and other costs shown below | 1,780 | 981 | 781 | 18 | 1,780 | ||||||||||||||
| Gold and silver credits | (1,422 | ) | — | — | — | — | |||||||||||||
| Treatment charges | 231 | 127 | 101 | 3 | 231 | ||||||||||||||
| Export duties | 109 | 60 | 48 | 1 | 109 | ||||||||||||||
| Royalty on metals | 114 | 63 | 50 | 1 | 114 | ||||||||||||||
| Net cash costs | 812 | 1,231 | 980 | 23 | 2,234 | ||||||||||||||
| DD&A | 293 | 161 | 129 | 3 | 293 | ||||||||||||||
| Noncash and other costs, net | 38 | 21 | 17 | — | 38 | ||||||||||||||
| Total costs | 1,143 | 1,413 | 1,126 | 26 | 2,565 | ||||||||||||||
| Revenue adjustments, primarily for pricing on prior period open sales | (50 | ) | (50 | ) | 8 | 1 | (41 | ) | |||||||||||
| PT Smelting intercompany profit | 10 | 5 | 5 | — | 10 | ||||||||||||||
| Gross profit | $ | 552 | $ | 277 | $ | 269 | $ | 6 | $ | 552 | |||||||||
| Copper sales (millions of recoverable pounds) | 744 | 744 | |||||||||||||||||
| Gold sales (thousands of recoverable ounces) | 1,224 | ||||||||||||||||||
| Gross profit per pound of copper/per ounce of gold: | |||||||||||||||||||
| Revenues, excluding adjustments | $ | 2.33 | $ | 2.33 | $ | 1,129 | |||||||||||||
| Site production and delivery, before net noncash | |||||||||||||||||||
| and other costs shown below | 2.39 | 1.32 | 638 | ||||||||||||||||
| Gold and silver credits | (1.91 | ) | — | — | |||||||||||||||
| Treatment charges | 0.31 | 0.17 | 83 | ||||||||||||||||
| Export duties | 0.15 | 0.08 | 39 | ||||||||||||||||
| Royalty on metals | 0.15 | 0.09 | 41 | ||||||||||||||||
| Unit net cash costs | 1.09 | 1.66 | 801 | ||||||||||||||||
| DD&A | 0.39 | 0.22 | 105 | ||||||||||||||||
| Noncash and other costs, net | 0.05 | 0.03 | 14 | ||||||||||||||||
| Total unit costs | 1.53 | 1.91 | 920 | ||||||||||||||||
| Revenue adjustments, primarily for pricing | |||||||||||||||||||
| on prior period open sales | (0.07 | ) | (0.06 | ) | 7 | ||||||||||||||
| PT Smelting intercompany profit | 0.01 | 0.01 | 4 | ||||||||||||||||
| Gross profit per pound/ounce | $ | 0.74 | $ | 0.37 | $ | 220 | |||||||||||||
| Reconciliation to Amounts Reported | |||||||||||||||||||
| (In millions) | |||||||||||||||||||
| Production | |||||||||||||||||||
| Revenues | and Delivery | DD&A | |||||||||||||||||
| Totals presented above | $ | 3,148 | $ | 1,780 | $ | 293 | |||||||||||||
| Treatment charges | (231 | ) | — | — | |||||||||||||||
| Export duties | (109 | ) | — | — | |||||||||||||||
| Royalty on metals | (114 | ) | — | — | |||||||||||||||
| Noncash and other costs, net | — | 38 | — | ||||||||||||||||
| Revenue adjustments, primarily for pricing on prior period open sales | (41 | ) | — | — | |||||||||||||||
| PT Smelting intercompany profit | — | (10 | ) | — | |||||||||||||||
| Indonesia mining | 2,653 | 1,808 | 293 | ||||||||||||||||
| Other mining & eliminationsb | 9,959 | 7,675 | 1,129 | ||||||||||||||||
| Total mining | 12,612 | 9,483 | 1,422 | ||||||||||||||||
| U.S. oil & gas operations | 1,994 | 1,211 | 1,804 | ||||||||||||||||
| Corporate, other & eliminations | 1 | (1 | ) | 14 | |||||||||||||||
| As reported in FCX’s consolidated financial statements | $ | 14,607 | $ | 10,693 | $ | 3,240 |
| a. | Includes silver sales of 2.1 million ounces ($14.81 per ounce average realized price). |
| b. | Represents the combined total for all other mining operations and the related eliminations, as presented in Note 16. |
| Year Ended December 31, 2014 | |||||||||||||||||||
| (In millions) | By-Product | Co-Product Method | |||||||||||||||||
| Method | Copper | Gold | Silvera | Total | |||||||||||||||
| Revenues, excluding adjustments | $ | 1,998 | $ | 1,998 | $ | 1,434 | $ | 39 | $ | 3,471 | |||||||||
| Site production and delivery, before net noncash | |||||||||||||||||||
| and other costs shown below | 1,831 | 1,054 | 757 | 20 | 1,831 | ||||||||||||||
| Gold and silver credits | (1,491 | ) | — | — | — | — | |||||||||||||
| Treatment charges | 171 | 99 | 70 | 2 | 171 | ||||||||||||||
| Export duties | 77 | 44 | 32 | 1 | 77 | ||||||||||||||
| Royalty on metals | 115 | 66 | 48 | 1 | 115 | ||||||||||||||
| Net cash costs | 703 | 1,263 | 907 | 24 | 2,194 | ||||||||||||||
| DD&A | 266 | 153 | 110 | 3 | 266 | ||||||||||||||
| Noncash and other costs, net | 191 | b | 110 | 79 | 2 | 191 | |||||||||||||
| Total costs | 1,160 | 1,526 | 1,096 | 29 | 2,651 | ||||||||||||||
| Revenue adjustments, primarily for pricing on prior period open sales | (55 | ) | (55 | ) | 18 | — | (37 | ) | |||||||||||
| PT Smelting intercompany profit | 34 | 20 | 14 | — | 34 | ||||||||||||||
| Gross profit | $ | 817 | $ | 437 | $ | 370 | $ | 10 | $ | 817 | |||||||||
| Copper sales (millions of recoverable pounds) | 664 | 664 | |||||||||||||||||
| Gold sales (thousands of recoverable ounces) | 1,168 | ||||||||||||||||||
| Gross profit per pound of copper/per ounce of gold: | |||||||||||||||||||
| Revenues, excluding adjustments | $ | 3.01 | $ | 3.01 | $ | 1,229 | |||||||||||||
| Site production and delivery, before net noncash | |||||||||||||||||||
| and other costs shown below | 2.76 | 1.59 | 648 | ||||||||||||||||
| Gold and silver credits | (2.25 | ) | — | — | |||||||||||||||
| Treatment charges | 0.26 | 0.15 | 61 | ||||||||||||||||
| Export duties | 0.12 | 0.06 | 27 | ||||||||||||||||
| Royalty on metals | 0.17 | 0.10 | 41 | ||||||||||||||||
| Unit net cash costs | 1.06 | 1.90 | 777 | ||||||||||||||||
| DD&A | 0.40 | 0.23 | 94 | ||||||||||||||||
| Noncash and other costs, net | 0.29 | b | 0.17 | 68 | |||||||||||||||
| Total unit costs | 1.75 | 2.30 | 939 | ||||||||||||||||
| Revenue adjustments, primarily for pricing | |||||||||||||||||||
| on prior period open sales | (0.08 | ) | (0.08 | ) | 15 | ||||||||||||||
| PT Smelting intercompany profit | 0.05 | 0.03 | 12 | ||||||||||||||||
| Gross profit per pound/ounce | $ | 1.23 | $ | 0.66 | $ | 317 | |||||||||||||
| Reconciliation to Amounts Reported | |||||||||||||||||||
| (In millions) | |||||||||||||||||||
| Production | |||||||||||||||||||
| Revenues | and Delivery | DD&A | |||||||||||||||||
| Totals presented above | $ | 3,471 | $ | 1,831 | $ | 266 | |||||||||||||
| Treatment charges | (171 | ) | — | — | |||||||||||||||
| Export duties | (77 | ) | — | — | |||||||||||||||
| Royalty on metals | (115 | ) | — | — | |||||||||||||||
| Noncash and other costs, net | — | 191 | b | — | |||||||||||||||
| Revenue adjustments, primarily for pricing on prior period open sales | (37 | ) | — | — | |||||||||||||||
| PT Smelting intercompany profit | — | (34 | ) | — | |||||||||||||||
| Indonesia mining | 3,071 | 1,988 | 266 | ||||||||||||||||
| Other mining & eliminationsc | 12,220 | 7,889 | 1,064 | ||||||||||||||||
| Total mining | 15,291 | 9,877 | 1,330 | ||||||||||||||||
| U.S. oil & gas operations | 4,710 | 1,237 | 2,291 | ||||||||||||||||
| Corporate, other & eliminations | — | 2 | 14 | ||||||||||||||||
| As reported in FCX’s consolidated financial statements | $ | 20,001 | $ | 11,116 | $ | 3,635 |
| a. | Includes silver sales of 2.2 million ounces ($17.42 per ounce average realized price). |
| b. | Includes $143 million ($0.22 per pound) of fixed costs charged directly to cost of sales as a result of the impact of export restrictions on PT-FI's operating rates. |
| c. | Represents the combined total for all other mining operations and the related eliminations, as presented in Note 16. |
Molybdenum Mines Product Revenues and Production Costs
| Years Ended December 31, | ||||||||||||||||
| (In millions) | 2016 | 2015 | 2014 | |||||||||||||
| Revenues, excluding adjustmentsa | $ | 208 | $ | 388 | $ | 630 | ||||||||||
| Site production and delivery, before net noncash | ||||||||||||||||
| and other costs shown below | 195 | 299 | 321 | |||||||||||||
| Treatment charges and other | 22 | 40 | 43 | |||||||||||||
| Net cash costs | 217 | 339 | 364 | |||||||||||||
| DD&A | 68 | 97 | 92 | |||||||||||||
| Metals inventory adjustments | 15 | 11 | — | |||||||||||||
| Noncash and other costs, net | 4 | 13 | b | 7 | ||||||||||||
| Total costs | 304 | 460 | 463 | |||||||||||||
| Gross (loss) profit | $ | (96 | ) | $ | (72 | ) | $ | 167 | ||||||||
| Molybdenum sales (millions of recoverable pounds)a | 26 | 48 | 51 | |||||||||||||
| Gross (loss) profit per pound of molybdenum: | ||||||||||||||||
| Revenues, excluding adjustmentsa | $ | 8.02 | $ | 8.14 | $ | 12.28 | ||||||||||
| Site production and delivery, before net noncash | ||||||||||||||||
| and other costs shown below | 7.50 | 6.27 | 6.24 | |||||||||||||
| Treatment charges and other | 0.86 | 0.84 | 0.84 | |||||||||||||
| Unit net cash costs | 8.36 | 7.11 | 7.08 | |||||||||||||
| DD&A | 2.62 | 2.04 | 1.80 | |||||||||||||
| Metals inventory adjustments | 0.58 | 0.22 | — | |||||||||||||
| Noncash and other costs, net | 0.15 | 0.28 | b | 0.15 | ||||||||||||
| Total unit costs | 11.71 | 9.65 | 9.03 | |||||||||||||
| Gross (loss) profit per pound | $ | (3.69 | ) | $ | (1.51 | ) | $ | 3.25 | ||||||||
| Reconciliation to Amounts Reported | ||||||||||||||||
| (In millions) | Metals | |||||||||||||||
| Production | Inventory | |||||||||||||||
| Year Ended December 31, 2016 | Revenues | and Delivery | DD&A | Adjustments | ||||||||||||
| Totals presented above | $ | 208 | $ | 195 | $ | 68 | $ | 15 | ||||||||
| Treatment charges and other | (22 | ) | — | — | — | |||||||||||
| Noncash and other costs, net | — | 4 | — | — | ||||||||||||
| Molybdenum mines | 186 | 199 | 68 | 15 | ||||||||||||
| Other mining & eliminationsc | 13,131 | 8,644 | 1,579 | 21 | ||||||||||||
| Total mining | 13,317 | 8,843 | 1,647 | 36 | ||||||||||||
| U.S. oil & gas operations | 1,513 | 1,801 | 869 | — | ||||||||||||
| Corporate, other & eliminations | — | 53 | 14 | — | ||||||||||||
| As reported in FCX’s consolidated financial statements | $ | 14,830 | $ | 10,697 | $ | 2,530 | $ | 36 | ||||||||
| Year Ended December 31, 2015 | ||||||||||||||||
| Totals presented above | $ | 388 | $ | 299 | $ | 97 | $ | 11 | ||||||||
| Treatment charges and other | (40 | ) | — | — | — | |||||||||||
| Noncash and other costs, net | — | 13 | — | — | ||||||||||||
| Molybdenum mines | 348 | 312 | 97 | 11 | ||||||||||||
| Other mining & eliminationsc | 12,264 | 9,171 | 1,325 | 327 | ||||||||||||
| Total mining | 12,612 | 9,483 | 1,422 | 338 | ||||||||||||
| U.S. oil & gas operations | 1,994 | 1,211 | 1,804 | — | ||||||||||||
| Corporate, other & eliminations | 1 | (1 | ) | 14 | — | |||||||||||
| As reported in FCX’s consolidated financial statements | $ | 14,607 | $ | 10,693 | $ | 3,240 | $ | 338 | ||||||||
| Year Ended December 31, 2014 | ||||||||||||||||
| Totals presented above | $ | 630 | $ | 321 | $ | 92 | $ | — | ||||||||
| Treatment charges and other | (43 | ) | — | — | — | |||||||||||
| Noncash and other costs, net | — | 7 | — | — | ||||||||||||
| Molybdenum mines | 587 | 328 | 92 | — | ||||||||||||
| Other mining & eliminationsc | 14,704 | 9,549 | 1,238 | 6 | ||||||||||||
| Total mining | 15,291 | 9,877 | 1,330 | 6 | ||||||||||||
| U.S. oil & gas operations | 4,710 | 1,237 | 2,291 | — | ||||||||||||
| Corporate, other & eliminations | — | 2 | 14 | — | ||||||||||||
| As reported in FCX’s consolidated financial statements | $ | 20,001 | $ | 11,116 | $ | 3,635 | $ | 6 | ||||||||
| a. | Reflects sales of the Molybdenum mines' production to the molybdenum sales company at market-based pricing. On a consolidated basis, realizations are based on the actual contract terms for sales to third parties; as a result, the consolidated average realized price per pound of molybdenum will differ from the amounts reported in this table. |
| b. | Includes restructuring charges of $7 million ($0.15 per pound) in 2015. |
| c. | Represents the combined total for all other mining operations and the related eliminations, as presented in Note 16. Also includes amounts associated with the molybdenum sales company, which includes sales of molybdenum produced by the molybdenum mines and by certain of the North and South America copper mines. |
U.S. Oil & Gas Product Revenues and Production Costs
| Year Ended December 31, 2016 | ||||||||||||||||
| (In millions) | Total | |||||||||||||||
| Natural | U.S. Oil | |||||||||||||||
| Oil | Gas | NGLs | & Gas | |||||||||||||
| Oil and gas revenues before derivatives | $ | 1,339 | $ | 155 | $ | 33 | $ | 1,527 | ||||||||
| Cash gains on derivative contracts | 6 | — | — | 6 | ||||||||||||
| Realized revenues | $ | 1,345 | $ | 155 | $ | 33 | 1,533 | |||||||||
| Cash production costs | (714 | ) | ||||||||||||||
| Cash operating margin | 819 | |||||||||||||||
| DD&A | (869 | ) | ||||||||||||||
| Impairment of oil and gas properties | (4,299 | ) | ||||||||||||||
| Accretion and other costs | (1,087 | ) | a | |||||||||||||
| Net noncash mark-to-market losses on derivative contracts | (41 | ) | ||||||||||||||
| Other revenue | 21 | |||||||||||||||
| Gross loss | $ | (5,456 | ) | |||||||||||||
| Oil (MMBbls) | 34.4 | |||||||||||||||
| Gas (Bcf) | 65.1 | |||||||||||||||
| NGLs (MMBbls) | 1.8 | |||||||||||||||
| Oil Equivalents (MMBOE) | 47.1 | |||||||||||||||
| Oil | Natural Gas | NGLs | ||||||||||||||
| (per barrel) | (per MMBtu) | (per barrel) | Per BOE | |||||||||||||
| Oil and gas revenues before derivatives | $ | 38.96 | $ | 2.38 | $ | 18.11 | $ | 32.46 | ||||||||
| Cash gains on derivative contracts | 0.17 | — | — | 0.13 | ||||||||||||
| Realized revenues | $ | 39.13 | $ | 2.38 | $ | 18.11 | 32.59 | |||||||||
| Cash production costs | (15.19 | ) | ||||||||||||||
| Cash operating margin | 17.40 | |||||||||||||||
| DD&A | (18.47 | ) | ||||||||||||||
| Impairment of oil and gas properties | (91.35 | ) | ||||||||||||||
| Accretion and other costs | (23.10 | ) | a | |||||||||||||
| Net noncash mark-to-market losses on derivative contracts | (0.87 | ) | ||||||||||||||
| Other revenue | 0.44 | |||||||||||||||
| Gross loss | $ | (115.95 | ) | |||||||||||||
| Reconciliation to Amounts Reported | ||||||||||||||||
| (In millions) | Impairment of | |||||||||||||||
| Production | Oil and Gas | |||||||||||||||
| Revenues | and Delivery | DD&A | Properties | |||||||||||||
| Totals presented above | $ | 1,527 | $ | 714 | $ | 869 | $ | 4,299 | ||||||||
| Cash gains on derivative contracts | 6 | — | — | — | ||||||||||||
| Net noncash mark-to-market losses on derivative contracts | (41 | ) | — | — | — | |||||||||||
| Accretion and other costs | — | 1,087 | — | — | ||||||||||||
| Other revenue | 21 | — | — | — | ||||||||||||
| U.S. oil & gas operations | 1,513 | 1,801 | 869 | 4,299 | ||||||||||||
| Total miningb | 13,317 | 8,843 | 1,647 | — | ||||||||||||
| Corporate, other & eliminations | — | 53 | 14 | 18 | c | |||||||||||
| As reported in FCX's consolidated financial statements | $ | 14,830 | $ | 10,697 | $ | 2,530 | $ | 4,317 | ||||||||
| a. | Includes charges of $1.0 billion ($21.63 per BOE) primarily for drillship settlements/idle rig and contract termination costs, inventory adjustments and asset impairments, partly offset by adjustments to prior year mineral tax assessments related to the California properties. |
| b. | Represents the combined total for mining operations and the related eliminations, as presented in Note 16. |
| c. | Reflects impairment of international oil and gas properties, primarily in Morocco. |
| Year Ended December 31, 2015 | Total | |||||||||||||||
| (In millions) | U.S. Oil | |||||||||||||||
| Oil | Natural Gas | NGLs | & Gas | |||||||||||||
| Oil and gas revenues before derivatives | $ | 1,607 | $ | 232 | $ | 46 | $ | 1,885 | ||||||||
| Cash gains on derivative contracts | 406 | — | — | 406 | ||||||||||||
| Realized revenues | $ | 2,013 | $ | 232 | $ | 46 | 2,291 | |||||||||
| Cash production costs | (979 | ) | ||||||||||||||
| Cash operating margin | 1,312 | |||||||||||||||
| DD&A | (1,804 | ) | ||||||||||||||
| Impairment of oil and gas properties | (12,980 | ) | ||||||||||||||
| Accretion and other costs | (232 | ) | a | |||||||||||||
| Net noncash mark-to-market losses on derivative contracts | (319 | ) | ||||||||||||||
| Other revenue | 22 | |||||||||||||||
| Gross loss | $ | (14,001 | ) | |||||||||||||
| Oil (MMBbls) | 35.3 | |||||||||||||||
| Gas (Bcf) | 89.7 | |||||||||||||||
| NGLs (MMBbls) | 2.4 | |||||||||||||||
| Oil Equivalents (MMBOE) | 52.6 | |||||||||||||||
| Oil | Natural Gas | NGLs | ||||||||||||||
| (per barrel) | (per MMbtu) | (per barrel) | Per BOE | |||||||||||||
| Oil and gas revenues before derivatives | $ | 45.58 | $ | 2.59 | $ | 18.90 | $ | 35.82 | ||||||||
| Cash gains on derivative contracts | 11.53 | — | — | 7.72 | ||||||||||||
| Realized revenues | $ | 57.11 | $ | 2.59 | $ | 18.90 | 43.54 | |||||||||
| Cash production costs | (18.59 | ) | ||||||||||||||
| Cash operating margin | 24.95 | |||||||||||||||
| DD&A | (34.28 | ) | ||||||||||||||
| Impairment of oil and gas properties | (246.67 | ) | ||||||||||||||
| Accretion and other costs | (4.41 | ) | a | |||||||||||||
| Net noncash mark-to-market losses on derivative contracts | (6.07 | ) | ||||||||||||||
| Other revenue | 0.43 | |||||||||||||||
| Gross loss | $ | (266.05 | ) | |||||||||||||
| Reconciliation to Amounts Reported | ||||||||||||||||
| (In millions) | Impairment of | |||||||||||||||
| Production | Oil and Gas | |||||||||||||||
| Revenues | and Delivery | DD&A | Properties | |||||||||||||
| Totals presented above | $ | 1,885 | $ | 979 | $ | 1,804 | $ | 12,980 | ||||||||
| Cash gains on derivative contracts | 406 | — | — | — | ||||||||||||
| Net noncash mark-to-market losses on derivative contracts | (319 | ) | — | — | — | |||||||||||
| Accretion and other costs | — | 232 | — | — | ||||||||||||
| Other revenue | 22 | — | — | — | ||||||||||||
| U.S. oil & gas operations | 1,994 | 1,211 | 1,804 | 12,980 | ||||||||||||
| Total miningb | 12,612 | 9,483 | 1,422 | — | ||||||||||||
| Corporate, other & eliminations | 1 | (1 | ) | 14 | 164 | c | ||||||||||
| As reported in FCX's consolidated financial statements | $ | 14,607 | $ | 10,693 | $ | 3,240 | $ | 13,144 |
| a. | Includes $188 million ($3.58 per BOE) primarily for asset impairments and inventory adjustments, idle/terminated rig costs and prior year mineral tax assessments related to the California properties. |
| b. | Represents the combined total for mining operations and the related eliminations, as presented in Note 16. |
| c. | Reflects impairment of international oil and gas properties, primarily in Morocco. |
| Year Ended December 31, 2014 | Total | |||||||||||||||
| (In millions) | U.S. Oil | |||||||||||||||
| Oil | Natural Gas | NGLs | & Gas | |||||||||||||
| Oil and gas revenues before derivatives | $ | 3,721 | $ | 353 | $ | 128 | $ | 4,202 | ||||||||
| Cash losses on derivative contracts | (111 | ) | (11 | ) | — | (122 | ) | |||||||||
| Realized revenues | $ | 3,610 | $ | 342 | $ | 128 | 4,080 | |||||||||
| Cash production costs | (1,140 | ) | a | |||||||||||||
| Cash operating margin | 2,940 | |||||||||||||||
| DD&A | (2,291 | ) | ||||||||||||||
| Impairment of oil and gas properties | (3,737 | ) | ||||||||||||||
| Accretion and other costs | (97 | ) | b | |||||||||||||
| Net noncash mark-to-market gains on derivative contracts | 627 | |||||||||||||||
| Other revenue | 3 | |||||||||||||||
| Gross loss | $ | (2,555 | ) | |||||||||||||
| Oil (MMBbls) | 40.1 | |||||||||||||||
| Gas (Bcf) | 80.8 | |||||||||||||||
| NGLs (MMBbls) | 3.2 | |||||||||||||||
| Oil Equivalents (MMBOE) | 56.8 | a | ||||||||||||||
| Oil | Natural Gas | NGLs | ||||||||||||||
| (per barrel) | (per MMbtu) | (per barrel) | Per BOE | |||||||||||||
| Oil and gas revenues before derivatives | $ | 92.76 | $ | 4.37 | $ | 39.73 | $ | 73.98 | ||||||||
| Cash losses on derivative contracts | (2.76 | ) | (0.14 | ) | — | (2.15 | ) | |||||||||
| Realized revenues | $ | 90.00 | $ | 4.23 | $ | 39.73 | 71.83 | |||||||||
| Cash production costs | (20.08 | ) | a | |||||||||||||
| Cash operating margin | 51.75 | |||||||||||||||
| DD&A | (40.34 | ) | ||||||||||||||
| Impairment of oil and gas properties | (65.80 | ) | ||||||||||||||
| Accretion and other costs | (1.69 | ) | b | |||||||||||||
| Net noncash mark-to-market gains on derivative contracts | 11.03 | |||||||||||||||
| Other revenue | 0.06 | |||||||||||||||
| Gross loss | $ | (44.99 | ) | |||||||||||||
| Reconciliation to Amounts Reported | ||||||||||||||||
| (In millions) | Impairment of | |||||||||||||||
| Production | Oil and Gas | |||||||||||||||
| Revenues | and Delivery | DD&A | Properties | |||||||||||||
| Totals presented above | $ | 4,202 | $ | 1,140 | $ | 2,291 | $ | 3,737 | ||||||||
| Cash losses on derivative contracts | (122 | ) | — | — | — | |||||||||||
| Net noncash mark-to-market gains on derivative contracts | 627 | — | — | — | ||||||||||||
| Accretion and other costs | — | 97 | — | — | ||||||||||||
| Other revenue | 3 | — | — | — | ||||||||||||
| U.S. oil & gas operations | 4,710 | 1,237 | 2,291 | 3,737 | ||||||||||||
| Total miningc | 15,291 | 9,877 | 1,330 | — | ||||||||||||
| Corporate, other & eliminations | — | 2 | 14 | — | ||||||||||||
| As reported in FCX's consolidated financial statements | $ | 20,001 | $ | 11,116 | $ | 3,635 | $ | 3,737 |
a.Following is a reconciliation of oil and gas cash production costs per BOE, excluding Eagle Ford:
| Cash Production Costs (in millions) | Oil Equivalents (MMBOE) | Cash Production Costs Per BOE | |||||||||
| Presented above | $ | 1,140 | 56.8 | $ | 20.08 | ||||||
| Less: Eagle Ford | 113 | 8.7 | $ | 12.97 | |||||||
| $ | 1,027 | 48.1 | $ | 21.36 |
| b. | Includes $46 million ($0.81 per BOE) primarily for idle/terminated rig costs and inventory adjustments. |
| c. | Represents the combined total for all mining operations and the related eliminations, as presented in Note 16. |
Discontinued Operations (Africa Mining) Product Revenues and Production Costs
| January 1, 2016, through November 16, 2016 | |||||||||||||||
| (In millions) | By-Product | Co-Product Method | |||||||||||||
| Method | Copper | Cobalt | Total | ||||||||||||
| Revenues, excluding adjustmentsa | $ | 893 | $ | 893 | $ | 243 | $ | 1,136 | |||||||
| Site production and delivery, before net noncash | |||||||||||||||
| and other costs shown below | 673 | 583 | 172 | 755 | |||||||||||
| Cobalt creditsb | (165 | ) | — | — | — | ||||||||||
| Royalty on metals | 20 | 16 | 4 | 20 | |||||||||||
| Net cash costs | 528 | 599 | 176 | 775 | |||||||||||
| DD&A | 210 | 172 | 38 | 210 | |||||||||||
| Noncash and other costs, net | 21 | 17 | 4 | 21 | |||||||||||
| Total costs | 759 | 788 | 218 | 1,006 | |||||||||||
| Revenue adjustments, primarily for pricing on prior period open sales | (4 | ) | (4 | ) | 4 | — | |||||||||
| Gross profit | $ | 130 | $ | 101 | $ | 29 | $ | 130 | |||||||
| Copper sales (millions of recoverable pounds) | 424 | 424 | |||||||||||||
| Cobalt sales (millions of contained pounds) | 33 | ||||||||||||||
| Gross profit per pound of copper/cobalt: | |||||||||||||||
| Revenues, excluding adjustmentsa | $ | 2.10 | $ | 2.10 | $ | 7.45 | |||||||||
| Site production and delivery, before net noncash | |||||||||||||||
| and other costs shown below | 1.58 | 1.37 | 5.25 | ||||||||||||
| Cobalt creditsb | (0.39 | ) | — | — | |||||||||||
| Royalty on metals | 0.05 | 0.04 | 0.12 | ||||||||||||
| Unit net cash costs | 1.24 | 1.41 | 5.37 | ||||||||||||
| DD&A | 0.50 | 0.41 | 1.16 | ||||||||||||
| Noncash and other costs, net | 0.05 | 0.04 | 0.12 | ||||||||||||
| Total unit costs | 1.79 | 1.86 | 6.65 | ||||||||||||
| Revenue adjustments, primarily for pricing | |||||||||||||||
| on prior period open sales | (0.01 | ) | (0.01 | ) | 0.12 | ||||||||||
| Gross profit per pound | $ | 0.30 | $ | 0.23 | $ | 0.92 | |||||||||
| Reconciliation to Amounts Reported | |||||||||||||||
| (In millions) | |||||||||||||||
| Production | |||||||||||||||
| Revenues | and Delivery | DD&A | |||||||||||||
| Totals presented above | $ | 1,136 | $ | 755 | $ | 210 | |||||||||
| Royalty on metals | (20 | ) | — | — | |||||||||||
| Noncash and other costs, net | — | 21 | — | ||||||||||||
| Revenue adjustments, primarily for pricing on prior period open sales | — | — | — | ||||||||||||
| Eliminations and other adjustmentsc | (157 | ) | 57 | (130 | ) | ||||||||||
| Totald | $ | 959 | $ | 833 | $ | 80 |
| a. | Includes point-of-sale transportation costs as negotiated in customer contracts. |
| b. | Net of cobalt downstream processing and freight costs. |
| c. | Reflects adjustments associated with the presentation of Tenke as discontinued operations, including the elimination of intercompany sales to our consolidated subsidiaries and the impact of discontinuing DD&A in May 2016. |
| d. | Refer to Note 2 for a reconciliation of these amounts to net (loss) income from discontinued operations as reported in our consolidated financial statements. |
| Year Ended December 31, 2015 | |||||||||||||||
| (In millions) | By-Product | Co-Product Method | |||||||||||||
| Method | Copper | Cobalt | Total | ||||||||||||
| Revenues, excluding adjustmentsa | $ | 1,129 | $ | 1,129 | $ | 287 | $ | 1,416 | |||||||
| Site production and delivery, before net noncash | |||||||||||||||
| and other costs shown below | 738 | 639 | 189 | 828 | |||||||||||
| Cobalt creditsb | (196 | ) | — | — | — | ||||||||||
| Royalty on metals | 25 | 20 | 5 | 25 | |||||||||||
| Net cash costs | 567 | 659 | 194 | 853 | |||||||||||
| DD&A | 257 | 213 | 44 | 257 | |||||||||||
| Noncash and other costs, net | 32 | 27 | 5 | 32 | |||||||||||
| Total costs | 856 | 899 | 243 | 1,142 | |||||||||||
| Revenue adjustments, primarily for pricing on prior period open sales | (6 | ) | (6 | ) | (1 | ) | (7 | ) | |||||||
| Gross profit | $ | 267 | $ | 224 | $ | 43 | $ | 267 | |||||||
| Copper sales (millions of recoverable pounds) | 467 | 467 | |||||||||||||
| Cobalt sales (millions of contained pounds) | 35 | ||||||||||||||
| Gross profit per pound of copper/cobalt: | |||||||||||||||
| Revenues, excluding adjustmentsa | $ | 2.42 | $ | 2.42 | $ | 8.21 | |||||||||
| Site production and delivery, before net noncash | |||||||||||||||
| and other costs shown below | 1.58 | 1.37 | 5.40 | ||||||||||||
| Cobalt creditsb | (0.42 | ) | — | — | |||||||||||
| Royalty on metals | 0.05 | 0.04 | 0.14 | ||||||||||||
| Unit net cash costs | 1.21 | 1.41 | 5.54 | ||||||||||||
| DD&A | 0.55 | 0.46 | 1.26 | ||||||||||||
| Noncash and other costs, net | 0.07 | 0.06 | 0.16 | ||||||||||||
| Total unit costs | 1.83 | 1.93 | 6.96 | ||||||||||||
| Revenue adjustments, primarily for pricing | |||||||||||||||
| on prior period open sales | (0.01 | ) | (0.01 | ) | (0.02 | ) | |||||||||
| Gross profit per pound | $ | 0.58 | $ | 0.48 | $ | 1.23 | |||||||||
| Reconciliation to Amounts Reported | |||||||||||||||
| (In millions) | |||||||||||||||
| Production | |||||||||||||||
| Revenues | and Delivery | DD&A | |||||||||||||
| Totals presented above | $ | 1,416 | $ | 828 | $ | 257 | |||||||||
| Royalty on metals | (25 | ) | — | — | |||||||||||
| Noncash and other costs, net | — | 32 | — | ||||||||||||
| Revenue adjustments, primarily for pricing on prior period open sales | (7 | ) | — | — | |||||||||||
| Eliminations and other adjustmentsc | (114 | ) | (8 | ) | — | ||||||||||
| Totald | $ | 1,270 | $ | 852 | $ | 257 |
| a. | Includes point-of-sale transportation costs as negotiated in customer contracts. |
| b. | Net of cobalt downstream processing and freight costs. |
| c. | Reflects adjustments associated with the presentation of Tenke as discontinued operations, including the elimination of intercompany sales to our consolidated subsidiaries. |
| d. | Refer to Note 2 for a reconciliation of these amounts to net (loss) income from discontinued operations as reported in our consolidated financial statements. |
| Year Ended December 31, 2014 | |||||||||||||||
| (In millions) | By-Product | Co-Product Method | |||||||||||||
| Method | Copper | Cobalt | Total | ||||||||||||
| Revenues, excluding adjustmentsa | $ | 1,301 | $ | 1,301 | $ | 285 | $ | 1,586 | |||||||
| Site production and delivery, before net noncash | |||||||||||||||
| and other costs shown below | 665 | 591 | 157 | 748 | |||||||||||
| Cobalt creditsb | (204 | ) | — | — | — | ||||||||||
| Royalty on metals | 29 | 24 | 5 | 29 | |||||||||||
| Net cash costs | 490 | 615 | 162 | 777 | |||||||||||
| DD&A | 228 | 195 | 33 | 228 | |||||||||||
| Noncash and other costs, net | 22 | 19 | 3 | 22 | |||||||||||
| Total costs | 740 | 829 | 198 | 1,027 | |||||||||||
| Revenue adjustments, primarily for pricing on prior period open sales | (1 | ) | (1 | ) | 2 | 1 | |||||||||
| Gross profit | $ | 560 | $ | 471 | $ | 89 | $ | 560 | |||||||
| Copper sales (millions of recoverable pounds) | 425 | 425 | |||||||||||||
| Cobalt sales (millions of contained pounds) | 30 | ||||||||||||||
| Gross profit per pound of copper/cobalt: | |||||||||||||||
| Revenues, excluding adjustmentsa | $ | 3.06 | $ | 3.06 | $ | 9.66 | |||||||||
| Site production and delivery, before net noncash | |||||||||||||||
| and other costs shown below | 1.56 | 1.39 | 5.30 | ||||||||||||
| Cobalt creditsb | (0.48 | ) | — | — | |||||||||||
| Royalty on metals | 0.07 | 0.06 | 0.16 | ||||||||||||
| Unit net cash costs | 1.15 | 1.45 | 5.46 | ||||||||||||
| DD&A | 0.54 | 0.46 | 1.13 | ||||||||||||
| Noncash and other costs, net | 0.05 | 0.04 | 0.11 | ||||||||||||
| Total unit costs | 1.74 | 1.95 | 6.70 | ||||||||||||
| Revenue adjustments, primarily for pricing | |||||||||||||||
| on prior period open sales | — | — | 0.07 | ||||||||||||
| Gross profit per pound | $ | 1.32 | $ | 1.11 | $ | 3.03 | |||||||||
| Reconciliation to Amounts Reported | |||||||||||||||
| (In millions) | |||||||||||||||
| Production | |||||||||||||||
| Revenues | and Delivery | DD&A | |||||||||||||
| Totals presented above | $ | 1,586 | $ | 748 | $ | 228 | |||||||||
| Royalty on metals | (29 | ) | — | — | |||||||||||
| Noncash and other costs, net | — | 22 | — | ||||||||||||
| Revenue adjustments, primarily for pricing on prior period open sales | 1 | — | — | ||||||||||||
| Eliminations and other adjustmentsc | (121 | ) | 12 | — | |||||||||||
| Totald | $ | 1,437 | $ | 782 | $ | 228 |
| a. | Includes point-of-sale transportation costs as negotiated in customer contracts. |
| b. | Net of cobalt downstream processing and freight costs. |
| c. | Reflects adjustments associated with reporting Tenke as discontinued operations, including the elimination of intercompany sales to our consolidated subsidiaries. |
| d. | Refer to Note 2 for a reconciliation of these amounts to net (loss) income from discontinued operations as reported in our consolidated financial statements. |
CAUTIONARY STATEMENT
Our discussion and analysis contains forward-looking statements in which we discuss our potential future performance. Forward-looking statements are all statements other than statements of historical facts, such as projections or expectations relating to ore grades and milling rates, production and sales volumes, unit net cash costs, operating cash flows, capital expenditures, debt reduction initiatives, exploration efforts and results, development and production activities and costs, liquidity, tax rates, the impact of copper, gold and molybdenum price changes, the impact of deferred intercompany profits on earnings, reserve estimates, future dividend payments, and share purchases and sales. The words “anticipates,” “may,” “can,” “plans,” “believes,” “estimates,” “expects,” “projects,” “targets,” “intends,” “likely,” “will,” “should,” “to be,” “potential” and any similar expressions are intended to identify those assertions as forward-looking statements. Under our revolving credit facility, as amended, we are not permitted to pay dividends on common stock on or prior to March 31, 2017. The declaration of dividends is at the discretion of the Board, subject to restrictions under our credit agreements, and will depend on our financial results, cash requirements, future prospects, and other factors deemed relevant by the Board.
We caution readers that forward-looking statements are not guarantees of future performance and actual results may differ materially from those anticipated, projected or assumed in the forward-looking statements. Important factors that can cause our actual results to differ materially from those anticipated in the forward-looking statements include supply of and demand for, and prices of copper, gold and molybdenum, mine sequencing, production rates, potential effects of cost and capital expenditure reductions and production curtailments on financial results and cash flow, the outcome of our debt reduction initiatives, our ability to secure regulatory approvals, potential inventory
adjustments, potential impairment of long-lived mining assets, the outcome of the impending dispute with the Indonesian government regarding PT-FI's COW, the potential effects of violence in Indonesia generally and in the province of Papua, industry risks, regulatory changes, political risks, labor relations, weather- and climate-related risks, environmental risks, litigation results (including the final disposition of the recent unfavorable Indonesian Tax Court ruling relating to surface water taxes) and other factors described in more detail in Part I, Item 1A. “Risk Factors” of our annual report on Form 10-K for the year ended December 31, 2016. With respect to our operations in Indonesia, such factors include whether PT-FI will be able to resume exporting its copper concentrate directly and indirectly through PT Smelting, which depends upon the satisfactory resolution of complex regulatory matters in Indonesia. PT-FI's inability to export copper concentrate itself and through PT Smelting for any extended period of time would lead to the continued suspension of all of our production in Indonesia.
Investors are cautioned that many of the assumptions upon which our forward-looking statements are based are likely to change after the forward-looking statements are made, including for example commodity prices, which we cannot control, and production volumes and costs, some aspects of which we may not be able to control. Further, we may make changes to our business plans that could affect our results. We caution investors that we do not intend to update forward-looking statements more frequently than quarterly notwithstanding any changes in our assumptions, changes in business plans, actual experience or other changes, and we undertake no obligation to update any forward-looking statements.
Previous: Item 5. Market for Registrant’s Common Equity, Related Stockholder Matters and Issuer Purchases of Equity Securities. · Next: Item 8. Financial Statements and Supplementary Data.