 filings.tools
Item 2. Management’s Discussion and Analysis of Financial Condition and Results of Operations.
244K characters. Original on sec.gov · Markdown
Item 2. Management’s Discussion and Analysis of Financial Condition and Results of Operations.
In Management’s Discussion and Analysis of Financial Condition and Results of Operations (MD&A), “we,” “us” and “our” refer to Freeport-McMoRan Inc. (FCX) and its consolidated subsidiaries. You should read this discussion in conjunction with our consolidated financial statements, the related MD&A and the discussion of our Business and Properties in our annual report on Form 10-K for the year ended December 31, 2023 (2023 Form 10-K), filed with the United States (U.S.) Securities and Exchange Commission (SEC). The results of operations reported and summarized below include forward-looking statements that are not guarantees of future performance and are not necessarily indicative of future operating results (refer to “Cautionary Statement” for further discussion). References to “Notes” are Notes included in our Notes to Consolidated Financial Statements (Unaudited). Throughout MD&A, all references to income or losses per share are on a diluted basis. Any references to our website is for information only and the contents of our website or information connected thereto are not incorporated in, or otherwise to be regarded as part of, this Form 10-Q.
OVERVIEW
We are a leading international metals company with the objective of being foremost in copper. Headquartered in Phoenix, Arizona, we operate large, long-lived, geographically diverse assets with significant proven and probable mineral reserves of copper, gold and molybdenum. We are one of the world’s largest publicly traded copper producers. Our portfolio of assets includes the Grasberg minerals district in Indonesia, one of the world’s largest copper and gold deposits; and significant operations in North America and South America, including the large-scale Morenci minerals district in Arizona and the Cerro Verde operation in Peru.
We remain focused on execution of our operating plans, enhancing productivity, controlling costs and initiatives to build and advance optionality in our organic growth portfolio. We continue to make progress on our leach innovation initiatives, with incremental copper production from these initiatives totaling 106 million pounds for the first six months of 2024, more than double amounts for the first six months of 2023. We have a favorable long-term outlook for copper, supported by copper’s increasingly important role in the global economy and limited available supplies to meet growing demand.
During second-quarter 2024, PT Freeport Indonesia (PT-FI) began commissioning of its new copper smelter and is working to execute a safe and efficient ramp-up to full capacity by year-end 2024. Additionally, construction continues on the adjoining precious metals refinery (PMR) with full production expected by year-end 2024. Upon completion and full ramp-up of the new smelter and PMR (collectively, the new downstream processing facilities), PT-FI will be a fully integrated producer of refined copper and gold.
Our results for the second quarter and first six months of 2024 were impacted by previously announced shipping delays in Indonesia during June 2024 associated with the timing of renewing PT-FI’s copper concentrate and anode slimes export licenses, which expired on May 31, 2024. On July 2, 2024, PT-FI was granted copper concentrate and anode slimes export licenses, which are valid through December 2024 when the full ramp-up of PT-FI’s new smelter is expected.
Net income attributable to common stockholders totaled $616 million in second-quarter 2024 and $1.1 billion for the first six months of 2024, compared with $343 million in second-quarter 2023 and $1.0 billion for the first six months of 2023. The increase in the 2024 periods, compared to the 2023 periods, primarily reflects higher average realized prices on copper and gold sales, and lower interest expense as a result of interest charges in 2023 recognized for Cerro Verde’s contested tax rulings issued by the Peruvian Supreme Court (refer to Note 4), partly offset by increased operating costs, and higher income tax expense and income attributable to noncontrolling interests at our South America and Indonesia operations. Refer to “Consolidated Results” for further discussion.
At June 30, 2024, we had consolidated debt of $9.4 billion and consolidated cash and cash equivalents of $5.3 billion, $6.2 billion including $0.9 billion of current restricted cash associated with a portion of PT-FI's export proceeds required to be temporarily deposited in Indonesia banks. Net debt totaled $0.3 billion, excluding $3.0 billion of debt for PT-FI’s new downstream processing facilities. Refer to “Net Debt” for reconciliations of consolidated debt, consolidated cash and cash equivalents and current restricted cash associated with PT-FI's export proceeds to net debt.
At June 30, 2024, we had $3.0 billion of availability under our revolving credit facility, and PT-FI and Cerro Verde had $1.75 billion and $350 million, respectively, of availability under their revolving credit facilities.
Refer to Note 4 and “Capital Resources and Liquidity” for further discussion of our debt balances and transactions.
OUTLOOK
As further discussed in “Risk Factors” in Part I, Item 1A. of our 2023 Form 10-K, our financial results vary as a result of fluctuations in market prices primarily for copper, gold and, to a lesser extent, molybdenum, as well as other factors. World market prices for these commodities have fluctuated historically and are affected by numerous factors beyond our control. Refer to “Markets” below for further discussion. Because we cannot control the prices of our products, the key measures that management focuses on in operating our business are sales volumes, unit net cash costs, operating cash flows and capital expenditures.
Consolidated Sales Volumes
Following are our projected consolidated sales volumes for the year 2024:
| Copper (billions of recoverable pounds): | |||||||||||||||||
| North America copper mines | 1.25 | ||||||||||||||||
| South America operations | 1.17 | ||||||||||||||||
| Indonesia operations | 1.67 | ||||||||||||||||
| Total | 4.09 | ||||||||||||||||
| Gold (millions of recoverable ounces) | 1.8 | ||||||||||||||||
| Molybdenum (millions of recoverable pounds) | 82 | a | |||||||||||||||
a.Includes 50 million pounds produced by our North America copper mines and South America operations and 32 million pounds produced by our Molybdenum mines.
Consolidated sales volumes in third-quarter 2024 are expected to approximate 1.0 billion pounds of copper, 475 thousand ounces of gold and 20 million pounds of molybdenum. Consolidated copper and gold production volumes for the year 2024 are expected to exceed 2024 sales volumes, reflecting the deferral of approximately 100 million pounds of copper and 120 thousand ounces of gold that will be processed by PT-FI’s new downstream processing facilities and sold as refined metal in 2025.
Projected sales volumes are dependent on operational performance; the timing of the ramp-up of PT-FI’s new smelter in Indonesia; weather-related conditions; timing of shipments and other factors detailed in the “Cautionary Statement” below. For other important factors that could cause results to differ materially from projections, refer to “Risk Factors” contained in Part I, Item 1A. of our 2023 Form 10-K.
Consolidated Unit Net Cash Costs
Consolidated unit net cash costs (net of by-product credits) for our copper mines are expected to average $1.63 per pound of copper for the year 2024 (including $1.71 per pound of copper in third-quarter 2024), based on achievement of current sales volume and cost estimates, and assuming average prices of $2,300 per ounce of gold and $20.00 per pound of molybdenum for the second half of 2024. Quarterly unit net cash costs vary with fluctuations in sales volumes and realized prices, primarily for gold and molybdenum. The impact of price changes on consolidated unit net cash costs for the year 2024 would approximate $0.02 per pound of copper for each $100 per ounce change in the average price of gold and $0.01 per pound of copper for each $2 per pound change in the average price of molybdenum for the second half of 2024.
Consolidated Operating Cash Flows
Our consolidated operating cash flows vary with sales volumes; prices realized from copper, gold and molybdenum sales; production costs; income taxes; other working capital changes; and other factors. Our consolidated operating cash flows are estimated to approximate $7.2 billion for the year 2024, based on current sales volume and cost estimates, and assuming average prices of $4.25 per pound of copper, $2,300 per ounce of gold and $20.00 per pound of molybdenum for the second half of 2024. Estimated consolidated operating cash flows for the year 2024 also reflect an estimated income tax provision of $2.7 billion (refer to “Consolidated Results – Income Taxes” for further discussion of our projected income tax rate for the year 2024). The impact of price changes for the second half of 2024 on consolidated operating cash flows would approximate $200 million for each $0.10 per pound change in the average price of copper, $80 million for each $100 per ounce change in the average price of gold and $50 million for each $2 per pound change in the average price of molybdenum.
Consolidated Capital Expenditures
Following is a summary of expected capital expenditures for the year 2024 (in billions):
| Major mining projects | $ | 2.3 | a | |||||
| PT-FI’s new downstream processing facilities | 1.0 | b | ||||||
| Other | 1.4 | |||||||
| Total | $ | 4.7 |
a.Primarily includes underground mine development, supporting mill and power capital costs in the Grasberg minerals district and expansion projects in North America.
b.Excludes capitalized interest and $0.3 billion of estimated commissioning and owner’s costs. Capital expenditures for PT-FI’s new downstream processing facilities are expected to be funded with PT-FI’s cash flows from operations and availability under PT-FI’s revolving credit facility.
We closely monitor market conditions and will adjust our operating plans, including capital expenditures, to protect our liquidity and preserve our asset values, as necessary.
MARKETS
Prices for copper, gold and molybdenum are affected by numerous factors beyond our control and can fluctuate significantly (for further discussion refer to “Risk Factors” contained in Part I, Item 1A. of our 2023 Form 10-K). The following graphs present the London Metal Exchange (LME) copper settlement price, the London Bullion Market Association (London) PM gold price, and the Platts Metals Daily Molybdenum Dealer Oxide weekly average price since January 2014. This graph presents LME copper settlement prices and the combined reported stocks of copper at the LME, Commodity Exchange Inc., and the Shanghai Futures Exchange from January 2014 through June 2024. During second-quarter 2024, LME copper settlement prices ranged from a low of $4.05 per pound to a record high of $4.92 per pound, averaged $4.42 per pound and settled at $4.30 per pound on June 28, 2024. The decline in copper prices from the highs in May 2024, reflect market uncertainties in China. The LME copper settlement price was $4.09 per pound on July 31, 2024.
We believe fundamentals for copper are favorable with limited available supplies and growing demand supported by copper’s critical role in the global transition to renewable power, electric vehicles and other carbon-reduction initiatives, continued urbanization in developing countries and growing connectivity globally.

This graph presents London PM gold prices from January 2014 through June 2024. During second-quarter 2024, London PM gold prices ranged from a low of $2,265 per ounce to a record high of $2,427 per ounce, averaged $2,338 per ounce and closed at $2,331 per ounce on June 28, 2024. Record high gold prices in second-quarter 2024 were propelled by U.S. interest rate cut expectations and strong safe-haven demand. The London PM gold price was $2,426 per ounce on July 31, 2024.
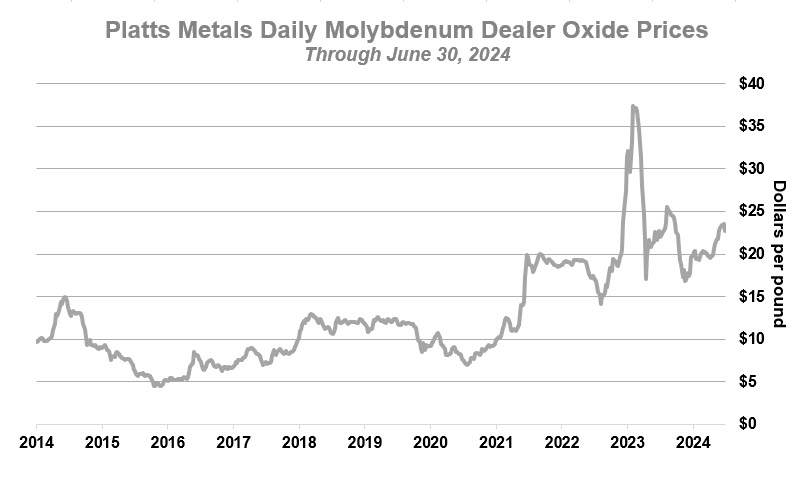
This graph presents the Platts Metals Daily Molybdenum Dealer Oxide weekly average price from January 2014 through June 2024. During second-quarter 2024, the weekly average price of molybdenum ranged from a low of $19.57 per pound to a high of $23.52 per pound, averaged $21.78 per pound and was $22.74 per pound on June 28, 2024. Overall global demand for molybdenum is driven by energy, power generation, aerospace, defense and construction sectors. We believe fundamentals for molybdenum are positive with favorable demand drivers and limited supply. The Platts Metals Daily Molybdenum Dealer Oxide weekly average price was $22.25 per pound on July 26, 2024.
CONSOLIDATED RESULTS
| Three Months Ended June 30, | Six Months Ended June 30, | |||||||||||||||||||||||||
| 2024 | 2023 | 2024 | 2023 | |||||||||||||||||||||||
| SUMMARY FINANCIAL DATA | (in millions, except per share amounts) | |||||||||||||||||||||||||
| Revenuesa,b | $ | 6,624 | $ | 5,737 | $ | 12,945 | $ | 11,126 | ||||||||||||||||||
| Operating incomea,c | $ | 2,049 | $ | 1,410 | $ | 3,683 | $ | 3,011 | ||||||||||||||||||
| Net income attributable to common stockb,c | $ | 616 | d | $ | 343 | e | $ | 1,089 | d | $ | 1,006 | e | ||||||||||||||
| Diluted net income per share of common stock | $ | 0.42 | $ | 0.23 | $ | 0.75 | $ | 0.69 | ||||||||||||||||||
| Diluted weighted-average shares of common stock outstanding | 1,445 | 1,442 | 1,445 | 1,443 | ||||||||||||||||||||||
| Operating cash flowsf | $ | 1,956 | $ | 1,673 | $ | 3,852 | $ | 2,723 | ||||||||||||||||||
| Capital expenditures | $ | 1,116 | $ | 1,163 | $ | 2,370 | $ | 2,284 | ||||||||||||||||||
| At June 30: | ||||||||||||||||||||||||||
| Cash and cash equivalents | $ | 5,273 | $ | 6,683 | $ | 5,273 | $ | 6,683 | ||||||||||||||||||
| Restricted cash and cash equivalents, current | $ | 1,030 | g | $ | 119 | $ | 1,030 | g | $ | 119 | ||||||||||||||||
| Total debt, including current portion | $ | 9,426 | $ | 9,495 | $ | 9,426 | $ | 9,495 | ||||||||||||||||||
a.Refer to Note 8 for a summary of revenues and operating income by operating division.
b.Includes favorable (unfavorable) adjustments to prior period provisionally priced concentrate and cathode copper sales totaling $166 million ($56 million to net income attributable to common stock) in second-quarter 2024, $(118) million ($(45) million to net income attributable to common stock) in second-quarter 2023, $28 million ($9 million to net income attributable
to common stock) for the first six months of 2024 and $182 million ($61 million to net income attributable to common stock) for the first six months of 2023. Refer to Note 5 for further discussion.
c.We defer recognizing profits on intercompany sales until final sales to third parties occur. Changes in these deferrals attributable to variability in intercompany volumes resulted in net additions (reductions) to operating income totaling $137 million ($41 million to net income attributable to common stock) in second-quarter 2024, $(39) million ($(21) million to net income attributable to common stock) in second-quarter 2023, $120 million ($36 million to net income attributable to common stock) for the first six months of 2024 and $72 million ($27 million to net income attributable to common stock) for the first six months of 2023. Refer to “Operations – Smelting and Refining.”
d.Includes net charges totaling $51 million in second-quarter 2024 and $52 million for the first six months of 2024, primarily associated with revisions to environmental obligation estimates and related litigation reserves, and nonrecurring labor-contract charges at Cerro Verde. The first six months of 2024 also include charges associated with assumed oil and gas abandonment obligations resulting from bankruptcies of other companies, offset by international tax credits.
e.Includes net charges totaling $157 million in second-quarter 2023 and $251 million for the first six months of 2023, primarily associated with charges for contested tax rulings issued by the Peruvian Supreme Court, environmental obligations, an accrual for a potential administrative fine in Indonesia, and impairments and contract-cancellation costs.
f.Working capital and other sources (uses) totaled $73 million in second-quarter 2024, $250 million in second-quarter 2023, $(24) million for the first six months of 2024 and $(202) million for the first six months of 2023.
g.Includes $0.9 billion at June 30, 2024, associated with a portion of PT-FI’s export proceeds required to be temporarily deposited in Indonesia banks for 90 days in accordance with a regulation issued by the Indonesia government.
| Three Months Ended June 30, | Six Months Ended June 30, | |||||||||||||||||||||||||
| 2024 | 2023 | 2024 | 2023 | |||||||||||||||||||||||
| SUMMARY OPERATING DATA | ||||||||||||||||||||||||||
| Copper (millions of recoverable pounds) | ||||||||||||||||||||||||||
| Production | 1,037 | 1,067 | 2,122 | 2,032 | ||||||||||||||||||||||
| Sales, excluding purchases | 931 | 1,029 | 2,039 | 1,861 | ||||||||||||||||||||||
| Average realized price per pound | $ | 4.48 | $ | 3.84 | $ | 4.25 | $ | 3.91 | ||||||||||||||||||
| Site production and delivery costs per pounda | $ | 2.56 | $ | 2.39 | $ | 2.43 | $ | 2.47 | ||||||||||||||||||
| Unit net cash costs per pounda | $ | 1.73 | $ | 1.47 | $ | 1.61 | $ | 1.60 | ||||||||||||||||||
| Gold (thousands of recoverable ounces) | ||||||||||||||||||||||||||
| Production | 443 | 483 | 992 | 888 | ||||||||||||||||||||||
| Sales, excluding purchases | 361 | 495 | 929 | 765 | ||||||||||||||||||||||
| Average realized price per ounce | $ | 2,299 | $ | 1,942 | $ | 2,236 | $ | 1,946 | ||||||||||||||||||
| Molybdenum (millions of recoverable pounds) | ||||||||||||||||||||||||||
| Production | 20 | 21 | 38 | 42 | ||||||||||||||||||||||
| Sales, excluding purchases | 21 | 20 | 41 | 39 | ||||||||||||||||||||||
| Average realized price per pound | $ | 21.72 | $ | 24.27 | $ | 21.06 | $ | 27.24 | ||||||||||||||||||
a.Reflects per pound weighted-average production and delivery costs and unit net cash costs (net of by-product credits) for all copper mines, before net noncash and other costs. For reconciliations of per pound unit net cash costs (credits) by operating division to production and delivery costs applicable to sales reported in our consolidated financial statements, refer to “Product Revenues and Production Costs.”
Revenues
Consolidated revenues totaled $6.6 billion in second-quarter 2024, $5.7 billion in second-quarter 2023, $12.9 billion for the first six months of 2024 and $11.1 billion for the first six months of 2023. Revenues from our mining operations and processing facilities primarily include the sale of copper cathode, copper in concentrate, copper rod, gold in concentrate and anode slimes, and molybdenum. Refer to Note 8 for a summary of product revenues.
Following is a summary of changes in our consolidated revenues between periods (in millions):
| Three Months Ended June 30 | Six Months Ended June 30 | |||||||||||||
| Consolidated revenues - 2023 period | $ | 5,737 | $ | 11,126 | ||||||||||
| (Lower) higher sales volumes: | ||||||||||||||
| Copper | (378) | 695 | ||||||||||||
| Gold | (262) | 319 | ||||||||||||
| Molybdenum | 20 | 50 | ||||||||||||
| Higher (lower) average realized prices: | ||||||||||||||
| Copper | 596 | 693 | ||||||||||||
| Gold | 129 | 270 | ||||||||||||
| Molybdenum | (53) | (255) | ||||||||||||
| Adjustments for prior period provisionally priced copper sales | 284 | (154) | ||||||||||||
| Higher Atlantic Copper revenues | 152 | 69 | ||||||||||||
| Higher revenues from purchased copper | 228 | 190 | ||||||||||||
| Lower treatment charges | 52 | 24 | ||||||||||||
| Higher royalties and export duties | (77) | (276) | ||||||||||||
| Other, including intercompany eliminations | 196 | 194 | ||||||||||||
| Consolidated revenues - 2024 period | $ | 6,624 | $ | 12,945 | ||||||||||
Sales Volumes. Consolidated sales volumes for the second quarter and first six months of 2024 were impacted by previously announced shipping delays in Indonesia associated with the timing of renewing PT-FI’s copper concentrate and anode slimes export licenses, which expired on May 31, 2024. On July 2, 2024, PT-FI was granted copper concentrate and anode slimes export licenses, which are valid through December 2024 when the full ramp-up of PT-FI’s new smelter is expected. The increase in consolidated copper and gold sales volumes for the first six months of 2024, compared to the first six months of 2023, primarily reflects higher mining and milling rates and ore grades at PT-FI.
Realized Prices. Our consolidated revenues can vary significantly as a result of fluctuations in the market prices of copper, gold and molybdenum. Average realized prices in second-quarter 2024, compared with second-quarter 2023, were 17% higher for copper, 18% higher for gold and 11% lower for molybdenum. Average realized prices for the first six months of 2024, compared with the first six months of 2023, were 9% higher for copper, 15% higher for gold and 23% lower for molybdenum.
Average realized copper prices include net favorable (unfavorable) adjustments to current period provisionally priced copper sales totaling $15 million in second-quarter 2024, $(52) million in second-quarter 2023, $219 million for the first six months of 2024 and $(121) million for the first six months of 2023. As discussed in Note 5, substantially all of our copper concentrate and some cathode sales contracts provide final copper pricing in a specified future month (generally one to four months from the shipment date). We record revenues and invoice customers at the time of shipment based on then-current LME prices, which results in an embedded derivative on provisionally priced concentrate and cathode sales that is adjusted to fair value through earnings each period, using the period-end forward prices, until final pricing on the date of settlement. To the extent final prices are higher or lower than what was recorded on a provisional basis, an increase or decrease to revenues is recorded each reporting period until the date of final pricing. Accordingly, in times of rising copper prices, our revenues benefit from adjustments to the final pricing of provisionally priced sales pursuant to contracts entered into in prior periods; in times of falling copper prices, the opposite occurs.
Prior Period Provisionally Priced Copper Sales. Net favorable (unfavorable) adjustments to prior periods’ provisionally priced copper sales (i.e., provisionally priced sales at March 31, 2024 and 2023, and December 31, 2023 and 2022) recorded in consolidated revenues totaled $166 million in second-quarter 2024, $(118) million in second-quarter 2023, $28 million for the first six months of 2024 and $182 million for the first six months of 2023. Refer to Notes 5 and 8 for a summary of total adjustments to prior period and current period provisionally priced sales.
At June 30, 2024, we had provisionally priced copper sales totaling 188 million pounds (net of intercompany sales and noncontrolling interests) recorded at an average of $4.33 per pound, subject to final pricing over the next several months. We estimate that each $0.05 change in the price realized from the June 30, 2024, recorded
provisional price would have an approximate $18 million effect on 2024 revenues ($6 million to 2024 net income attributable to common stock). The LME copper price settled at $4.09 per pound on July 31, 2024.
Atlantic Copper Revenues. Atlantic Copper revenues totaled $900 million in second-quarter 2024 and $1.6 billion for the first six months of 2024, compared with $748 million in second-quarter 2023 and $1.5 billion for the first six months of 2023. Higher revenues in the 2024 periods, compared with the 2023 periods, primarily reflect higher copper prices and sales volumes.
Purchased Copper. We purchase copper cathode primarily for processing by our Rod & Refining operations. Higher revenues associated with purchased copper in second-quarter 2024, compared to second-quarter 2023, primarily reflects higher volumes. The volumes of copper purchases vary depending on cathode production from our operations and totaled 64 million pounds in second-quarter 2024, 19 million pounds in second-quarter 2023, 106 million for the first six months of 2024 and 67 million for the first six months of 2023.
Treatment Charges. Revenues from our copper concentrate sales are recorded net of treatment charges (i.e., fees paid to smelters that are generally negotiated annually), which will vary with the sales volumes and the price of copper. The decrease in treatment charges in the 2024 periods, compared to the 2023 periods, primarily reflects lower copper concentrate sales volumes because of previously announced shipping delays in Indonesia associated with the timing of renewing PT-FI’s copper concentrate export license.
Royalties and Export Duties. Royalties and export duties are primarily associated with PT-FI sales. Royalties will vary with the volume of metal sold and the prices of copper and gold. Indonesia export duties of 2.5% were eliminated effective March 29, 2023, upon verification that construction progress of the new smelter exceeded 50%, and were reinstated at a rate of 7.5% in July 2023 under a revised regulation. As discussed in Note 7, PT-FI will continue to pay export duties of 7.5% on copper concentrates during the smelter ramp-up period pursuant to Indonesia regulations. PT-FI incurred export duties totaling $75 million in second-quarter 2024, $231 million for the first six months of 2024 and $18 million for the first six months of 2023.
Production and Delivery Costs
Consolidated production and delivery costs totaled $3.9 billion in second-quarter 2024, $3.5 billion in second-quarter 2023, $7.7 billion for the first six months of 2024 and $6.7 billion for the first six months of 2023. Higher costs in the 2024 periods, compared to the 2023 periods, primarily reflect higher costs of copper purchases at our downstream operations. Additionally, the first six months of 2024 included higher operating rates at PT-FI and charges totaling $98 million associated with assumed oil and gas abandonment obligations resulting from bankruptcies of other companies (refer to Note 7 for further discussion).
Site Production and Delivery Costs Per Pound. Site production and delivery costs for our copper mining operations primarily include labor, energy and other commodity-based inputs, such as sulfuric acid, explosives, steel, reagents, liners and tires. Consolidated site production and delivery costs (before net noncash and other costs) for our copper mines averaged $2.56 per pound of copper in second-quarter 2024, $2.39 per pound of copper in second-quarter 2023, $2.43 per pound of copper for the first six months of 2024 and $2.47 per pound of copper for the first six months of 2023. Refer to “Operations – Unit Net Cash Costs” and “Operations – Unit Net Cash (Credits) Costs” for further discussion of unit net cash costs (credits) associated with our operating divisions and to “Product Revenues and Production Costs” for reconciliations of per pound costs by operating division to production and delivery costs applicable to sales reported in our consolidated financial statements.
Depreciation, Depletion and Amortization
Depreciation will vary under the unit-of-production (UOP) method as a result of changes in sales volumes and the related UOP rates at our mining operations. Consolidated depreciation, depletion and amortization (DD&A) totaled $509 million in second-quarter 2024, $547 million in second-quarter 2023, $1.1 billion for the first six months of 2024 and $0.9 billion for the first six months of 2023.
Environmental Obligations and Shutdown Costs
Environmental obligation costs reflect net revisions to our long-term environmental obligations, which vary from period to period because of changes to environmental laws and regulations, the settlement of environmental matters and/or circumstances affecting our operations that could result in significant changes in our estimates. Shutdown costs include care-and-maintenance costs and any litigation, remediation or related expenditures associated with closed facilities or operations. Net revisions to long-term historical environmental obligations totaled
$23 million in second-quarter 2024, $60 million in second-quarter 2023, $79 million for the first six months of 2024 and $116 million for the first six months of 2023. Refer to Note 7 for further discussion.
Interest Expense, Net
Consolidated interest costs (before capitalization) totaled $181 million in second-quarter 2024 and $356 million for the first six months of 2024, compared to $234 million in second-quarter 2023 and $441 million for the first six months of 2023, which included $50 million in second-quarter 2023 and $74 million for the first six months of 2023 associated with Cerro Verde’s contested tax rulings issued by the Peru Supreme Court.
Capitalized interest varies with the level of qualifying assets associated with our development projects and average interest rates on our borrowings. Capitalized interest totaled $93 million in second-quarter 2024, $62 million in second-quarter 2023, $179 million for the first six months of 2024 and $119 million for the first six months of 2023. The increase in capitalized interest costs in the 2024 periods, compared to the 2023 periods, resulted from increased construction and development projects in process, primarily related to PT-FI’s new downstream processing facilities. Refer to “Capital Resources and Liquidity – Investing Activities” for discussion of capital expenditures associated with our major development projects.
Other Income, Net
Other income, net, totaled $69 million in second-quarter 2024, $24 million in second-quarter 2023, $198 million for the first six months of 2024 and $112 million for the first six months of 2023. The 2023 periods include a $69 million charge associated with Cerro Verde’s contested tax rulings issued by the Peruvian Supreme Court. The first six months of 2024 include a credit of $26 million associated with the reduction in the accrual to indemnify PT Mineral Industri Indonesia (MIND ID) from potential losses arising from historical tax disputes (refer to Note 3).
Income Taxes
Following is a summary of the approximate amounts used in the calculation of our consolidated income tax provision (in millions, except percentages):
| Six Months Ended June 30, | ||||||||||||||||||||||||||||||||||||||
| 2024 | 2023 | |||||||||||||||||||||||||||||||||||||
| Income (Loss)a | Effective Tax Rate | Income Tax (Provision) Benefit | Income (Loss)a | Effective Tax Rate | Income Tax (Provision) Benefit | |||||||||||||||||||||||||||||||||
| U.S.b | $ | (271) | —% | c | $ | (4) | $ | 250 | —% | c | $ | 3 | ||||||||||||||||||||||||||
| South America | 800 | 40% | (317) | 784 | 39% | (310) | ||||||||||||||||||||||||||||||||
| Indonesia | 2,977 | 36% | (1,081) | 1,986 | 37% | (737) | ||||||||||||||||||||||||||||||||
| Cerro Verde historical tax matters | — | N/A | — | (142) | d | N/A | 3 | |||||||||||||||||||||||||||||||
| PT-FI historical tax matters | 16 | e | N/A | 182 | e | (5) | N/A | (3) | ||||||||||||||||||||||||||||||
| Eliminations and other | 182 | N/A | (49) | f | (67) | N/A | 21 | |||||||||||||||||||||||||||||||
| Rate adjustmentg | — | N/A | 3 | — | N/A | (15) | ||||||||||||||||||||||||||||||||
| Consolidated FCX | $ | 3,704 | 34% | $ | (1,266) | $ | 2,806 | 37% | $ | (1,038) | ||||||||||||||||||||||||||||
a.Represents income (loss) before income taxes, equity in affiliated companies' net earnings, and noncontrolling interests.
b.In addition to our North America Copper Mines, which had operating income of $417 million for the first six months of 2024 and $668 million for the first six months of 2023 (refer to Note 8), the U.S. jurisdiction reflects non-operating sites and corporate-level expenses, which include interest expense associated with FCX’s senior notes and general and administrative expenses. The U.S. jurisdiction also includes net charges associated with oil and gas abandonment obligations and revisions to environmental obligation estimates.
c.Includes a valuation allowance release on prior year unbenefited net operating losses.
d.Reflects net charges associated with contested tax rulings issued by the Peruvian Supreme Court.
e.Refer to Note 3 for further discussion of net credits associated with closure of PT-FI’s 2021 corporate income tax audit and resolution of a framework for disputed tax matters.
f.Includes a tax benefit of $13 million associated with a favorable Supreme Court ruling in Spain, which reversed a 2016 tax law limiting Atlantic Copper’s use of net operating losses.
g.In accordance with applicable accounting rules, we adjust our interim provision for income taxes equal to our consolidated tax rate.
Assuming achievement of current sales volume and cost estimates and average prices of $4.25 per pound of copper, $2,300 per ounce of gold and $20.00 per pound of molybdenum for the second half of 2024, we estimate our consolidated effective tax rate for the year 2024 would approximate 36% (which reflects an estimated effective
tax rate of 38% for the second half of 2024). Changes in projected sales volumes and average prices during 2024 would incur tax impacts at estimated effective rates of 39% for Peru, 36% for Indonesia and 0% for the U.S., which excludes any impact from the U.S. Inflation Reduction Act of 2022. Our projected estimated effective tax rate of 0% for the U.S. for the year 2024 may be adjusted as regulations and additional guidance are released by the Internal Revenue Service and U.S. Department of the Treasury on key provisions of the Act (refer to Note 3).
Noncontrolling Interests
Net income attributable to noncontrolling interests, which is primarily associated with our noncontrolling shareholders at PT-FI, Cerro Verde and El Abra, totaled $0.7 billion in second-quarter 2024, $0.4 billion in second-quarter 2023, $1.4 billion for the first six months of 2024 and $0.8 billion for the first six months of 2023 (refer to Note 8 for net income attributable to noncontrolling interests for each of our business segments).
Beginning January 1, 2023, our economic and ownership interest in PT-FI is 48.76%, except for net income associated with the settlement of historical tax matters in first-quarter 2024 and approximately 190 thousand ounces of gold sales in first-quarter 2023, which were attributed based on the economics prior to January 1, 2023 (i.e., approximately 81% to FCX and 19% to MIND ID). Refer to Note 1 for further discussion.
Based on achievement of current sales volume and cost estimates, and assuming average prices of $4.25 per pound of copper, $2,300 per ounce of gold and $20.00 per pound of molybdenum for the second half of 2024, we estimate that net income attributable to noncontrolling interests will approximate $2.6 billion for the year 2024. The impact of price changes on net income attributable to noncontrolling interests for the year 2024 would approximate $0.1 billion for each $0.25 per pound change in the average price of copper for the second half of 2024. The actual amount will depend on many factors, including relative performance of each business segment, commodity prices, costs and other factors.
OPERATIONS
Responsible Production
The Copper Mark. We demonstrate our responsible production performance through the Copper Mark, a comprehensive assurance framework developed specifically for the copper industry, and recently extended to other metals including molybdenum. To achieve the Copper Mark, each site is required to complete an independent external assurance process to assess conformance with various environmental, social and governance criteria. Awarded sites must be revalidated every three years. We have achieved, and are committed to maintaining, the Copper Mark and/or Molybdenum Mark, as applicable, at all of our sites globally.
Leaching Innovation Initiatives
We are continuing to advance a series of initiatives across our North America and South America operations to incorporate new applications, technologies and data analytics to our leaching processes. In late 2023, we achieved our initial annual run rate target of approximately 200 million pounds of copper. Incremental copper production from these initiatives totaled 55 million pounds in second-quarter 2024 (compared with 29 million pounds in second-quarter 2023) and 106 million pounds for the first six months of 2024 (compared with 51 million pounds for the first six months of 2023). We are pursuing opportunities to apply recent operational enhancements on a larger scale and we are testing new innovative technology applications that we believe have the potential for significant increases in recoverable metal beyond the current run rate.
Feasibility and Optimization Studies
We are engaged in various studies associated with potential future expansion projects primarily at our mining operations. The costs for these studies are charged to production and delivery costs as incurred and totaled $38 million in second-quarter 2024, $51 million in second-quarter 2023, $72 million for the first six months of 2024 and $101 million for the first six months of 2023. We estimate the costs of these studies will approximate $200 million for the year 2024, subject to market conditions and other factors.
North America
We manage seven copper operations in North America – Morenci, Bagdad, Safford (including Lone Star), Sierrita and Miami in Arizona, and Chino and Tyrone in New Mexico. We also operate a copper smelter in Miami, Arizona. In addition to copper, certain of these operations produce molybdenum concentrate, gold and silver. All of the North America operations are wholly owned, except for Morenci. We record our 72% undivided joint venture interest in Morenci using the proportionate consolidation method.
The North America copper operations include open-pit mining, sulfide-ore concentrating, leaching and solution extraction/electrowinning (SX/EW) facilities. A majority of the copper produced at our North America copper operations is cast into copper rod by our Rod & Refining segment. The remainder of our North America copper production is sold as copper cathode or copper concentrate, a portion of which is shipped to Atlantic Copper (our wholly owned smelter). Molybdenum concentrate, gold and silver are also produced by certain of our North America copper operations*.*
Development Activities. We have substantial reserves and future opportunities in the U.S., primarily associated with existing operations.
We have a potential expansion project to more than double the concentrator capacity of the Bagdad operation in northwest Arizona. Bagdad’s reserve life currently exceeds 80 years and supports an expanded operation. In late 2023, we completed technical and economic studies, which indicated the opportunity to construct new concentrating facilities to increase copper production by 200 to 250 million pounds per year, which is more than double Bagdad’s current annual production rate. Estimated incremental project capital costs approximate $3.5 billion. Expanded operations would provide improved efficiency and reduce unit net cash costs through economies of scale. Project economics indicate that the expansion would require an incentive copper price in the range of $3.50 to $4.00 per pound and approximately three to four years to complete. The decision of whether to proceed and timing of the potential expansion will take into account overall copper market conditions, availability of labor and other factors, including progress on conversion of the existing haul truck fleet to autonomous and expanding housing alternatives to support long-range plans. In parallel, we are advancing activities for expanded tailings infrastructure projects required under long-range plans in order to advance the potential construction timeline.
We are completing projects at our Safford/Lone Star operation to increase volumes to achieve 300 million pounds of copper per year from oxide ores, which reflects expansion of the initial design capacity of 200 million pounds of copper per year. Additionally, positive drilling conducted in recent years indicates a large, mineralized district with opportunities to pursue a major expansion project. We have commenced pre-feasibility studies for a potential significant expansion and expect to complete these studies in late 2025. The decision of whether to proceed and timing of the potential expansion will take into account results of technical and economic studies, overall copper market conditions and other factors.
Operating Data. Following is summary consolidated operating data for the North America copper mines:
| Three Months Ended June 30, | Six Months Ended June 30, | |||||||||||||||||||||||||||||||
| 2024 | 2023 | 2024 | 2023 | |||||||||||||||||||||||||||||
| Operating Data, Net of Joint Venture Interests | ||||||||||||||||||||||||||||||||
| Copper (millions of recoverable pounds) | ||||||||||||||||||||||||||||||||
| Production | 298 | 354 | 612 | 686 | ||||||||||||||||||||||||||||
| Sales, excluding purchases | 292 | 339 | 623 | 671 | ||||||||||||||||||||||||||||
| Average realized price per pound | $ | 4.63 | $ | 3.92 | $ | 4.28 | $ | 4.03 | ||||||||||||||||||||||||
| Molybdenum (millions of recoverable pounds) | ||||||||||||||||||||||||||||||||
| Productiona | 7 | 9 | 14 | 16 | ||||||||||||||||||||||||||||
| 100% Operating Data | ||||||||||||||||||||||||||||||||
| Leach operations | ||||||||||||||||||||||||||||||||
| Leach ore placed in stockpiles (metric tons per day) | 650,300 | 724,100 | 633,800 | 668,900 | ||||||||||||||||||||||||||||
| Average copper ore grade (%) | 0.20 | 0.24 | 0.20 | 0.25 | ||||||||||||||||||||||||||||
| Copper production (millions of recoverable pounds) | 209 | 239 | 420 | 473 | ||||||||||||||||||||||||||||
| Mill operations | ||||||||||||||||||||||||||||||||
| Ore milled (metric tons per day) | 290,200 | 315,500 | 298,900 | 306,500 | ||||||||||||||||||||||||||||
| Average ore grade (%): | ||||||||||||||||||||||||||||||||
| Copper | 0.29 | 0.33 | 0.30 | 0.34 | ||||||||||||||||||||||||||||
| Molybdenum | 0.02 | 0.02 | 0.02 | 0.02 | ||||||||||||||||||||||||||||
| Copper recovery rate (%) | 84.1 | 83.8 | 82.4 | 82.2 | ||||||||||||||||||||||||||||
| Copper production (millions of recoverable pounds) | 138 | 172 | 291 | 326 | ||||||||||||||||||||||||||||
a.Refer to “Consolidated Results” for our consolidated molybdenum sales, which include sales of molybdenum produced at the North America copper mines.
Our consolidated copper sales volumes from North America totaled 292 million pounds in second-quarter 2024, 339 million pounds in second-quarter 2023, 623 million pounds for the first six months of 2024 and 671 million pounds for the first six months of 2023. Lower copper sales in the 2024 periods, compared with the 2023 periods, primarily reflect lower ore grades and planned mill maintenance, partly offset by improved leach recovery performance.
We continue to advance initiatives to enhance productivity and improve equipment reliability to offset declines in ore grades. North America copper sales are estimated to approximate 1.3 billion pounds for the year 2024. Refer to “Outlook” for projected molybdenum sales volumes.
Unit Net Cash Costs. We believe unit net cash costs per pound of copper is a measure that provides investors with information about the cash-generating capacity of our mining operations expressed on a basis relating to the primary metal product for our respective operations. We use this measure for the same purpose and for monitoring operating performance by our mining operations. This information differs from measures of performance determined in accordance with U.S. generally accepted accounting principles (GAAP) and should not be considered in isolation or as a substitute for measures of performance determined in accordance with U.S. GAAP. This measure is presented by other metals mining companies, although our measure may not be comparable to similarly titled measures reported by other companies.
Gross Profit per Pound of Copper and Molybdenum
The following table summarizes unit net cash costs and gross profit per pound at our North America copper mines. Refer to “Product Revenues and Production Costs” for an explanation of the “by-product” and “co-product” methods and a reconciliation of unit net cash costs per pound to production and delivery costs applicable to sales reported in our consolidated financial statements.
| Three Months Ended June 30, | ||||||||||||||||||||||||||||||||||||||
| 2024 | 2023 | |||||||||||||||||||||||||||||||||||||
| By- Product Method | Co-Product Method | By- Product Method | Co-Product Method | |||||||||||||||||||||||||||||||||||
| Copper | Molyb- denuma | Copper | Molyb- denuma | |||||||||||||||||||||||||||||||||||
| Revenues, excluding adjustments | $ | 4.63 | $ | 4.63 | $ | 19.97 | $ | 3.92 | $ | 3.92 | $ | 23.08 | ||||||||||||||||||||||||||
| Site production and delivery, before net noncash and other costs shown below | 3.48 | 3.15 | 16.87 | 2.93 | 2.55 | 16.04 | ||||||||||||||||||||||||||||||||
| By-product credits | (0.43) | — | — | (0.55) | — | — | ||||||||||||||||||||||||||||||||
| Treatment charges | 0.14 | 0.13 | — | 0.13 | 0.13 | — | ||||||||||||||||||||||||||||||||
| Unit net cash costs | 3.19 | 3.28 | 16.87 | 2.51 | 2.68 | 16.04 | ||||||||||||||||||||||||||||||||
| DD&A | 0.36 | 0.33 | 1.21 | 0.29 | 0.26 | 1.15 | ||||||||||||||||||||||||||||||||
| Noncash and other costs, net | 0.13 | b | 0.12 | 0.33 | 0.15 | b | 0.13 | 0.60 | ||||||||||||||||||||||||||||||
| Total unit costs | 3.68 | 3.73 | 18.41 | 2.95 | 3.07 | 17.79 | ||||||||||||||||||||||||||||||||
| Revenue adjustments, primarily for pricing on prior period open sales | 0.01 | 0.01 | — | (0.03) | (0.03) | — | ||||||||||||||||||||||||||||||||
| Gross profit per pound | $ | 0.96 | $ | 0.91 | $ | 1.56 | $ | 0.94 | $ | 0.82 | $ | 5.29 | ||||||||||||||||||||||||||
| Copper sales (millions of recoverable pounds) | 293 | 293 | 341 | 341 | ||||||||||||||||||||||||||||||||||
| Molybdenum sales (millions of recoverable pounds)a | 7 | 9 |
| Six Months Ended June 30, | ||||||||||||||||||||||||||||||||||||||
| 2024 | 2023 | |||||||||||||||||||||||||||||||||||||
| By- Product Method | Co-Product Method | By- Product Method | Co-Product Method | |||||||||||||||||||||||||||||||||||
| Copper | Molyb- denuma | Copper | Molyb- denuma | |||||||||||||||||||||||||||||||||||
| Revenues, excluding adjustments | $ | 4.28 | $ | 4.28 | $ | 19.18 | $ | 4.03 | $ | 4.03 | $ | 25.52 | ||||||||||||||||||||||||||
| Site production and delivery, before net noncash and other costs shown below | 3.35 | 3.03 | 16.35 | 2.92 | 2.55 | 17.81 | ||||||||||||||||||||||||||||||||
| By-product credits | (0.40) | — | — | (0.57) | — | — | ||||||||||||||||||||||||||||||||
| Treatment charges | 0.13 | 0.13 | — | 0.13 | 0.12 | — | ||||||||||||||||||||||||||||||||
| Unit net cash costs | 3.08 | 3.16 | 16.35 | 2.48 | 2.67 | 17.81 | ||||||||||||||||||||||||||||||||
| DD&A | 0.35 | 0.32 | 1.22 | 0.30 | 0.26 | 1.24 | ||||||||||||||||||||||||||||||||
| Noncash and other costs, net | 0.13 | b | 0.12 | 0.39 | 0.19 | b | 0.16 | 1.06 | ||||||||||||||||||||||||||||||
| Total unit costs | 3.56 | 3.60 | 17.96 | 2.97 | 3.09 | 20.11 | ||||||||||||||||||||||||||||||||
| Revenue adjustments, primarily for pricing on prior period open sales | — | — | — | 0.02 | 0.02 | — | ||||||||||||||||||||||||||||||||
| Gross profit per pound | $ | 0.72 | $ | 0.68 | $ | 1.22 | $ | 1.08 | $ | 0.96 | $ | 5.41 | ||||||||||||||||||||||||||
| Copper sales (millions of recoverable pounds) | 626 | 626 | 676 | 676 | ||||||||||||||||||||||||||||||||||
| Molybdenum sales (millions of recoverable pounds)a | 14 | 16 | ||||||||||||||||||||||||||||||||||||
a.Reflects sales of molybdenum produced by certain of the North America copper mines to our molybdenum sales company at market-based pricing.
b.Includes charges totaling $0.05 per pound of copper in second-quarter 2024 and for the first six months of 2024, and $0.08 per pound of copper in second-quarter 2023 and for the first six months of 2023 for feasibility and optimization studies.
Our North America copper mines have varying cost structures because of differences in ore grades and characteristics, processing costs, by-product credits and other factors. Average unit net cash costs (net of by-product credits) for the North America copper mines of $3.19 per pound of copper in second-quarter 2024 and $3.08 per pound for the first six months of 2024 were higher than second-quarter 2023 unit net cash costs of $2.51 per pound and $2.48 per pound for the first six months of 2023, primarily reflecting the impact of lower copper production volumes, higher mining costs and lower molybdenum by-product credits.
Because certain assets are depreciated on a straight-line basis, North America’s average unit depreciation rate may vary with asset additions and the level of copper production and sales.
Revenue adjustments primarily result from changes in prices on provisionally priced copper sales recognized in prior periods. Refer to “Consolidated Results – Revenues” for further discussion of adjustments to prior period provisionally priced copper sales.
Average unit net cash costs (net of by-product credits) for our North America copper mines are expected to approximate $3.10 per pound of copper for the year 2024, based on achievement of current sales volume and cost estimates, and assuming an average price of $20.00 per pound of molybdenum for the second half of 2024. North America’s average unit net cash costs for the year 2024 would change by approximately $0.02 per pound for each $2 per pound change in the average price of molybdenum for the second half of 2024.
South America
We manage two copper operations in South America – Cerro Verde in Peru (in which we own a 53.56% interest) and El Abra in Chile (in which we own a 51% interest), which are consolidated in our financial statements.
South America operations includes open-pit mining, sulfide-ore concentrating, leaching and SX/EW facilities. Production from our South America operations is sold as copper concentrate or cathode under long-term contracts. Our South America operations also sell a portion of their copper concentrate production to Atlantic Copper. In addition to copper, the Cerro Verde mine produces molybdenum concentrate and silver.
Labor Matters. In April 2024, Cerro Verde reached a new four-year collective labor agreement (CLA) with one of its two unions and incurred nonrecurring charges of $65 million in second-quarter 2024 associated with the new CLA. Cerro Verde expects to begin negotiations with a second union group prior to the expiration of its CLA on August 31, 2024, and may incur additional charges in connection with these negotiations.
Development Activities. At the El Abra operations in Chile, we have completed substantial drilling and evaluations to model a large sulfide resource that would support a potential major mill project similar to the large-scale concentrator at Cerro Verde. We are engaged in planning for a potential submission of an environmental impact statement by year-end 2025, subject to ongoing stakeholder engagement and economic evaluations. In parallel, we are updating our technical studies and economic models to incorporate recent capital costs. Preliminary estimates, which remain under review, indicate that the project economics would be supported using an incentive copper price of less than $4.00 per pound. The decision of whether to proceed and timing of the potential project will take into account overall copper market conditions, required permitting and other factors.
Operating Data. Following is summary consolidated operating data for South America operations:
| Three Months Ended June 30, | Six Months Ended June 30, | |||||||||||||||||||||||||
| 2024 | 2023 | 2024 | 2023 | |||||||||||||||||||||||
| Copper (millions of recoverable pounds) | ||||||||||||||||||||||||||
| Production | 298 | 307 | 578 | 611 | ||||||||||||||||||||||
| Sales | 302 | 304 | 586 | 606 | ||||||||||||||||||||||
| Average realized price per pound | $ | 4.39 | $ | 3.78 | $ | 4.27 | $ | 3.85 | ||||||||||||||||||
| Molybdenum (millions of recoverable pounds) | ||||||||||||||||||||||||||
| Productiona | 6 | 5 | 9 | 11 | ||||||||||||||||||||||
| Leach operations | ||||||||||||||||||||||||||
| Leach ore placed in stockpiles (metric tons per day) | 176,100 | 203,600 | 173,300 | 203,800 | ||||||||||||||||||||||
| Average copper ore grade (%) | 0.39 | 0.33 | 0.40 | 0.33 | ||||||||||||||||||||||
| Copper production (millions of recoverable pounds) | 75 | 74 | 146 | 160 | ||||||||||||||||||||||
| Mill operations | ||||||||||||||||||||||||||
| Ore milled (metric tons per day) | 426,100 | 425,500 | 411,700 | 415,300 | ||||||||||||||||||||||
| Average ore grade (%): | ||||||||||||||||||||||||||
| Copper | 0.33 | 0.35 | 0.33 | 0.34 | ||||||||||||||||||||||
| Molybdenum | 0.01 | 0.01 | 0.01 | 0.01 | ||||||||||||||||||||||
| Copper recovery rate (%) | 83.8 | 82.6 | 83.6 | 83.2 | ||||||||||||||||||||||
| Copper production (millions of recoverable pounds) | 223 | 233 | 432 | 451 |
a.Refer to “Consolidated Results” for our consolidated molybdenum sales volumes, which include sales of molybdenum produced at Cerro Verde.
Our consolidated copper sales from South America operations totaled 302 million pounds in second-quarter 2024, 304 million pounds in second-quarter 2023, 586 million pounds for the first six months of 2024 and 606 million pounds for the first six months of 2023. The 2024 periods, compared to the 2023 periods reflect lower volumes of leach ore placed in stockpiles, partly offset by higher leach ore grades. The first six months of 2024, compared to the first six months of 2023, also reflect lower milling rates associated with mill maintenance.
Copper sales from South America operations are expected to approximate 1.2 billion pounds for the year 2024. Refer to “Outlook” for projected molybdenum sales volumes.
Unit Net Cash Costs. We believe unit net cash costs per pound of copper is a measure that provides investors with information about the cash-generating capacity of our mining operations expressed on a basis relating to the primary metal product for our respective operations. We use this measure for the same purpose and for monitoring operating performance by our mining operations. This information differs from measures of performance determined in accordance with U.S. GAAP and should not be considered in isolation or as a substitute for measures of performance determined in accordance with U.S. GAAP. This measure is presented by other metals mining companies, although our measure may not be comparable to similarly titled measures reported by other companies.
Gross Profit per Pound of Copper
The following table summarizes unit net cash costs and gross profit per pound of copper at our South America operations. Refer to “Product Revenues and Production Costs” for an explanation of the “by-product” and “co-product” methods and a reconciliation of unit net cash costs per pound to production and delivery costs applicable to sales reported in our consolidated financial statements.
| Three Months Ended June 30, | ||||||||||||||||||||||||||
| 2024 | 2023 | |||||||||||||||||||||||||
| By-Product Method | Co-Product Method | By-Product Method | Co-Product Method | |||||||||||||||||||||||
| Revenues, excluding adjustments | $ | 4.39 | $ | 4.39 | $ | 3.78 | $ | 3.78 | ||||||||||||||||||
| Site production and delivery, before net noncash and other costs shown below | 2.74 | a | 2.49 | 2.43 | 2.22 | |||||||||||||||||||||
| By-product credits | (0.45) | — | (0.37) | — | ||||||||||||||||||||||
| Treatment charges | 0.16 | 0.16 | 0.21 | 0.21 | ||||||||||||||||||||||
| Royalty on metals | 0.01 | 0.01 | 0.01 | 0.01 | ||||||||||||||||||||||
| Unit net cash costs | 2.46 | 2.66 | 2.28 | 2.44 | ||||||||||||||||||||||
| DD&A | 0.38 | 0.34 | 0.44 | 0.39 | ||||||||||||||||||||||
| Noncash and other costs, net | 0.06 | b | 0.06 | 0.08 | b | 0.07 | ||||||||||||||||||||
| Total unit costs | 2.90 | 3.06 | 2.80 | 2.90 | ||||||||||||||||||||||
| Revenue adjustments, primarily for pricing on prior period open sales | 0.29 | 0.29 | (0.22) | (0.22) | ||||||||||||||||||||||
| Gross profit per pound | $ | 1.78 | $ | 1.62 | $ | 0.76 | $ | 0.66 | ||||||||||||||||||
| Copper sales (millions of recoverable pounds) | 302 | 302 | 304 | 304 |
| Six Months Ended June 30, | ||||||||||||||||||||||||||
| 2024 | 2023 | |||||||||||||||||||||||||
| By-Product Method | Co-Product Method | By-Product Method | Co-Product Method | |||||||||||||||||||||||
| Revenues, excluding adjustments | $ | 4.27 | $ | 4.27 | $ | 3.85 | $ | 3.85 | ||||||||||||||||||
| Site production and delivery, before net noncash and other costs shown below | 2.68 | a | 2.48 | 2.49 | 2.25 | |||||||||||||||||||||
| By-product credits | (0.33) | — | (0.45) | — | ||||||||||||||||||||||
| Treatment charges | 0.17 | 0.17 | 0.19 | 0.19 | ||||||||||||||||||||||
| Royalty on metals | 0.01 | 0.01 | 0.01 | 0.01 | ||||||||||||||||||||||
| Unit net cash costs | 2.53 | 2.66 | 2.24 | 2.45 | ||||||||||||||||||||||
| DD&A | 0.38 | 0.35 | 0.40 | 0.35 | ||||||||||||||||||||||
| Noncash and other costs, net | 0.06 | b | 0.06 | 0.08 | b | 0.07 | ||||||||||||||||||||
| Total unit costs | 2.97 | 3.07 | 2.72 | 2.87 | ||||||||||||||||||||||
| Revenue adjustments, primarily for pricing on prior period open sales | 0.05 | 0.05 | 0.11 | 0.11 | ||||||||||||||||||||||
| Gross profit per pound | $ | 1.35 | $ | 1.25 | $ | 1.24 | $ | 1.09 | ||||||||||||||||||
| Copper sales (millions of recoverable pounds) | 586 | 586 | 606 | 606 | ||||||||||||||||||||||
a.Includes $0.22 per pound of copper in second-quarter 2024 and $0.11 per pound of copper for the first six months of 2024 associated with nonrecurring labor-related charges at Cerro Verde associated with a new CLA.
b.Includes charges totaling $0.04 per pound of copper in second-quarter 2024, second-quarter 2023, and for the first six months of 2024, and $0.03 per pound of copper for the first six months of 2023, each for feasibility and optimization studies.
Our South America operations have varying cost structures because of differences in ore grades and characteristics, processing costs, by-product credits and other factors. Average unit net cash costs (net of by-product credits) for South America operations of $2.46 per pound of copper in second-quarter 2024 and $2.53 per pound for the first six months of 2024 were higher than second-quarter 2023 unit net cash costs of $2.28 per pound and $2.24 per pound for the first six months of 2023, primarily reflecting nonrecurring labor-contract charges at Cerro Verde associated with a new CLA and higher mining costs. Second-quarter 2024 unit net cash costs benefited from the impact of higher molybdenum by-product credits, while the first six months of 2024 had lower molybdenum by-product credits and copper volumes.
Revenues from Cerro Verde’s copper concentrate sales are recorded net of treatment charges, which will vary with Cerro Verde’s sales volumes and the price of copper.
Because certain assets are depreciated on a straight-line basis, South America’s unit depreciation rate may vary with asset additions and the level of copper production and sales. Higher DD&A rates per pound of copper in the 2023 periods primarily reflect a correction in the useful lives of certain fixed assets at Cerro Verde, which resulted in additional depreciation being recognized in second-quarter 2023.
Revenue adjustments primarily result from changes in prices on provisionally priced copper sales recognized in prior periods. Refer to “Consolidated Results – Revenues” for further discussion of adjustments to prior period provisionally priced copper sales.
Average unit net cash costs (net of by-product credits) for South America operations are expected to approximate $2.47 per pound of copper for the year 2024, based on achievement of current sales volume and cost estimates, and assuming an average price of $20.00 per pound of molybdenum for the second half of 2024.
Indonesia
PT-FI operates one of the world’s largest copper and gold mines at the Grasberg minerals district in Central Papua, Indonesia. PT-FI produces copper concentrate that contains significant quantities of gold and silver. We have a 48.76% ownership interest in PT-FI and manage its operations. PT-FI's results are consolidated in our financial statements. Upon completion and full ramp-up of PT-FI’s new downstream processing facilities, PT-FI will be a fully integrated producer of refined copper and gold. Other than copper concentrate delivered to PT Smelting and PT-FI’s new smelter for further processing into refined products, most of PT-FI’s copper concentrate is sold under long-term contracts.
Labor Matters. In April 2024, PT-FI reached a new two-year CLA with its three employee unions at its Grasberg minerals district operations. PT-FI did not recognize any significant nonrecurring costs associated with the new CLA.
Regulatory Matters and Mining Rights. On May 31, 2024, export licenses expired for several exporters, including PT-FI. In second-quarter 2024, the Indonesia government issued various regulations to allow, under certain conditions, continued exports of copper concentrates and anode slimes through December 2024.
On July 2, 2024, PT-FI was granted copper concentrate and anode slimes export licenses, which are valid through December 2024 when the full ramp-up of PT-FI’s new smelter is expected. PT-FI will continue to pay a 7.5% export duty on copper concentrates during the smelter ramp-up period pursuant to Indonesia regulations.
As further discussed in FCX’s 2023 Form 10-K, PT-FI’s current special mining license (IUPK) enables it to conduct operations in the Grasberg minerals district through 2041. On May 30, 2024, the Indonesia government issued a regulation applicable to the country’s mineral and coal industries which outlines requirements for the granting of IUPK extensions. The regulation provides that IUPK holders may be granted a life-of-mine extension provided certain conditions are met, including ownership of integrated downstream processing facilities that have entered the operational stage; domestic ownership of at least 51% and agreement with a state-owned enterprise for an additional 10% ownership; and commitments for additional exploration and increases in refining capacity, each as approved by the Ministry of Energy and Minerals. Application for extension may be submitted at any time up to one year prior to the current IUPK expiration. PT-FI expects to apply for an extension under this new regulation during 2024. An extension would enable continuity of large-scale operations for the benefit of all stakeholders and provide growth options through additional resource development opportunities in the highly attractive Grasberg minerals district.
Operating and Development Activities. Over a multi-year investment period, PT-FI has successfully commissioned three large-scale underground mines in the Grasberg minerals district (Grasberg Block Cave, Deep Mill Level Zone and Big Gossan). Milling rates averaged 196,900 metric tons of ore per day during second-quarter 2024, which reflected reduced rates in June 2024 because of the delay in obtaining PT-FI’s export licenses, and 208,200 metric tons of ore per day for the first six months of 2024, a 12% increase from 186,100 metric tons of ore per day for the first six months of 2023. PT-FI is completing a mill recovery project with the installation of a new copper cleaner circuit, which is expected to begin commissioning in the second half of 2024.
Natural Gas Facilities. PT-FI plans to transition its existing energy source from coal to liquefied natural gas, which would meaningfully reduce PT-FI’s Scope 1 greenhouse gas emissions at the Grasberg minerals district. PT-FI’s planned investments in a new gas-fired combined cycle facility is expected to be incurred over the next four years, at a cost of approximately $1 billion, which represents an incremental cost of $0.4 billion compared to previously planned investments to refurbish the existing coal units.
Kucing Liar. Long-term mine development activities are ongoing for PT-FI’s Kucing Liar deposit in the Grasberg minerals district, which is expected to produce over 7 billion pounds of copper and 6 million ounces of gold between 2029 and the end of 2041. An extension of PT-FI’s operating rights beyond 2041 would extend the life of the project. Pre-production development activities commenced in 2022 and are expected to continue over an approximate 10-year timeframe. Capital investments are estimated to average approximately $400 million per year over this period. At full operating rates of approximately 90,000 metric tons of ore per day, annual production from Kucing Liar is expected to approximate 560 million pounds of copper and 520 thousand ounces of gold, providing PT-FI with sustained long-term, large-scale and low-cost production. Kucing Liar will benefit from substantial shared infrastructure and PT-FI’s experience and long-term success in block-cave mining.
Downstream Processing Facilities. PT-FI substantially completed construction of its new smelter in June 2024 and commenced commissioning operations. The new smelter has a capacity to process approximately 1.7 million metric tons of copper concentrate per year and is expected to begin producing copper cathodes in the coming months with ramp-up to full production targeted by year-end 2024 in line with previous expectations.
The PMR is being constructed to process gold and silver from the new smelter and PT Smelting. Construction is in progress with full production expected by year-end 2024.
During the first six months of 2024, capital expenditures for the new downstream processing facilities totaled $0.7 billion and are expected to approximate $1.0 billion for the year 2024, excluding capitalized interest and $0.3 billion
of estimated commissioning and owner’s costs. As of June 30, 2024, $3.8 billion has been incurred to date for the projects.
In December 2023, PT Smelting completed an expansion of its capacity by 30% to 1.3 million metric tons of copper concentrate per year. The project was funded by PT-FI with borrowings totaling $254 million that converted to equity effective June 30, 2024, increasing PT-FI’s ownership in PT Smelting to 66% from 39.5%. As discussed in Note 1, PT-FI continues to account for its investment in PT Smelting under the equity method.
Operating Data. Following is summary consolidated operating data for Indonesia operations:
| Three Months Ended June 30, | Six Months Ended June 30, | |||||||||||||||||||||||||
| 2024 | 2023 | 2024 | 2023 | |||||||||||||||||||||||
| Copper (millions of recoverable pounds) | ||||||||||||||||||||||||||
| Production | 441 | 406 | 932 | 735 | ||||||||||||||||||||||
| Sales | 337 | 386 | 830 | 584 | ||||||||||||||||||||||
| Average realized price per pound | $ | 4.44 | $ | 3.82 | $ | 4.23 | $ | 3.83 | ||||||||||||||||||
| Gold (thousands of recoverable ounces) | ||||||||||||||||||||||||||
| Production | 437 | 479 | 982 | 881 | ||||||||||||||||||||||
| Sales | 356 | 492 | 920 | 758 | ||||||||||||||||||||||
| Average realized price per ounce | $ | 2,299 | $ | 1,942 | $ | 2,236 | $ | 1,946 | ||||||||||||||||||
| Ore extracted and milled (metric tons per day): | ||||||||||||||||||||||||||
| Grasberg Block Cave underground mine | 123,500 | 114,800 | 131,400 | 102,300 | ||||||||||||||||||||||
| Deep Mill Level Zone underground mine | 64,400 | 80,200 | 65,900 | 75,100 | ||||||||||||||||||||||
| Big Gossan underground mine | 7,500 | 8,200 | 8,300 | 7,600 | ||||||||||||||||||||||
| Other adjustments | 1,500 | 3,900 | 2,600 | 1,100 | ||||||||||||||||||||||
| Total | 196,900 | 207,100 | 208,200 | 186,100 | ||||||||||||||||||||||
| Average ore grades: | ||||||||||||||||||||||||||
| Copper (%) | 1.30 | 1.15 | 1.31 | 1.16 | ||||||||||||||||||||||
| Gold (grams per metric ton) | 0.99 | 1.05 | 1.06 | 1.06 | ||||||||||||||||||||||
| Recovery rates (%): | ||||||||||||||||||||||||||
| Copper | 88.8 | 88.9 | 89.1 | 89.5 | ||||||||||||||||||||||
| Gold | 77.0 | 76.7 | 77.3 | 77.4 |
PT-FI’s consolidated copper and gold sales volumes for the second quarter and first six months of 2024 were impacted by previously announced shipping delays in Indonesia associated with the timing of renewing PT-FI’s copper concentrate and anode slimes export licenses, which expired on May 31, 2024. On July 2, 2024, PT-FI was granted copper concentrate and anode slimes export licenses, which are valid through December 2024 when the full ramp-up of PT-FI’s new smelter is expected.
PT-FI’s consolidated copper sales volumes totaled 337 million pounds in second-quarter 2024, 386 million pounds in second-quarter 2023, 830 million pounds for the first six months of 2024 and 584 million pounds for the first six months of 2023. PT-FI’s consolidated copper sales volumes for the 2024 periods benefited from higher ore grades and higher consolidated copper sales volumes for the first six months of 2024 also reflect higher mining and milling rates.
PT-FI’s consolidated gold sales volumes totaled 356 thousand ounces in second-quarter 2024, 492 thousand ounces in second-quarter 2023, 920 thousand ounces for the first six months of 2024 and 758 thousand ounces for the first six months of 2023. PT-FI’s consolidated gold sales volumes for the first six months of 2024 benefited from higher mining and milling rates.
Consolidated sales volumes from PT-FI are expected to approximate 1.7 billion pounds of copper and 1.8 million ounces of gold for the year 2024. Consolidated copper and gold production volumes from PT-FI for the year 2024 are expected to exceed 2024 sales volumes, reflecting the deferral of approximately 100 million pounds of copper and 120 thousand ounces of gold that will be processed by the new downstream processing facilities and sold as refined metal in 2025. Projected sales volumes are dependent on operational performance; the timing of ramp-up of PT-FI’s new smelter; weather-related conditions; and other factors detailed in the “Cautionary Statement” below.
Unit Net Cash (Credits) Costs. We believe unit net cash (credits) costs per pound of copper is a measure that provides investors with information about the cash-generating capacity of our mining operations expressed on a basis relating to the primary metal product for our respective operations. We use this measure for the same purpose and for monitoring operating performance by our mining operations. This information differs from measures of performance determined in accordance with U.S. GAAP and should not be considered in isolation or as a substitute for measures of performance determined in accordance with U.S. GAAP. This measure is presented by other metals mining companies, although our measure may not be comparable to similarly titled measures reported by other companies.
Gross Profit per Pound of Copper and per Ounce of Gold
The following table summarizes the unit net cash (credits) costs and gross profit per pound of copper and per ounce of gold at our Indonesia mining operations. Refer to “Product Revenues and Production Costs” for an explanation of “by-product” and “co-product” methods and a reconciliation of unit net cash credits per pound to production and delivery costs applicable to sales reported in our consolidated financial statements.
| Three Months Ended June 30, | |||||||||||||||||||||||||||||||||||
| 2024 | 2023 | ||||||||||||||||||||||||||||||||||
| By-Product Method | Co-Product Method | By-Product Method | Co-Product Method | ||||||||||||||||||||||||||||||||
| Copper | Gold | Copper | Gold | ||||||||||||||||||||||||||||||||
| Revenues, excluding adjustments | $ | 4.44 | $ | 4.44 | $ | 2,299 | $ | 3.82 | $ | 3.82 | $ | 1,942 | |||||||||||||||||||||||
| Site production and delivery, before net noncash and other costs shown below | 1.59 | 1.01 | 523 | 1.88 | 1.12 | 569 | |||||||||||||||||||||||||||||
| Gold, silver and other by-product credits | (2.66) | — | — | (2.60) | — | — | |||||||||||||||||||||||||||||
| Treatment charges | 0.36 | 0.23 | 119 | 0.39 | 0.23 | 118 | |||||||||||||||||||||||||||||
| Export dutiesa | 0.23 | 0.14 | 74 | — | — | — | |||||||||||||||||||||||||||||
| Royalty on metals | 0.27 | 0.17 | 90 | 0.24 | 0.14 | 72 | |||||||||||||||||||||||||||||
| Unit net cash (credits) costs | (0.21) | 1.55 | 806 | (0.09) | 1.49 | 759 | |||||||||||||||||||||||||||||
| DD&A | 0.74 | 0.47 | 242 | 0.71 | 0.42 | 216 | |||||||||||||||||||||||||||||
| Noncash and other costs, net | 0.19 | b,c | 0.12 | 62 | 0.20 | c,d | 0.12 | 60 | |||||||||||||||||||||||||||
| Total unit costs | 0.72 | 2.14 | 1,110 | 0.82 | 2.03 | 1,035 | |||||||||||||||||||||||||||||
| Revenue adjustments, primarily for pricing on prior period open sales | 0.28 | 0.28 | 86 | (0.14) | (0.14) | 1 | |||||||||||||||||||||||||||||
| Gross profit per pound/ounce | $ | 4.00 | $ | 2.58 | $ | 1,275 | $ | 2.86 | $ | 1.65 | $ | 908 | |||||||||||||||||||||||
| Copper sales (millions of recoverable pounds) | 337 | 337 | 386 | 386 | |||||||||||||||||||||||||||||||
| Gold sales (thousands of recoverable ounces) | 356 | 492 |
| Six Months Ended June 30, | |||||||||||||||||||||||||||||||||||
| 2024 | 2023 | ||||||||||||||||||||||||||||||||||
| By-Product Method | Co-Product Method | By-Product Method | Co-Product Method | ||||||||||||||||||||||||||||||||
| Copper | Gold | Copper | Gold | ||||||||||||||||||||||||||||||||
| Revenues, excluding adjustments | $ | 4.23 | $ | 4.23 | $ | 2,236 | $ | 3.83 | $ | 3.83 | $ | 1,946 | |||||||||||||||||||||||
| Site production and delivery, before net noncash and other costs shown below | 1.55 | 0.96 | 508 | 1.93 | 1.14 | 578 | |||||||||||||||||||||||||||||
| Gold, silver and other by-product credits | (2.59) | — | — | (2.68) | — | — | |||||||||||||||||||||||||||||
| Treatment charges | 0.36 | 0.22 | 116 | 0.38 | 0.23 | 115 | |||||||||||||||||||||||||||||
| Export dutiesa | 0.28 | 0.17 | 91 | 0.03 | 0.02 | 9 | |||||||||||||||||||||||||||||
| Royalty on metals | 0.25 | 0.16 | 85 | 0.26 | 0.15 | 73 | |||||||||||||||||||||||||||||
| Unit net cash (credits) costs | (0.15) | 1.51 | 800 | (0.08) | 1.54 | 775 | |||||||||||||||||||||||||||||
| DD&A | 0.70 | 0.43 | 230 | 0.72 | 0.43 | 217 | |||||||||||||||||||||||||||||
| Noncash and other costs, net | 0.10 | b,c | 0.07 | 34 | 0.18 | c,d | 0.11 | 55 | |||||||||||||||||||||||||||
| Total unit costs | 0.65 | 2.01 | 1,064 | 0.82 | 2.08 | 1,047 | |||||||||||||||||||||||||||||
| Revenue adjustments, primarily for pricing on prior period open sales | 0.01 | 0.01 | (7) | 0.19 | 0.19 | 22 | |||||||||||||||||||||||||||||
| PT Smelting intercompany profit | — | — | — | 0.19 | 0.11 | 58 | |||||||||||||||||||||||||||||
| Gross profit per pound/ounce | $ | 3.59 | $ | 2.23 | $ | 1,165 | $ | 3.39 | $ | 2.05 | $ | 979 | |||||||||||||||||||||||
| Copper sales (millions of recoverable pounds) | 830 | 830 | 584 | 584 | |||||||||||||||||||||||||||||||
| Gold sales (thousands of recoverable ounces) | 920 | 758 | |||||||||||||||||||||||||||||||||
a.Export duties of 2.5% were eliminated effective March 29, 2023, upon verification that construction progress of the new smelter exceeded 50%, and were reinstated at a rate of 7.5% in July 2023 under a revised regulation. As discussed above and in Note 7, PT-FI will continue to pay export duties of 7.5% on copper concentrates during the smelter ramp-up period pursuant to Indonesia regulations.
b.Includes charges totaling $0.10 per pound of copper in second-quarter 2024 and $0.04 per pound of copper for the first six months of 2024 for amounts capitalized in prior years associated with construction of the new downstream processing facilities.
c.Includes charges totaling $0.06 per pound of copper in second-quarter 2024 and $0.04 per pound of copper for the first six months of 2024 for operational readiness and startup costs associated with the new downstream processing facilities and $0.03 per pound of copper in second-quarter 2023 and $0.04 per pound of copper for the first six months of 2023 for feasibility and optimization studies.
d.Includes charges totaling $0.14 per pound of copper in second-quarter 2023 and $0.09 per pound of copper for the first six months of 2023 associated with a potential administrative fine.
PT-FI’s unit net cash credits (including gold, silver and other by-product credits) were $0.21 per pound of copper in second-quarter 2024 and $0.15 per pound of copper for the first six months of 2024, compared to $0.09 per pound of copper in second-quarter 2023 and $0.08 per pound of copper for the first six months of 2023. Favorable unit net cash credits in the 2024 periods, compared with the 2023 periods, primarily reflect lower costs associated with timing of sales related to previously announced shipping delays, partly offset by higher export duties.
Treatment charges vary with the volume of metals sold and the price of copper, and royalties vary with the volume of metals sold and the prices of copper and gold. PT-FI’s royalties totaled $90 million in second-quarter 2024, $92 million in second-quarter 2023, $209 million for the first six months of 2024 and $150 million for the first six months of 2023.
Export duties totaled $75 million in second-quarter 2024, $231 million for the first six months of 2024 and $18 million for the first six months of 2023. Refer to Note 7 for further discussion of PT-FI’s export duties.
Because certain assets are depreciated on a straight-line basis, PT-FI’s unit depreciation rate may vary with asset additions and the level of copper production and sales. The DD&A rate per pound of copper is expected to be higher in the second half of 2024, compared with the 2024 and 2023 periods, as the downstream processing facilities are placed into service.
Revenue adjustments primarily result from changes in prices on provisionally priced copper sales recognized in prior periods. Refer to “Consolidated Results – Revenues” for further discussion of adjustments to prior period provisionally priced copper sales.
PT Smelting’s intercompany profit for the first six months of 2023 represents the change in the deferral of 39.5% of PT-FI’s profit on sales to PT Smelting. Beginning in 2023, PT-FI’s commercial arrangement with PT Smelting changed to a tolling arrangement and there are no further sales from PT-FI to PT Smelting. Refer to Note 1 for further discussion of PT-FI’s equity investment in PT Smelting.
Average unit net cash credits (including gold, silver and other by-product credits) for PT-FI are expected to approximate $0.07 per pound of copper for the year 2024, based on achievement of current sales volumes and cost estimates, and assuming an average price of $2,300 per ounce of gold for the second half of 2024. PT-FI’s average unit net cash credits for the year 2024 would change by approximately $0.06 per pound of copper for each $100 per ounce change in the average price of gold for the second half of 2024.
PT-FI’s projected sales volumes and unit net cash credits for the year 2024 are dependent on operational performance; the timing of the ramp-up of PT-FI’s new smelter in Indonesia; weather-related conditions; timing of shipments; and other factors. Refer to “Cautionary Statement” below, and Item 1A. “Risk Factors” contained in Part I of our 2023 Form 10-K for further discussion of factors that could cause results to differ materially from projections.
Molybdenum
We operate two wholly owned primary molybdenum operations in Colorado – the Climax open-pit mine and the Henderson underground mine. The Climax and Henderson mines produce high-purity, chemical-grade molybdenum concentrate, which is typically further processed into value-added molybdenum chemical products. The majority of the molybdenum concentrate produced at the Climax and Henderson mines, as well as from our North America copper mines and South America operations, is processed at our conversion facilities.
Operating and Development Activities. Production from the primary molybdenum operations totaled 7 million pounds of molybdenum in each of second-quarter 2024 and 2023 and 15 million pounds during both the first six months of 2024 and 2023. Refer to “Consolidated Results” for our consolidated molybdenum operating data, which includes sales of molybdenum produced at our primary molybdenum operations and from our North America copper mines and South America operations. Refer to “Outlook” for projected consolidated molybdenum sales volumes and to “Markets” for a discussion of molybdenum prices.
Unit Net Cash Costs Per Pound of Molybdenum. We believe unit net cash costs per pound of molybdenum is a measure that provides investors with information about the cash-generating capacity of our mining operations expressed on a basis relating to the primary metal product for our respective operations. We use this measure for the same purpose and for monitoring operating performance by our mining operations. This information differs from measures of performance determined in accordance with U.S. GAAP and should not be considered in isolation or as a substitute for measures of performance determined in accordance with U.S. GAAP. This measure is presented by other metals mining companies, although our measure may not be comparable to similarly titled measures reported by other companies.
Average unit net cash costs for the primary molybdenum operations of $19.41 per pound of molybdenum in second-quarter 2024 and $17.50 per pound for the first six months of 2024 were higher than average unit net cash costs of $15.99 per pound in second-quarter 2023 and $13.95 per pound for the first six months of 2023, primarily reflecting higher transitional contract-labor costs and operating and maintenance supply costs. Average unit net cash costs for the primary molybdenum operations are expected to approximate $17.00 per pound of molybdenum for the year 2024, based on achievement of current sales volumes and cost estimates. Refer to “Product Revenues and Production Costs” for a reconciliation of unit net cash costs per pound to production and delivery costs applicable to sales reported in our consolidated financial statements.
Smelting and Refining
Through our downstream integration, we are able to assure placement of a significant portion of our copper concentrate production. We wholly own and operate the Miami smelter in Arizona, Atlantic Copper (a smelter and refinery in Spain), and the El Paso refinery in Texas.
In June 2024, PT-FI substantially completed construction of its new smelter in Indonesia and commenced commissioning operations. Further, PT-FI expects to complete its new PMR by year-end 2024. The new smelter will smelt and refine copper concentrate from PT-FI and the PMR will process anode slimes from the new smelter and PT Smelting. PT-FI also has a 66% (39.5% prior to June 30, 2024) ownership interest in PT Smelting, a copper smelter and refinery in Gresik, Indonesia (refer to Note 1). As a result, PT-FI’s operations will be fully integrated and treatment charges reflecting the cost of smelting and refining operations will be recorded in production and delivery costs (refer to “Indonesia Operations – Downstream Processing Facilities” above).
Atlantic Copper smelts and refines copper concentrate and markets refined copper and precious metals in slimes. During the first six months of 2024, Atlantic Copper’s copper concentrate purchases included 30% from our copper mining operations and 70% from third parties. Atlantic Copper’s treatment charges, which consist of a base rate per pound of copper and per ounce of gold, are generally fixed and represent a cost to our mining operations and income to Atlantic Copper (i.e., higher treatment charges benefit our Atlantic Copper operations). Our North America copper mines are less significantly affected by changes in treatment charges because these operations are largely integrated with our Miami smelter and El Paso refinery.
We defer recognizing profits on sales from our mining operations to Atlantic Copper until final sales to third parties occur. Changes in these deferrals attributable to variability in intercompany volumes resulted in net additions (reductions) to operating income totaling $137 million ($41 million to net income attributable to common stock) in second-quarter 2024, $(39) million ($(21) million to net income attributable to common stock) in second-quarter 2023, $120 million ($36 million to net income attributable to common stock) for the first six months of 2024 and $72 million ($27 million to net income attributable to common stock) for the first six months of 2023. Our net deferred profits on our inventories at Atlantic Copper to be recognized in future periods’ operating income totaled $97 million ($30 million to net income attributable to common stock) at June 30, 2024. Quarterly variations in ore grades, the timing of intercompany shipments and changes in product prices will result in variability in our net deferred profits and quarterly earnings. FCX currently expects the deferral of profit recognition on sales to Atlantic Copper in third-quarter 2024 to result in a reduction to operating income of approximately $50 million (approximately $15 million to
net income attributable to common stock), which will be recognized in future periods as Atlantic Copper sells final refined products to third parties.
In May 2024, the U.S. Environmental Protection Agency (EPA) amended its rule establishing standards for hazardous air pollutant emissions from primary copper smelters. We are evaluating this final rule to determine to what extent we would need to modify our processes and equipment and the costs involved, which could be significant. We expect that this final rule will impact our Miami, Arizona smelter operations, which processes a significant portion of the copper concentrate produced by our North America copper mines. We have appealed the EPA’s final rule to the Court of Appeals for the D.C. Circuit, and we have filed a petition for reconsideration to EPA, including updated information on cost and implementation of the final rule. Refer to “Governmental Regulations – Environmental and Reclamation Matters” in Items 1 and 2. “Business and Properties” contained in Part I of our 2023 Form 10-K for additional information on new and revised environmental regulatory requirements that may result in substantial increased costs for our business.
CAPITAL RESOURCES AND LIQUIDITY
Our consolidated operating cash flows vary with sales volumes; prices realized from copper, gold and molybdenum sales; production costs; income taxes; other working capital changes; and other factors.
We remain focused on managing costs efficiently and continue to advance several important value-enhancing initiatives. We believe the actions we have taken in recent years to build a solid balance sheet, successfully expand low-cost operations and maintain flexible organic growth options while maintaining sufficient liquidity, will allow us to continue to execute our business plans in a prudent manner during periods of economic uncertainty while preserving substantial future asset values. We closely monitor market conditions and will adjust our operating plans to protect liquidity and preserve our asset values, if necessary. We expect to maintain a strong balance sheet and liquidity position as we focus on building long-term value in our business, executing our operating plans safely, responsibly and efficiently, and prudently managing costs and capital expenditures.
Based on current sales volume, cost and metal price estimates discussed in “Outlook,” our available cash and cash equivalents plus our projected consolidated operating cash flows of $7.2 billion for the year 2024 exceed our expected consolidated capital expenditures of $4.7 billion (which includes $2.3 billion for major mining projects and $1.0 billion for PT-FI’s new downstream processing facilities) for the year 2024.
We have cash on hand and the financial flexibility to fund capital expenditures and our other cash requirements for the next twelve months, including noncontrolling interest distributions, income tax payments, current common stock dividends (base and variable) and any share or debt repurchases. At June 30, 2024, we had $5.3 billion in consolidated cash and cash equivalents, and FCX, PT-FI and Cerro Verde have $3.0 billion, $1.75 billion and $350 million, respectively, of availability under their revolving credit facilities.
On July 31, 2024, PT-FI borrowed $250 million under its revolving credit facility to fund capital expenditures for PT-FI’s new downstream processing facilities.
At June 30, 2024, we had $1.0 billion in current restricted cash and cash equivalents, including $0.9 billion associated with PT-FI's export proceeds temporarily deposited in Indonesia banks for 90 days in accordance with a regulation issued by the Indonesia government.
Financial Policy. Our financial policy is aligned with our strategic objectives of maintaining a solid balance sheet, providing cash returns to shareholders and advancing opportunities for future growth. The policy includes a base dividend and a performance-based payout framework, whereby up to 50% of available cash flows generated after planned capital spending and distributions to noncontrolling interests would be allocated to shareholder returns and the balance to debt reduction and investments in value enhancing growth projects, subject to us maintaining our net debt at a level not to exceed the net debt target of $3.0 billion to $4.0 billion (excluding debt for PT-FI’s new downstream processing facilities). Our Board of Directors (Board) reviews the structure of the performance-based payout framework at least annually.
At June 30, 2024, FCX’s net debt, excluding $3.0 billion of debt for PT-FI’s new downstream processing facilities, totaled $0.3 billion (which was net of $0.9 billion of current restricted cash associated with PT-FI’s export proceeds). Refer to "Net Debt" for further discussion.
On June 26, 2024, our Board declared cash dividends totaling $0.15 per share on our common stock (including a $0.075 per share quarterly base cash dividend and a $0.075 per share quarterly variable, performance-based cash dividend), which were paid on August 1, 2024, to common stockholders of record as of July 15, 2024. Based on current market conditions, the base and variable dividends on our common stock are anticipated to total $0.60 per share for 2024 (including the dividends paid on February 1, 2024, May 1, 2024, and August 1, 2024), comprised of a $0.30 per share base dividend and $0.30 per share variable dividend. The declaration and payment of dividends (base or variable) are at the discretion of our Board and will depend on our financial results, cash requirements, global economic conditions and other factors deemed relevant by our Board.
In July 2024, FCX acquired 1.2 million shares of its common stock for a total cost of $59 million ($50.48 average cost per share) bringing total purchases under its $5.0 billion share repurchase program to 49.0 million shares of common stock for a cost of $1.9 billion ($38.64 average cost per share). The timing and amount of share repurchases is at the discretion of management and will depend on a variety of factors. The share repurchase program may be modified, increased, suspended or terminated at any time at our Board’s discretion.
Cash
Following is a summary of the U.S. and international components of consolidated cash and cash equivalents available to the parent company, net of noncontrolling interests’ share, taxes and other costs at June 30, 2024 (in billions):
| Cash at domestic companies | $ | 2.6 | |||||||||
| Cash at international operations | 2.7 | a | |||||||||
| Total consolidated cash and cash equivalents | 5.3 | ||||||||||
| Noncontrolling interests’ share | (1.3) | ||||||||||
| Cash, net of noncontrolling interests’ share | 4.0 | ||||||||||
| Withholding taxes | (0.1) | ||||||||||
| Net cash available | $ | 3.9 |
a.Excludes $0.9 billion of current restricted cash associated with a portion of PT-FI's export proceeds required to be temporarily deposited in Indonesia banks for 90 days in accordance with a regulation issued by the Indonesia government.
Cash held at our international operations is generally used to support our foreign operations’ capital expenditures, operating expenses, debt repayments, working capital or other cash needs. Management believes that sufficient liquidity is available in the U.S. from cash balances and availability from our revolving credit facility. We have not elected to permanently reinvest earnings from our foreign subsidiaries, and we have recorded deferred tax liabilities for foreign earnings that are available to be repatriated to the U.S. From time to time, our foreign subsidiaries distribute earnings to the U.S. through dividends that are subject to applicable withholding taxes and noncontrolling interests’ share.
Debt
At June 30, 2024, consolidated debt totaled $9.4 billion, with a weighted-average interest rate of 5.2%. Substantially all of our outstanding debt is fixed rate.
We have $0.7 billion in scheduled senior note maturities in November 2024 with no further senior note maturities until 2027. Our total debt has an average remaining duration of approximately 10 years.
Refer to Note 4 for further discussion.
Operating Activities
We generated operating cash flows of $3.9 billion for the first six months of 2024 and $2.7 billion for the first six months of 2023. Higher operating cash flows for the first six months of 2024, compared with the first six months of 2023, primarily reflects higher copper and gold sales volumes and higher average realized prices.
Investing Activities
Capital Expenditures. Capital expenditures, including capitalized interest, totaled $2.4 billion for the first six months of 2024 and $2.3 billion for the first six months of 2023, including amounts for major mining projects ($0.9 billion for the first six months of 2024 and $0.8 billion for the first six months of 2023), primarily associated with underground development activities in the Grasberg minerals district and for PT-FI’s new downstream processing facilities ($0.7 billion for the first six months of 2024 and $0.8 billion for the first six months of 2023).
Financing Activities
Debt Transactions. Net repayments of debt totaling $1.1 billion for the first six months of 2023 reflected the repayment of our 3.875% Senior Notes that matured in March 2023.
Cash Dividends on Common Stock. We paid cash dividends on our common stock totaling $0.4 billion during each of the first six months of 2024 and 2023. The declaration and payment of dividends (base or variable) is at the discretion of our Board and will depend on our financial results, cash requirements, global economic conditions and other factors deemed relevant by our Board. Refer to Note 4, Item 1A. “Risk Factors” contained in Part I of our 2023 Form 10-K, “Cautionary Statement” below and the discussion of our financial policy above.
Cash Dividends and Distributions Paid to Noncontrolling Interests. Cash dividends and distributions paid to noncontrolling interests at our international operations totaled $0.7 billion (including $0.6 billion from PT-FI) for the first six months of 2024 and $0.3 billion (including $0.2 billion from PT-FI ) for the first six months of 2023. Cash dividends and distributions to noncontrolling interests vary based on the operating results and cash requirements of our consolidated subsidiaries.
CONTRACTUAL OBLIGATIONS
There have been no material changes in our contractual obligations since December 31, 2023. Refer to Note 13 and Part II, Items 7. and 7A. in our 2023 Form 10-K for information regarding our contractual obligations.
CONTINGENCIES
Environmental Obligations and AROs
Our current and historical operating activities are subject to various environmental laws and regulations. We perform a comprehensive annual review of our environmental obligations and AROs and also review changes in facts and circumstances associated with these obligations at least quarterly.
As discussed in Note 7, we recorded net charges totaling $79 million for the first six months of 2024, primarily associated with changes in cost estimates for former processing facilities and historical smelter sites. In addition, we recorded net ARO additions totaling $0.4 billion in the first six months of 2024, including $0.3 billion at mining operations primarily associated with revised closure plans and cost estimates to reflect our commitment to the Global Industry Standard on Tailings Management and $0.1 billion at our oil and gas properties primarily associated with assumed abandonment obligations resulting from bankruptcies of other companies.
Refer to Note 12 of our 2023 Form 10-K for further information about contingencies associated with environmental matters and AROs.
Litigation and Other Contingencies
There have been no significant updates to our contingencies associated with legal proceedings, environmental and other matters since December 31, 2023, other than as disclosed in Note 7. Refer to Note 12 and “Legal Proceedings” contained in Part I, Item 3. of our 2023 Form 10-K, as updated by Note 7, for further information regarding litigation and other contingencies.
NEW ACCOUNTING STANDARDS
There were no significant updates to previously reported accounting standards included in Note 1 of our 2023 Form 10-K.
CRITICAL ACCOUNTING ESTIMATES
MD&A is based on our consolidated financial statements, which have been prepared in conformity with U.S. GAAP. The preparation of these statements requires that we make estimates and assumptions that affect the reported amounts of assets, liabilities, revenues and expenses. We base these estimates on historical experience and on assumptions that we consider reasonable under the circumstances; however, reported results could differ from those based on the current estimates under different assumptions or conditions. For a description of our critical accounting estimates that require us to make the most difficult, subjective or complex judgments, refer to our 2023 Form 10-K. We have not changed any of these policies from those previously disclosed in that report.
NET DEBT
We believe that net debt provides investors with information related to the performance-based payout framework in our financial policy, which requires us to maintain our net debt at a level not to exceed the net debt target of $3 billion to $4 billion, excluding debt for PT-FI’s new downstream processing facilities. We define net debt as consolidated debt less (i) consolidated cash and cash equivalents and (ii) current restricted cash associated with PT-FI's export proceeds. This information differs from consolidated debt determined in accordance with U.S. GAAP and should not be considered in isolation or as a substitute for consolidated debt determined in accordance with U.S. GAAP. Our net debt, which may not be comparable to similarly titled measures reported by other companies, follows (in billions):
| As of June 30, 2024 | ||||||||||||||
| Current portion of debt | $ | 0.8 | ||||||||||||
| Long-term debt, less current portion | 8.7 | |||||||||||||
| Consolidated debt | 9.4 | a | ||||||||||||
| Less: consolidated cash and cash equivalents | 5.3 | |||||||||||||
| Less: current restricted cash associated with PT-FI’s export proceedsb | 0.9 | |||||||||||||
| FCX net debt | 3.3 | a | ||||||||||||
| Less: debt for PT-FI’s new downstream processing facilitiesc | 3.0 | |||||||||||||
| FCX net debt, excluding debt for PT-FI’s new downstream processing facilities | $ | 0.3 |
a.Does not foot because of rounding.
b.In accordance with a regulation issued by the Indonesia government, 30% of PT-FI’s export proceeds are being temporarily deposited into Indonesia banks for a period of 90 days before withdrawal and are presented as current restricted cash and cash equivalents in our consolidated balance sheet. As the 90-day holding period is the only restriction on the cash, we have included such amount in the calculation of net debt.
c.Represents senior notes issued by PT-FI.
PRODUCT REVENUES AND PRODUCTION COSTS
We believe unit net cash costs (credits) per pound of copper and molybdenum are measures that provide investors with information about the cash-generating capacity of our mining operations expressed on a basis relating to the primary metal product for the respective operations. We use this measure for the same purpose and for monitoring operating performance by our mining operations. This information differs from measures of performance determined in accordance with U.S. GAAP and should not be considered in isolation or as a substitute for measures of performance determined in accordance with U.S. GAAP. These measures are presented by other metals mining companies, although our measures may not be comparable to similarly titled measures reported by other companies.
We present gross profit per pound of copper in the following tables using both a “by-product” method and a “co-product” method. We use the by-product method in our presentation of gross profit per pound of copper because (i) the majority of our revenues are copper revenues, (ii) we mine ore, which contains copper, gold, molybdenum and other metals, (iii) it is not possible to specifically assign all of our costs to revenues from the copper, gold, molybdenum and other metals we produce and (iv) it is the method used by our management and Board to monitor our mining operations and to compare mining operations in certain industry publications. In the co-product method presentations, shared costs are allocated to the different products based on their relative revenue values, which will vary to the extent our metals sales volumes and realized prices change.
We show revenue adjustments for prior period open sales as a separate line item. Because these adjustments do not result from current period sales, these amounts have been reflected separately from revenues on current period sales. Noncash and other costs, net which are removed from site production and delivery costs in the calculation of unit net cash costs, consist of items such as accretion of AROs, inventory write-offs and adjustments, stock-based compensation costs, long-lived asset impairments, idle facility costs, feasibility and optimization study costs, restructuring and/or unusual charges. As discussed above, gold, molybdenum and other metal revenues at copper mines are reflected as credits against site production and delivery costs in the by-product method. The following schedules are presentations under both the by-product and co-product methods together with reconciliations to amounts reported in our consolidated financial statements.
North America Copper Mines Product Revenues, Production Costs and Unit Net Cash Costs
| Three Months Ended June 30, 2024 | |||||||||||||||||||||||||||||||||||
| (In millions) | By-Product | Co-Product Method | |||||||||||||||||||||||||||||||||
| Method | Copper | Molybdenuma | Otherb | Total | |||||||||||||||||||||||||||||||
| Revenues, excluding adjustments | $ | 1,357 | $ | 1,357 | $ | 130 | $ | 42 | $ | 1,529 | |||||||||||||||||||||||||
| Site production and delivery, before net noncash and other costs shown below | 1,022 | 925 | 110 | 33 | 1,068 | ||||||||||||||||||||||||||||||
| By-product credits | (126) | — | — | — | — | ||||||||||||||||||||||||||||||
| Treatment charges | 40 | 38 | — | 2 | 40 | ||||||||||||||||||||||||||||||
| Net cash costs | 936 | 963 | 110 | 35 | 1,108 | ||||||||||||||||||||||||||||||
| DD&A | 106 | 96 | 8 | 2 | 106 | ||||||||||||||||||||||||||||||
| Noncash and other costs, net | 37 | c | 34 | 2 | 1 | 37 | |||||||||||||||||||||||||||||
| Total costs | 1,079 | 1,093 | 120 | 38 | 1,251 | ||||||||||||||||||||||||||||||
| Other revenue adjustments, primarily for pricing on prior period open sales | 3 | 3 | — | — | 3 | ||||||||||||||||||||||||||||||
| Gross profit | $ | 281 | $ | 267 | $ | 10 | $ | 4 | $ | 281 | |||||||||||||||||||||||||
| Copper sales (millions of recoverable pounds) | 293 | 293 | |||||||||||||||||||||||||||||||||
| Molybdenum sales (millions of recoverable pounds)a | 7 | ||||||||||||||||||||||||||||||||||
| Gross profit per pound of copper/molybdenum: | |||||||||||||||||||||||||||||||||||
| Revenues, excluding adjustments | $ | 4.63 | $ | 4.63 | $ | 19.97 | |||||||||||||||||||||||||||||
| Site production and delivery, before net noncash and other costs shown below | 3.48 | 3.15 | 16.87 | ||||||||||||||||||||||||||||||||
| By-product credits | (0.43) | — | — | ||||||||||||||||||||||||||||||||
| Treatment charges | 0.14 | 0.13 | — | ||||||||||||||||||||||||||||||||
| Unit net cash costs | 3.19 | 3.28 | 16.87 | ||||||||||||||||||||||||||||||||
| DD&A | 0.36 | 0.33 | 1.21 | ||||||||||||||||||||||||||||||||
| Noncash and other costs, net | 0.13 | c | 0.12 | 0.33 | |||||||||||||||||||||||||||||||
| Total unit costs | 3.68 | 3.73 | 18.41 | ||||||||||||||||||||||||||||||||
| Other revenue adjustments, primarily for pricing on prior period open sales | 0.01 | 0.01 | — | ||||||||||||||||||||||||||||||||
| Gross profit per pound | $ | 0.96 | $ | 0.91 | $ | 1.56 | |||||||||||||||||||||||||||||
| Reconciliation to Amounts Reported | |||||||||||||||||||||||||||||||||||
| Revenues | Production and Delivery | DD&A | |||||||||||||||||||||||||||||||||
| Totals presented above | $ | 1,529 | $ | 1,068 | $ | 106 | |||||||||||||||||||||||||||||
| Treatment charges | — | 40 | — | ||||||||||||||||||||||||||||||||
| Noncash and other costs, net | — | 37 | — | ||||||||||||||||||||||||||||||||
| Other revenue adjustments, primarily for pricing on prior period open sales | 3 | — | — | ||||||||||||||||||||||||||||||||
| Eliminations and other | 4 | 6 | — | ||||||||||||||||||||||||||||||||
| North America copper mines | 1,536 | 1,151 | 106 | ||||||||||||||||||||||||||||||||
| Other miningd | 6,521 | 4,217 | 386 | ||||||||||||||||||||||||||||||||
| Corporate, other & eliminations | (1,433) | (1,493) | 17 | ||||||||||||||||||||||||||||||||
| As reported in our consolidated financial statements | $ | 6,624 | $ | 3,875 | $ | 509 | |||||||||||||||||||||||||||||
a.Reflects sales of molybdenum produced by certain of the North America copper mines to our molybdenum sales company at market-based pricing.
b.Includes gold and silver product revenues and production costs.
c.Includes charges totaling $14 million ($0.05 per pound of copper) for feasibility and optimization studies.
d.Represents the combined total for our other segments as presented in Note 8.
North America Copper Mines Product Revenues, Production Costs and Unit Net Cash Costs
| Three Months Ended June 30, 2023 | |||||||||||||||||||||||||||||||||||
| (In millions) | By-Product | Co-Product Method | |||||||||||||||||||||||||||||||||
| Method | Copper | Molybdenuma | Otherb | Total | |||||||||||||||||||||||||||||||
| Revenues, excluding adjustments | $ | 1,337 | $ | 1,337 | $ | 200 | $ | 51 | $ | 1,588 | |||||||||||||||||||||||||
| Site production and delivery, before net noncash and other costs shown below | 999 | 870 | 139 | 51 | 1,060 | ||||||||||||||||||||||||||||||
| By-product credits | (190) | — | — | — | — | ||||||||||||||||||||||||||||||
| Treatment charges | 46 | 43 | — | 3 | 46 | ||||||||||||||||||||||||||||||
| Net cash costs | 855 | 913 | 139 | 54 | 1,106 | ||||||||||||||||||||||||||||||
| DD&A | 99 | 87 | 10 | 2 | 99 | ||||||||||||||||||||||||||||||
| Noncash and other costs, net | 52 | c | 46 | 5 | 1 | 52 | |||||||||||||||||||||||||||||
| Total costs | 1,006 | 1,046 | 154 | 57 | 1,257 | ||||||||||||||||||||||||||||||
| Other revenue adjustments, primarily for pricing on prior period open sales | (11) | (11) | — | — | (11) | ||||||||||||||||||||||||||||||
| Gross profit (loss) | $ | 320 | $ | 280 | $ | 46 | $ | (6) | $ | 320 | |||||||||||||||||||||||||
| Copper sales (millions of recoverable pounds) | 341 | 341 | |||||||||||||||||||||||||||||||||
| Molybdenum sales (millions of recoverable pounds)a | 9 | ||||||||||||||||||||||||||||||||||
| Gross profit per pound of copper/molybdenum: | |||||||||||||||||||||||||||||||||||
| Revenues, excluding adjustments | $ | 3.92 | $ | 3.92 | $ | 23.08 | |||||||||||||||||||||||||||||
| Site production and delivery, before net noncash and other costs shown below | 2.93 | 2.55 | 16.04 | ||||||||||||||||||||||||||||||||
| By-product credits | (0.55) | — | — | ||||||||||||||||||||||||||||||||
| Treatment charges | 0.13 | 0.13 | — | ||||||||||||||||||||||||||||||||
| Unit net cash costs | 2.51 | 2.68 | 16.04 | ||||||||||||||||||||||||||||||||
| DD&A | 0.29 | 0.26 | 1.15 | ||||||||||||||||||||||||||||||||
| Noncash and other costs, net | 0.15 | c | 0.13 | 0.60 | |||||||||||||||||||||||||||||||
| Total unit costs | 2.95 | 3.07 | 17.79 | ||||||||||||||||||||||||||||||||
| Other revenue adjustments, primarily for pricing on prior period open sales | (0.03) | (0.03) | — | ||||||||||||||||||||||||||||||||
| Gross profit per pound | $ | 0.94 | $ | 0.82 | $ | 5.29 | |||||||||||||||||||||||||||||
| Reconciliation to Amounts Reported | |||||||||||||||||||||||||||||||||||
| Revenues | Production and Delivery | DD&A | |||||||||||||||||||||||||||||||||
| Totals presented above | $ | 1,588 | $ | 1,060 | $ | 99 | |||||||||||||||||||||||||||||
| Treatment charges | (3) | 43 | — | ||||||||||||||||||||||||||||||||
| Noncash and other costs, net | — | 52 | — | ||||||||||||||||||||||||||||||||
| Other revenue adjustments, primarily for pricing on prior period open sales | (11) | — | — | ||||||||||||||||||||||||||||||||
| Eliminations and other | 16 | 12 | — | ||||||||||||||||||||||||||||||||
| North America copper mines | 1,590 | 1,167 | 99 | ||||||||||||||||||||||||||||||||
| Other miningd | 5,756 | 3,939 | 429 | ||||||||||||||||||||||||||||||||
| Corporate, other & eliminations | (1,609) | (1,557) | 19 | ||||||||||||||||||||||||||||||||
| As reported in our consolidated financial statements | $ | 5,737 | $ | 3,549 | $ | 547 | |||||||||||||||||||||||||||||
a.Reflects sales of molybdenum produced by certain of the North America copper mines to our molybdenum sales company at market-based pricing.
b.Includes gold and silver product revenues and production costs.
c.Includes charges totaling $26 million ($0.08 per pound of copper) for feasibility and optimization studies.
d.Represents the combined total for our other segments as presented in Note 8.
North America Copper Mines Product Revenues, Production Costs and Unit Net Cash Costs
| Six Months Ended June 30, 2024 | |||||||||||||||||||||||||||||||||||
| (In millions) | By-Product | Co-Product Method | |||||||||||||||||||||||||||||||||
| Method | Copper | Molybdenuma | Otherb | Total | |||||||||||||||||||||||||||||||
| Revenues, excluding adjustments | $ | 2,676 | $ | 2,676 | $ | 265 | $ | 81 | $ | 3,022 | |||||||||||||||||||||||||
| Site production and delivery, before net noncash and other costs shown below | 2,096 | 1,898 | 226 | 65 | 2,189 | ||||||||||||||||||||||||||||||
| By-product credits | (253) | — | — | — | — | ||||||||||||||||||||||||||||||
| Treatment charges | 83 | 80 | — | 3 | 83 | ||||||||||||||||||||||||||||||
| Net cash costs | 1,926 | 1,978 | 226 | 68 | 2,272 | ||||||||||||||||||||||||||||||
| DD&A | 217 | 197 | 17 | 3 | 217 | ||||||||||||||||||||||||||||||
| Noncash and other costs, net | 82 | c | 76 | 5 | 1 | 82 | |||||||||||||||||||||||||||||
| Total costs | 2,225 | 2,251 | 248 | 72 | 2,571 | ||||||||||||||||||||||||||||||
| Gross profit | $ | 451 | $ | 425 | $ | 17 | $ | 9 | $ | 451 | |||||||||||||||||||||||||
| Copper sales (millions of recoverable pounds) | 626 | 626 | |||||||||||||||||||||||||||||||||
| Molybdenum sales (millions of recoverable pounds)a | 14 | ||||||||||||||||||||||||||||||||||
| Gross profit per pound of copper/molybdenum: | |||||||||||||||||||||||||||||||||||
| Revenues, excluding adjustments | $ | 4.28 | $ | 4.28 | $ | 19.18 | |||||||||||||||||||||||||||||
| Site production and delivery, before net noncash and other costs shown below | 3.35 | 3.03 | 16.35 | ||||||||||||||||||||||||||||||||
| By-product credits | (0.40) | — | — | ||||||||||||||||||||||||||||||||
| Treatment charges | 0.13 | 0.13 | — | ||||||||||||||||||||||||||||||||
| Unit net cash costs | 3.08 | 3.16 | 16.35 | ||||||||||||||||||||||||||||||||
| DD&A | 0.35 | 0.32 | 1.22 | ||||||||||||||||||||||||||||||||
| Noncash and other costs, net | 0.13 | c | 0.12 | 0.39 | |||||||||||||||||||||||||||||||
| Total unit costs | 3.56 | 3.60 | 17.96 | ||||||||||||||||||||||||||||||||
| Gross profit per pound | $ | 0.72 | $ | 0.68 | $ | 1.22 | |||||||||||||||||||||||||||||
| Reconciliation to Amounts Reported | |||||||||||||||||||||||||||||||||||
| Production | |||||||||||||||||||||||||||||||||||
| Revenues | and Delivery | DD&A | |||||||||||||||||||||||||||||||||
| Totals presented above | $ | 3,022 | $ | 2,189 | $ | 217 | |||||||||||||||||||||||||||||
| Treatment charges | (2) | 81 | — | ||||||||||||||||||||||||||||||||
| Noncash and other costs, net | — | 82 | — | ||||||||||||||||||||||||||||||||
| Eliminations and other | 18 | 23 | 1 | ||||||||||||||||||||||||||||||||
| North America copper mines | 3,038 | 2,375 | 218 | ||||||||||||||||||||||||||||||||
| Other miningd | 12,799 | 8,107 | 853 | ||||||||||||||||||||||||||||||||
| Corporate, other & eliminations | (2,892) | (2,763) | 33 | ||||||||||||||||||||||||||||||||
| As reported in our consolidated financial statements | $ | 12,945 | $ | 7,719 | $ | 1,104 | |||||||||||||||||||||||||||||
a.Reflects sales of molybdenum produced by certain of the North America copper mines to our molybdenum sales company at market-based pricing.
b.Includes gold and silver product revenues and production costs.
c.Includes charges totaling $30 million ($0.05 per pound of copper) for feasibility and optimization studies.
d.Represents the combined total for our other mining operations as presented in Note 8.
North America Copper Mines Product Revenues, Production Costs and Unit Net Cash Costs
| Six Months Ended June 30, 2023 | |||||||||||||||||||||||||||||||||||
| (In millions) | By-Product | Co-Product Method | |||||||||||||||||||||||||||||||||
| Method | Copper | Molybdenuma | Otherb | Total | |||||||||||||||||||||||||||||||
| Revenues, excluding adjustments | $ | 2,723 | $ | 2,723 | $ | 412 | $ | 86 | $ | 3,221 | |||||||||||||||||||||||||
| Site production and delivery, before net noncash and other costs shown below | 1,975 | 1,720 | 288 | 78 | 2,086 | ||||||||||||||||||||||||||||||
| By-product credits | (387) | — | — | — | — | ||||||||||||||||||||||||||||||
| Treatment charges | 88 | 83 | — | 5 | 88 | ||||||||||||||||||||||||||||||
| Net cash costs | 1,676 | 1,803 | 288 | 83 | 2,174 | ||||||||||||||||||||||||||||||
| DD&A | 202 | 178 | 20 | 4 | 202 | ||||||||||||||||||||||||||||||
| Noncash and other costs, net | 127 | c | 108 | 17 | 2 | 127 | |||||||||||||||||||||||||||||
| Total costs | 2,005 | 2,089 | 325 | 89 | 2,503 | ||||||||||||||||||||||||||||||
| Other revenue adjustments, primarily for pricing on prior period open sales | 13 | 13 | — | — | 13 | ||||||||||||||||||||||||||||||
| Gross profit (loss) | $ | 731 | $ | 647 | $ | 87 | $ | (3) | $ | 731 | |||||||||||||||||||||||||
| Copper sales (millions of recoverable pounds) | 676 | 676 | |||||||||||||||||||||||||||||||||
| Molybdenum sales (millions of recoverable pounds)a | 16 | ||||||||||||||||||||||||||||||||||
| Gross profit per pound of copper/molybdenum: | |||||||||||||||||||||||||||||||||||
| Revenues, excluding adjustments | $ | 4.03 | $ | 4.03 | $ | 25.52 | |||||||||||||||||||||||||||||
| Site production and delivery, before net noncash and other costs shown below | 2.92 | 2.55 | 17.81 | ||||||||||||||||||||||||||||||||
| By-product credits | (0.57) | — | — | ||||||||||||||||||||||||||||||||
| Treatment charges | 0.13 | 0.12 | — | ||||||||||||||||||||||||||||||||
| Unit net cash costs | 2.48 | 2.67 | 17.81 | ||||||||||||||||||||||||||||||||
| DD&A | 0.30 | 0.26 | 1.24 | ||||||||||||||||||||||||||||||||
| Noncash and other costs, net | 0.19 | c | 0.16 | 1.06 | |||||||||||||||||||||||||||||||
| Total unit costs | 2.97 | 3.09 | 20.11 | ||||||||||||||||||||||||||||||||
| Other revenue adjustments, primarily for pricing on prior period open sales | 0.02 | 0.02 | — | ||||||||||||||||||||||||||||||||
| Gross profit per pound | $ | 1.08 | $ | 0.96 | $ | 5.41 | |||||||||||||||||||||||||||||
| Reconciliation to Amounts Reported | |||||||||||||||||||||||||||||||||||
| Production | |||||||||||||||||||||||||||||||||||
| Revenues | and Delivery | DD&A | |||||||||||||||||||||||||||||||||
| Totals presented above | $ | 3,221 | $ | 2,086 | $ | 202 | |||||||||||||||||||||||||||||
| Treatment charges | (9) | 79 | — | ||||||||||||||||||||||||||||||||
| Noncash and other costs, net | — | 127 | — | ||||||||||||||||||||||||||||||||
| Other revenue adjustments, primarily for pricing on prior period open sales | 13 | — | — | ||||||||||||||||||||||||||||||||
| Eliminations and other | 35 | 37 | — | ||||||||||||||||||||||||||||||||
| North America copper mines | 3,260 | 2,329 | 202 | ||||||||||||||||||||||||||||||||
| Other miningd | 11,068 | 7,441 | 712 | ||||||||||||||||||||||||||||||||
| Corporate, other & eliminations | (3,202) | (3,056) | 32 | ||||||||||||||||||||||||||||||||
| As reported in our consolidated financial statements | $ | 11,126 | $ | 6,714 | $ | 946 | |||||||||||||||||||||||||||||
a.Reflects sales of molybdenum produced by certain of the North America copper mines to our molybdenum sales company at market-based pricing.
b.Includes gold and silver product revenues and production costs.
c.Includes charges totaling $53 million ($0.08 per pound of copper) for feasibility and optimization studies.
d.Represents the combined total for our other mining operations as presented in Note 8.
South America Operations Product Revenues, Production Costs and Unit Net Cash Costs
| Three Months Ended June 30, 2024 | |||||||||||||||||||||||||||||
| (In millions) | By-Product | Co-Product Method | |||||||||||||||||||||||||||
| Method | Copper | Othera | Total | ||||||||||||||||||||||||||
| Revenues, excluding adjustments | $ | 1,326 | $ | 1,326 | $ | 147 | $ | 1,473 | |||||||||||||||||||||
| Site production and delivery, before net noncash and other costs shown below | 828 | b | 754 | 88 | 842 | ||||||||||||||||||||||||
| By-product credits | (136) | — | — | — | |||||||||||||||||||||||||
| Treatment charges | 48 | 48 | — | 48 | |||||||||||||||||||||||||
| Royalty on metals | 3 | 2 | 1 | 3 | |||||||||||||||||||||||||
| Net cash costs | 743 | 804 | 89 | 893 | |||||||||||||||||||||||||
| DD&A | 114 | 102 | 12 | 114 | |||||||||||||||||||||||||
| Noncash and other costs, net | 19 | c | 19 | — | 19 | ||||||||||||||||||||||||
| Total costs | 876 | 925 | 101 | 1,026 | |||||||||||||||||||||||||
| Other revenue adjustments, primarily for pricing on prior period open sales | 87 | 87 | 3 | 90 | |||||||||||||||||||||||||
| Gross profit | $ | 537 | $ | 488 | $ | 49 | $ | 537 | |||||||||||||||||||||
| Copper sales (millions of recoverable pounds) | 302 | 302 | |||||||||||||||||||||||||||
| Gross profit per pound of copper: | |||||||||||||||||||||||||||||
| Revenues, excluding adjustments | $ | 4.39 | $ | 4.39 | |||||||||||||||||||||||||
| Site production and delivery, before net noncash and other costs shown below | 2.74 | b | 2.49 | ||||||||||||||||||||||||||
| By-product credits | (0.45) | — | |||||||||||||||||||||||||||
| Treatment charges | 0.16 | 0.16 | |||||||||||||||||||||||||||
| Royalty on metals | 0.01 | 0.01 | |||||||||||||||||||||||||||
| Unit net cash costs | 2.46 | 2.66 | |||||||||||||||||||||||||||
| DD&A | 0.38 | 0.34 | |||||||||||||||||||||||||||
| Noncash and other costs, net | 0.06 | c | 0.06 | ||||||||||||||||||||||||||
| Total unit costs | 2.90 | 3.06 | |||||||||||||||||||||||||||
| Other revenue adjustments, primarily for pricing on prior period open sales | 0.29 | 0.29 | |||||||||||||||||||||||||||
| Gross profit per pound | $ | 1.78 | $ | 1.62 | |||||||||||||||||||||||||
| Reconciliation to Amounts Reported | |||||||||||||||||||||||||||||
| Production | |||||||||||||||||||||||||||||
| Revenues | and Delivery | DD&A | |||||||||||||||||||||||||||
| Totals presented above | $ | 1,473 | $ | 842 | $ | 114 | |||||||||||||||||||||||
| Treatment charges | (48) | — | — | ||||||||||||||||||||||||||
| Royalty on metals | (3) | — | — | ||||||||||||||||||||||||||
| Noncash and other costs, net | — | 19 | — | ||||||||||||||||||||||||||
| Other revenue adjustments, primarily for pricing on prior period open sales | 90 | — | — | ||||||||||||||||||||||||||
| Eliminations and other | (1) | (1) | — | ||||||||||||||||||||||||||
| South America operations | 1,511 | 860 | 114 | ||||||||||||||||||||||||||
| Other miningd | 6,546 | 4,508 | 378 | ||||||||||||||||||||||||||
| Corporate, other & eliminations | (1,433) | (1,493) | 17 | ||||||||||||||||||||||||||
| As reported in our consolidated financial statements | $ | 6,624 | $ | 3,875 | $ | 509 | |||||||||||||||||||||||
a.Includes silver sales of 0.9 million ounces ($29.63 per ounce average realized price). Also reflects sales of molybdenum produced by Cerro Verde to our molybdenum sales company at market-based pricing.
b.Includes nonrecurring charges totaling $65 million ($0.22 per pound of copper) associated with labor-related charges at Cerro Verde associated with a new CLA.
c.Includes charges totaling $12 million ($0.04 per pound of copper) for feasibility studies.
d.Represents the combined total for our other segments as presented in Note 8.
South America Operations Product Revenues, Production Costs and Unit Net Cash Costs
| Three Months Ended June 30, 2023 | |||||||||||||||||||||||||||||
| (In millions) | By-Product | Co-Product Method | |||||||||||||||||||||||||||
| Method | Copper | Othera | Total | ||||||||||||||||||||||||||
| Revenues, excluding adjustments | $ | 1,153 | $ | 1,153 | $ | 128 | $ | 1,281 | |||||||||||||||||||||
| Site production and delivery, before net noncash and other costs shown below | 741 | 678 | 82 | 760 | |||||||||||||||||||||||||
| By-product credits | (109) | — | — | — | |||||||||||||||||||||||||
| Treatment charges | 62 | 62 | — | 62 | |||||||||||||||||||||||||
| Royalty on metals | 2 | 2 | — | 2 | |||||||||||||||||||||||||
| Net cash costs | 696 | 742 | 82 | 824 | |||||||||||||||||||||||||
| DD&A | 132 | 118 | 14 | 132 | |||||||||||||||||||||||||
| Noncash and other costs, net | 24 | b | 23 | 1 | 24 | ||||||||||||||||||||||||
| Total costs | 852 | 883 | 97 | 980 | |||||||||||||||||||||||||
| Other revenue adjustments, primarily for pricing on prior period open sales | (69) | (69) | — | (69) | |||||||||||||||||||||||||
| Gross profit | $ | 232 | $ | 201 | $ | 31 | $ | 232 | |||||||||||||||||||||
| Copper sales (millions of recoverable pounds) | 304 | 304 | |||||||||||||||||||||||||||
| Gross profit per pound of copper: | |||||||||||||||||||||||||||||
| Revenues, excluding adjustments | $ | 3.78 | $ | 3.78 | |||||||||||||||||||||||||
| Site production and delivery, before net noncash and other costs shown below | 2.43 | 2.22 | |||||||||||||||||||||||||||
| By-product credits | (0.37) | — | |||||||||||||||||||||||||||
| Treatment charges | 0.21 | 0.21 | |||||||||||||||||||||||||||
| Royalty on metals | 0.01 | 0.01 | |||||||||||||||||||||||||||
| Unit net cash costs | 2.28 | 2.44 | |||||||||||||||||||||||||||
| DD&A | 0.44 | 0.39 | |||||||||||||||||||||||||||
| Noncash and other costs, net | 0.08 | b | 0.07 | ||||||||||||||||||||||||||
| Total unit costs | 2.80 | 2.90 | |||||||||||||||||||||||||||
| Other revenue adjustments, primarily for pricing on prior period open sales | (0.22) | (0.22) | |||||||||||||||||||||||||||
| Gross profit per pound | $ | 0.76 | $ | 0.66 | |||||||||||||||||||||||||
| Reconciliation to Amounts Reported | |||||||||||||||||||||||||||||
| Production | |||||||||||||||||||||||||||||
| Revenues | and Delivery | DD&A | |||||||||||||||||||||||||||
| Totals presented above | $ | 1,281 | $ | 760 | $ | 132 | |||||||||||||||||||||||
| Treatment charges | (62) | — | — | ||||||||||||||||||||||||||
| Royalty on metals | (2) | — | — | ||||||||||||||||||||||||||
| Noncash and other costs, net | — | 24 | — | ||||||||||||||||||||||||||
| Other revenue adjustments, primarily for pricing on prior period open sales | (69) | — | — | ||||||||||||||||||||||||||
| Eliminations and other | — | (1) | — | ||||||||||||||||||||||||||
| South America operations | 1,148 | 783 | 132 | ||||||||||||||||||||||||||
| Other miningc | 6,198 | 4,323 | 396 | ||||||||||||||||||||||||||
| Corporate, other & eliminations | (1,609) | (1,557) | 19 | ||||||||||||||||||||||||||
| As reported in our consolidated financial statements | $ | 5,737 | $ | 3,549 | $ | 547 | |||||||||||||||||||||||
a.Includes silver sales of 1.1 million ounces ($23.02 per ounce average realized price). Also reflects sales of molybdenum produced by Cerro Verde to our molybdenum sales company at market-based pricing.
b.Includes charges totaling $11 million ($0.04 per pound of copper) for feasibility studies.
c.Represents the combined total for our other segments as presented in Note 8.
South America Operations Product Revenues, Production Costs and Unit Net Cash Costs
| Six Months Ended June 30, 2024 | |||||||||||||||||||||||||||||
| (In millions) | By-Product | Co-Product Method | |||||||||||||||||||||||||||
| Method | Copper | Othera | Total | ||||||||||||||||||||||||||
| Revenues, excluding adjustments | $ | 2,499 | $ | 2,499 | $ | 219 | $ | 2,718 | |||||||||||||||||||||
| Site production and delivery, before net noncash and other costs shown below | 1,571 | b | 1,456 | 142 | 1,598 | ||||||||||||||||||||||||
| By-product credits | (192) | — | — | — | |||||||||||||||||||||||||
| Treatment charges | 99 | 99 | — | 99 | |||||||||||||||||||||||||
| Royalty on metals | 4 | 4 | — | 4 | |||||||||||||||||||||||||
| Net cash costs | 1,482 | 1,559 | 142 | 1,701 | |||||||||||||||||||||||||
| DD&A | 222 | 204 | 18 | 222 | |||||||||||||||||||||||||
| Noncash and other costs, net | 37 | c | 36 | 1 | 37 | ||||||||||||||||||||||||
| Total costs | 1,741 | 1,799 | 161 | 1,960 | |||||||||||||||||||||||||
| Other revenue adjustments, primarily for pricing on prior period open sales | 32 | 32 | — | 32 | |||||||||||||||||||||||||
| Gross profit | $ | 790 | $ | 732 | $ | 58 | $ | 790 | |||||||||||||||||||||
| Copper sales (millions of recoverable pounds) | 586 | 586 | |||||||||||||||||||||||||||
| Gross profit per pound of copper: | |||||||||||||||||||||||||||||
| Revenues, excluding adjustments | $ | 4.27 | $ | 4.27 | |||||||||||||||||||||||||
| Site production and delivery, before net noncash and other costs shown below | 2.68 | b | 2.48 | ||||||||||||||||||||||||||
| By-product credits | (0.33) | — | |||||||||||||||||||||||||||
| Treatment charges | 0.17 | 0.17 | |||||||||||||||||||||||||||
| Royalty on metals | 0.01 | 0.01 | |||||||||||||||||||||||||||
| Unit net cash costs | 2.53 | 2.66 | |||||||||||||||||||||||||||
| DD&A | 0.38 | 0.35 | |||||||||||||||||||||||||||
| Noncash and other costs, net | 0.06 | c | 0.06 | ||||||||||||||||||||||||||
| Total unit costs | 2.97 | 3.07 | |||||||||||||||||||||||||||
| Other revenue adjustments, primarily for pricing on prior period open sales | 0.05 | 0.05 | |||||||||||||||||||||||||||
| Gross profit per pound | $ | 1.35 | $ | 1.25 | |||||||||||||||||||||||||
| Reconciliation to Amounts Reported | |||||||||||||||||||||||||||||
| Production | |||||||||||||||||||||||||||||
| Revenues | and Delivery | DD&A | |||||||||||||||||||||||||||
| Totals presented above | $ | 2,718 | $ | 1,598 | $ | 222 | |||||||||||||||||||||||
| Treatment charges | (99) | — | — | ||||||||||||||||||||||||||
| Royalty on metals | (4) | — | — | ||||||||||||||||||||||||||
| Noncash and other costs, net | — | 37 | — | ||||||||||||||||||||||||||
| Other revenue adjustments, primarily for pricing on prior period open sales | 32 | — | — | ||||||||||||||||||||||||||
| Eliminations and other | — | (2) | — | ||||||||||||||||||||||||||
| South America operations | 2,647 | 1,633 | 222 | ||||||||||||||||||||||||||
| Other miningd | 13,190 | 8,849 | 849 | ||||||||||||||||||||||||||
| Corporate, other & eliminations | (2,892) | (2,763) | 33 | ||||||||||||||||||||||||||
| As reported in our consolidated financial statements | $ | 12,945 | $ | 7,719 | $ | 1,104 | |||||||||||||||||||||||
a.Includes silver sales of $1.8 million ounces ($28.49 per ounce average realized price). Also reflects sales of molybdenum produced by Cerro Verde to FCX’s molybdenum sales company at market-based pricing.
b.Includes nonrecurring charges totaling $65 million ($0.11 per pound of copper) associated with labor-related charges at Cerro Verde associated with a new CLA.
c.Includes charges totaling $23 million ($0.04 per pound of copper) for feasibility studies.
d.Represents the combined total for our other mining operations as presented in Note 8.
South America Operations Product Revenues, Production Costs and Unit Net Cash Costs
| Six Months Ended June 30, 2023 | |||||||||||||||||||||||||||||
| (In millions) | By-Product | Co-Product Method | |||||||||||||||||||||||||||
| Method | Copper | Othera | Total | ||||||||||||||||||||||||||
| Revenues, excluding adjustments | $ | 2,331 | $ | 2,331 | $ | 301 | $ | 2,632 | |||||||||||||||||||||
| Site production and delivery, before net noncash and other costs shown below | 1,508 | 1,363 | 179 | 1,542 | |||||||||||||||||||||||||
| By-product credits | (270) | — | — | — | |||||||||||||||||||||||||
| Treatment charges | 118 | 118 | — | 118 | |||||||||||||||||||||||||
| Royalty on metals | 4 | 3 | 1 | 4 | |||||||||||||||||||||||||
| Net cash costs | 1,360 | 1,484 | 180 | 1,664 | |||||||||||||||||||||||||
| DD&A | 239 | 212 | 27 | 239 | |||||||||||||||||||||||||
| Noncash and other costs, net | 50 | b | 46 | 4 | 50 | ||||||||||||||||||||||||
| Total costs | 1,649 | 1,742 | 211 | 1,953 | |||||||||||||||||||||||||
| Other revenue adjustments, primarily for pricing on prior period open sales | 71 | 71 | 3 | 74 | |||||||||||||||||||||||||
| Gross profit | $ | 753 | $ | 660 | $ | 93 | $ | 753 | |||||||||||||||||||||
| Copper sales (millions of recoverable pounds) | 606 | 606 | |||||||||||||||||||||||||||
| Gross profit per pound of copper: | |||||||||||||||||||||||||||||
| Revenues, excluding adjustments | $ | 3.85 | $ | 3.85 | |||||||||||||||||||||||||
| Site production and delivery, before net noncash and other costs shown below | 2.49 | 2.25 | |||||||||||||||||||||||||||
| By-product credits | (0.45) | — | |||||||||||||||||||||||||||
| Treatment charges | 0.19 | 0.19 | |||||||||||||||||||||||||||
| Royalty on metals | 0.01 | 0.01 | |||||||||||||||||||||||||||
| Unit net cash costs | 2.24 | 2.45 | |||||||||||||||||||||||||||
| DD&A | 0.40 | 0.35 | |||||||||||||||||||||||||||
| Noncash and other costs, net | 0.08 | b | 0.07 | ||||||||||||||||||||||||||
| Total unit costs | 2.72 | 2.87 | |||||||||||||||||||||||||||
| Other revenue adjustments, primarily for pricing on prior period open sales | 0.11 | 0.11 | |||||||||||||||||||||||||||
| Gross profit per pound | $ | 1.24 | $ | 1.09 | |||||||||||||||||||||||||
| Reconciliation to Amounts Reported | |||||||||||||||||||||||||||||
| Production | |||||||||||||||||||||||||||||
| Revenues | and Delivery | DD&A | |||||||||||||||||||||||||||
| Totals presented above | $ | 2,632 | $ | 1,542 | $ | 239 | |||||||||||||||||||||||
| Treatment charges | (118) | — | — | ||||||||||||||||||||||||||
| Royalty on metals | (4) | — | — | ||||||||||||||||||||||||||
| Noncash and other costs, net | — | 50 | — | ||||||||||||||||||||||||||
| Other revenue adjustments, primarily for pricing on prior period open sales | 74 | — | — | ||||||||||||||||||||||||||
| Eliminations and other | — | (2) | — | ||||||||||||||||||||||||||
| South America operations | 2,584 | 1,590 | 239 | ||||||||||||||||||||||||||
| Other miningc | 11,744 | 8,180 | 675 | ||||||||||||||||||||||||||
| Corporate, other & eliminations | (3,202) | (3,056) | 32 | ||||||||||||||||||||||||||
| As reported in our consolidated financial statements | $ | 11,126 | $ | 6,714 | $ | 946 | |||||||||||||||||||||||
a.Includes silver sales of 2.1 million ounces ($23.20 per ounce average realized price). Also reflects sales of molybdenum produced by Cerro Verde to our molybdenum sales company at market-based pricing.
b.Includes charges totaling $19 million ($0.03 per pound of copper) for feasibility studies.
c.Represents the combined total for our other mining operations as presented in Note 8.
Indonesia Operations Product Revenues, Production Costs and Unit Net Cash (Credits) Costs
| Three Months Ended June 30, 2024 | |||||||||||||||||||||||||||||||||||
| (In millions) | Co-Product Method | ||||||||||||||||||||||||||||||||||
| By-Product Method | Copper | Gold | Silver & Othera | Total | |||||||||||||||||||||||||||||||
| Revenues, excluding adjustments | $ | 1,495 | $ | 1,495 | $ | 818 | $ | 42 | $ | 2,355 | |||||||||||||||||||||||||
| Site production and delivery, before net noncash and other costs shown below | 536 | 340 | 186 | 10 | 536 | ||||||||||||||||||||||||||||||
| Gold, silver and other by-product credits | (895) | — | — | — | — | ||||||||||||||||||||||||||||||
| Treatment charges | 123 | 78 | 43 | 2 | 123 | ||||||||||||||||||||||||||||||
| Export duties | 75 | 48 | 26 | 1 | 75 | ||||||||||||||||||||||||||||||
| Royalty on metals | 90 | 57 | 32 | 1 | 90 | ||||||||||||||||||||||||||||||
| Net cash (credits) costs | (71) | 523 | 287 | 14 | 824 | ||||||||||||||||||||||||||||||
| DD&A | 248 | 158 | 86 | 4 | 248 | ||||||||||||||||||||||||||||||
| Noncash and other costs, net | 64 | b | 40 | 22 | 2 | 64 | |||||||||||||||||||||||||||||
| Total costs | 241 | 721 | 395 | 20 | 1,136 | ||||||||||||||||||||||||||||||
| Other revenue adjustments, primarily for pricing on prior period open sales | 93 | 93 | 31 | 4 | 128 | ||||||||||||||||||||||||||||||
| Gross profit | $ | 1,347 | $ | 867 | $ | 454 | $ | 26 | $ | 1,347 | |||||||||||||||||||||||||
| Copper sales (millions of recoverable pounds) | 337 | 337 | |||||||||||||||||||||||||||||||||
| Gold sales (thousands of recoverable ounces) | 356 | ||||||||||||||||||||||||||||||||||
| Gross profit per pound of copper/per ounce of gold: | |||||||||||||||||||||||||||||||||||
| Revenues, excluding adjustments | $ | 4.44 | $ | 4.44 | $ | 2,299 | |||||||||||||||||||||||||||||
| Site production and delivery, before net noncash and other costs shown below | 1.59 | 1.01 | 523 | ||||||||||||||||||||||||||||||||
| Gold, silver and other by-product credits | (2.66) | — | — | ||||||||||||||||||||||||||||||||
| Treatment charges | 0.36 | 0.23 | 119 | ||||||||||||||||||||||||||||||||
| Export duties | 0.23 | 0.14 | 74 | ||||||||||||||||||||||||||||||||
| Royalty on metals | 0.27 | 0.17 | 90 | ||||||||||||||||||||||||||||||||
| Unit net cash (credits) costs | (0.21) | 1.55 | 806 | ||||||||||||||||||||||||||||||||
| DD&A | 0.74 | 0.47 | 242 | ||||||||||||||||||||||||||||||||
| Noncash and other costs, net | 0.19 | b | 0.12 | 62 | |||||||||||||||||||||||||||||||
| Total unit costs | 0.72 | 2.14 | 1,110 | ||||||||||||||||||||||||||||||||
| Other revenue adjustments, primarily for pricing on prior period open sales | 0.28 | 0.28 | 86 | ||||||||||||||||||||||||||||||||
| Gross profit per pound/ounce | $ | 4.00 | $ | 2.58 | $ | 1,275 | |||||||||||||||||||||||||||||
| Reconciliation to Amounts Reported | |||||||||||||||||||||||||||||||||||
| Production | |||||||||||||||||||||||||||||||||||
| Revenues | and Delivery | DD&A | |||||||||||||||||||||||||||||||||
| Totals presented above | $ | 2,355 | $ | 536 | $ | 248 | |||||||||||||||||||||||||||||
| Treatment charges | (50) | 73 | c | — | |||||||||||||||||||||||||||||||
| Export duties | (75) | — | — | ||||||||||||||||||||||||||||||||
| Royalty on metals | (90) | — | — | ||||||||||||||||||||||||||||||||
| Noncash and other costs, net | — | 64 | — | ||||||||||||||||||||||||||||||||
| Other revenue adjustments, primarily for pricing on prior period open sales | 128 | — | — | ||||||||||||||||||||||||||||||||
| Eliminations and other | — | (1) | — | ||||||||||||||||||||||||||||||||
| Indonesia operations | 2,268 | 672 | 248 | ||||||||||||||||||||||||||||||||
| Other miningd | 5,789 | 4,696 | 244 | ||||||||||||||||||||||||||||||||
| Corporate, other & eliminations | (1,433) | (1,493) | 17 | ||||||||||||||||||||||||||||||||
| As reported in our consolidated financial statements | $ | 6,624 | $ | 3,875 | $ | 509 | |||||||||||||||||||||||||||||
a.Includes silver sales of 1.3 million ounces ($28.70 per ounce average realized price).
b.Includes charges totaling $34 million ($0.10 per pound of copper) related to the reversal of previously capitalized land lease depreciation, which related to prior years. Also, includes charges totaling $20 million ($0.06 per pound of copper) for PT-FI’s new downstream processing facilities’ operational readiness and startup costs.
c.Represents tolling costs paid to PT Smelting.
d.Represents the combined total for our other segments as presented in Note 8.
Indonesia Operations Product Revenues, Production Costs and Unit Net Cash (Credits) Costs
| Three Months Ended June 30, 2023 | |||||||||||||||||||||||||||||||||||
| (In millions) | Co-Product Method | ||||||||||||||||||||||||||||||||||
| By-Product Method | Copper | Gold | Silver & Othera | Total | |||||||||||||||||||||||||||||||
| Revenues, excluding adjustments | $ | 1,473 | $ | 1,473 | $ | 956 | $ | 45 | $ | 2,474 | |||||||||||||||||||||||||
| Site production and delivery, before net noncash and other costs shown below | 725 | 432 | 280 | 13 | 725 | ||||||||||||||||||||||||||||||
| Gold, silver and other by-product credits | (1,002) | — | — | — | — | ||||||||||||||||||||||||||||||
| Treatment charges | 151 | 90 | 58 | 3 | 151 | ||||||||||||||||||||||||||||||
| Royalty on metals | 92 | 55 | 36 | 1 | 92 | ||||||||||||||||||||||||||||||
| Net cash (credits) costs | (34) | 577 | 374 | 17 | 968 | ||||||||||||||||||||||||||||||
| DD&A | 275 | 164 | 106 | 5 | 275 | ||||||||||||||||||||||||||||||
| Noncash and other costs, net | 77 | b | 46 | 30 | 1 | 77 | |||||||||||||||||||||||||||||
| Total costs | 318 | 787 | 510 | 23 | 1,320 | ||||||||||||||||||||||||||||||
| Other revenue adjustments, primarily for pricing on prior period open sales | (54) | (54) | 1 | — | (53) | ||||||||||||||||||||||||||||||
| Gross profit | $ | 1,101 | $ | 632 | $ | 447 | $ | 22 | $ | 1,101 | |||||||||||||||||||||||||
| Copper sales (millions of recoverable pounds) | 386 | 386 | |||||||||||||||||||||||||||||||||
| Gold sales (thousands of recoverable ounces) | 492 | ||||||||||||||||||||||||||||||||||
| Gross profit per pound of copper/per ounce of gold: | |||||||||||||||||||||||||||||||||||
| Revenues, excluding adjustments | $ | 3.82 | $ | 3.82 | $ | 1,942 | |||||||||||||||||||||||||||||
| Site production and delivery, before net noncash and other costs shown below | 1.88 | 1.12 | 569 | ||||||||||||||||||||||||||||||||
| Gold, silver and other by-product credits | (2.60) | — | — | ||||||||||||||||||||||||||||||||
| Treatment charges | 0.39 | 0.23 | 118 | ||||||||||||||||||||||||||||||||
| Royalty on metals | 0.24 | 0.14 | 72 | ||||||||||||||||||||||||||||||||
| Unit net cash (credits) costs | (0.09) | 1.49 | 759 | ||||||||||||||||||||||||||||||||
| DD&A | 0.71 | 0.42 | 216 | ||||||||||||||||||||||||||||||||
| Noncash and other costs, net | 0.20 | b | 0.12 | 60 | |||||||||||||||||||||||||||||||
| Total unit costs | 0.82 | 2.03 | 1,035 | ||||||||||||||||||||||||||||||||
| Other revenue adjustments, primarily for pricing on prior period open sales | (0.14) | (0.14) | 1 | ||||||||||||||||||||||||||||||||
| Gross profit per pound/ounce | $ | 2.86 | $ | 1.65 | $ | 908 | |||||||||||||||||||||||||||||
| Reconciliation to Amounts Reported | |||||||||||||||||||||||||||||||||||
| Production | |||||||||||||||||||||||||||||||||||
| Revenues | and Delivery | DD&A | |||||||||||||||||||||||||||||||||
| Totals presented above | $ | 2,474 | $ | 725 | $ | 275 | |||||||||||||||||||||||||||||
| Treatment charges | (92) | 59 | c | — | |||||||||||||||||||||||||||||||
| Royalty on metals | (92) | — | — | ||||||||||||||||||||||||||||||||
| Noncash and other costs, net | — | 77 | — | ||||||||||||||||||||||||||||||||
| Other revenue adjustments, primarily for pricing on prior period open sales | (53) | — | — | ||||||||||||||||||||||||||||||||
| Indonesia operations | 2,237 | 861 | 275 | ||||||||||||||||||||||||||||||||
| Other miningd | 5,109 | 4,245 | 253 | ||||||||||||||||||||||||||||||||
| Corporate, other & eliminations | (1,609) | (1,557) | 19 | ||||||||||||||||||||||||||||||||
| As reported in our consolidated financial statements | $ | 5,737 | $ | 3,549 | $ | 547 | |||||||||||||||||||||||||||||
a.Includes silver sales of 1.8 million ounces ($23.07 per ounce average realized price).
b.Includes charges totaling $55 million ($0.14 per pound of copper) associated with a potential administrative fine and charges totaling $12 million ($0.03 per pound of copper) for feasibility and optimization studies.
c.Primarily represents tolling costs paid to PT Smelting.
d.Represents the combined total for our other mining operations as presented in Note 8.
Indonesia Operations Product Revenues, Production Costs and Unit Net Cash (Credits) Costs
| Six Months Ended June 30, 2024 | ||||||||||||||||||||||||||||||||
| (In millions) | Co-Product Method | |||||||||||||||||||||||||||||||
| By-Product Method | Copper | Gold | Silver & Othera | Total | ||||||||||||||||||||||||||||
| Revenues, excluding adjustments | $ | 3,512 | $ | 3,512 | $ | 2,056 | $ | 102 | $ | 5,670 | ||||||||||||||||||||||
| Site production and delivery, before net noncash and other costs shown below | 1,289 | 799 | 467 | 23 | 1,289 | |||||||||||||||||||||||||||
| Gold, silver and other by-product credits | (2,152) | — | — | — | — | |||||||||||||||||||||||||||
| Treatment charges | 295 | 183 | 107 | 5 | 295 | |||||||||||||||||||||||||||
| Export duties | 231 | 143 | 84 | 4 | 231 | |||||||||||||||||||||||||||
| Royalty on metals | 209 | 128 | 78 | 3 | 209 | |||||||||||||||||||||||||||
| Net cash (credits) costs | (128) | 1,253 | 736 | 35 | 2,024 | |||||||||||||||||||||||||||
| DD&A | 583 | 361 | 212 | 10 | 583 | |||||||||||||||||||||||||||
| Noncash and other costs, net | 87 | b | 54 | 31 | 2 | 87 | ||||||||||||||||||||||||||
| Total costs | 542 | 1,668 | 979 | 47 | 2,694 | |||||||||||||||||||||||||||
| Other revenue adjustments, primarily for pricing on prior period open sales | 7 | 7 | (5) | (1) | 1 | |||||||||||||||||||||||||||
| Gross profit | $ | 2,977 | $ | 1,851 | $ | 1,072 | $ | 54 | $ | 2,977 | ||||||||||||||||||||||
| Copper sales (millions of recoverable pounds) | 830 | 830 | ||||||||||||||||||||||||||||||
| Gold sales (thousands of recoverable ounces) | 920 | |||||||||||||||||||||||||||||||
| Gross profit per pound of copper/per ounce of gold: | ||||||||||||||||||||||||||||||||
| Revenues, excluding adjustments | $ | 4.23 | $ | 4.23 | $ | 2,236 | ||||||||||||||||||||||||||
| Site production and delivery, before net noncash and other costs shown below | 1.55 | 0.96 | 508 | |||||||||||||||||||||||||||||
| Gold, silver and other by-product credits | (2.59) | — | — | |||||||||||||||||||||||||||||
| Treatment charges | 0.36 | 0.22 | 116 | |||||||||||||||||||||||||||||
| Export duties | 0.28 | 0.17 | 91 | |||||||||||||||||||||||||||||
| Royalty on metals | 0.25 | 0.16 | 85 | |||||||||||||||||||||||||||||
| Unit net cash (credits) costs | (0.15) | 1.51 | 800 | |||||||||||||||||||||||||||||
| DD&A | 0.70 | 0.43 | 230 | |||||||||||||||||||||||||||||
| Noncash and other costs, net | 0.10 | b | 0.07 | 34 | ||||||||||||||||||||||||||||
| Total unit costs | 0.65 | 2.01 | 1,064 | |||||||||||||||||||||||||||||
| Other revenue adjustments, primarily for pricing on prior period open sales | 0.01 | 0.01 | (7) | |||||||||||||||||||||||||||||
| Gross profit per pound/ounce | $ | 3.59 | $ | 2.23 | $ | 1,165 | ||||||||||||||||||||||||||
| Reconciliation to Amounts Reported | ||||||||||||||||||||||||||||||||
| Production | ||||||||||||||||||||||||||||||||
| Revenues | and Delivery | DD&A | ||||||||||||||||||||||||||||||
| Totals presented above | $ | 5,670 | $ | 1,289 | $ | 583 | ||||||||||||||||||||||||||
| Treatment charges | (138) | 157 | c | — | ||||||||||||||||||||||||||||
| Export duties | (231) | — | — | |||||||||||||||||||||||||||||
| Royalty on metals | (209) | — | — | |||||||||||||||||||||||||||||
| Noncash and other costs, net | — | 87 | — | |||||||||||||||||||||||||||||
| Other revenue adjustments, primarily for pricing on prior period open sales | 1 | — | — | |||||||||||||||||||||||||||||
| Indonesia operations | 5,093 | 1,533 | 583 | |||||||||||||||||||||||||||||
| Other miningd | 10,744 | 8,949 | 488 | |||||||||||||||||||||||||||||
| Corporate, other & eliminations | (2,892) | (2,763) | 33 | |||||||||||||||||||||||||||||
| As reported in our consolidated financial statements | $ | 12,945 | $ | 7,719 | $ | 1,104 | ||||||||||||||||||||||||||
a.Includes silver sales of 3.4 million ounces ($26.76 per ounce average realized price)
b.Includes charges totaling $34 million ($0.04 per pound of copper) related to the reversal of previously capitalized land lease depreciation, which related to prior years. Also, includes charges totaling $35 million ($0.04 per pound of copper) for PT-FI’s new downstream processing facilities’ operational readiness and startup costs.
c.Represents tolling costs paid to PT Smelting.
d.Represents the combined total for our other mining operations as presented in Note 8.
Indonesia Operations Product Revenues, Production Costs and Unit Net Cash (Credits) Costs
| Six Months Ended June 30, 2023 | |||||||||||||||||||||||||||||||||||
| (In millions) | Co-Product Method | ||||||||||||||||||||||||||||||||||
| By-Product Method | Copper | Gold | Silver & Othera | Total | |||||||||||||||||||||||||||||||
| Revenues, excluding adjustments | $ | 2,238 | $ | 2,238 | $ | 1,474 | $ | 73 | $ | 3,785 | |||||||||||||||||||||||||
| Site production and delivery, before net noncash and other costs shown below | 1,124 | 665 | 438 | 21 | 1,124 | ||||||||||||||||||||||||||||||
| Gold, silver and other by-product credits | (1,564) | — | — | — | — | ||||||||||||||||||||||||||||||
| Treatment charges | 224 | 133 | 87 | 4 | 224 | ||||||||||||||||||||||||||||||
| Export duties | 18 | 10 | 7 | 1 | 18 | ||||||||||||||||||||||||||||||
| Royalty on metals | 150 | 92 | 55 | 3 | 150 | ||||||||||||||||||||||||||||||
| Net cash (credits) costs | (48) | 900 | 587 | 29 | 1,516 | ||||||||||||||||||||||||||||||
| DD&A | 423 | 250 | 165 | 8 | 423 | ||||||||||||||||||||||||||||||
| Noncash and other costs, net | 107 | b | 63 | 42 | 2 | 107 | |||||||||||||||||||||||||||||
| Total costs | 482 | 1,213 | 794 | 39 | 2,046 | ||||||||||||||||||||||||||||||
| Other revenue adjustments, primarily for pricing on prior period open sales | 114 | 114 | 18 | (1) | 131 | ||||||||||||||||||||||||||||||
| PT Smelting intercompany profit | 112 | 66 | 44 | 2 | 112 | ||||||||||||||||||||||||||||||
| Gross profit | $ | 1,982 | $ | 1,205 | $ | 742 | $ | 35 | $ | 1,982 | |||||||||||||||||||||||||
| Copper sales (millions of recoverable pounds) | 584 | 584 | |||||||||||||||||||||||||||||||||
| Gold sales (thousands of recoverable ounces) | 758 | ||||||||||||||||||||||||||||||||||
| Gross profit per pound of copper/per ounce of gold: | |||||||||||||||||||||||||||||||||||
| Revenues, excluding adjustments | $ | 3.83 | $ | 3.83 | $ | 1,946 | |||||||||||||||||||||||||||||
| Site production and delivery, before net noncash and other costs shown below | 1.93 | 1.14 | 578 | ||||||||||||||||||||||||||||||||
| Gold, silver and other by-product credits | (2.68) | — | — | ||||||||||||||||||||||||||||||||
| Treatment charges | 0.38 | 0.23 | 115 | ||||||||||||||||||||||||||||||||
| Export duties | 0.03 | 0.02 | 9 | ||||||||||||||||||||||||||||||||
| Royalty on metals | 0.26 | 0.15 | 73 | ||||||||||||||||||||||||||||||||
| Unit net cash (credits) costs | (0.08) | 1.54 | 775 | ||||||||||||||||||||||||||||||||
| DD&A | 0.72 | 0.43 | 217 | ||||||||||||||||||||||||||||||||
| Noncash and other costs, net | 0.18 | b | 0.11 | 55 | |||||||||||||||||||||||||||||||
| Total unit costs | 0.82 | 2.08 | 1,047 | ||||||||||||||||||||||||||||||||
| Other revenue adjustments, primarily for pricing on prior period open sales | 0.19 | 0.19 | 22 | ||||||||||||||||||||||||||||||||
| PT Smelting intercompany profit | 0.19 | 0.11 | 58 | ||||||||||||||||||||||||||||||||
| Gross profit per pound/ounce | $ | 3.39 | $ | 2.05 | $ | 979 | |||||||||||||||||||||||||||||
| Reconciliation to Amounts Reported | |||||||||||||||||||||||||||||||||||
| Production | |||||||||||||||||||||||||||||||||||
| Revenues | and Delivery | DD&A | |||||||||||||||||||||||||||||||||
| Totals presented above | $ | 3,785 | $ | 1,124 | $ | 423 | |||||||||||||||||||||||||||||
| Treatment charges | (143) | 81 | c | — | |||||||||||||||||||||||||||||||
| Export duties | (18) | — | — | ||||||||||||||||||||||||||||||||
| Royalty on metals | (150) | — | — | ||||||||||||||||||||||||||||||||
| Noncash and other costs, net | — | 107 | — | ||||||||||||||||||||||||||||||||
| Other revenue adjustments, primarily for pricing on prior period open sales | 131 | — | — | ||||||||||||||||||||||||||||||||
| PT Smelting intercompany profit | — | (112) | — | ||||||||||||||||||||||||||||||||
| Eliminations and other | — | (1) | — | ||||||||||||||||||||||||||||||||
| Indonesia operations | 3,605 | 1,199 | 423 | ||||||||||||||||||||||||||||||||
| Other miningd | 10,723 | 8,571 | 491 | ||||||||||||||||||||||||||||||||
| Corporate, other & eliminations | (3,202) | (3,056) | 32 | ||||||||||||||||||||||||||||||||
| As reported in our consolidated financial statements | $ | 11,126 | $ | 6,714 | $ | 946 |
a.Includes silver sales of 2.7 million ounces ($23.28 per ounce average realized price).
b.Includes a charge of $55 million ($0.09 per pound of copper) associated with a potential administrative fine and charges totaling $25 million ($0.04 per pound of copper) for feasibility and optimization studies.
c.Primarily represents tolling costs paid to PT Smelting.
d.Represents the combined total for our other mining operations as presented in Note 8.
Molybdenum Mines Product Revenues, Production Costs and Unit Net Cash Costs
| Three Months Ended June 30, | ||||||||||||||||||||||||||
| (In millions) | 2024 | 2023 | ||||||||||||||||||||||||
| Revenues, excluding adjustmentsa | $ | 144 | $ | 156 | ||||||||||||||||||||||
| Site production and delivery, before net noncash and other costs shown below | 129 | 101 | ||||||||||||||||||||||||
| Treatment charges and other | 6 | 6 | ||||||||||||||||||||||||
| Net cash costs | 135 | 107 | ||||||||||||||||||||||||
| DD&A | 16 | 14 | ||||||||||||||||||||||||
| Noncash and other costs, net | 5 | 4 | ||||||||||||||||||||||||
| Total costs | 156 | 125 | ||||||||||||||||||||||||
| Gross (loss) profit | $ | (12) | $ | 31 | ||||||||||||||||||||||
| Molybdenum sales (millions of recoverable pounds)a | 7 | 7 | ||||||||||||||||||||||||
| Gross (loss) profit per pound of molybdenum: | ||||||||||||||||||||||||||
| Revenues, excluding adjustmentsa | $ | 20.71 | $ | 23.28 | ||||||||||||||||||||||
| Site production and delivery, before net noncash and other costs shown below | 18.53 | 15.13 | ||||||||||||||||||||||||
| Treatment charges and other | 0.88 | 0.86 | ||||||||||||||||||||||||
| Unit net cash costs | 19.41 | 15.99 | ||||||||||||||||||||||||
| DD&A | 2.30 | 2.01 | ||||||||||||||||||||||||
| Noncash and other costs, net | 0.71 | 0.59 | ||||||||||||||||||||||||
| Total unit costs | 22.42 | 18.59 | ||||||||||||||||||||||||
| Gross (loss) profit per pound | $ | (1.71) | $ | 4.69 | ||||||||||||||||||||||
| Reconciliation to Amounts Reported | ||||||||||||||||||||||||||
| Production | ||||||||||||||||||||||||||
| Three Months Ended June 30, 2024 | Revenues | and Delivery | DD&A | |||||||||||||||||||||||
| Totals presented above | $ | 144 | $ | 129 | $ | 16 | ||||||||||||||||||||
| Treatment charges and other | (6) | — | — | |||||||||||||||||||||||
| Noncash and other costs, net | — | 5 | — | |||||||||||||||||||||||
| Molybdenum mines | 138 | 134 | 16 | |||||||||||||||||||||||
| Other miningb | 7,919 | 5,234 | 476 | |||||||||||||||||||||||
| Corporate, other & eliminations | (1,433) | (1,493) | 17 | |||||||||||||||||||||||
| As reported in our consolidated financial statements | $ | 6,624 | $ | 3,875 | $ | 509 | ||||||||||||||||||||
| Three Months Ended June 30, 2023 | ||||||||||||||||||||||||||
| Totals presented above | $ | 156 | $ | 101 | $ | 14 | ||||||||||||||||||||
| Treatment charges and other | (6) | — | — | |||||||||||||||||||||||
| Noncash and other costs, net | — | 4 | — | |||||||||||||||||||||||
| Molybdenum mines | 150 | 105 | 14 | |||||||||||||||||||||||
| Other miningb | 7,196 | 5,001 | 514 | |||||||||||||||||||||||
| Corporate, other & eliminations | (1,609) | (1,557) | 19 | |||||||||||||||||||||||
| As reported in our consolidated financial statements | $ | 5,737 | $ | 3,549 | $ | 547 | ||||||||||||||||||||
a.Reflects sales of the Molybdenum mines’ production to our molybdenum sales company at market-based pricing. On a consolidated basis, realizations are based on the actual contract terms for sales to third parties; as a result, our consolidated average realized price per pound of molybdenum will differ from the amounts reported in this table.
b.Represents the combined total for our other segments as presented in Note 8. Also includes amounts associated with our molybdenum sales company, which includes sales of molybdenum produced by the Molybdenum mines and by certain of the North America copper mines and South America operations.
Molybdenum Mines Product Revenues, Production Costs and Unit Net Cash Costs
| Six Months Ended June 30, | ||||||||||||||||||||||||||
| (In millions) | 2024 | 2023 | ||||||||||||||||||||||||
| Revenues, excluding adjustmentsa | $ | 296 | $ | 386 | ||||||||||||||||||||||
| Site production and delivery, before net noncash and other costs shown below | 245 | 192 | ||||||||||||||||||||||||
| Treatment charges and other | 13 | 13 | ||||||||||||||||||||||||
| Net cash costs | 258 | 205 | ||||||||||||||||||||||||
| DD&A | 32 | 34 | ||||||||||||||||||||||||
| Noncash and other costs, net | 8 | 9 | ||||||||||||||||||||||||
| Total costs | 298 | 248 | ||||||||||||||||||||||||
| Gross (loss) profit | $ | (2) | $ | 138 | ||||||||||||||||||||||
| Molybdenum sales (millions of recoverable pounds)a | 15 | 15 | ||||||||||||||||||||||||
| Gross (loss) profit per pound of molybdenum: | ||||||||||||||||||||||||||
| Revenues, excluding adjustmentsa | $ | 20.05 | $ | 26.36 | ||||||||||||||||||||||
| Site production and delivery, before net noncash and other costs shown below | 16.63 | 13.10 | ||||||||||||||||||||||||
| Treatment charges and other | 0.87 | 0.85 | ||||||||||||||||||||||||
| Unit net cash costs | 17.50 | 13.95 | ||||||||||||||||||||||||
| DD&A | 2.19 | 2.32 | ||||||||||||||||||||||||
| Noncash and other costs, net | 0.51 | 0.64 | ||||||||||||||||||||||||
| Total unit costs | 20.20 | 16.91 | ||||||||||||||||||||||||
| Gross (loss) profit per pound | $ | (0.15) | $ | 9.45 | ||||||||||||||||||||||
| Reconciliation to Amounts Reported | ||||||||||||||||||||||||||
| Production | ||||||||||||||||||||||||||
| Six months ended June 30, 2024 | Revenues | and Delivery | DD&A | |||||||||||||||||||||||
| Totals presented above | $ | 296 | $ | 245 | $ | 32 | ||||||||||||||||||||
| Treatment charges and other | (13) | — | — | |||||||||||||||||||||||
| Noncash and other costs, net | — | 8 | — | |||||||||||||||||||||||
| Molybdenum mines | 283 | 253 | 32 | |||||||||||||||||||||||
| Other miningb | 15,554 | 10,229 | 1,039 | |||||||||||||||||||||||
| Corporate, other & eliminations | (2,892) | (2,763) | 33 | |||||||||||||||||||||||
| As reported in our consolidated financial statements | $ | 12,945 | $ | 7,719 | $ | 1,104 | ||||||||||||||||||||
| Six months ended June 30, 2023 | ||||||||||||||||||||||||||
| Totals presented above | $ | 386 | $ | 192 | $ | 34 | ||||||||||||||||||||
| Treatment charges and other | (13) | — | — | |||||||||||||||||||||||
| Noncash and other costs, net | — | 9 | — | |||||||||||||||||||||||
| Molybdenum mines | 373 | 201 | 34 | |||||||||||||||||||||||
| Other miningb | 13,955 | 9,569 | 880 | |||||||||||||||||||||||
| Corporate, other & eliminations | (3,202) | (3,056) | 32 | |||||||||||||||||||||||
| As reported in our consolidated financial statements | $ | 11,126 | $ | 6,714 | $ | 946 | ||||||||||||||||||||
a.Reflects sales of the Molybdenum mines’ production to our molybdenum sales company at market-based pricing. On a consolidated basis, realizations are based on the actual contract terms for sales to third parties; as a result, our consolidated average realized price per pound of molybdenum will differ from the amounts reported in this table.
b.Represents the combined total for our other segments as presented in Note 8. Also includes amounts associated with our molybdenum sales company, which includes sales of molybdenum produced by the Molybdenum mines and by certain of the North America and South America copper mines.
CAUTIONARY STATEMENT
Our discussion and analysis contains forward-looking statements in which we discuss our potential future performance, operations and projects. Forward-looking statements are all statements other than statements of historical facts, such as plans, projections, or expectations relating to business outlook, strategy, goals or targets; global market conditions; ore grades and milling rates; production and sales volumes; unit net cash costs (credits) and operating costs; capital expenditures; operating plans (including mine sequencing); cash flows; liquidity; PT-FI’s commissioning and ramp up of its new smelter and completion and full production at the PMR; potential extension of PT-FI’s IUPK beyond 2041; export licenses; export duties; export volumes; timing of shipments of inventoried production; our commitment to deliver responsibly produced copper and molybdenum, including plans to implement, validate and maintain validation of our operating sites under specific frameworks; execution of our energy and climate strategies and the underlying assumptions and estimated impacts on our business and stakeholders related thereto; achievement of 2030 climate targets and 2050 net zero aspiration; improvements in operating procedures and technology innovations and applications; exploration efforts and results; development and production activities, rates and costs; future organic growth opportunities; tax rates; the impact of copper, gold and molybdenum price changes; the impact of deferred intercompany profits on earnings; mineral reserve and mineral resource estimates; final resolution of settlements associated with ongoing legal and environmental proceedings; debt repurchases; and the ongoing implementation of our financial policy and future returns to shareholders, including dividend payments (base or variable) and share repurchases. The words “anticipates,” “may,” “can,” “plans,” “believes,” “estimates,” “expects,” “projects,” “targets,” “intends,” “likely,” “will,” “should,” “could,” “to be,” “potential,” “assumptions,” “guidance,” “aspirations,” “future,” “commitments,” “pursues,” “initiatives,” “objectives,” “opportunities,” “strategy” and any similar expressions are intended to identify those assertions as forward-looking statements. The declaration and payment of dividends (base or variable), and timing and amount of any share repurchases are at the discretion of our Board and management, respectively, and are subject to a number of factors, including not exceeding our net debt target, capital availability, our financial results, cash requirements, global economic conditions, changes in laws, contractual restrictions and other factors deemed relevant by our Board or management, as applicable. Our share repurchase program may be modified, increased, suspended or terminated at any time at the Board’s discretion.
We caution readers that forward-looking statements are not guarantees of future performance and actual results may differ materially from those anticipated, expected, projected or assumed in the forward-looking statements. Important factors that can cause our actual results to differ materially from those anticipated in the forward-looking statements include, but are not limited to, supply of and demand for, and prices of the commodities we produce, primarily copper; PT-FI’s ability to continue to export and sell copper concentrates and anode slimes through full ramp-up of its new downstream processing facilities; changes in export duties; achieving full ramp-up of new downstream processing facilities; completion and full production at the PMR; production rates; timing of shipments; price and availability of consumables and components we purchase as well as constraints on supply and logistics, and transportation services; changes in our cash requirements, financial position, financing or investment plans; changes in general market, economic, geopolitical, regulatory or industry conditions; reductions in liquidity and access to capital; changes in tax laws and regulations; political and social risks, including the potential effects of violence in Indonesia, civil unrest in Peru, and relations with local communities and Indigenous Peoples; operational risks inherent in mining, with higher inherent risks in underground mining; mine sequencing; changes in mine plans or operational modifications, delays, deferrals or cancellations, including the ability to smelt and refine; results of technical, economic or feasibility studies; potential inventory adjustments; potential impairment of long-lived mining assets; satisfaction of requirements in accordance with PT-FI's IUPK to extend mining rights from 2031 through 2041; process relating to the extension of PT-FI’s IUPK beyond 2041; cybersecurity risks; any major public health crisis; labor relations, including labor-related work stoppages and increased costs; compliance with applicable environmental, health and safety laws and regulations; weather- and climate-related risks; environmental risks, including availability of secure water supplies; litigation results; tailings management; our ability to comply with our responsible production commitments under specific frameworks and any changes to such frameworks and other factors described in more detail under the heading “Risk Factors” contained in Part I, Item 1A. of our 2023 Form 10-K.
Investors are cautioned that many of the assumptions upon which our forward-looking statements are based are likely to change after the date the forward-looking statements are made, including for example commodity prices, which we cannot control, and production volumes and costs or technological solutions and innovations, some aspects of which we may not be able to control. Further, we may make changes to our business plans that could affect our results. We undertake no obligation to update any forward-looking statements, which speak only as of the
date made, notwithstanding any changes in our assumptions, changes in business plans, actual experience or other changes.
This report on Form 10-Q also contains measures such as net debt and unit net cash costs (credits) per pound of copper and molybdenum, which are not recognized under U.S. GAAP. Refer to “Operations – Unit Net Cash Costs” and “Operations – Unit Net Cash (Credits) Costs” for further discussion of unit net cash costs (credits) associated with our operating divisions, and to “Product Revenues and Production Costs” for reconciliations of per pound costs (credits) by operating division to production and delivery costs applicable to sales reported in our consolidated financial statements. Refer to “Net Debt” for reconciliations of consolidated debt, consolidated cash and cash equivalents, and current restricted cash associated with PT-FI’s export proceeds to net debt. For forward-looking unit net cash costs (credits) per pound of copper and molybdenum measures, we are unable to provide a reconciliation to the most comparable GAAP measure without unreasonable effort because estimating such GAAP measures and providing a meaningful reconciliation is extremely difficult and requires a level of precision that is unavailable for these future periods and the information needed to reconcile these measures is dependent upon future events, many of which are outside of our control as described above. Forward-looking non-GAAP measures are estimated consistent with the relevant definitions and assumptions.
Previous: Item 1. Financial Statements. · Next: Item 3. Quantitative and Qualitative Disclosures About Market Risk.